 Shuo Li1,2†
 Zhiguo Li3†
 Hongbo Du1,2
 Xiaobin Zao1,2Da’nan Gan1,2Xianzhao Yang1,2
 Xiaoke Li1,2*Yufeng Xing4*
 Yong’an Ye1,2*
- 1Department of Gastroenterology, Dongzhimen Hospital, Beijing University of Chinese Medicine, Beijing, China
- 2Institute of Liver Diseases, Beijing University of Chinese Medicine, Beijing, China
- 3Department of Gastroenterology, Beijing Fengtai Hospital of Integrated Traditional and Western Medicine, Beijing, China
- 4Department of Hepatology, Shenzhen Traditional Chinese Medicine Hospital, Shenzhen, China
Background and aims: Patients with chronic hepatitis B (CHB) in the immune tolerant (IT) phase were previously thought to have no or slight inflammation or fibrosis in the liver. In fact, some CHB patients with normal ALT levels still experience liver fibrosis. This study aimed to develop and validate a non-invasive model for identifying pseudo-immune tolerance (pseudo-IT) of CHB by predicting significant liver fibrosis.
Methods: This multi-center study enrolled a total of 445 IT-phase patients who had undergone liver biopsy for the training cohort (n = 289) and validation cohort (n = 156) during different time periods. A risk model (IT-3) for predicting significant liver fibrosis (Ishak score ≥ 3) was developed using high-risk factors which were identified using multivariate stepwise logistic regression. Next, an online dynamic nomogram was created for the clinical usage. The receiver operating characteristic (ROC) curve, net reclassification improvement and integrated discrimination improvement were used to assess the discrimination of the IT-3 model. Calibration curves were used to evaluate the models’ calibration. The clinical practicability of the model was evaluated using decision curve analysis and clinical impact curves.
Results: 8.8% (39 of 445) patients presented with significant liver fibrosis in this study. Aspartate aminotransferase (AST), hepatitis B e-antigen (HBeAg), and platelet (PLT) were included in the prediction model (IT-3). The IT-3 model showed good calibration and discrimination both in the training and validation cohorts (AUC = 0.888 and 0.833, respectively). The continuous NRI and IDI showed that the IT-3 model had better predictive accuracy than GPR, APRI, and FIB-4 (p < 0.001). Decision curve analysis and clinical impact curves were used to demonstrate the clinical usefulness. At a cut-off value of 106 points, the sensitivity and specificity were 91.7 and 70.2%, respectively.
Conclusion: The IT-3 model proved an accurate non-invasive method in identifying pseudo-IT of CHB, which can help to formulate more appropriate treatment strategies.
Introduction
Hepatitis B virus (HBV) infection is a serious public health problem worldwide which affects approximately 240 million individuals (1, 2). It is estimated that there are more than 50 million people in the immune tolerant (IT) phase. Previous studies (3–6) thought that IT-phase patients had slow disease progression due to little inflammation or fibrosis in liver. IT-phase patients still had poor rates of seroconversion after receiving antiviral therapy, and they were more likely to develop treatment resistance (7). Therefore, most international clinical guidelines (8–10) recommend that treatment in the IT phase be primarily based on regular monitoring instead of using nucleoside analogs or interferons. However, progression of the disease was observed in IT-phase patients during long-term follow-up, eventually resulting in cirrhosis, liver cancer, and other adverse outcomes (11). The definition of the IT phase was usually based on three main criteria: the serum HBV DNA level, the serum ALT level and the histological features of the liver. In fact, the levels of ALT were not fully representative of the extent of liver damage. Several studies (12, 13) showed that a proportion of HBeAg-positive patients with normal ALT levels actually had significant liver inflammation and fibrosis. The normal ALT levels were most likely just a false appearance of immune tolerance, as significant liver fibrosis suggested that immune responses had already occurred.
Additionally, the definition and management of IT-phase patients were not completely consistent in the clinical guidelines published by the EASL (8), AASLD (9), and APASL (10). The main differences were reflected in age, the ULN of ALT, and HBV DNA load. These differences made clinical stage and treatment ambiguous and might lead to inappropriate treatment for a certain group of patients. In order to provide accurate and individualized treatments, it was essential to identify pseudo-immune tolerance (pseudo-IT) patients from those with normal ALT. Due to the dynamic reciprocal process between immune tolerance and immune clearance, patients are at risk of developing liver fibrosis during the progression of CHB, even if they were previously diagnosed as immune tolerant. However, these patients were frequently neglected for treatment due to normal ALT levels. Histological evidence of liver is a breakthrough in identifying the pseudo-immune tolerance. Although liver biopsy was the gold standard for determining liver histology, it was impractical to use it on a regular basis because of its invasiveness. There is an urgent clinical need for a non-invasive diagnostic method to assess liver fibrosis in IT-phase patients.
In this study, we explored risk factors for liver fibrosis and developed a non-invasive nomogram model for identifying pseudo-IT of CHB from a large retrospective, biopsy-based, multi-center cohort study.
Methods
Study design
The patients were screened from 18 medical centers in different areas of China (Supplementary Table S1). We followed the TRIPOD guideline (14) (transparent reporting of a multivariable prediction model for individual prognosis or diagnosis) for training, validation and reporting of the proposed nomogram. This study was approved by the Ethics Committees of the Dongzhimen Hospital, Beijing University of Chinese Medicine. Written informed consent was provided by all patients.
Patients
The following inclusion criteria were listed (8–10) (1) positive serum HBeAg; (2) HBsAg present for ≥6 months; (3) HBV DNA > 106 IU/mL; (4) age > 18 years old; (5) persistently ALT <40 U/L at least 3 times in 12 months. Exclusion criteria included the following: (1) presence of other etiologies of liver diseases (e.g., viral coinfection, autoimmune hepatitis, alcoholic liver disease, nonalcoholic fatty liver disease); (2) taking antiviral drugs 6 months before enrollment; (3) liver cirrhosis or carcinoma; (4) patients with systemic diseases affecting the liver (e.g., HIV infection, heart failure, or thyroid).
A total of 670 eligible patients were retrospectively screened for this study. According to the exclusion criteria, 225 (33.6%) patients were excluded. 289 patients were in the training cohort (from May 2009 to May 2016), whereas the validation cohort included 156 patients (from May 2016 to May 2019) (Figure 1).
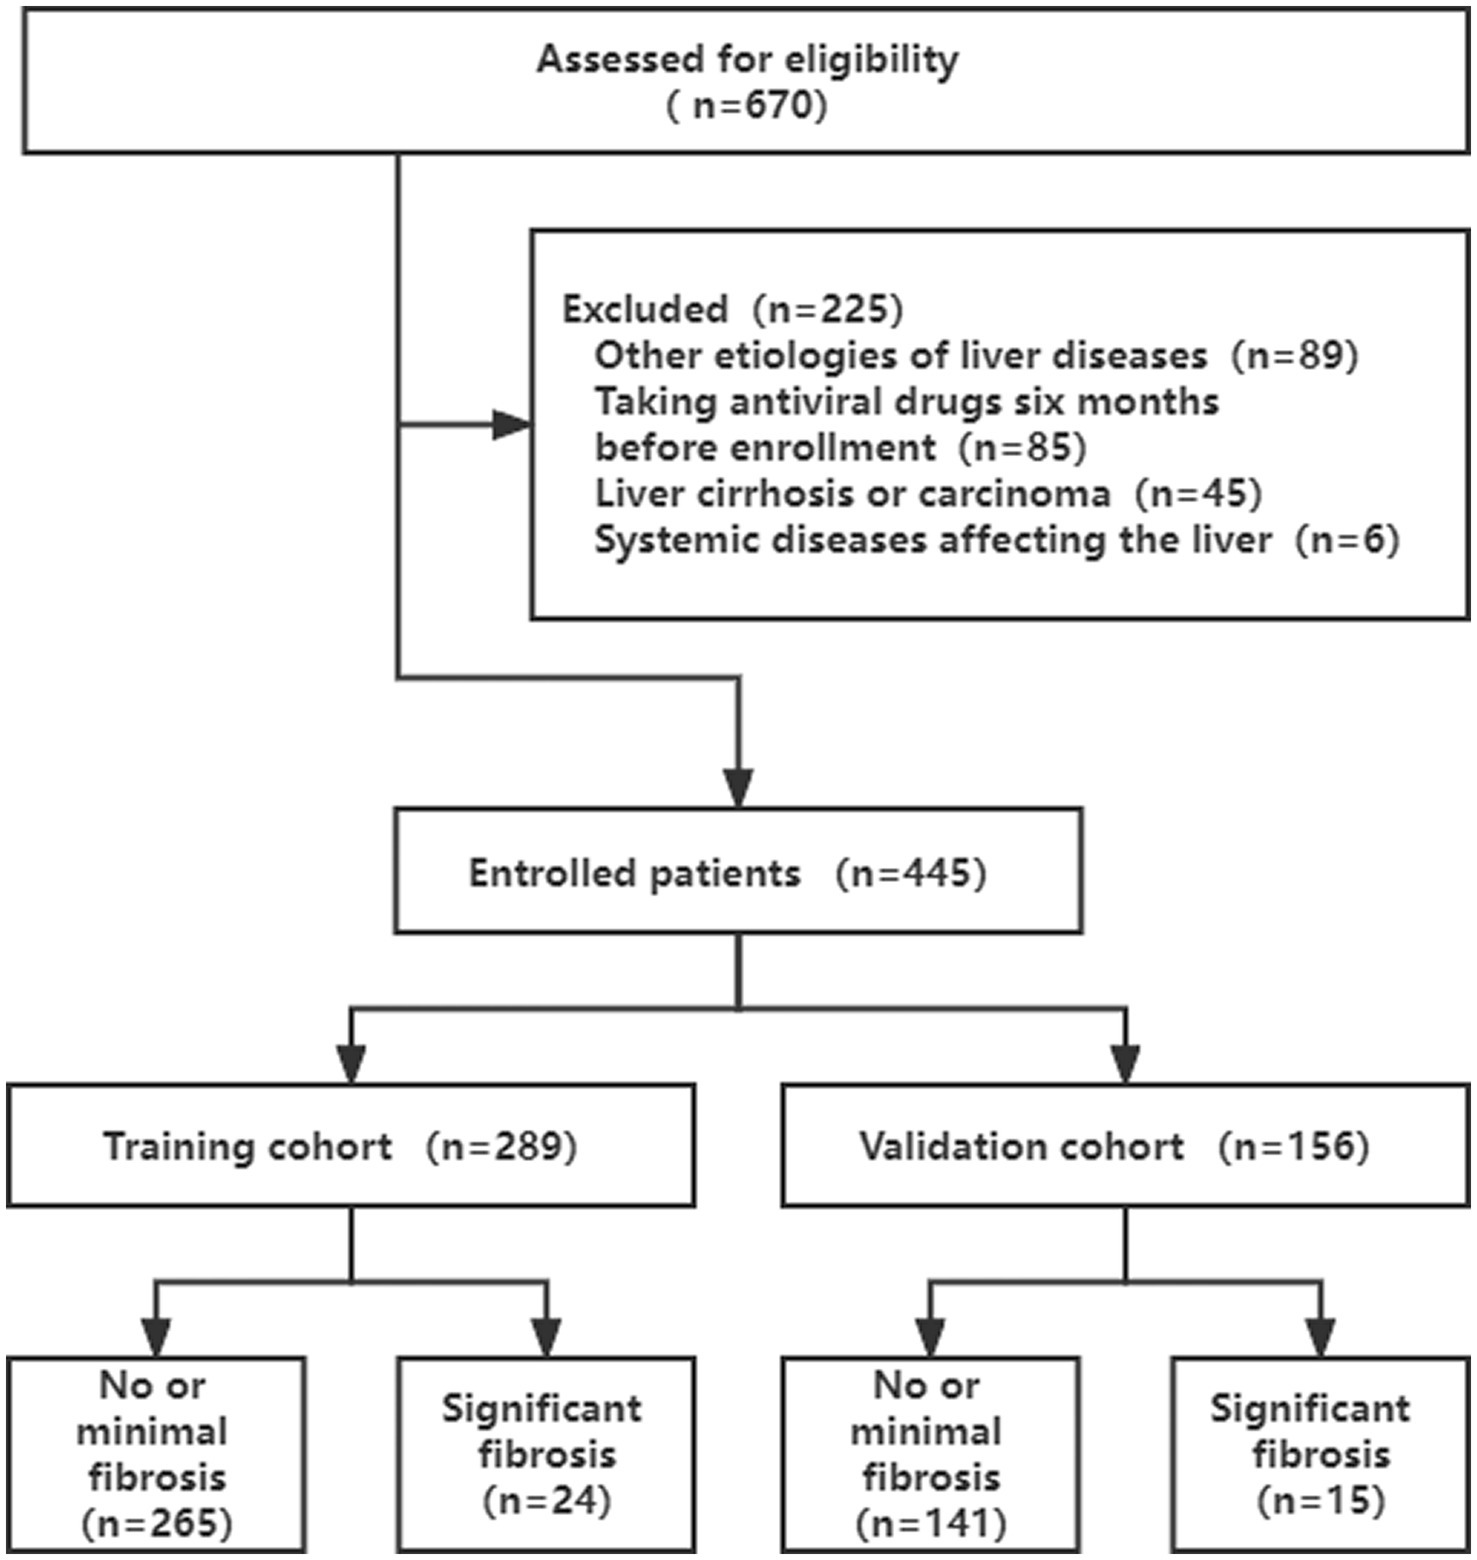
Figure 1. Flow chart presenting the study subjects.
Definition
Assessment of liver fibrosis using the Ishak’s system (15). The fibrosis stage was graded from stage 0–6. Stage 0–2 indicated no or minimal liver fibrosis, and stage 3–6 indicated significant liver fibrosis.
Collection of clinical and pathological data
We collected baseline clinical and pathological data of 445 patients, including age, gender, body mass index (BMI), histological assessment, blood routine, hepatic and renal function, serological markers of HBV, and HBV DNA load from their electronic medical records.
The formula for calculating aspartate aminotransferase to platelet ratio index (APRI) (16), fibrosis index based on the four factors (FIB-4) (17) and gamma-glutamyl transpeptidase to platelet ratio (GPR) (18) was as previously described:
Histological assessment
Ultrasound-guided percutaneous liver biopsies were performed in all enrolled patients using 16-G tru-cut biopsy needles (Menghini, Bard Company of America). Following formalin fixation and paraffin embedding, the samples were stained with hematoxylin–eosin and reticular fibers. Two experienced pathologists assessed the samples while concealing the clinical information of participants. The stage of fibrosis was determined using the Ishak fibrosis score (IFS) (15) and hepatic inflammation was assessed using the modified Ishak histologic activity index (HAI) (19).
Statistical analyses
Data analyses were performed using SPSS (version 26.0, IBM, NY) and R (version 4.2.0, Vienna, Austria). A two-tailed p < 0.05 was considered statistically significant. Continuous variables were compared using the Student t-test (normal distribution) and Mann–Whitney U test (skewed distribution), which were presented as mean ± standard deviation and median (interquartile range, IQR), respectively. Categorical variables were presented as number (percentage) and compared by the chi-square test or Fisher’s exact test. The high-risk factors for significant fibrosis were determined through univariate and multivariate logistic regression. The variables with a value of p < 0.05 in univariate analysis were subsequently selected and entered into multivariable logistic regression with the backward stepwise method (threshold = 0.1).
The nomogram was constructed based on proportionally converting each regression coefficient in multivariate logistic regression to a 0-to-100-point scale by using the “regplot” package in R. The area under the receiver operating characteristic curves (AUC) were used to assess the discrimination of nomogram. The continuous net reclassification improvement (NRI) and integrated discrimination improvement (IDI) were computed in order to evaluate the improvement and applicability of the new model in reclassification. Confidence intervals for NRI and IDI were generated with the bootstrap method with 1,000 replications. The calibration curve was used to evaluate the predictive performance of the model. A 1000-time bootstrap resampling was used to assess the stability of the model. Decision curve analysis (DCA) and clinical impact curve (CIC) analysis were used to assess the clinical utility of the models.
Results
Baseline characteristics
As shown in Table 1, a total of 445 patients were enrolled in the current study. The median age of participants was 32 years (IQR = 30–37), and 62.9% (280 of 445) were male. All the patients were divided into two sets, with 289 patients (64.9%) assigned to the training cohort and 156 patients (35.1%) assigned to the validation cohort, according to different enrollment periods. Among them, 39 patients (8.8%) showed significant liver fibrosis (IFS score ≥ 3). All the baseline characteristics were not statistically different between the training and validation cohorts (p > 0.05).
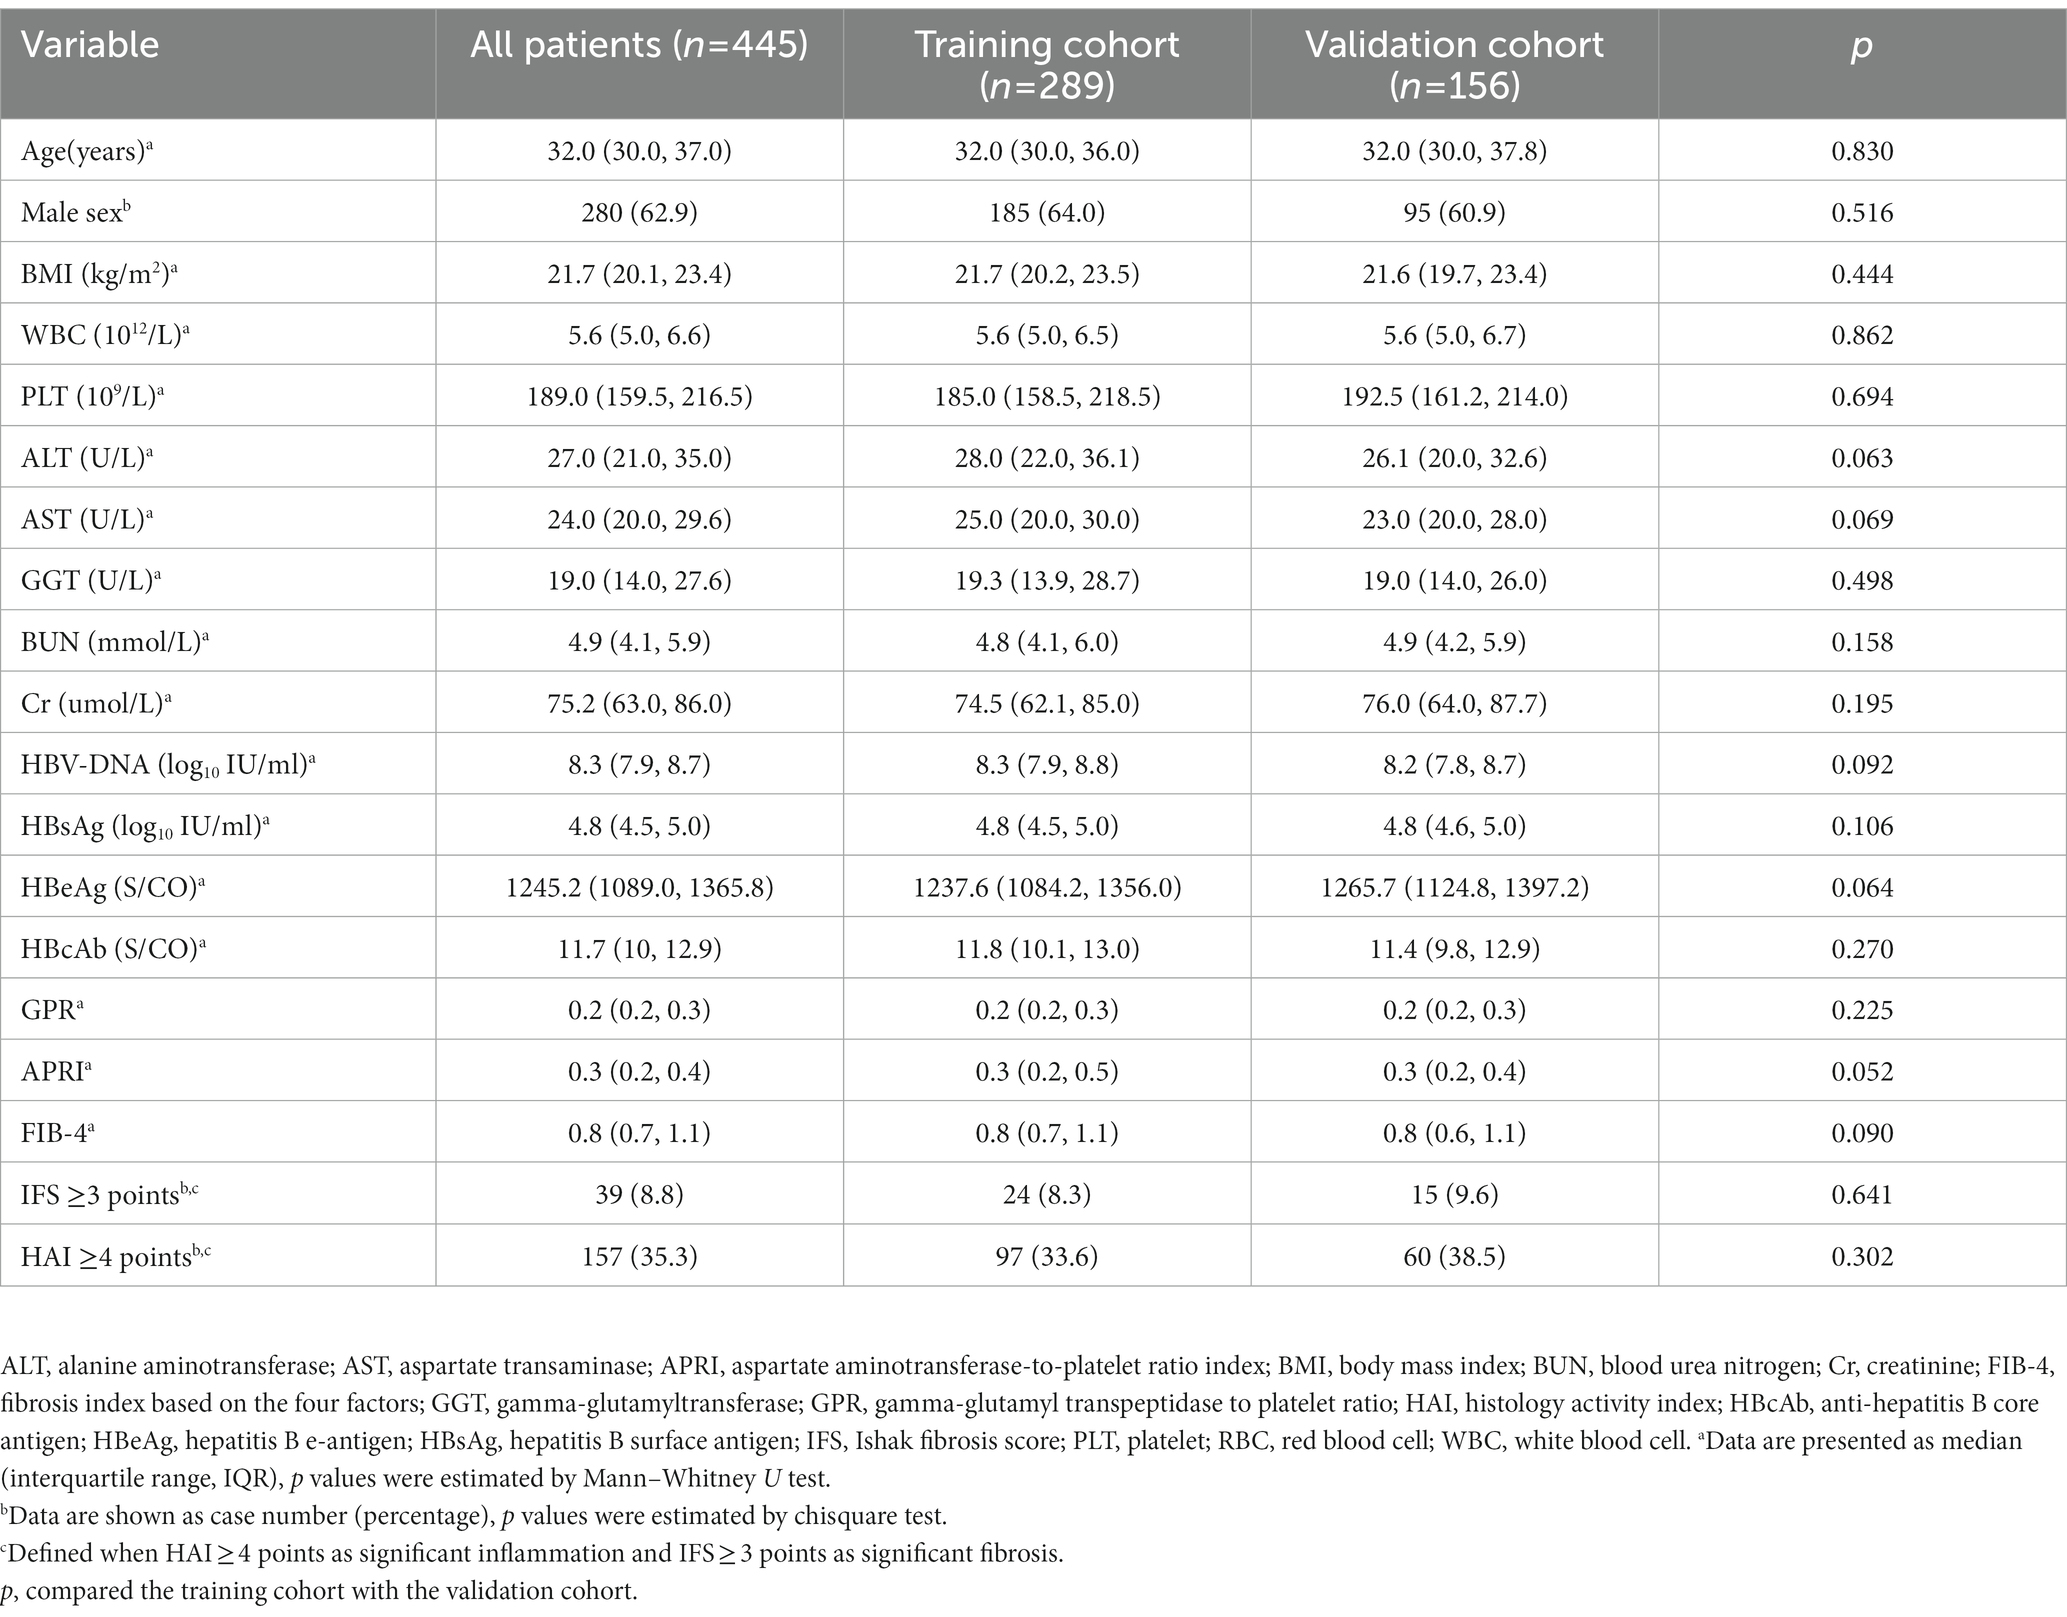
Table 1. Baseline characteristics of patients in the training and validation cohorts.
Univariate and multivariate logistic regression analyses
Univariate and multivariate logistic regression analyses were performed to confirm the potential predictors in the training cohort (Table 2 and Supplementary Figure S1). Based on the results of stepwise regression, three predictors were finally identified: PLT (OR, 0.990; 95% CI, 0.980–1.001; p = 0.084), AST (OR, 1.084; 95% CI, 1.010–1.164; p = 0.025) and HBeAg (OR, 0.997; 95% CI, 0.996, 0.998; p < 0.001).
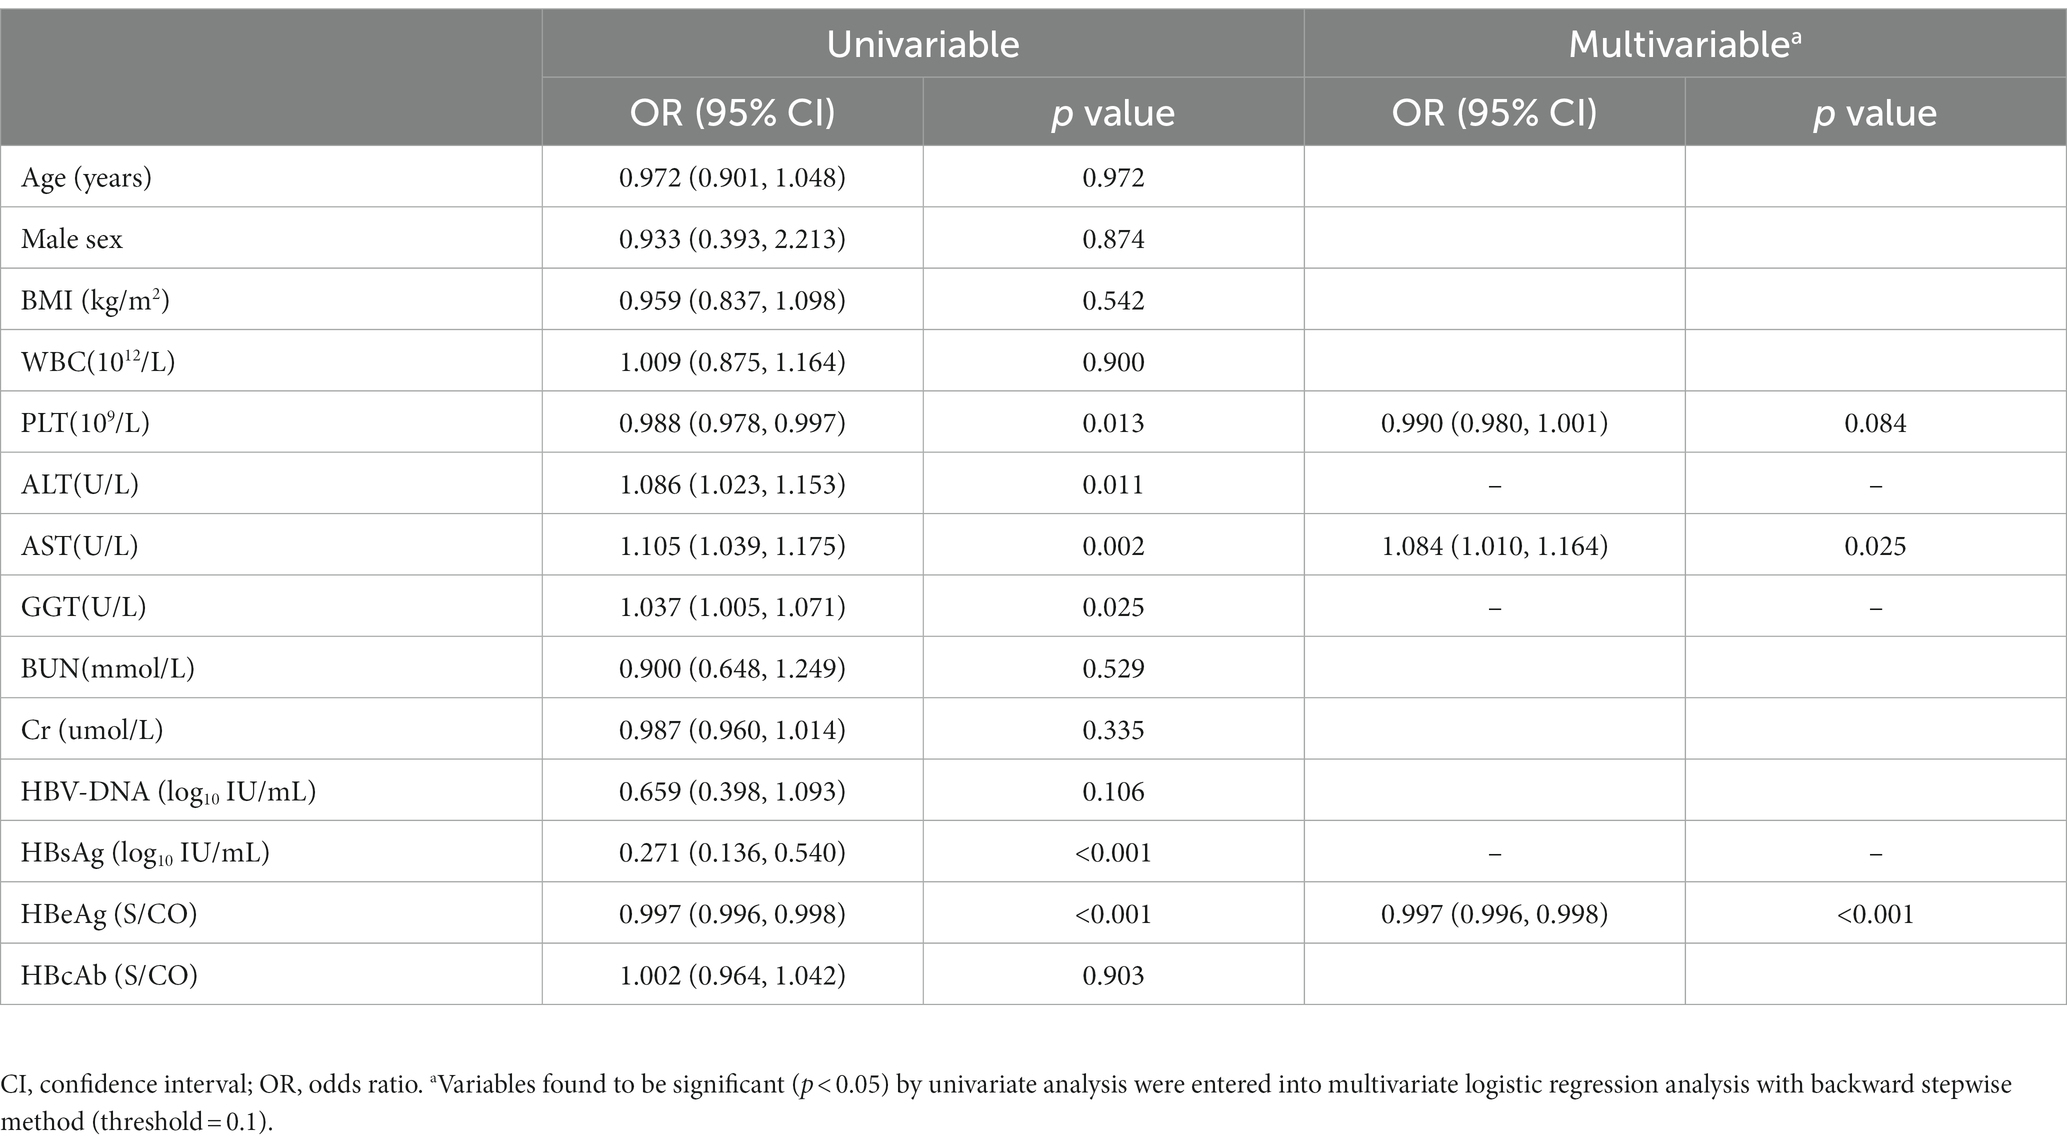
Table 2. Univariable and multivariable analysis in the training cohort.
Nonivasive nomogram development
Based on the logistic stepwise regression analysis, a nomogram was developed to predict the significant liver fibrosis for IT-phase patients and was named the IT-3 model (Figure 2). A total score was calculated by summing all predictors scores. The higher score suggests a higher risk of significant liver fibrosis. In addition, we created an online dynamic nomogram (Supplementary Figure S2).1
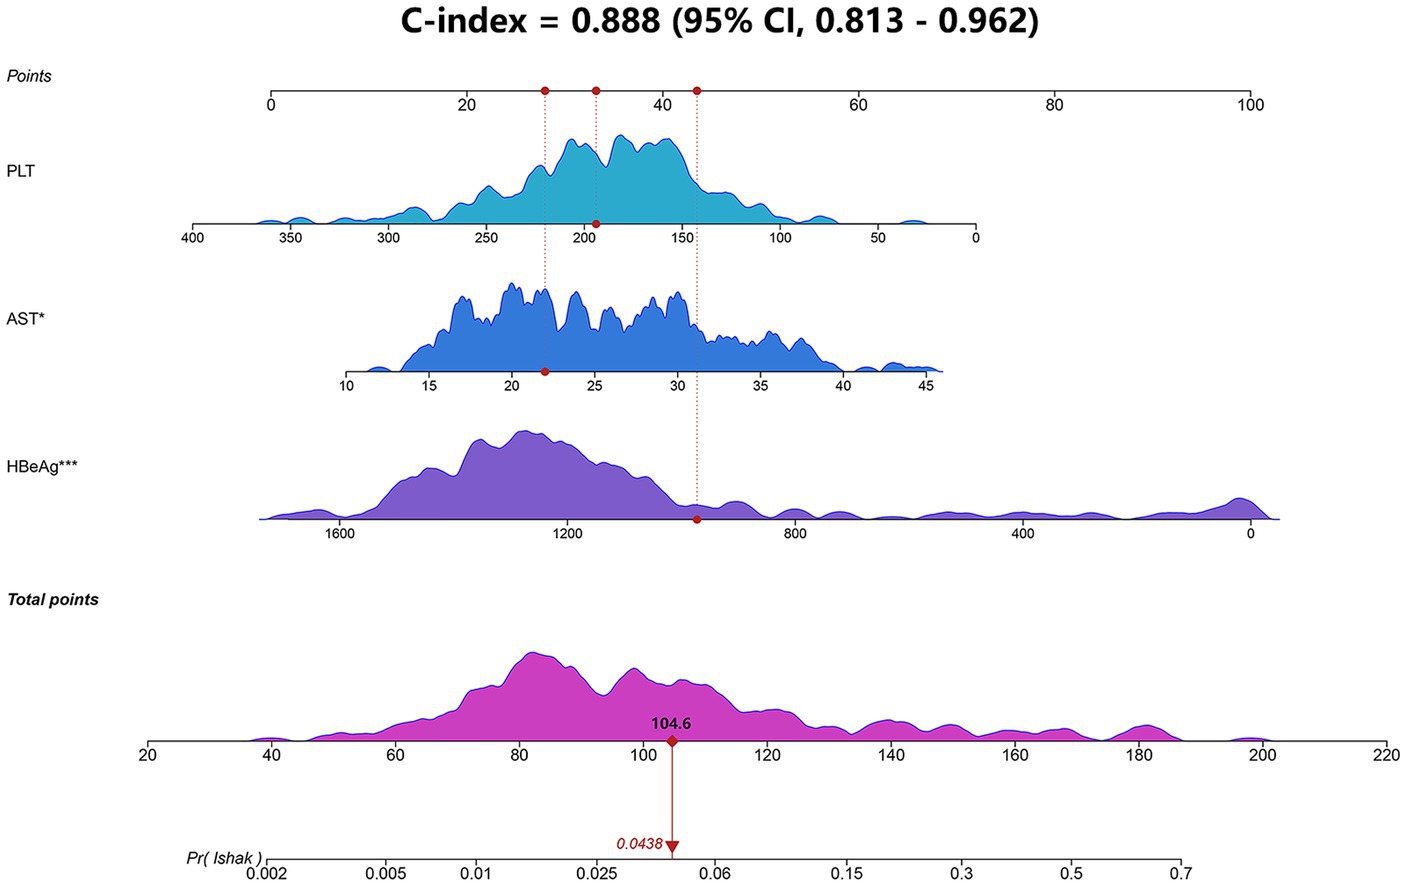
Figure 2. Nomogram (IT-3) for predicting liver fibrosis in IT-phase patients. The IT-3 model was developed using the training cohort and discrimination was evaluated by concordance index (Cindex). AST, aspartate transaminase; HBeAg, hepatitis B e-antigen; PLT, platelet.
IT-3 model evaluation
We evaluated the IT-3 model through discrimination, calibration, and clinical decision benefit. In the training cohort, IT-3 had a higher AUROC [0.888 (0.813–0.962)] than GPR [0.731 (0.641–0.821), p = 0.007], APRI [0.74 (0.646–0.834), p = 0.001], and FIB-4 [0.645 (0.546–0.743), p < 0.001]. In the validation cohort, IT-3 had a higher AUROC [0.833 (0.695–0.970)] than GPR [0.731 (0.641–0.821), p = 0.147], APRI [0.616 (0.453–0.779), p = 0.009], and FIB-4 [0.631 (0.484–0.777), p = 0.050] (Table 3 and Figure 3A). The continuous NRI and IDI showed that the IT-3 model had better predictive accuracy than GPR, APRI, and FIB-4 (p < 0.001, Table 3). Using a cutoff value of 106 points, the sensitivity was 91.7% and the specificity was 70.2% in the training cohort. In the validation cohort, the sensitivity was 80.0%, and the specificity was 83.0%. The IT-3 model was validated in the 1,000-time bootstrap resampling with an AUC of 0.888 (95% CI 0.810–0.947) in the training cohort and 0.833 (95% CI 0.687–0.950) in the validation cohort. The IT-3 model also showed good accuracy after 1,000-time bootstrap resampling (Table 4).
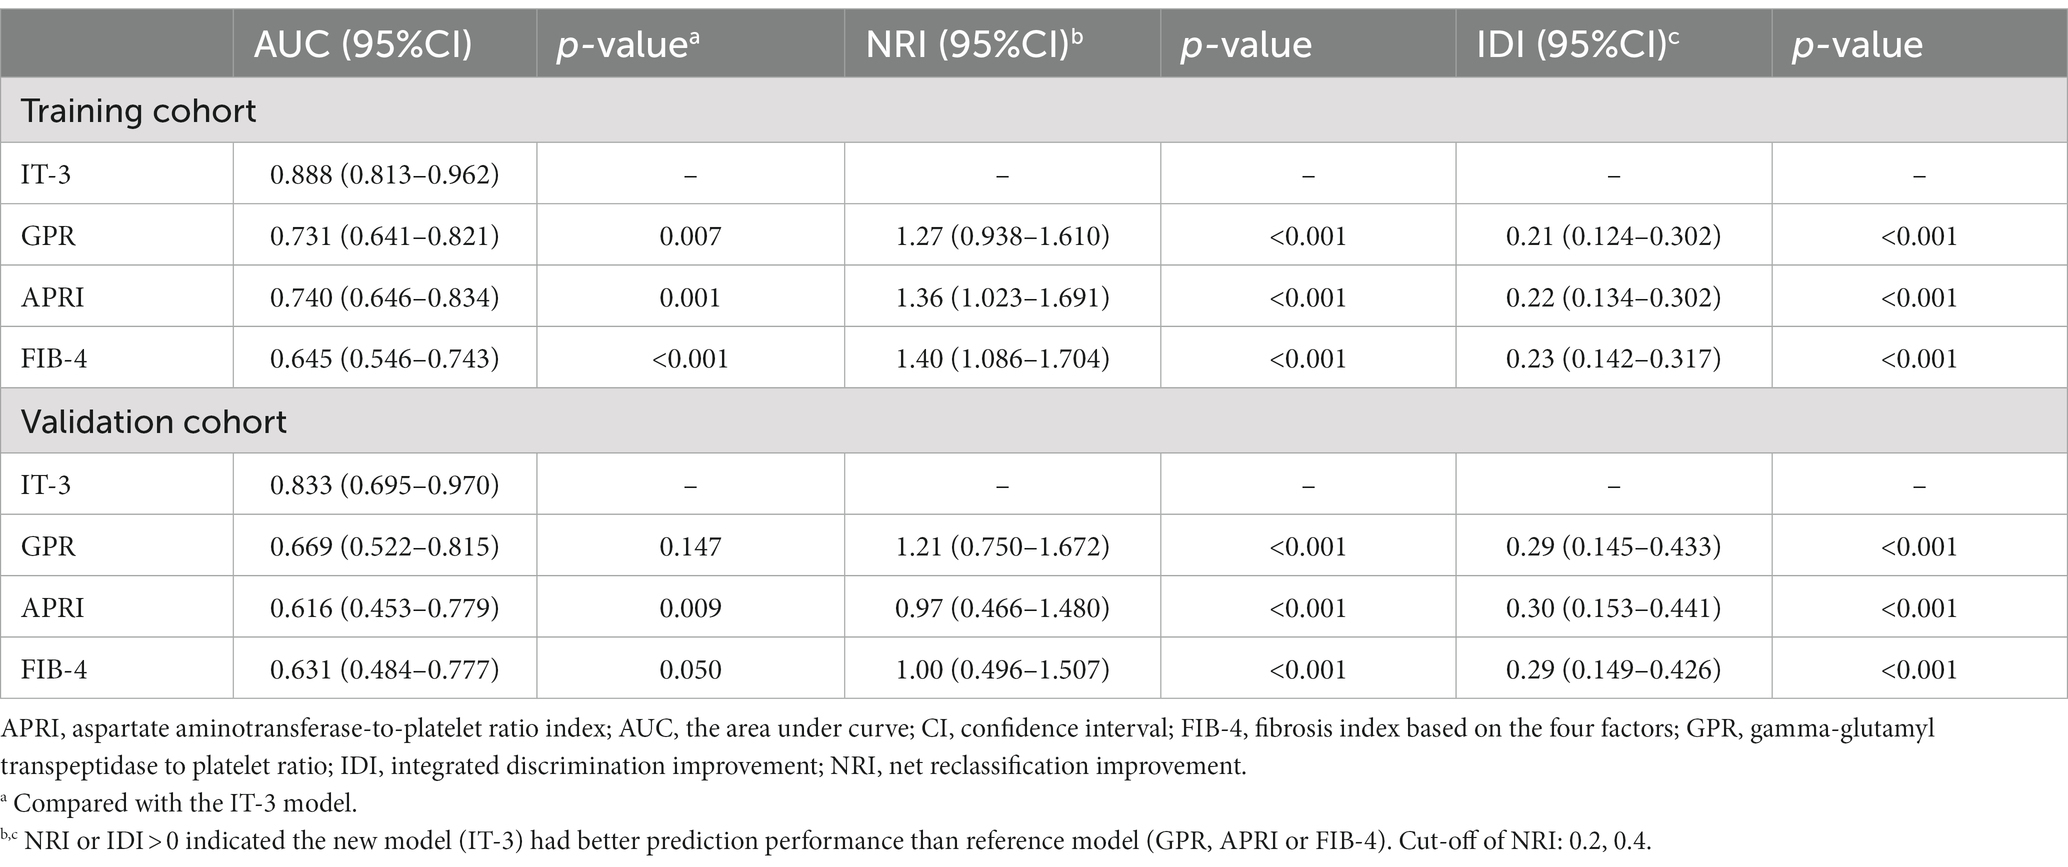
Table 3. Discrimination of the IT-3 model and other non-invasive models.
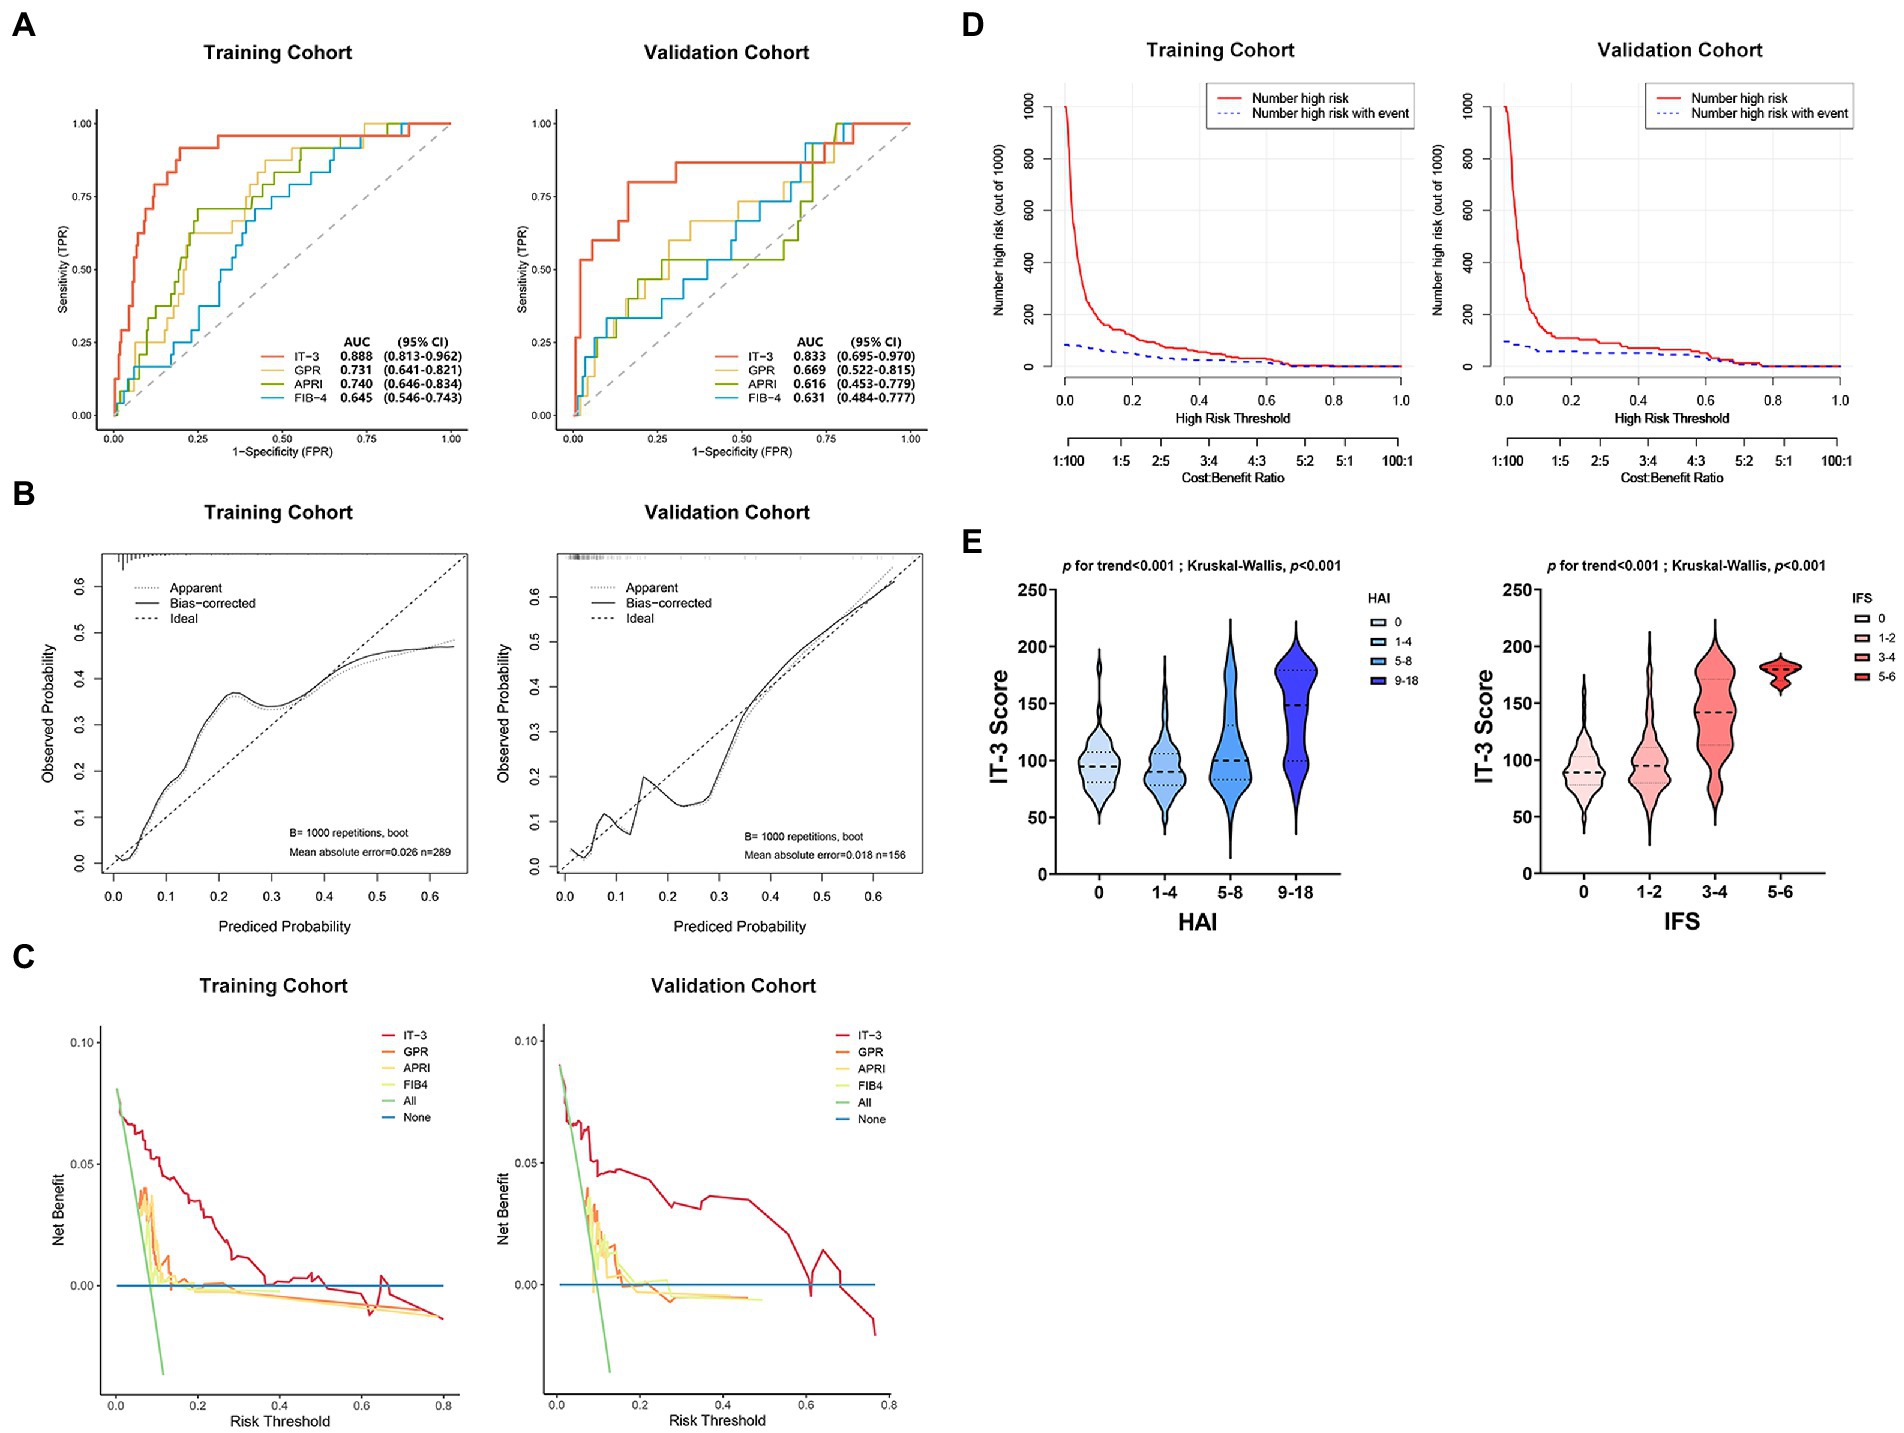
Figure 3. The IT-3 model performance evaluation. (A) Comparison of the area under the curve (AUC) between the IT-3 model and other nonivasive models. (B) Calibration curves. (C) Comparison of the decision curve analysis between the IT-3 model and other nonivasive models. (D) Clinical impact curves. (E) Relationship between IT-3 scores and liver pathology. APRI, aspartate aminotransferaseto-platelet ratio index; AUC, the area under the curve; FIB-4, fibrosis index based on the four factors; GPR, gamma-glutamyl transpeptidase to platelet ratio; HAI, histology activity index; IFS, Ishak fibrosis score.
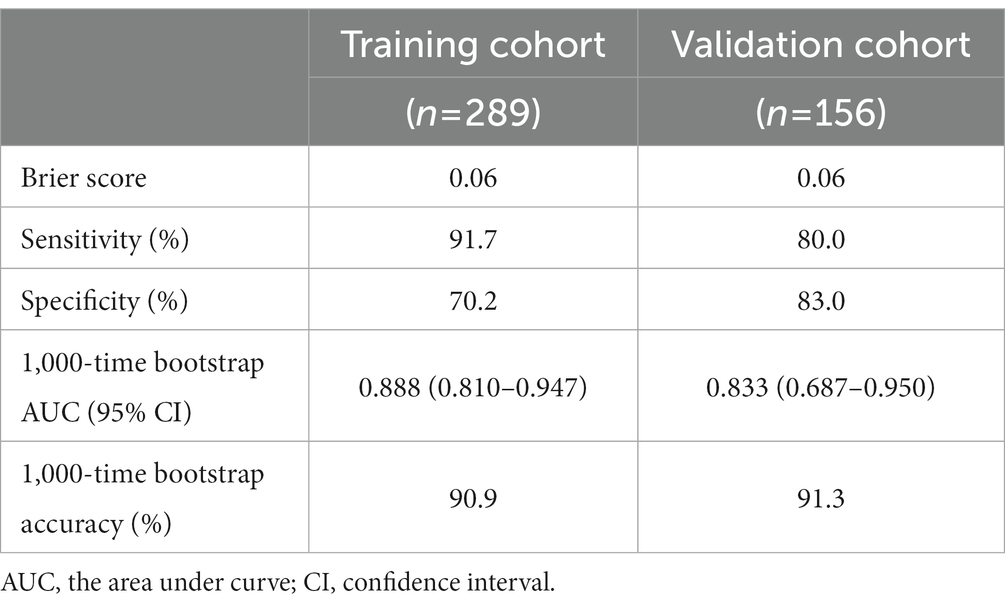
Table 4. Performance and stability of the IT-3 model.
The calibration curve showed good agreement between the predicted and observed probabilities in the training and validation cohorts (brier score was 0.06 and 0.06, respectively) (Figure 3B and Table 3). The DCA of the IT-3 model demonstrated a greater net benefit with a wider range of threshold than the other non-invasive models in the training and validation cohorts (Figure 3C). The results of the clinical impact curves showed that the IT-3 model predictions had better agreement with the true positive rates. As the risk threshold increased, there was a decrease in unnecessary treatment and an increase in net clinical benefit (Figure 3D). The risk scores of patients were evaluated based on the IT-3 model were significantly correlated with the extent of liver inflammation or fibrosis (p < 0.001) (Figure 3E).
Relationship between serological indicators and liver fibrosis and inflammation
According to the stage of liver fibrosis, patients were divided into different groups (IFS 0, 41.8%; IFS 1–2, 49.4%; IFS 3–4, 7.9%; IFS 5–6, 0.9%). A strong association was noted between serological indicators and the extent of fibrosis (Figure 4A). Significant fibrosis was associated with increasing levels of ALT (p for trend<0.001; K-W test p < 0.001) and AST (p for trend<0.001; K-W test p < 0.001), although the levels of transaminase were within the normal range. Significant fibrosis was associated with decreasing levels of HBsAg (p for trend <0.001; K-W test p < 0.001), HBeAg (p for trend <0.001; K-W test p < 0.001) and HBV-DNA (p for trend<0.001; K-W test p = 0.002). There was a similar trend when patients were grouped by liver inflammatory activity (HAI 0, 11.2%; HAI 1–4, 60.0%; HAI 5–8, 24.5%; HAI 9–18, 4.3%), although no statistically significant differences were observed in HBV DNA (Figure 4B). Then, patients were stratified according to different levels of virological indicators and found that both HAI and IFS tended to decrease as the virological indicators increased (p for trend <0.001; K-W test p < 0.001) (Figure 4C).
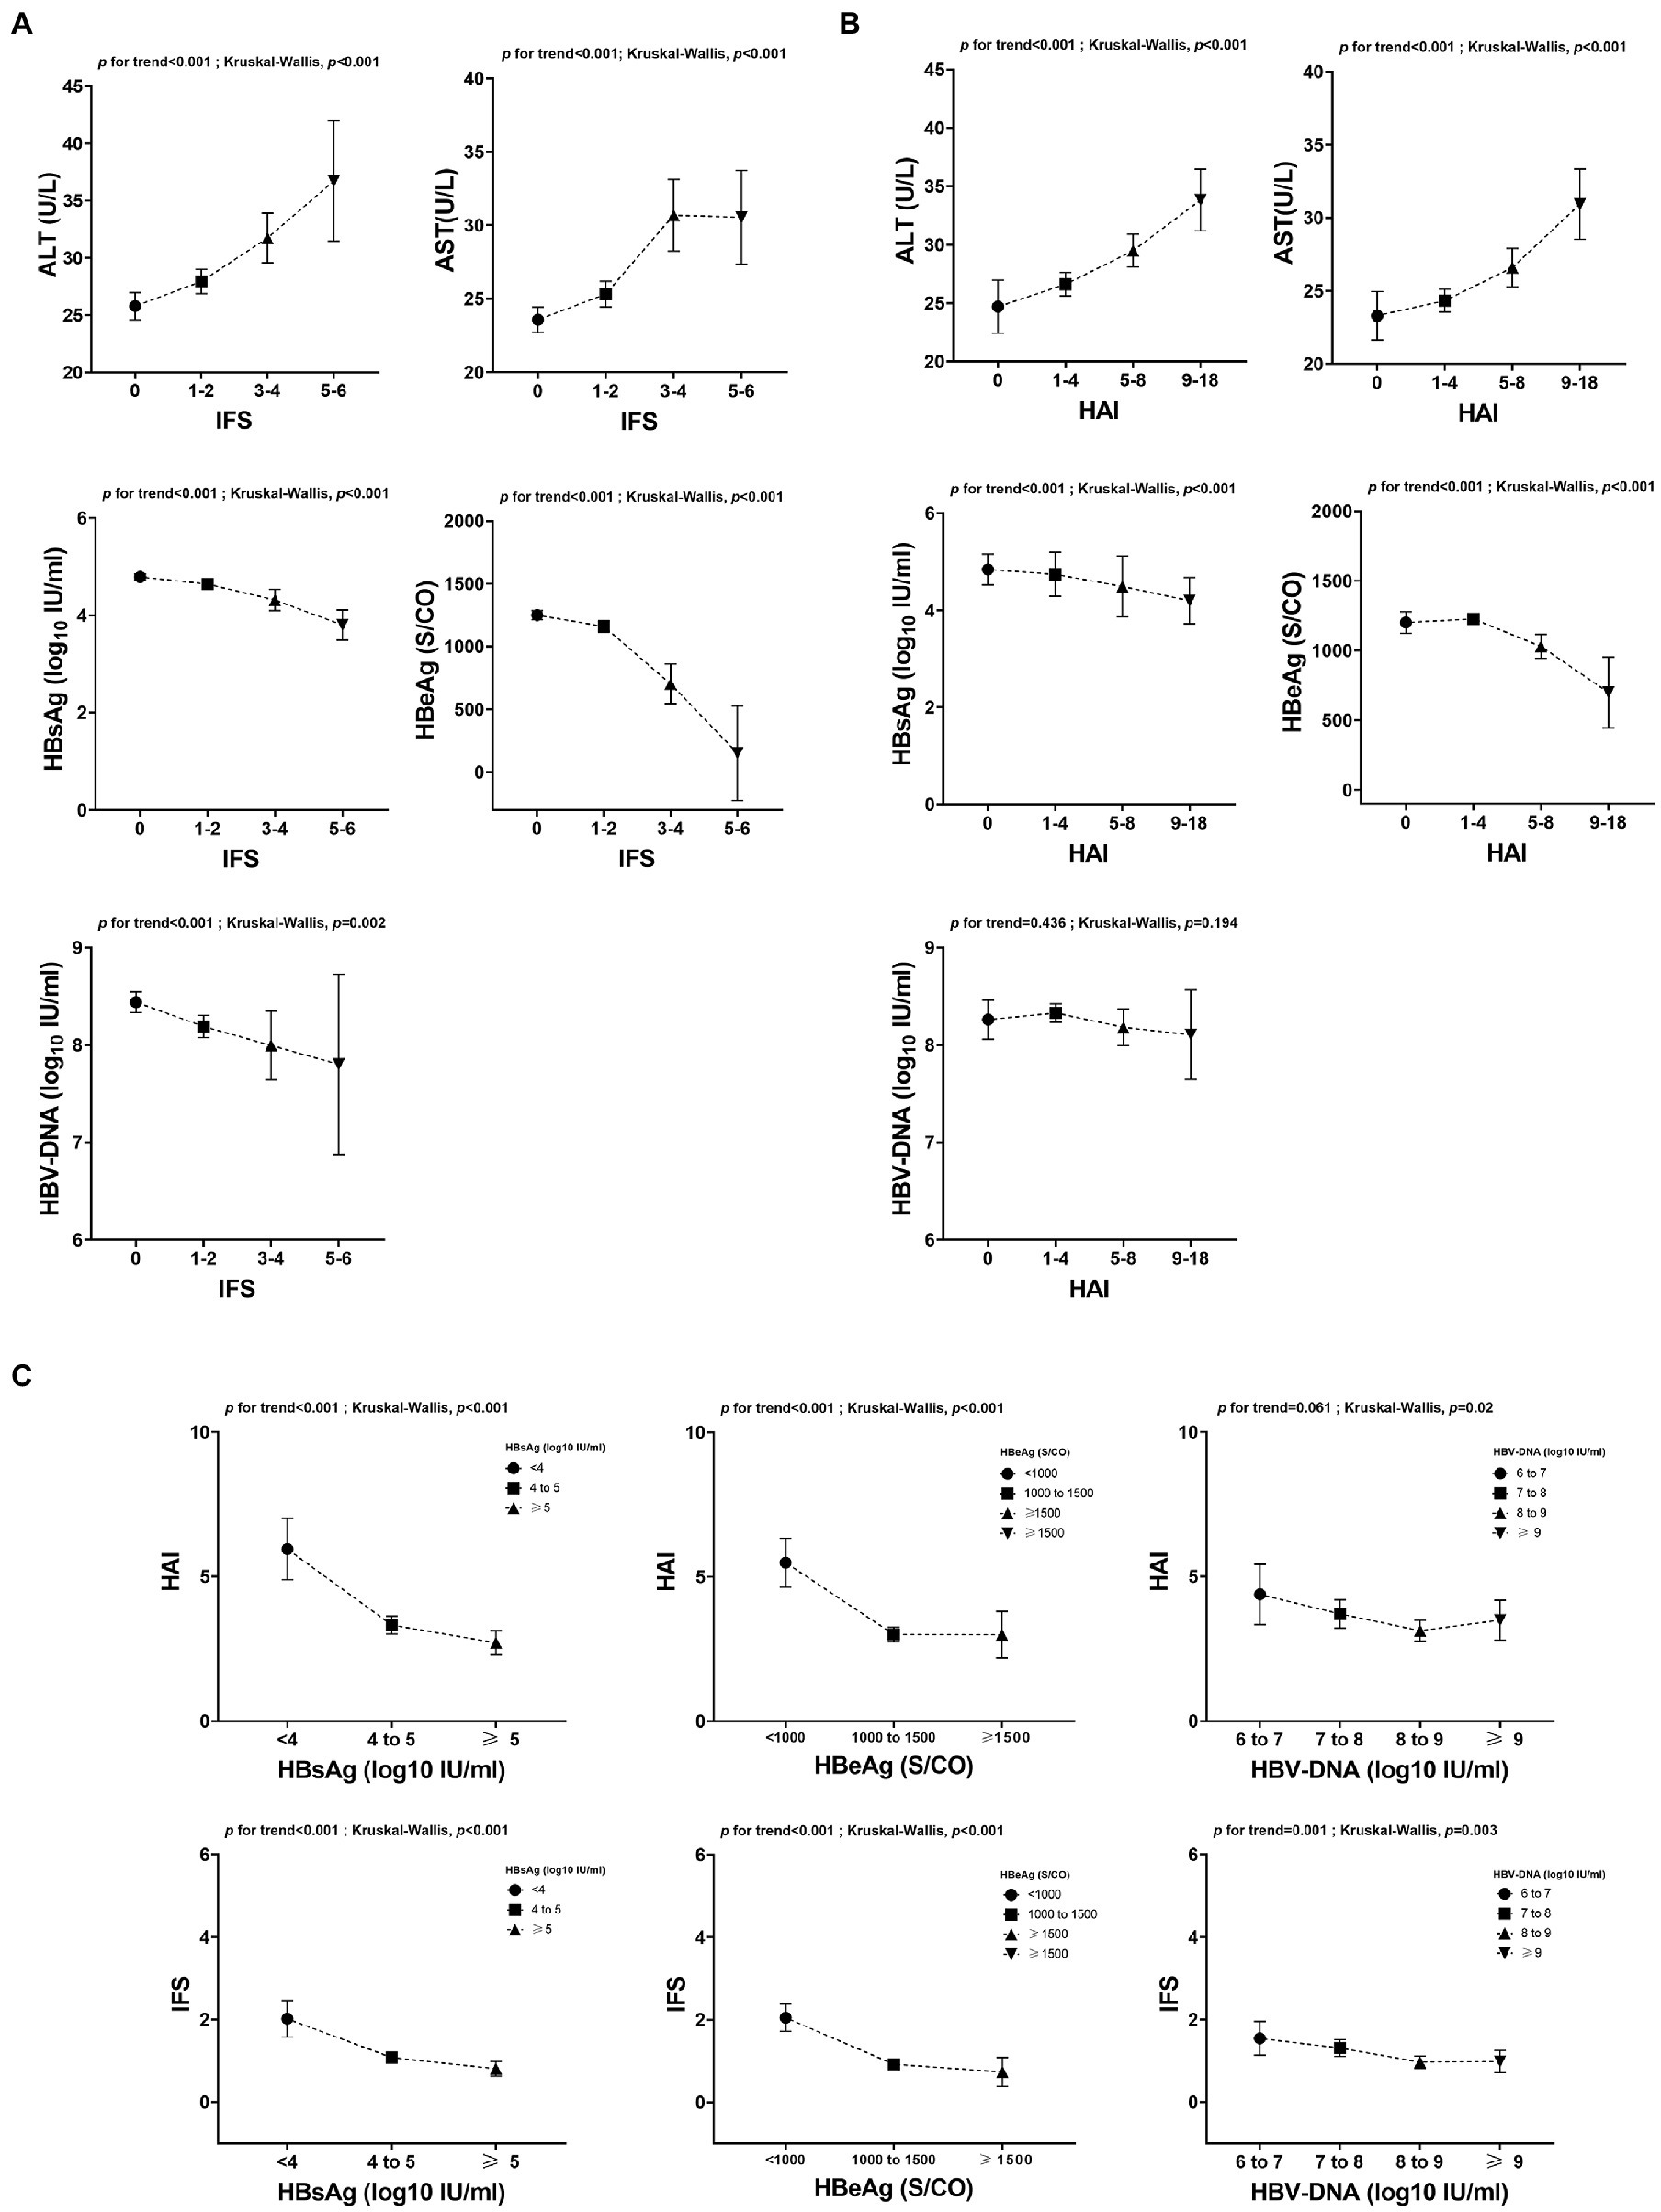
Figure 4. Relationship between serological indicators and liver pathology. (A) Relationship between serological indicators and the extent of fibrosis. (B) Relationship between serological indicators and the extent of inflammation. (C) Relationship between liver pathology and different levels of virological indicators. ALT, alanine aminotransferase; AST, aspartate transaminase; HAI, histology activity index; HBeAg, hepatitis B e-antigen; HBsAg, hepatitis B surface antigen.
Discussion
Due to the disease dynamics, it was important for IT-phase patients to monitor the liver histology in order to initiate antiviral treatments on time. In this study, we analyzed 445 IT-phase patients from 18 hospitals and developed a prediction model (IT-3) based on three non-invasive factors from a training cohort of 289 cases and validated in an external validation cohort of 156 cases. We found that lower HBeAg, higher AST, and lower PLT were high-risk factors for significant liver fibrosis in these patients. Base on the ROC, NRI and IDI analysis, the IT-3 model showed good prediction performance in predicting significant liver fibrosis and outperformed conventional models (APRI, GPR and FIB-4) in both training and validation cohorts. We demonstrated its good reliability and robustness by using advanced statistical methods (brier score and 1,000-time bootstrap validation). The risk scores calculated by the IT-3 model and the histology scores obtained from liver biopsies were in good agreement, indicating the ability of our model in assessing liver fibrosis. We also developed an online dynamic nomogram to make it easier to apply in clinical practice.
APRI (16), FIB-4 (17), and GPR (18) were non-invasive models commonly used for liver fibrosis assessment. However, we found that these ratio models did not show excellent performance in IT-phase patients. It might be attributed to the fact that the indicators used for prediction in the IT phase were almost entirely within the normal range, which limited the ability to assess of these ratio models. Therefore, the inclusion of virological indicators was necessary for liver fibrosis assessment in IT-phase patients. Several studies (20, 21) constructed non-invasive models to predict the risk of liver fibrosis for IT-phase patients, but the number of cases in the training cohorts was relatively small. Beyond this, external validation, model calibration, and decision curve analysis were not performed in these studies. Our model addressed these deficiencies and showed better discrimination. In comparison to the fibrosis staging diagnostic model developed by Wu et al. (22), our study also showed better discrimination, sensitivity and specificity in predicting significant liver fibrosis.
AST and HBeAg were independent predictors of liver fibrosis in IT-phase patients. ALT and AST were found in the cytoplasm and mitochondria, respectively. Thus, the rise in AST implied a deeper extent of liver injury and a greater likelihood of inflammatory infiltrates and desmoplasia, which might explain why AST, but not ALT, was an independent predictor in this study. Another important finding was that HBeAg levels were inversely correlated with the extent of liver fibrosis. HBeAg is an important indicator of viral replication and activity. However, when it was at a low level in IT-phase patients who were not receiving antiviral treatment, a possible explanation was the presence of immune-mediated viral clearance in the liver and it was the immunological reaction results in liver fibrosis. In fact, it was inaccurate to determine pathological status only based on the upper limit of normal (ULN) of transaminase. We observed that ALT and AST showed an increasing trend with increasing liver fibrosis, although the transaminases were within normal ranges. These findings suggested that it might be more beneficial for IT-phase patients to start antiviral therapy at a lower ULN, no longer using 40 U/L as the ULN for ALT, which was also consistent with some guidelines and opinions (9, 23). We also discovered that patients with significant fibrosis had lower levels of HBsAg and HBV DNA than patients with no or minor fibrosis, which was in line with previous studies (24–26) that found a negative correlation between these virological indicators and the stage of fibrosis in HBeAg-positive CHB patients.
There were some limitations to our study. Although this study was a multi-center study, the participants were all Chinese, and the majority of patients were of Asian ethnicity with genotypes B or C. The efficacy of this model for other races and genotypes remains to be validated. Second, the individuals in this study were all older than 18 years, which might limit the applicability in pediatric IT-phase patients. Third, we did not include transient elasography as a predictor variable when developing our model due to limited availability in China.
In conclusion, this study has developed a non-invasive and accurate model to predicting liver significant fibrosis for pseudo-immune tolerance patients and to provide more suitable therapeutic treatment regimens.
Data availability statement
The raw data supporting the conclusions of this article will be made available by the authors, without undue reservation.
Ethics statement
The studies involving human participants were reviewed and approved by the Dongzhimen Hospital affiliated to Beijing University of Chinese Medicine. The patients/participants provided their written informed consent to participate in this study. Written informed consent was obtained from the individual(s) for the publication of any potentially identifiable images or data included in this article.
Author contributions
YY and YX: study concept and design. YX: acquisition of data. SL and ZL: analysis and interpretation of data and drafting of the manuscript. XL, HD, DG, XZ, and XY: critical revision of the manuscript for important intellectual content. XL and YY: study supervision. All authors read and approved the final version of the manuscript.
Funding
This work was supported by grants from the National Major Science and Technology Projects of China (No. 2018ZX10725505), the National Natural Science Foundation of China (No. 82174341), and the Beijing University of Chinese Medicine Major Project (No. 2020-JYB-ZDGG-115).
Acknowledgments
We want to give special thanks to Weiwei Li (Medical Examination Center, The Chronic Disease Hospital of Shandong Province) and Roger Marshall (School of Population Health, The University of Auckland) for advice on data analysis.
Conflict of interest
The authors declare that the research was conducted in the absence of any commercial or financial relationships that could be construed as a potential conflict of interest.
Publisher’s note
All claims expressed in this article are solely those of the authors and do not necessarily represent those of their affiliated organizations, or those of the publisher, the editors and the reviewers. Any product that may be evaluated in this article, or claim that may be made by its manufacturer, is not guaranteed or endorsed by the publisher.
Supplementary material
The Supplementary material for this article can be found online at: https://www.frontiersin.org/articles/10.3389/fpubh.2023.1137738/full#supplementary-material
Footnotes
References
1. Thomas, DL. Global elimination of chronic hepatitis. N Engl J Med. (2019) 380:2041–50. doi: 10.1056/NEJMra1810477
2. Polaris Observatory Collaborators. Global prevalence, treatment, and prevention of hepatitis B virus infection in 2016: a modelling study. Lancet Gastroenterol Hepatol. (2018) 3:383–403. doi: 10.1016/S2468-1253(18)30056-6
3. McMahon, BJ. Epidemiology and natural history of hepatitis B. Semin Liver Dis. (2005) 25:3–8. doi: 10.1055/s-2005-915644
4. Hui, C-K, Leung, N, Yuen, S-T, Zhang, H-Y, Leung, K-W, Lu, L, et al. Natural history and disease progression in Chinese chronic hepatitis B patients in immune-tolerant phase. Hepatology. (2007) 46:395–401. doi: 10.1002/hep.21724
5. Andreani, T, Serfaty, L, Mohand, D, Dernaika, S, Wendum, D, Chazouillères, O, et al. Chronic hepatitis B virus carriers in the immunotolerant phase of infection: histologic findings and outcome. Clin Gastroenterol Hepatol. (2007) 5:636–41. doi: 10.1016/j.cgh.2007.01.005
6. Terrault, NA, Lok, ASF, McMahon, BJ, Chang, K-M, Hwang, JP, Jonas, MM, et al. Update on prevention, diagnosis, and treatment of chronic hepatitis B: AASLD 2018 hepatitis B guidance. Hepatology. (2018) 67:1560–99. doi: 10.1002/hep.29800
7. Kawanaka, M, Nishino, K, Kawamoto, H, and Haruma, K. Hepatitis B: Who should be treated?-managing patients with chronic hepatitis B during the immune-tolerant and immunoactive phases. World J Gastroenterol. (2021) 27:7497–508. doi: 10.3748/wjg.v27.i43.7497
8. European Association for the Study of the Liver. Electronic address: ZWFzbG9mZmljZUBlYXNsb2ZmaWNlLmV1, European Association for the Study of the liver. EASL 2017 clinical practice guidelines on the management of hepatitis B virus infection. J Hepatol. (2017) 67:370–98. doi: 10.1016/j.jhep.2017.03.021
9. Terrault, NA, Bzowej, NH, Chang, K-M, Hwang, JP, Jonas, MM, and Murad, MH. AASLD guidelines for treatment of chronic hepatitis B. Hepatology. (2016) 63:261–83. doi: 10.1002/hep.28156
10. Sarin, SK, Kumar, M, Lau, GK, Abbas, Z, Chan, HLY, Chen, CJ, et al. Asian-Pacific clinical practice guidelines on the management of hepatitis B: a 2015 update. Hepatol Int. (2016) 10:1–98. doi: 10.1007/s12072-015-9675-4
11. Kim, G-A, Lim, Y-S, Han, S, Choi, J, Shim, JH, Kim, KM, et al. High risk of hepatocellular carcinoma and death in patients with immune-tolerant-phase chronic hepatitis B. Gut. (2018) 67:945–52. doi: 10.1136/gutjnl-2017-314904
12. Nguyen, MH, Garcia, RT, Trinh, HN, Lam, KD, Weiss, G, Nguyen, HA, et al. Histological disease in Asian-Americans with chronic hepatitis B, high hepatitis B virus DNA, and normal alanine aminotransferase levels. Am J Gastroenterol. (2009) 104:2206–13. doi: 10.1038/ajg.2009.248
13. Göbel, T, Erhardt, A, Herwig, M, Poremba, C, Baldus, SE, Sagir, A, et al. High prevalence of significant liver fibrosis and cirrhosis in chronic hepatitis B patients with normal ALT in Central Europe. J Med Virol. (2011) 83:968–73. doi: 10.1002/jmv.22048
14. Collins, GS, Reitsma, JB, Altman, DG, and Moons, KGM. Transparent reporting of a multivariable prediction model for individual prognosis or diagnosis (TRIPOD): the TRIPOD statement. BMJ. (2015) 350:g 7594. doi: 10.1136/bmj.g7594
15. Ishak, K, Baptista, A, Bianchi, L, Callea, F, De Groote, J, Gudat, F, et al. Histological grading and staging of chronic hepatitis. J Hepatol. (1995) 22:696–9. doi: 10.1016/0168-8278(95)80226-6
16. Wai, C-T, Greenson, JK, Fontana, RJ, Kalbfleisch, JD, Marrero, JA, Conjeevaram, HS, et al. A simple noninvasive index can predict both significant fibrosis and cirrhosis in patients with chronic hepatitis C. Hepatology. (2003) 38:518–26. doi: 10.1053/jhep.2003.50346
17. Sterling, RK, Lissen, E, Clumeck, N, Sola, R, Correa, MC, Montaner, J, et al. Development of a simple noninvasive index to predict significant fibrosis in patients with HIV/HCV coinfection. Hepatology. (2006) 43:1317–25. doi: 10.1002/hep.21178
18. Lemoine, M, Shimakawa, Y, Nayagam, S, Khalil, M, Suso, P, Lloyd, J, et al. The gamma-glutamyl transpeptidase to platelet ratio (GPR) predicts significant liver fibrosis and cirrhosis in patients with chronic HBV infection in West Africa. Gut. (2016) 65:1369–76. doi: 10.1136/gutjnl-2015-309260
19. Knodell, RG, Ishak, KG, Black, WC, Chen, TS, Craig, R, Kaplowitz, N, et al. Formulation and application of a numerical scoring system for assessing histological activity in asymptomatic chronic active hepatitis. Hepatology. (1981) 1:431–5. doi: 10.1002/hep.1840010511
20. Chi, Z, Zhao, W, Li, J-W, Liu, H, Shao, C, Zhao, H, et al. Combination of quantitative hepatitis B core antibody (qHBcAb) and aspartate aminotransferase (AST) can accurately diagnose immune tolerance of chronic hepatitis B virus infection based on liver biopsy. Clin Res Hepatol Gastroenterol. (2021) 45:101563. doi: 10.1016/j.clinre.2020.10.008
21. Zeng, D-W, Huang, Z-X, Lin, M-X, Kang, N-L, Lin, X, Li, Y-N, et al. A novel HBsAg-based model for predicting significant liver fibrosis among Chinese patients with immune-tolerant phase chronic hepatitis B: a multi-center retrospective study. Ther Adv Gastroenterol. (2021) 14:175628482110106. doi: 10.1177/17562848211010675
22. Wu, D, Rao, Q, Chen, W, Ji, F, Xie, Z, Huang, K, et al. Development and validation of a novel score for fibrosis staging in patients with chronic hepatitis B. Liver Int. (2018) 38:1930–9. doi: 10.1111/liv.13756
23. Drafting Committee for Hepatitis Management Guidelines, the Japan Society of Hepatology. Japan Society of Hepatology Guidelines for the Management of Hepatitis B Virus Infection: 2019 update. Hepatol Res. (2020) 50:892–923. doi: 10.1111/hepr.13504
24. Zhang, P, Du, HB, Tong, GD, Li, XK, Sun, XH, Chi, XL, et al. Serum hepatitis B surface antigen correlates with fibrosis and necroinflammation: A multicentre perspective in China. J Viral Hepat. (2018) 25:1017–25. doi: 10.1111/jvh.12903
25. Xie, Q, Hu, X, Zhang, Y, Jiang, X, Li, X, and Li, J. Decreasing hepatitis B viral load is associated with a risk of significant liver fibrosis in hepatitis B e antigen positive chronic hepatitis B. J Med Virol. (2014) 86:1828–37. doi: 10.1002/jmv.24000
Keywords: chronic hepatitis B, liver fibrosis, immune tolerant, liver biopsy, nomogram
Citation: Li S, Li Z, Du H, Zao X, Gan D, Yang X, Li X, Xing Y and Ye Y (2023) Identification of pseudo-immune tolerance for chronic hepatitis B patients: Development and validation of a non-invasive prediction model. Front. Public Health. 11:1137738. doi: 10.3389/fpubh.2023.1137738
Edited by:
Ming Yue, Nanjing Medical University, ChinaReviewed by:
Daxian Wu, First Affiliated Hospital of Nanchang University, ChinaAhmet Cagkan Inkaya, Hacettepe University, Türkiye
Copyright © 2023 Li, Li, Du, Zao, Gan, Yang, Li, Xing and Ye. This is an open-access article distributed under the terms of the Creative Commons Attribution License (CC BY). The use, distribution or reproduction in other forums is permitted, provided the original author(s) and the copyright owner(s) are credited and that the original publication in this journal is cited, in accordance with accepted academic practice. No use, distribution or reproduction is permitted which does not comply with these terms.
*Correspondence: Xiaoke Li, bGl4aWFva2VAdmlwLjE2My5jb20=; Yufeng Xing, eXVmZW5nMDAwNzI5QDE2My5jb20=; Yong’an Ye, eWV5b25nYW5AdmlwLjE2My5jb20=
†These authors have contributed equally to this work and share first authorship