 Shi Purun1
 Zhengxiu Sun
94% of researchers rate our articles as excellent or good
Learn more about the work of our research integrity team to safeguard the quality of each article we publish.
Find out more
REVIEW article
Front. Public Health , 13 March 2023
Sec. Health Economics
Volume 11 - 2023 | https://doi.org/10.3389/fpubh.2023.1131337
At present, China has become one of the fastest growing countries in terms of junk food consumption. However, there has been less previous evidence for the effect of endowment insurance on dietary health. Using the data China Family Panel Studies (CFPS) from 2014, this paper exploits a policy, the New Rural Pension System (NRPS), that only the older adults who have reached 60 years old can receive pensions and conduct a fuzzy regression discontinuity (FRD) to address endogeneity and examine the causal effect of the NRPS on the intake of junk food among rural older adults in China. We find that the NRPS can significantly reduce junk food intake among them, which remains robust after a series of robustness tests. In addition, heterogeneity analysis shows that the female, low-educated, unemployed, and low-income groups are more sensitive to the pension shock from the NRPS. The result of our study provides insights to effectively improve people's dietary quality and related policy formulation.
Diet has an important impact on human health, economic development, and social labor productivity (1–3). In 2017, 11 million deaths and 255 million disability-adjusted life year (DALY) worldwide are attributed to unhealthy dietary factors (4). Notably, unhealthy diet has become the 5th most important risk factor for disease and death (5). As for China, some studies have shown that the dietary quality of Chinese residents is not high and there are some problems with the nutritional structure (6, 7). The intake of junk food is likely to be an important inducement. According to statistics, China's dietary quality is deteriorating due to unhealthy pattern and China has become the one of the fastest growing countries in terms of unhealthy items consumption (8).
Junk food is generally high in salt, sugar and fat (9) and has become the main source of food for people at the bottom of society due to its relatively low price (10). However, numerous studies have shown that such unhealthy diet is directly harmful to health (11, 12). Specifically, the intake of high sugar increases cardiometabolic risk (13, 14). The high intake of sodium and preserved vegetables predisposes to hypertension (15, 16). Typical “Western dietary patterns,” including refined cereals, red meat and its products, sugars, pastries, and fried potato chips, etc., significantly increase cardiovascular morbidity and mortality (17). The intake of excessive fat increases obesity rates (18, 19), which leads to a variety of cancers (20). Therefore, it is worthwhile explore how to reduce unhealthy food to improve health status.
Income is likely to be an important factor in changing the dietary health and nutritional structure (13, 14, 21, 22). Specifically, sustained income growth led to higher food expenditures (23). Yu and Abler (24) found that rural households in China purchased more high-quality food as their income increases. Li et al. (25) found income has a significant contribution to the dietary health of rural residents. Huang and Zhang (26) found the pension from the NRPS improves the nutrition intake, which is in line with the study of the effects of the social pension in Korea (27). However, negative income shocks led to a significant reduction in household intake of calories, fat, and protein (28). Income risk might cause individuals to decrease their meat consumption (29). In addition, the main diets of low-, middle-, and high- income households were fruits and dairy, meat, and cereals, respectively (30). In fact, other factors, such as age, education, marriage, gender, place of residence, occupation, household size, caloric intake of animal foods, etc. (21, 30–35), play important roles in people's diet as well. In summary, there are few studies that focused on the effect of income on the intake of junk food.
However, there are a few challenges to accurately identify the above causal relationship. The main one is the endogeneity caused by the relationship between income and diet. The above seems to prove that income has an influence on diet. However, individual nutritional intake and levels due to diet may influence income as well (36–39). Therefore, China's New Rural Pension System (NRPS) provide us with a valuable natural experiment, an exogenous income shock. It stipulates that those who have reached 60 years old can receive pensions, which is designed to provide basic and stable livelihood security for the older adults aged above 60.
This paper contributes to the strand of literature that examines the effects of the NRPS. Most of extant studies focused more on its effect on labor supply, child transfer payments, medical service utilization, mental health, and health inequality (38, 40–43). However, we innovatively complement the effect of the NRPS from the perspective of dietary health. In addition, we further corroborate the role of income in improving diet structure and provide institutional-level support. Our implications may provide useful information to policymakers in China, even in other developing countries, on the reform of the future social security system and how to improve residents' dietary quality.
The remainder of the paper is organized as follows. Section 2 briefly introduces China's NRPS. Section 3 describes the data, descriptive statistics, and empirical strategy. Section 4 presents the main results and tests for identification validity. Section 5 presents heterogeneity analysis. Section 6 is discussion. Section 7 concludes.
The New Rural Pension System (NRPS) is a large social pension insurance system launched by the Chinese government for the purpose of guaranteeing the basic livelihood of the elderly in rural regions. In September 2009, the General Office of the State Council of the People's Republic of China officially issued the “Guidance Opinions of the State Council on Launching the Pilot Program of the New Rural Pension System,” marking the beginning of the pilot program of the NRPS. According to incomplete statistics, in the same year, the first 320 pilot counties were identified, and the number of participants reached 72.77 million. In 2010, the number of pilot counties was further expanded to 838, and 30 million new participants were added. In 2011, the number of pilot counties was further expanded to 1,914, and 220 million new participants were added. By the end of 2012, China's NRPS has covered the whole country, with 460 million people insured (44, 45). Notably, the NRPS is an unprecedented welfare program covering the largest population in human history (26).
In terms of the participation, the NRPS stipulates that the principle of voluntary participation in the household registration was implemented for those rural residents who have reached the age of 16 and have not participated in the Urban Employees' Basic Endowment Insurances (UEBEI),1 excluding students and soldiers. In fact, this combination of government-led and voluntary system has greatly expanded the coverage of the NRPS.
In terms of the funding model, it is a combination of individual payments, collective subsidies, and government subsidies. Specifically, enrollees can choose their own payment level which is adjusted in accordance with relevant indicator such as the net per capita income of rural resident. The more you pay, the more you get. In addition, some village collectives give subsidies to enrollees, and the government encourages organizations or individuals other than village collectives to provide financial support for NRPS accounts. Some local governments subsidize each enrollee by no < 30 yuan per year and provide an additional subsidy to those who participate in high-level security.
In terms of the pension management and distribution, the social pooling account and the individual account are set up. Monthly pension benefits comprise the basic pension from social pooling account and the individual pension from the individual account. Specifically, the social pooling account is fully financed by government funds. The basic pension from it is not < 55 yuan per month. Individual payment and subsidies from collective and government are credited to individual accounts. The government is responsible for making investment decisions and managing the funds in individual accounts. The monthly individual pension is 1/139 of the total accumulation in the individual account.
The data used in this paper derives from the China Family Panel Studies (CFPS), a collaborative effort between the China Social Science Survey Center at Peking University and the University of Michigan Survey Research Center, U.S.A. The CFPS is designed to track data at the individual, household, and community levels. It is a nationwide, large-scale, multidisciplinary social tracking survey covering a wide range of variables including economic activity, educational outcomes, family relationships and dynamics, population migration, and health. Since FRD is locally randomized, no tracking data are required. Eventually the 2014 cross-sectional data are selected for our analysis in this paper. Given that we focus on the effect of the NRPS on the intake of junk food and that the CFPS only ask questions about the NRPS to residents aged 45 years and older, only the samples of rural hukou aged 45–75 years are retained for this paper,2 and the samples with the missing question “The intake of junk food in the past week” are excluded.
7-day dietary food record is widely chosen as the reference method and applied to studies in the field of nutrition (e.g., 46–49). It records the respondents' intake of a certain food in the past 7 days. Similarly, the 2014 CFPS inquires whether meat, fish and other aquatic products, fresh vegetables and fruits, dairy products, soy products, eggs, pickled foods, puffed/ fried foods, and miscellaneous grains were consumed in the past week.3 Among them, pickled foods and puffed/fried foods respectively contain high salt and high oil, which are typical representatives of junk foods. Therefore, we set the dependent variable Junk food intake as a dummy variable which takes the value 1 if the person has consumed pickled, puffed, or fried food in the past week, and 0 if otherwise.
Table 1 shows the basic information of all the variables used in this paper.
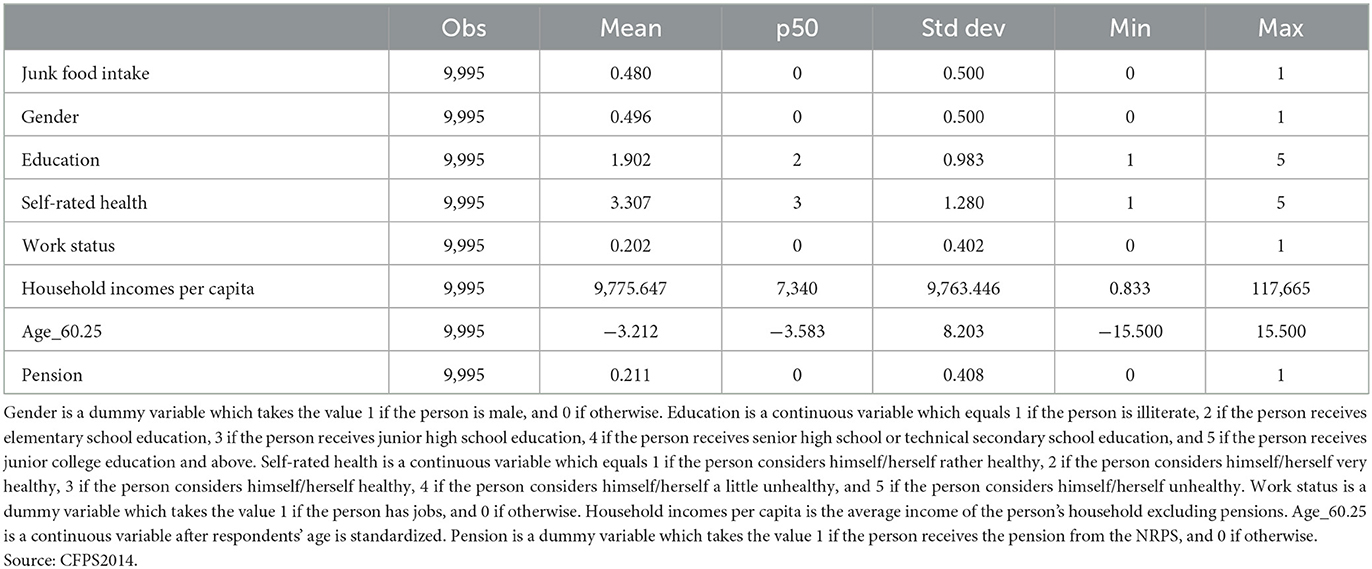
Table 1. Summary statistics.
Table 2 shows the result of subgroup statistics. In Table 2, we demonstrate the mean on both side of the cutoff. In the selected baseline sample aged 45–75, Column (1) and Column (2) show that the mean of the intake of junk food in the past week is 0.495 on the left side of the cutoff and 0.455 on the right side of the cutoff, respectively. The mean on the right side of the cutoff is significantly lower than that on the left side at the 1% level. Meanwhile, the mean of other variables is also significantly different on both sides of the cutoff. Among them, the left side of the cutoff is significantly better than the right side in terms of education, self-rated health, and work status. The possible reason is that the samples on the left side of the cutoff is younger overall. Therefore, a direct comparison of only the mean on both sides of the cutoff cannot verify the causal effect of the NRPS on the intake of junk food. Moreover, Column (3) and (4) show that the differences in other control variables narrow when the age range is limited to 2 years on both sides of the cutoff. By contrast, the mean of the intake of junk food in the past week is 0.514 on the left side of the cutoff and 0.453 on the right side, with the difference between the mean on both sides being significantly larger and significant at the 5% level, which is possibly the result of the mitigating effect of the NRPS. Only approximate information of the sample can be observed through descriptive analysis. The specific causal effects request more rigorous empirical analysis.
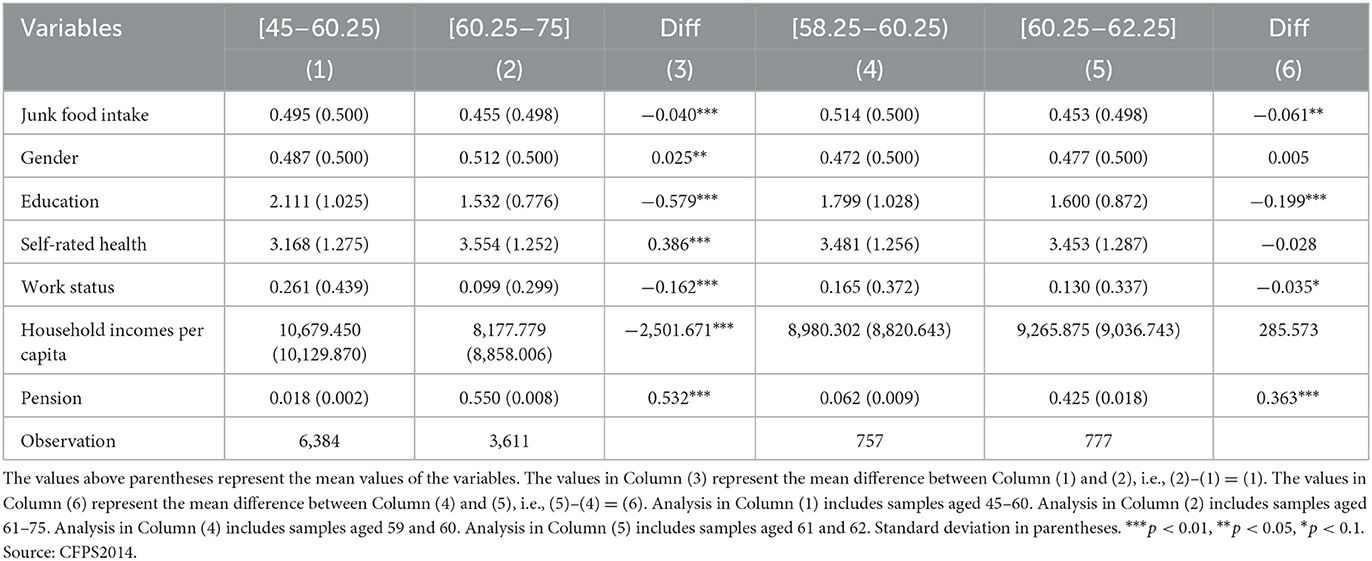
Table 2. Subgroup statistics.
Regression discontinuity (RD), emerging and being widely used in recent decades, plays an important role in identifying causal effects. The basic concept of this identification strategy is to use discontinuous features on the policy rule. This policy rule allows an individual to be treated when an observable characteristic variable, i.e., forcing variable, is equal to or greater than a threshold, i.e., cutoff. As long as the individual is not able to fully manipulate the forcing variable, the discontinuous changes in the dependent variable can be considered to be caused by the treatment state. However, in many cases, although the treatment state is a discontinuous function of the forcing variable, it does not necessarily change from 0 to 1 at the cutoff, but only increases the probability that the treatment state takes the value 1 (52). In this case, the RD we use becomes fuzzy regression discontinuity (FRD). Then, the treatment and control groups are constructed on both sides of this cutoff to obtain the local average treatment effect (LATE) which represents the causal effect (53). In fact, scholars generally believe that FRD is closer to quasi-natural experiments, and the estimated results are more accurate (43).
Figure 1 shows the probability of receiving pensions for the rural older adults. It can be observed that there is a significant upward jump in the probability of receiving pensions at the standardized age 0, i.e., age 60. The reason is possibly that, in the practical implementation of the policy, there are phenomena of pensions being paid before or over the age of 60 due to the preference of local governments to pay out in accordance with the actual situation, though the NRPS stipulates that pensions can be received upon reaching the age of 60. Therefore, the possibility of receiving pensions jumps < 1 at the cutoff instead of changing from 0 to 1, which is consistent with the setting of the FRD. Based on the above, we use FRD to examine the causal effect of the NRPS on the intake of junk food among rural older adults in China.4
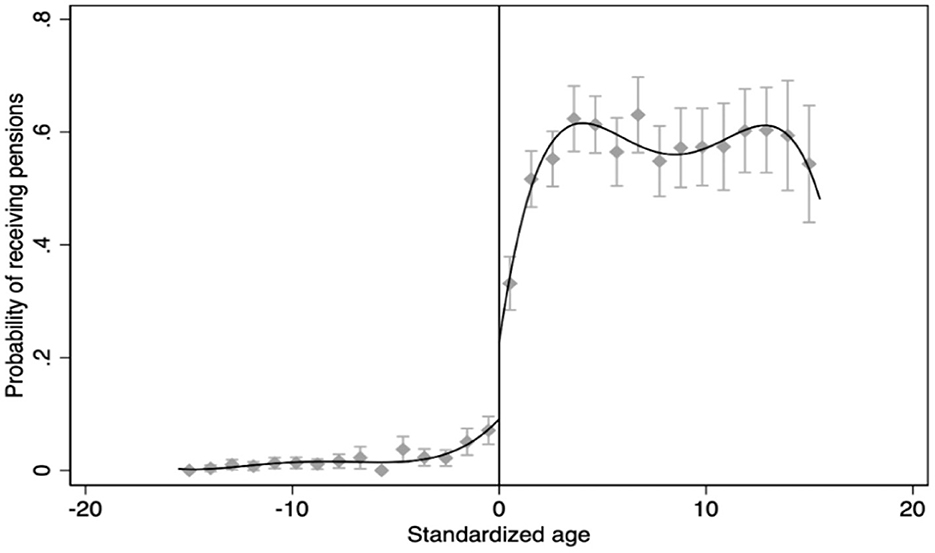
Figure 1. The cutoff in the probability of receiving pensions at the standardized age 0. Source: CFPS2014 and Stata 16.0.
In this paper, we set age as the forcing variable and 60.25 years old as the threshold5, i.e., cutoff. According to Calonico et al. (54) and Calonico et al. (55), the estimate τ can be presented by the following equation (1).
Where Di equals 1 if pensions are received and 0 if otherwise. Yi is the dependent variable, i.e., the intake of junk food in the past week. Yi(1) is the potential intake of the junk food assuming that pensions are received, i.e. D = 1. Yi(0) is the potential intake of the junk food assuming that pensions are not received, i.e., D = 0. X is the standardized age.
Due to the probability of receiving pensions jumping on X, E[Di(1)|X = 0] − E[Di(0)|X = 0] ≠ 0, which makes the consistent estimate of τ as follows.
In equation (2), , , , , μY(x) = E[Yi|Xi = x], μD(x) = E[Yi|Xi = x], so
Using the minimization method to estimate equation (3), the results are as follows.
Where Ti is the eligibility for pensions, which equals 1 if Xi ≥ 60.25 and 0 if otherwise. D and T are highly correlated but not equal under the structure of FRD. h is the bandwidth.
In addition, one of the keys in non-parametric estimation is the choice of bandwidth. Therefore, we choose the minimum mean square error method proposed by Calonico et al. (55) to select the optimal bandwidth, which can well balance validity and credibility, i.e., MSE[2) B + 1/nh V. B and V represent bias and variance, respectively.
Finally, to ensure the consistency of the FRD estimates, the “continuity hypothesis ” needs to be satisfied (56). In this paper, individuals are required not to manipulate the forcing variable, i.e., age, which makes them on the left or right side of the cutoff. Therefore, we use the following two methods to test for continuity: (1) test the continuity of each control variable at the cutoff. If the estimate of the FRD is valid, control variables that are not affected by the NRPS should be continuous at the cutoff. (2) test the continuity of the age density function, i.e., whether age is manipulated. Furthermore, we use a series of robustness tests such as estimation with different bandwidths to ensure the credibility of the results of the FRD.
Based on the above, we construct the following model to examine the causal effects of the pension from the NRPS on the intake of junk food.
Where Di equals 1 if pensions are received and 0 if otherwise. agei is a forcing variable which represents the respondents' age. f(agei) is a polynomial function of agei. Zi are covariates including gender, education, self-rated health, work status, and household incomes per capita. ω and τ represent province and county fixed effects, respectively. εi is error term.
FRD estimation can be achieved by two-stage least squares (2SLS), which is equivalent to IV estimation (57, 58). Specifically, the one-stage equation can be expressed as follows.
Where Ti equals 1 if agei ≥ 60.25, which is an instrumental variable of Di. μi is error term. The two-stage regression is set up in the same way as equation (6).
First, we use Logit regression6 to examine the effect of the age on the intake of junk food and the results are shown in Table 3. Column (1–4) shows the result of Logit regression when the bandwidths are 15, 8, 6.934, and 5 years, respectively. In Column (1), the OR of the variable Age_60.25 is 0.859 and significant at the 0.01 level, which indicates that the probability of the intake of junk food in the past week for the samples on the right side of the cutoff is significantly lower than that for the samples on the left side of the cutoff. In addition, the results remain significant at the 0.01 level in Column (2–4) when regression analyses are conducted using subsamples of 8, 6.934, and 5 years on each side of the cutoff. Given that control variables do not affect the consistency of the estimates in the FRD analysis, which are not the focus of this paper, the results of them are not elaborated.
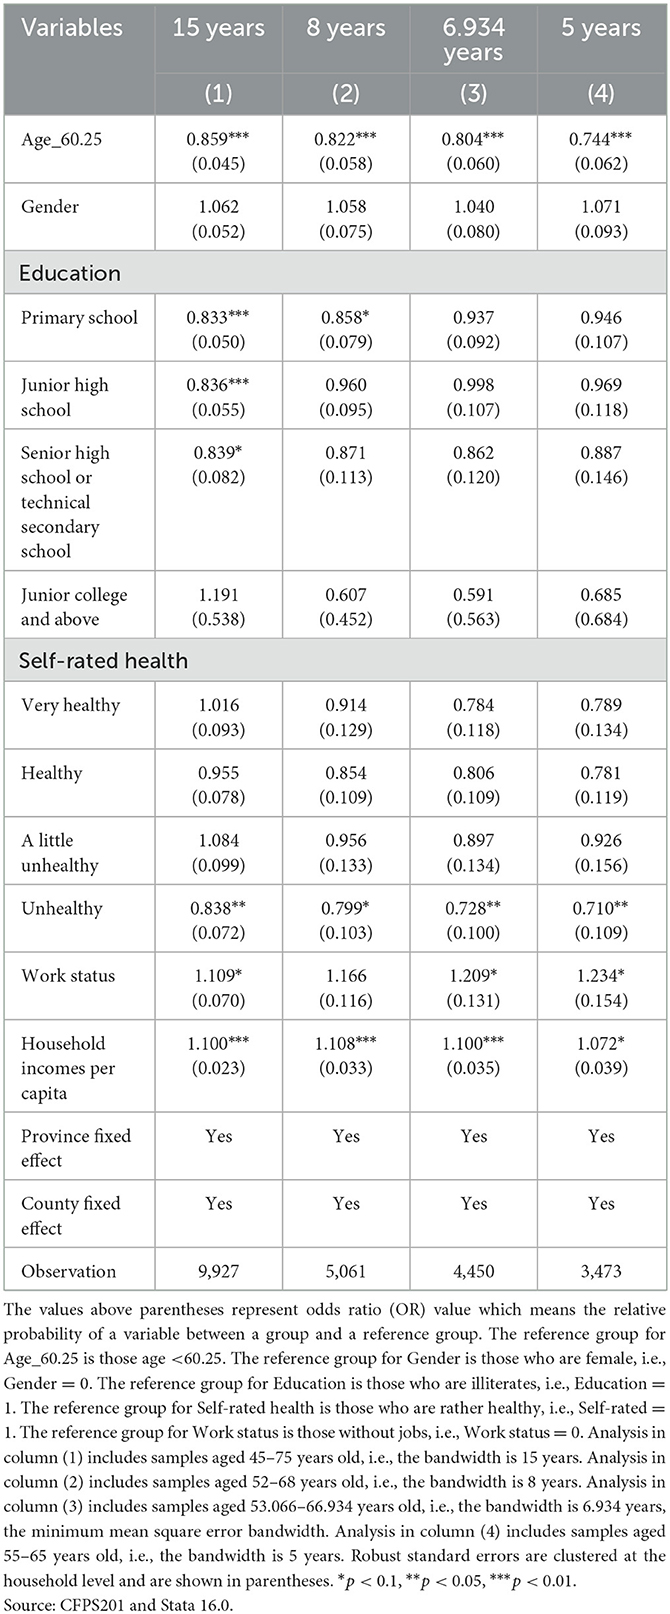
Table 3. The effect of the age on the intake of junk food.
Then, the results of the FRD are illustrated in Figure 2, showing that the intake of junk food has a clear downward jump at the standardized age 0 point. In the previous section, we have shown the results of the first stage estimation in Figure 1. It suggests that the probability of receiving a pension has a significant upward jump at the standardized age 0 point. Therefore, a preliminary indication can be provided by the two figures that the positive income shock from the NRPS significantly reduces the intake of junk food among rural residents.
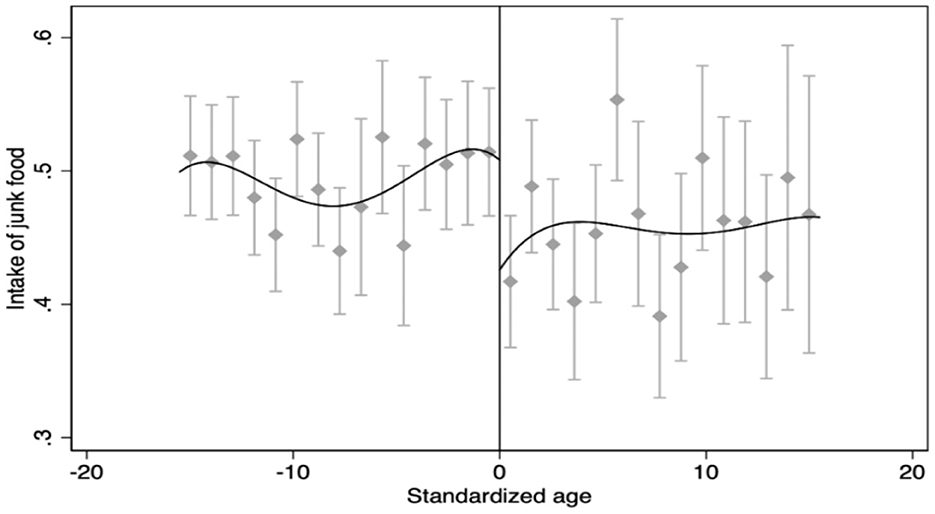
Figure 2. The results of the FRD. Source: CFPS2014 and Stata 16.0.
Finally, we present the results of FRD regression in Table 4. Column (1) reports the results of the first stage regression. We find that the age specified in the NRPS can significantly increase the probability of receiving pensions by 28.4 percentage points at 0.01 level, which indicates that the cutoff of age can be used as an instrumental variable (IV) for pension receipt. Using the minimum mean square error and calculating the optimal bandwidth (55), we report the result of the benchmark model in Column (2). It shows that the LATE of the FRD is −0.289 and significant at 0.01 level, which suggests that the income from the NRPS results in a significant reduction of the intake of junk food by 0.289.
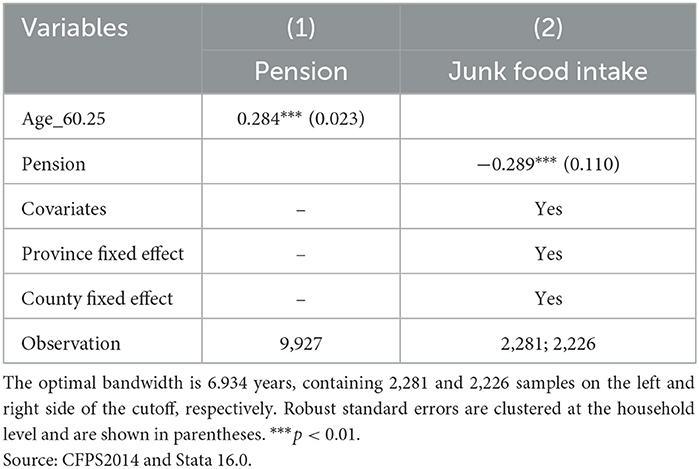
Table 4. The results of FRD regression.
As mentioned previously, the continuity hypothesis needs to be satisfied for the results of the FRD to be valid. Table 5 reports the results of the continuity check of each covariate at the cutoff. In Column (1–5), the coefficients of covariates are insignificant, which indicates that there is no discontinuity at the cutoff for covariates.
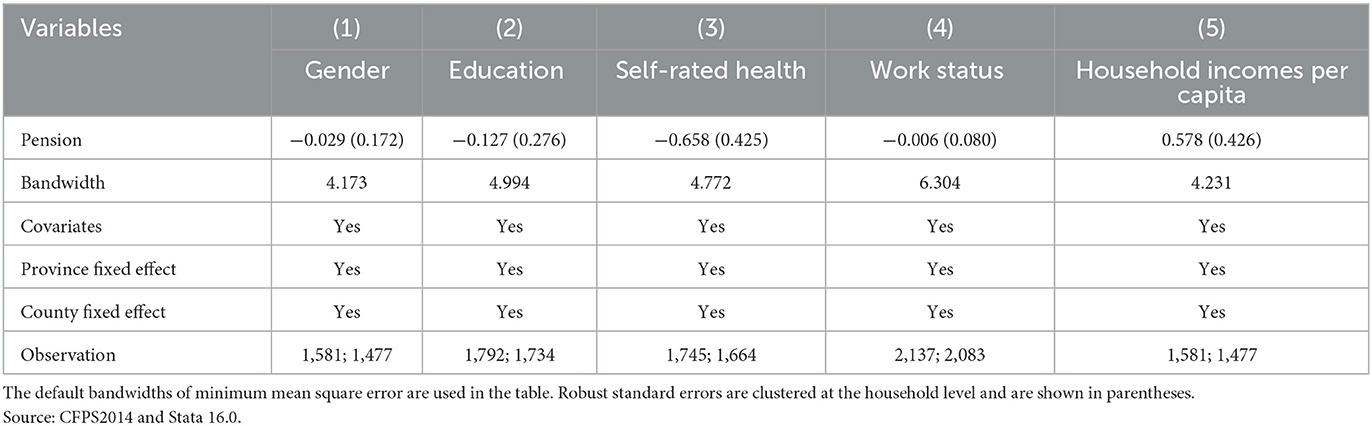
Table 5. The results of the continuity check of each covariate at the cutoff.
Then, we observe whether there is a discontinuity at the cutoff through age probability density plots. The result shown in Figure 3 suggests that the age around the cutoff, i.e., 60 years old, presents roughly an average distribution, which proves that the age is not manipulated. Therefore, the above two testing results have satisfied the premise of continuity hypothesis, which proves that the results of the FRD are valid in this paper.

Figure 3. The probability density around age 60. Source: CFPS2014 and Stata 16.0.
In addition to the optimal bandwidth used in the benchmark model regarding the symmetry of both sides of the cutoff, we further exploit the asymmetric optimal bandwidth on both sides (55) as well as the custom bandwidth to re-estimate the benchmark model. The results are shown in Column (1–3) of Table 6. Specifically, Column (1) shows that the LATE of the cutoff is −0.635 and significant at 0.05 level when the optimal bandwidths on the left and right sides are 5.040 and 2.635, respectively. In Column (2) and (3), the coefficients remain negative and significant as the bandwidth is set as 5 and 8 years, respectively. Besides, as shown in columns (4–6) of Table 6, we further set the regression order as 2 and use the asymmetric optimal on both sides of the cutoff as well as the custom bandwidth to re-estimate our benchmark model. The coefficients are roughly negative and significant. In summary, the above results with different bandwidths and orders imply that the positive income shock from the NRPS can significantly reduce the intake of junk food, which further demonstrates the robustness of the benchmark.
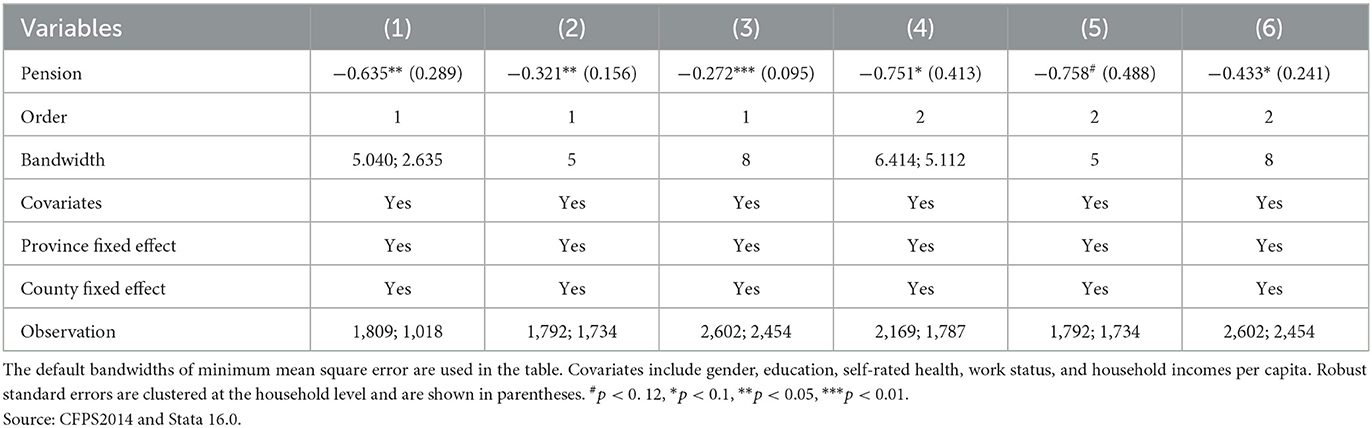
Table 6. Regression tests with different bandwidths and orders.
In this section, we perform placebo tests by setting pseudo-cutoffs. The rationale is that if the coefficients are not significant at any of pseudo-cutoffs, it is indeed the positive income shock from the NRPS instead of other factors that influences the intake of junk food. Therefore, we set setting pseudo-cutoffs at ages 56, 57, 58, 62, 63, and 64, respectively, and re-estimate the benchmark model. The results in Table 7 show that the coefficients are not significant at any of pseudo-cutoffs we set, which indicates that the reduction of junk food after 60 years old is indeed due to the NRPS.
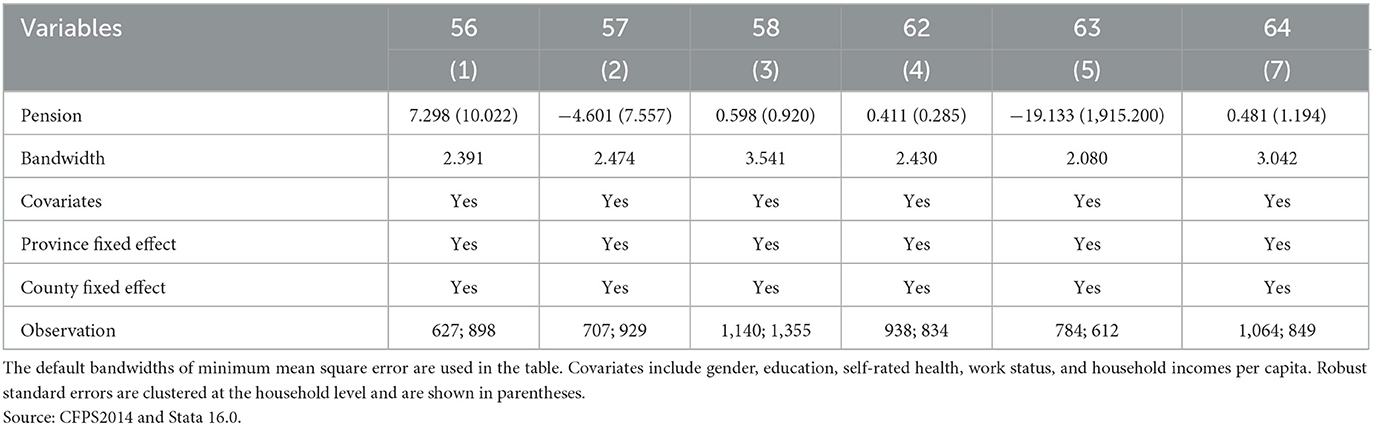
Table 7. Placebo tests.
In this section, we provide our explanations for three potential questions that may arise from the results of this paper. Firstly, participants of the NRPS are aware of the regulations on when the pensions can be received, which thus may cause them to change their behavior before receiving their pensions. If so, theoretically, we will expect such behavior to have a positive effect on the intake of junk food. However, the coefficient of the FRD is significantly negative. Therefore, we consider that this result should only be a lower bound on the NRPS, which means that the actual effects should be much stronger. Secondly, are there other policies in rural China that are implemented at the age 60 cutoff, which thus have an impact on the NRPS? According to Chen (59), there are no other policies implemented in rural China for the older adults at age 60. Therefore, it can be proved that, we think, the above results are indeed brought by the NRPS. Thirdly, does the NRPS really have an income shock? In fact, some previous studies have shown that the NRPS does significantly increase the income level of participants (26, 60), resulting in an income shock. In summary, we believe that our conclusion is robust and the NRPS does significantly reduce the intake of junk food among rural residents in China.
Considering that the effects of the pension shock by the NRPS on the intake of junk food may be heterogeneous due to different individual characteristics. Therefore, we respectively divide the total sample into subsamples according to gender, education, work status, and household incomes per capita, which can enrich the findings in this paper. The results of the heterogeneity are reported in Table 8 and the heterogeneous analysis is as follows.
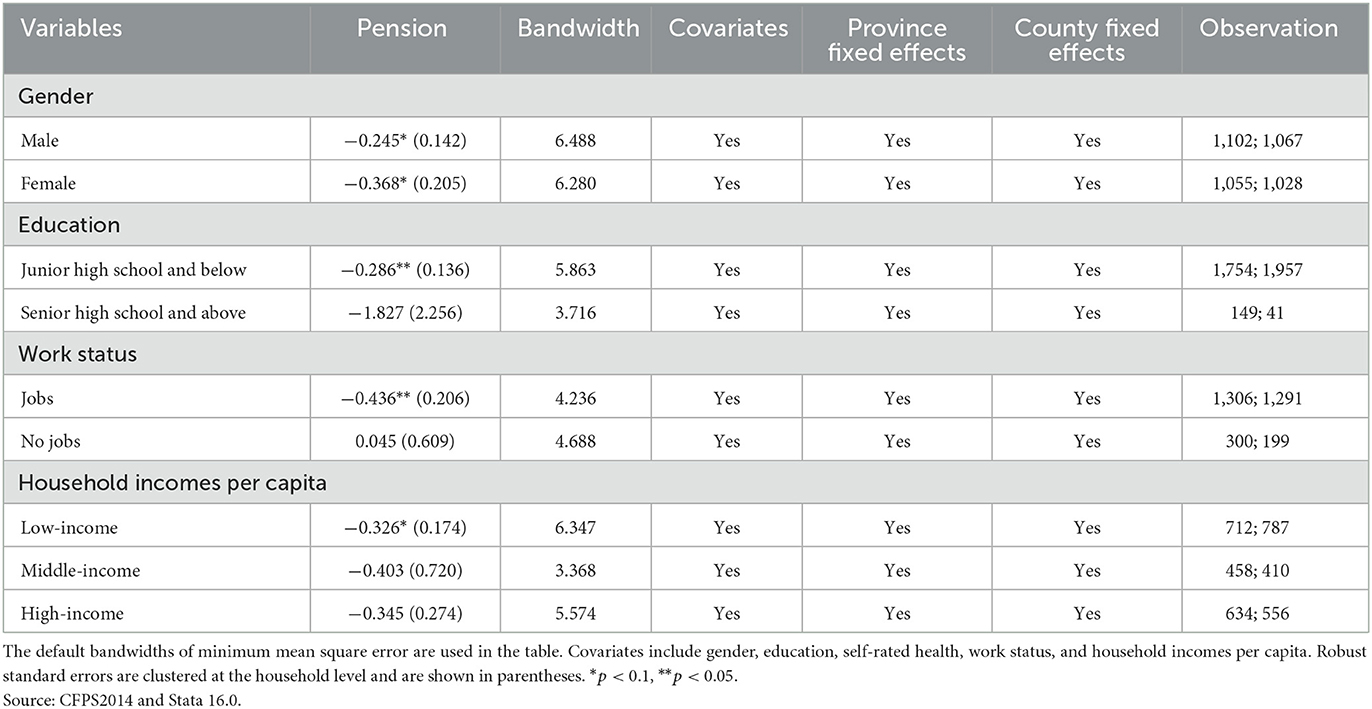
Table 8. Heterogeneous analysis.
From the perspective of gender, the intake of junk food is significantly affected by the NRPS for both males and females. Specifically, the LATE for males and females is respectively −0.245 and −0.368, and both are significant at 0.1 level, which suggests that females are more responsive to the income shock of the NRPS on the intake of junk food.
From the perspective of education, the LATE for those who receive junior high school and below education is −0.286 and significantly at 0.05 level. By contrast, the LATE for those who receive senior high school and above education is not significant. The above results, we think, are in line with our expectations. The reason is that education is generally proportional to income and socioeconomic status. Thus, the lower the education level, the more sensitive it is to the income shock from the NRPS.
From the perspective of work status, the LATE for those without jobs is −0.436 and significantly at 0.05 level. By contrast, the LATE for those who have jobs is not significant. The above results are consistent with our expectations as well. Compared with those who have jobs, those without jobs represent lower income and socioeconomic status to some extent, which leads to them more responsive to the income shock of the NRPS on the intake of junk food.
Income is a significant factor influencing people's consumption of food (61). Generally, households with lower income are more responsive to income shocks, and vice versa (28). To verify this, we divide the total samples into low-, middle-, and high-income groups according to their household incomes per capita by means of quartile. The LATE for the low-income group is −0.436 and significantly at 0.1 level. By contrast, the LATE for the middle- and high-income groups is not significant. Therefore, low-income households are more responsive to the income shock of the NRPS on the intake of junk food, which further confirm our expectations.
With the rapid development of economy and society, people pay more attention to their health, and dietary health is an important part of it. Previous studies have already told us that the improvement of dietary health and nutritional structure not only contributes to sustainable socio-economic development at the macro level (62), but also contributes to the increase of human capital at the micro level (63). Therefore, how to promote dietary health from different aspects has become a key research topic for many scholars. In this section, we will compare the findings of this paper to the existing literature and elaborate on the possible limitations of this paper and the prospects for future study.
To our knowledge, this is the first study to evaluate the effects of the NRPS from the perspective of dietary health. Our FRD results show that the pension shock from the NRPS can significantly reduce the intake of junk food among rural older adults in China. A great number of studies have shown that reducing the intake of junk food can be effective in improving health outcomes (11, 12). Our results are in line with findings for the NRPS showing that the NRPS improves the nutrition intake and health status (26, 41, 43).
Considering the negative correlation between junk food intake and health status, our results are consistent with the role of the pension in health status improvement in different countries. For instance, the social pension in Korea may have benefitted the health of the beneficiaries by improving their nutrition (27). The social pensions in South Africa improve health of older persons (64). Our results provide a potential mechanism and interpretation for them, i.e., improving health by reducing unhealthy food.
Our heterogeneity analysis shows heterogeneous effects of the NRPS on the intake of junk food in terms of gender, education level, work status, and income. Firstly, with regards to gender, our result shows that the effects of the NRPS on females are more pronounced, which is in line with the relevant findings. There are distinct gender differences in dietary patterns in China (65), and females' dietary status are overall poorer than males' (35). In addition, rural females are likely to consume low-nutrition foods due to cognitive limitations and less exposure to knowledge related to healthy and balanced diets, which thus makes them more sensitive to the pension from the NRPS. Secondly, with regards to education level, our result shows that the low-educated are more sensitive to the pension from the NRPS. The possible reason is that education level is related to consumption perception and purchasing power. Specifically, the high-educated attach importance to health and nutrition and tend to purchase healthier foods at higher prices as a result of their higher level of self-health awareness and increased nutrition knowledge (66, 67). By contrast, those with less education are apt to consume unhealthy foods. Thirdly, with regards to work status and income, it is unsurprising that the effects of the NRPS are more significant for the unemployed and low-income. Work is the way to obtain income. Existing studies have shown that income is one of the main factors influencing dietary quality (66, 68–70). Low-income older adults have poor nutrient intake and dietary quality (71). Therefore, work and improved income will undoubtedly make people underline the nutrition of food and their own health, which contributes to better dietary quality. Instead, the unemployed and low-income are likely to consume unhealthy food (72), which thus makes them more responsive to the pension from the NRPS.
Nevertheless, this study has three possible limitations. Firstly, the effects of the NRPS on the past 7 days' diets could only be examined, so we have no way to verify the long-term effects and the mechanism due to data limitations. Secondly, some confounding effects caused by unobservable time-varying factors are possibly inevitable with cross-section data in this paper, though FRD helps to control observable and unobservable factors. Thirdly, the heterogeneity analysis of this study shows that the pension shock from the NRPS is stronger for the relatively vulnerable groups, which thus leads to the results unable to be generalized to the whole population.
Therefore, we expect that future studies will use more comprehensive data to verify the long-term effects and mechanisms of the NRPS. In addition, studies with different perspectives are needed if we are to understand how to improve the dietary quality for the whole population.
Given that there were few studies examining that effects of the pension scheme on diary health, using the pension shock from China's NRPS, we conduct a FRD to address possible endogeneity and examine the causal effect of the NRPS on junk food intake among rural residents by using the data China Family Panel Studies (CFPS) from 2014.
We have two main findings. First, FRD shows that pensions from the NRPS can effectively reduce the intake of junk food among the rural older adults in China. The result remains robust after a series of robustness checks. Therefore, we have reason to believe that increasing the income level of the rural older adults can effectively improve their dietary health. Second, there is heterogeneity in the effects of the NRPS on the intake of junk food. Meanwhile, the results indicate that there is an unreasonable gap in dietary health among different groups of the rural older adults in China as well. Specifically, the mitigating effects is stronger for female, low-educated, unemployed, and low-income groups, which are consistent with the intuition that relatively vulnerable groups tend to more influenced by the NRPS.
We believe these findings can be of interest to policymakers and provide them with some policy insights. Specifically, first, government should endeavor to increase the level of pension benefits to achieve a better improvement of dietary health among the rural older adults. Second, government should take some reasonable measures to reduce dietary health inequalities. For instance, the enrollment rate of the female, low-educated, unemployed, and low-income groups should be improved, which requires more attention from the relevant authorities. In addition, encourage seniors to receive education from senior colleges. Besides, more jobs should be created to achieve re-employment of older adults. Finally, appropriately increase government assistance and subsidies to older adults who are extremely poor.
SP: methodology, validation, resources, and funding acquisition. ZS, JC, and ZL: writing—original draft preparation. ZS: writing—review and editing. ZL: software. All authors have read and agreed to the published version of the manuscript.
This work is supported by Project of Social Science Foundation of Jiangsu Province (Grant No. 21FXD005).
The authors declare that the research was conducted in the absence of any commercial or financial relationships that could be construed as a potential conflict of interest.
All claims expressed in this article are solely those of the authors and do not necessarily represent those of their affiliated organizations, or those of the publisher, the editors and the reviewers. Any product that may be evaluated in this article, or claim that may be made by its manufacturer, is not guaranteed or endorsed by the publisher.
1. ^The UEBEI provides pension security for urban employees in enterprises or administrative institutions. It is also a vital part of China's pension system.
2. ^The reason for intercepting age 75 on the right-hand side of the cutoff at age 75 is that age 75 is symmetric with respect to the cutoff at age 45. Since the FRD is a weighted “local” treatment effect, ultimately only the local sample within the bandwidth is causally inferred. Moreover, the results will be robustly tested for different bandwidths in Section 4.3.2. Therefore, the interception of sample age does not affect the conclusions of this paper. If other age is intercepted on the right-hand side of the cutoff, the results are basically identical.
3. ^Another reference method in nutrition studies is called 24-hour recall method which is applied to studies in nutrition as well (e.g., 50, 51). It is a method to calculate the food intake by inquiring their actual dietary intake of the respondents in the past 24 hours. Due to questionnaire limitations, the 2014 CFPS does not provide information on 24-hour dietary intake, which is why we could only use the 7-day dietary intake in this study.
4. ^In fact, FRD has been widely used to analyze pension schemes in China, such as (38, 41, 43, 52).
5. ^If the breakpoint is set to 60.5 or 60.3, the result remains unchanged.
6. ^Due to the limitation of length and the fact that this method is not the focus of this paper, the result of Logit only serves as a pre-test and is therefore not mentioned in the empirical strategy. In this section, our purpose is to initially observe the difference between the left and right sides of the cutoff, which can also be interpreted as a preliminary test of the effect of NRPS on the intake of junk food using age as a proxy.
1. Fogel RW. Economic growth, population theory, and physiology: the bearing of long-term processes on the making of economic policy. Am Econ Rev. (1994) 84:369–95. doi: 10.3386/w4638
3. Forouhi NG, Unwin N. Global diet and health: Old questions, fresh evidence, and new horizons. Lancet. (2019) 393:1916–8. doi: 10.1016/S0140-6736(19)30500-8
4. Afshin A, Sur PJ, Fay KA, Cornaby L, Ferrara G, Salama JS, et al. Health effects of dietary risks in 195 countries, 1990–2017: a systematic analysis for the Global Burden of Disease Study 2017. Lancet. (2019) 393:1958–72. doi: 10.1016/S0140-6736(19)30041-8
5. Murray CJL, Aravkin AY, Zheng P, Abbafati C, Abbas KM, Abbasi-Kangevari M, et al. Global burden of 87 risk factors in 204 countries and territories, 1990–2019: a systematic analysis for the global burden of disease study 2019. Lancet. (2020) 396:1223–49. doi: 10.1016/S0140-6736(20)30752-2
6. Huang Y, Wang H, Tian X. Changing Diet Quality in China during 2004-2011. Int J Environ Res Public Health. (2016) 14:13. doi: 10.3390/ijerph14010013
7. Xu, X., Hall, J., Byles, J., and Shi, Z. (2015). Assessing dietary quality of older chinese people using the chinese diet balance index (DBI). Plos One. 10:12168. doi: 10.1371/journal.pone.0121618
8. Imamura F, Micha R, Khatibzadeh S, Fahimi S, Shi P, Powles J, et al. Dietary quality among men and women in 187 countries in 1990 and 2010: a systematic assessment. Lancet Glob Health. (2015) 3:e132–42. doi: 10.1016/S2214-109X(14)70381-X
9. Liu X, Sun S. Public health, rational addiction and government intervention. China Econ Q. (2012) 11:349–66.
10. Ni G, Zheng F. Health hierarchy: the study on the cause of “diseases of affluence” in the context of ubiquitous obesity. China Soft Sci. (2014) 10:71–82.
11. Robinson E, Harris E, Thomas J. Reducing high calorie snack food in young adults: a role for social norms and health based messages. Int J Behav Nutr Phys Act. (2013) 10:73. doi: 10.1186/1479-5868-10-73
12. Elizabeth L, Machado P, Zinöcker M, Baker P, Lawrence M. Ultra-processed foods and health outcomes: a narrative review. Nutrients. (2020) 12:1955. doi: 10.3390/nu12071955
13. Wang D, Piernas C, Du S, Zhang B, Popkin BM. Association between cardiometabolic risk factors and dietary nutrient intakes in Chinese school-aged children: a cross-sectional study. Lancet-CAMS Health Summ Abstr Booklet. (2015) 386:S65. doi: 10.1016/S0140-6736(15)00646-7
14. Wang Z, Zhai F, Wang H, Zhang J, Du W, Su C, et al. Influence of household income level on food consumption in Chinese population. Food and Nutri China. (2015) 21:46–9.
15. Arjmand G, Shahraki M, Rahati S, Shahraki T. Food patterns, lifestyle, and hypertension Zahedan. J Res Med Sci. (2016) 16:7547. doi: 10.17795/zjrms-7547
16. Sai-Chuen HS, Pui-Sze HG, Jie XY, Dalby AR. Association between physical activity knowledge and levels of physical activity in Chinese adults with type 2 diabetes. Plos One. (2014) 9:12. doi: 10.1371/journal.pone.0115098
17. Olinto MTA, Gigante DP, Horta B, Silveira V, Oliveira I, Willett W. Major dietary patterns and cardiovascular risk factors among young Brazilian adults. Eur J Nutr. (2011) 51:281–91. doi: 10.1007/s00394-011-0213-4
18. Currie J, DellaVigna S, Moretti E, Pathania V. The effect of fast food restaurants on obesity and weight gain. Am Econ J Econ Policy. (2010) 2:32–63. doi: 10.1257/pol.2.3.32
19. Cutler D, Glaeser E, Shapiro J. Why have Americans become more obese? J Econ Perspect. (2003) 17:93–118. doi: 10.1257/089533003769204371
20. Chen J. New advances of diet nutrition and cancer prevention. Acta Nutrimenta Sinica. (2004) 26:81–4.
21. Chen Z, Shu XO, Yang G, Li H, Li Q, Gao Y-T, et al. Nutrient intake among Chinese women living in Shanghai, China. Br J Nutri. (2006) 96:393–9. doi: 10.1079/BJN20061829
22. Zhai F, Wang H, Du S, He Y, Wang Z, Ge K, et al. Lifespan nutrition and changing socio-economic conditions in China. Asia Pac J Clin Nutr. (2007) 16 Suppl 1:374–82.
23. Zheng Z, Gao Y, Zhao Y. Impact of income growth on food consumption patterns in urban China. China Econ Q. (2016) 15:263–88. doi: 10.13821/j.cnki.ceq.2015.04.12
24. Yu X, Abler D. The demand for food quality in rural China. Am J Agric Econ. (2009) 91:57–69. doi: 10.1111/j.1467-8276.2008.01159.x
25. Li L, Bai J, Zhang C. Impacts of income on the dietary health of Chinese rural residents from the perspective of poverty-line: based on the china nutrition and health survey data. Res Agricult Modernizat. (2020) 41:93–103.
26. Huang W, Zhang C. The power of social pensions: evidence from China's new rural pension scheme. Am Econ J Appl Econ. (2021) 13:179–205. doi: 10.1257/app.20170789
27. Hwang I, Lee TJ. Health improvements of older adults based on benefit duration: lessons from Korean social pension policies. Soc Sci Med. (2022) 315. doi: 10.1016/j.socscimed.2022.115514
28. Ma S, Gan L, Gao X. Analysis of the impact of income shocks on household nutritional structure—natural empirical evidence from higher education reform. J Manage World. (2009) 5:47–55. doi: 10.19744/j.cnki.11-1235/f.2009.05.007
29. Li Y. Income uncertainty and nutrient intakes in rural china. South China J Econ. (2012) 10, 200-213+227.
30. Zhang Q, Ling Z, Lu G, Chen D, Lin Y, Wei L. The dietary pattern and the influence factors study in Zhuhai. Chinese J Soc Med. (2015) 32:454–6.
31. He Y, Zhai F. Relative factors effecting dietary quality of Chinese adults. J Hygiene Res. (2005) 35:611–2.
32. Xiao H, Wang Z. Analysis of dietary quality status and influencing factors of rural households in poor areas in China. Chinese Rural Econ. (2008) 2, 60-65+75.
33. Gao J, Guo H, Lin H, Gao X. Dietary patterns of middle-aged and elderly people in shanghai community and influencing factors. Food Nutri China. (2013) 19:72–6.
34. Hong X, Li J, Wang Z, Liang Y, Yang H, Xu F. Study on dietary patterns and their influencing factors among urban residents in Nanjing City. Chinese J Dis Control Prevent. (2015) 19:54–7. doi: 10.16462/j.cnki.zhjbkz.2015.01.009
35. Liu R, Mi B, Zhao Y, Li Q, Wang X, Chen C, et al. Dietary patterns and relative factors among rural women in Hanzhong of Shaanxi Province. J Xi an Jiaotong Univ. (2019) 40:149-152+166.
36. Haddad LJ, Bouis HE. The impact of nutritional-status on agricultural productivity-wage evidence from the philippines. Oxford Bull Econ Statistics. (1991) 53:45–68. doi: 10.1111/j.1468-0084.1991.mp53001004.x
38. Cheng L, Zhang Y, Liu Z. Does the new rural pension scheme remold the eldercare patterns in rural china? Econ Res J. (2013) 48:42–54.
39. Deng L, Tang D, Yu C. An empirical study on the effects of health human capital on the rural residents' non-agricultural employment income. Population J. (2018) 40:102–12. doi: 10.16405/j.cnki.1004-129X.2018.01.009
40. Chen H, Zeng Y. Who benefits more from the new rural society endowment insurance program in China: elderly or their adult children? Econ Res J. (2013) 48:55–67+160.
41. Cheng L, Liu H, Zhang Y, Zhao Z. The health implications of social pensions: evidence from China's new rural pension scheme. J Comparat Econ. (2018) 46:53–77. doi: 10.1016/j.jce.2016.12.002
42. Pan G, Li S, Geng Z, Zhan K. Do social pension schemes promote the mental health of rural middle-aged and old residents? evidence from China. Front Public Health. (2021) 9:710128. doi: 10.3389/fpubh.2021.710128
43. Yuan H, Chen S, Pan G, Zheng L. Social pension scheme and health inequality: Evidence from China's new rural social pension scheme. Front Public Health. (2022) 9:874. doi: 10.3389/fpubh.2021.837431
44. Ma G, Zhou G. The impacts of New Rural Pension Program on household saving: evidence from CFPS. Econ Res J. (2014) 49:116–29.
45. Qin C, Guo J. Analysis of China's new rural society pension system. J Quant Technologic Econ. (2021) 38:21–38. doi: 10.13653/j.cnki.jqte.2021.05.002
46. Decarli A, Franceschi S, Ferraroni M, Gnagnarella P, Parpinel MT, Vecchia CL, et al. Validation of a food-frequency questionnaire to assess dietary intakes in cancer studies in Italy results for specific nutrients. Ann Epidemiol. (1996) 6:110–8. doi: 10.1016/1047-2797(95)00129-8
47. Hilbig A, Freidank N, Kersting M, Wilhelm M, Jürgen W. Estimation of the dietary intake of acrylamide by German infants, children and adolescents as calculated from dietary records and available data on acrylamide levels in food groups. Int J Hyg Environ Health. (2004) 207:463–71. doi: 10.1078/1438-4639-00317
48. Petzke KJ, Boeing H, Metges CC. Choice of dietary protein of vegetarians and omnivores is reflected in their hair protein 13c and 15n abundance. Rapid Communications in Mass Spectrometry Rcm. (2005) 19:1392. doi: 10.1002/rcm.1925
49. Aston LM, Smith JN, Powles JW. Meat intake in Britain in relation to other dietary components and to demographic and risk factor variables: Analyses based on the national diet and nutrition survey of 2000/2001. J Hum Nutri Dietetics. (2013) 26:96–106. doi: 10.1111/j.1365-277X.2012.01278.x
50. Nightingale H, Walsh KJ, Olupot-Olupot P, Engoru C, Ssenyondo T, Nteziyaremye J, et al. Validation of triple pass 24-hour dietary recall in Ugandan children by simultaneous weighed food assessment. BMC Nutri. (2016) 2:56. doi: 10.1186/s40795-016-0092-4
51. Olendzki BC, Ma Y, Culver AL, Ockene IS, Hebert JR. Methodology for adding glycemic index and glycemic load values to 24-hour dietary recall database. Nutrition. (2006) 22:1087–95. doi: 10.1016/j.nut.2006.07.006
52. Zhang C, Chen B. Can “public pension system” substitutes “family mutual insurance”? Econ Res J. (2014) 49:102–15.
53. Angrist J, Imbens G. Identification and estimation of local average treatment effects. Nat Bureau Econ Res. (1995) t0118:118. doi: 10.3386/t0118
54. Calonico S, Cattaneo MD, Titiunik R. Robust non-parametric confidence intervals for regression-discontinuity designs. Econometrica. (2014) 82:2295–326. doi: 10.3982/ECTA11757
55. Calonico S, Cattaneo MD, Farrell MH. Coverage error optimal confidence intervals for local polynomial regression. Bernoulli. (2022) 28:2998–3022. doi: 10.3150/21-BEJ1445
56. Lee DS, Lemieux LT. Regression discontinuity designs in economics. J Econ Lit. (2010) 48:281–355. doi: 10.1257/jel.48.2.281
57. Cook TD. Waiting for life to arrive: a history of the regression-discontinuity design in psychology, statistics and economics. J Econom. (2008) 142:636–54. doi: 10.1016/j.jeconom.2007.05.002
58. Angrist JD, Pischke J. Mostly Harmless Econometrics: An Empiricist's Companion. Princeton, NJ: Princeton University Press (2008).
59. Chen X. Old-age pension and extended families: How is adult children's internal migration affected? Contemp Econ Policy. (2016) 34:646–59. doi: 10.1111/coep.12161
60. Zhang C. Pension income and labor supply of rural elderly population—analysis based on regression-discontinuity design. World Econ Papers. (2015) 06:76–89.
61. Abler D. Demand growth in developing countries. OECD Food, Agriculture and Fisheries Papers (2010).
62. Correa H, Cummins G. Contribution of nutrition to economic growth. Am J Clin Nutr. (1970) 23:560–5. doi: 10.1093/ajcn/23.5.560
63. Fogel RW. The relevance of malthus for the study of mortality today: Long-run influences on health, mortality, labor force participation, and population growth. NBER Historical Working Papers (1994).
64. Herl CR, Kabudula C, Kahn K, Tollman S, Canning D. Pension exposure and health: evidence from a longitudinal study in south Africa. J Econ Aging. (2022) 23:411. doi: 10.1016/j.jeoa.2022.100411
65. Ren Z, Zhao J, Chen J, Jie L, Liu M, et al. The study on the association between dietary pattern and the incidence of hypertension in different genders in Shanxi Province. Chinese J Dis Control Prevent. (2020) 24:754–760. doi: 10.16462/j.cnki.zhjbkz.2020.07.003
66. Hiza HAB, Casavale KO, Guenther PM, Davis CA. Diet quality of americans differs by age, sex, race/ethnicity, income, and education level. J Acad Nutr Diet. (2013) 113:297–306. doi: 10.1016/j.jand.2012.08.011
67. Fu W, Lian W, Yang M, Jiang Y, Yi W, Wang Y, et al. Analysis on dietary patterns and influencing factors among the elderly in Yantai City. J Hygiene Res. (2017) 46:27–31. doi: 10.19813/j.cnki.weishengyanjiu.2017.01.005
68. Ma C, Li Y, Jia J, Yan X. “De gustibus non est disputandum?”: Measurement and decomposition of the inequality of the dietary health between the high-income and low- income classes. J Manage Sci China. 24:50–70.
69. Ma C, Song Z, Zong Q. Urban-rural inequality of opportunity in health care: evidence from China. Int J Environ Res Public Health. (2021) 18:7792. doi: 10.3390/ijerph18157792
70. Gao Y, Zheng Z. Comparison of the effects of different subsidy forms on improving food security of low-income rural households in China. Resour Sci. (2021) 43:1990–2002. doi: 10.18402/resci.2021.10.05
71. Qin Y, Cowan AE, Bailey RL, Jun SY, Eicher-Miller HA. Usual nutrient intake and dietary quality of low-income US older adults. Appl Econ Perspect Policy. (2023) 45:317–35. doi: 10.1002/aepp.13328
Keywords: new rural pension system, dietary health, junk food, income shock, fuzzy regression discontinuity
Citation: Purun S, Sun Z, Cao J and Li Z (2023) Has new rural pension system reduced the intake of junk food among rural older adults? Evidence from China. Front. Public Health 11:1131337. doi: 10.3389/fpubh.2023.1131337
Received: 24 December 2022; Accepted: 21 February 2023;
Published: 13 March 2023.
Edited by:
Piotr Romaniuk, Medical University of Silesia, PolandReviewed by:
Pei Wang, Fudan University, ChinaCopyright © 2023 Purun, Sun, Cao and Li. This is an open-access article distributed under the terms of the Creative Commons Attribution License (CC BY). The use, distribution or reproduction in other forums is permitted, provided the original author(s) and the copyright owner(s) are credited and that the original publication in this journal is cited, in accordance with accepted academic practice. No use, distribution or reproduction is permitted which does not comply with these terms.
*Correspondence: Zhengxiu Sun, c3Vuemhlbmd4aXUxMTMwQDEyNi5jb20=
Disclaimer: All claims expressed in this article are solely those of the authors and do not necessarily represent those of their affiliated organizations, or those of the publisher, the editors and the reviewers. Any product that may be evaluated in this article or claim that may be made by its manufacturer is not guaranteed or endorsed by the publisher.
Research integrity at Frontiers
Learn more about the work of our research integrity team to safeguard the quality of each article we publish.