 Jia Fu
 Yanbo Liu2
 Yuxiong Chen
 Zhongjie Fan
- 1Department of Cardiology, Peking Union Medical College Hospital, Peking Union Medical College, Chinese Academy of Medical Sciences, Beijing, China
- 2Department of International Medical Services, Peking Union Medical College Hospital, Peking Union Medical College, Chinese Academy of Medical Sciences, Beijing, China
- 3Department of Respiratory Medicine, Peking Union Medical College Hospital, Peking Union Medical College, Chinese Academy of Medical Sciences, Beijing, China
- 4Department of Thoracic Surgery, Peking Union Medical College Hospital, Peking Union Medical College, Chinese Academy of Medical Sciences, Beijing, China
Purpose: Acute exacerbation of chronic obstructive pulmonary disease (AECOPD) has the adverse influence on quality of life and creates significant healthcare costs. However, there were sparse studies investigating the correlation between AECOPD hospital admissions and temperature change. Therefore, it is noteworthy to investigate the impact of various temperature differences and recognize the susceptible population. The purpose of this study was to investigate the impact of temperature differences on AECOPD hospital admissions, and to give potentially helpful material for disease preventative efforts.
Methods: The distributed lag non-linear model was adopted to characterize the exposure-response relationship and to assess the impact of temperature difference. The stratified analysis and sensitivity analysis were also conducted to determine the susceptible populations and examine the robustness of the results.
Results: There were 143,318 AECOPD hospital admissions overall during the study period. The AECOPD hospital admissions had significant association with the daily mean temperature difference (DTDmean) such as the extreme-cold temperature difference (1st DTDmean), the ultra-cold temperature difference (5th DTDmean), the ultra-hot temperature difference (95th DTDmean) and the extreme-hot temperature difference (99th DTDmean). Besides, there was the “U-shaped” association between DTDmean and 21 days cumulative relative risk of AECOPD.
Conclusion: The AECOPD hospital admissions was correlated with the DTDmean temperature differences, especially the extreme-cold and extreme-hot temperature difference. Moreover, people older than 65 years were more susceptible to the extreme-hot and extreme-cold temperature difference.
1. Introduction
Chronic obstructive pulmonary disease (COPD) is a general disease characterized by ongoing airflow restriction and respiratory symptoms (1). Globally, COPD is a leading cause of morbidity and mortality (2). Statistics show that COPD is now one of the three leading causes of death worldwide, with 90% of deaths taking place in low- and middle-income nations (3). A thorough investigation found that COPD contributed 2.6% of the world's disability-adjusted life years in 2015 (4). Because of the ongoing exposure to relevant risk factors and an aging population, it is anticipated that the burden of COPD will rise globally in the future decades (5). Acute worsening of the initial respiratory symptoms that necessitates a change in treatment is known as the acute exacerbation of COPD (AECOPD) (6). According to estimates, COPD patients experience 1–4 exacerbations annually (7). AECOPD might hasten the deterioration of lung function (8), which lead to less physical activity and an increased risk of death (9, 10). AECOPD also has significant association with damaged quality of life (11), which are the major culprits of hospitalizations (12). Research has shown that AECOPD is to blame for 10% of all medical hospitalizations (13). In brief, AECOPD can generate huge healthcare burdens.
Previously reported works have demonstrated that ambient temperature have significant association with COPD hospitalization, emergency visits and so forth. For example, a Spanish study found that hospital admissions and mortality for COPD exacerbation were more frequent in autumn and winter (14). A case-crossover study in Taiwan demonstrated the exacerbation rate of COPD on event days increased by 0.8% for every 1°C decrease in air temperature (95% C.I. 1.015–1.138) (15). A study from 2004 to 2011 discovered that during periods of extreme weather, adults over 60 years old had an increased risk of admission for pneumonia and COPD (16). However, the impacts of ambient temperature have received more research attention. Studies on the relationship between AECOPD hospital admissions and temperature changes were scarce, particularly in Beijing, China. Additionally, the indicator of temperature change was relatively 1-fold. Hence, it is important to investigate the impact of various temperature differences and recognize the susceptible population. The purpose of this study was to investigate the impact of temperature differences on AECOPD hospital admissions, and to give potentially helpful material for disease preventative efforts.
2. Materials and methods
2.1. Data gathering
The hospital admissions data of the AECOPD were obtained from the Beijing Municipal Health Commission Information Center and this study was set as the period from January 1, 2013 to December 31, 2016. The data included the anonymous personal information (age, gender, discharge diagnosis, date of birth), hospital admission data (hospitalization date and hospital name), and address information (birthplace and present address). International Classification of Diseases 10th revision was used to define AECOPD (ICD-10: J41-J44). To rule out the effect of the floating population on the study's findings, the Beijing resident population were filtrated according to the address information of patients. The daily hospital admissions of different gender subgroups (male and female), different age subgroups (age <65, age ≥ 65) and total population were calculated by using the IBM SPSS 26 and R (version 4.1.1). The Peking Union Medical College Hospital (PUMCH) Institutional Review Board approved the study's conduct.
The China Meteorological Administration provided the daily meteorological data. It contained both the temperature data [daily maximum temperature (Tmax), mean temperature (Tmean), and minimum temperature (Tmin)], and other meteorological factors [Wind Speed (WS), Relative Humidity (RH), and Air Pressure (AP)]. As for meteorological data, four kinds of temperature differences were calculated respectively to represent the temperature change. It contained overall temperature range (TR, Tmax today minus Tmin today), daily mean temperature difference (DTDmean, Tmean today minus Tmean yesterday), daily maximum temperature difference (DTDmax, Tmax today minus Tmax yesterday), and daily minimum temperature difference (DTDmin, Tmin today minus Tmin yesterday). The level of air pollution was regarded as one of the confounding factors and adjusted in our study because prior research indicated that air pollution had an adverse influence on multiple respiratory disorders (17–19). Our study adjusted the Air Quality Index (AQI), which represented the main effects of the level of air pollution because there were numerous types of air pollutants and the daily major pollutant concentration levels fluctuated. The Beijing Environmental Protection Bureau provided the AQI data for the same period.
The influenza viruses can trigger exacerbations of respiratory diseases (20–22), the public holiday (PH) and day of the week (DOW) might have an influence on the behavioral patterns, so the influenza epidemic (IF), PH, and DOW were also regarded as confounding factors and adjusted in our statistical model. When the positive rate of influenza virus isolation in any given week exceeded 20% of the highest weekly positive rate in the observation season in the north of China, it was de-fined as the influenza endemic according to the method used in prior study (23). The Chinese National Influenza Center provided the influenza data (https://ivdc.chinacdc.cn/cnic/zyzx/lgzb).
2.2. Statistical analysis
Since temperature typically has a lag effect and prior research disclosed that correlation between COPD and temperature was non-linear (24, 25). The distributed lag non-linear model (DLNM) was constructed to concurrently match the effect and lag effect of independent variables (26). The distributed lag non-linear model was adopted to characterize the exposure-response relationship and to assess the impact of meteorological parameters (27). Because hospital admissions for respiratory disorders are small probability events that occur independently, the daily counts of AECOPD admissions were viewed as a quasi-Poisson distribution in this model to control the overdispersion in the number of hospitalizations (28). To eliminate the seasonal and long-term trends in AECOPD admission, the natural cubic spline function for time was applied. To eliminate the effects of other meteorological conditions and air pollution, the natural cubic spline functions for RH, WS, AP, and AQI were also included. As previously stated, the DOW, PH, and IF were also regarded as confounding factors and adjusted in model in the meantime. The main model is shown in detail below:
E(Yt) represent the number of AECOPD hospital admissions on day t. α and β were the model intercept and regression coefficient, respectively. cb meant the cross-basis function and ns indicates the natural cubic spline function. Tmp refer to the temperature difference. Time refers to the time to control the season and long-term trends. WS, AP, RH, and AQI represent the daily mean wind speed, air pressure, relative humidity, and air quality index on day t, respectively. DOW, IF, and PH are the indicator for day of the week, influenza epidemic status and public holiday. df represent the degree of freedom. All statistical analyses were performed using R (version 4.1.1) software, and the two-sided p-value of 0.05 was conducted to assess statistical significance.
The single day lag effect was examined using a 3D map that included lag days (Lag), relative risk (RR), and temperature differences. The maximum lag of 37 days was chosen to fully detect the influence of temperature differences and the probable harvesting effects. The figure of association between the specific percentile temperature difference (1st: extreme-cold temperature difference; 5th: ultra-cold temperature difference; 95th: ultra-hot temperature difference; 99th: extreme-hot temperature difference) and relative risk in various lag days were also charted. The extreme-cold, ultra-cold, ultra-hot and extreme-hot temperature difference means first, fifth, ninety-fifth and ninety-ninth percentile temperature difference. The cumulative relative risk of AECOPD hospital admission (CRR) was set to 21 days to fully detect the influence of temperature differences and avoid excessive accumulation. In addition, the stratified analysis was also conducted to determine the susceptible populations and examine the robustness of the results. In various subgroups, the most moderate temperature difference (MMTD) in the total population was taken as the standard. To assess the reliability of findings and the robustness of statistical model, we also conducted sensitivity analyses. We changed the degrees of freedom to 6 per year for Time and 4 for RH, WS, AP, and AQI, or 8 per year for Time and 5 for RH, WS, AP, and AQI in the statistical model to recalculate the CRR of temperature differences. R (version 4.1.1) was used for all statistical analysis along with the packages of “dlnm” and “mgcv.”
3. Results
3.1. Descriptive analysis
Tables 1, 2 summarized daily hospital admissions of AECOPD and meteorological data. The total population and subgroups' daily hospital admissions for AECOPD were shown in Table 1. There were 143,318 AECOPD hospital admissions overall between January 1, 2013, and December 31, 2016. While 24,938 of them were under 65 and 95,555 of them were men. There were 523 days of the influenza epidemic and 462 days of public holidays throughout the research period. The meteorological information is displayed in Table 2. The average values of Tmax, Tmean, Tmin, WS, RH, and AP were 18.95, 12.88°C, and 7.13°C, 9.29 m/s, 53.43% and 1,016.56 hPa respectively during the period of study. The average value of temperature range was 11.82°C and the average value of daily maximum/ mean/minimum temperature differences were all 0°C.
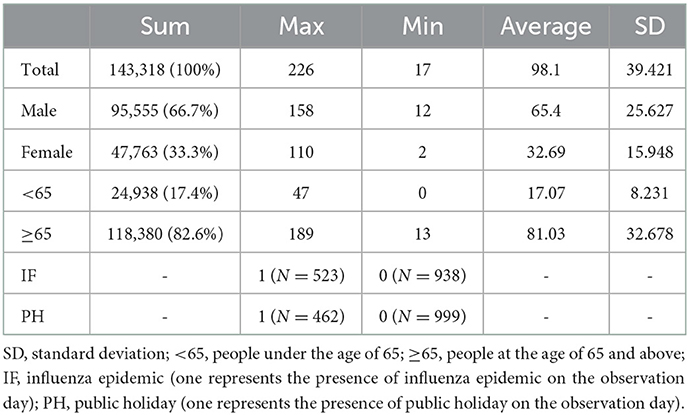
Table 1. AECOPD daily hospital admissions of the total population and subgroups in Beijing from January 1, 2013 to December 31, 2016.
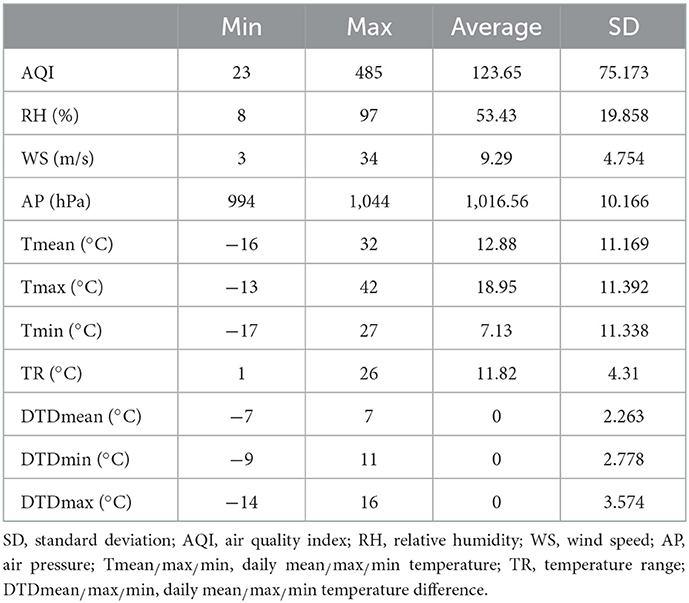
Table 2. Baseline information for different temperatures and meteorological data from January 1, 2013 to December 31, 2016.
3.2. Single day relative risk
Figure 1 depicted the overall trend of the association among the DTDmean, lag days and the relative risk of AECOPD hospital admissions. In general, the RR became larger and larger with the increase of the absolute value of DTDmean in the mid-term of lag days.
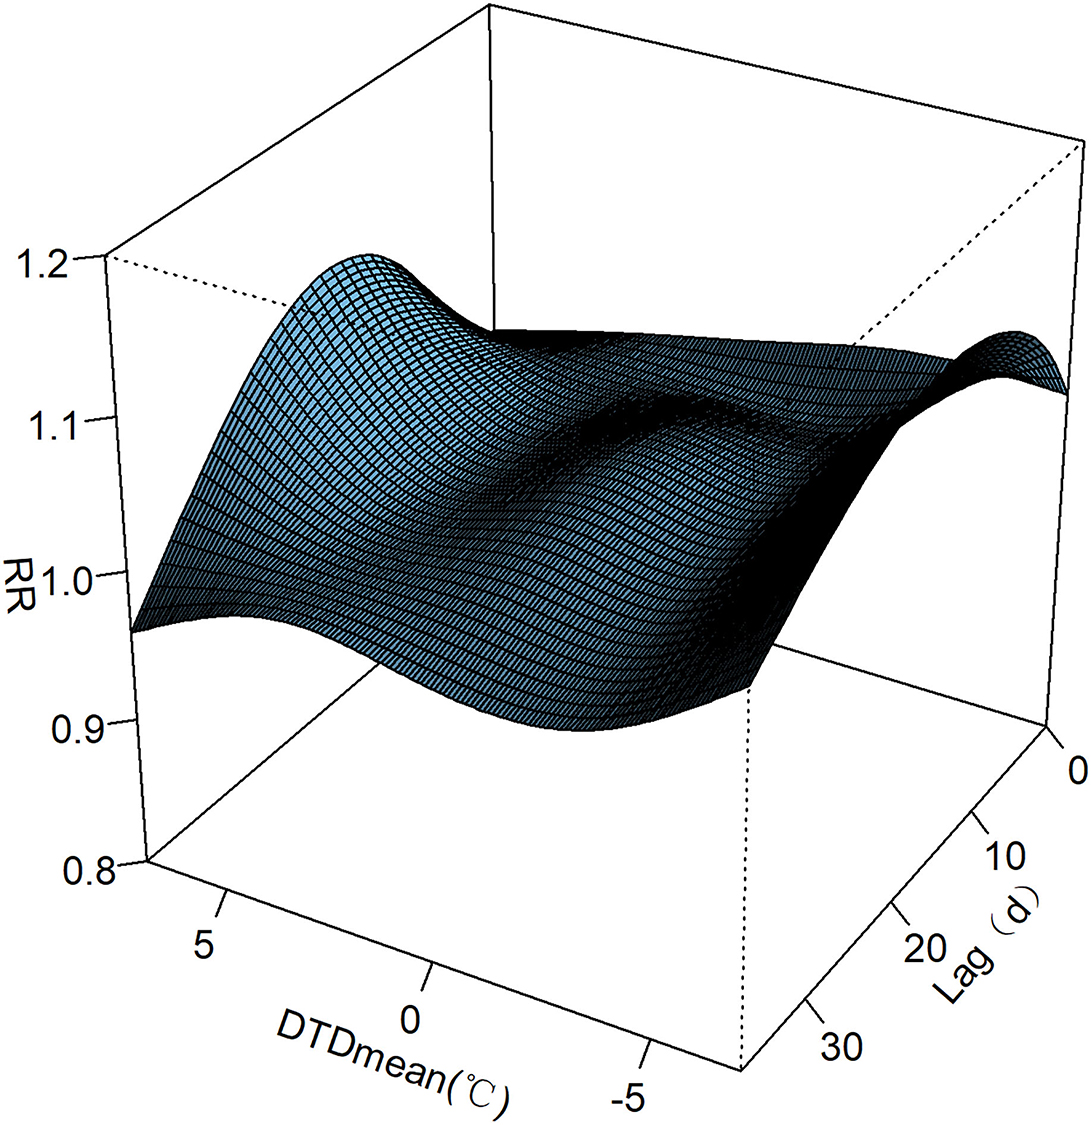
Figure 1. Association among the DTDmean, lag days and the relative risk of AECOPD hospital admissions in Beijing.
Figure 2 depicted the result that the AECOPD hospital admissions had significant association with the extreme-cold temperature difference (1st DTDmean), the ultra-cold temperature difference (5th DTDmean), the ultra-hot temperature difference (95th DTDmean) and the extreme-hot temperature difference (99th DTDmean). As for the extreme-cold temperature difference, the AECOPD hospital admissions had significant association from lag 1 to lag 36 days and the maximum of RR was in lag 15 days. As for the ultra-cold temperature difference, the AECOPD hospital admissions had significant association from lag 0 to lag 2 days and the maximum of RR was in lag 0 days. As for the ultra-hot temperature difference, the AECOPD hospital admissions had significant association from lag 10 to lag 25 days and the maximum of RR was in lag 17 days. As for the extreme-hot temperature difference, AECOPD hospital admissions had significant association from lag 8 to lag 29 days and the maximum of RR was in lag 17 days.
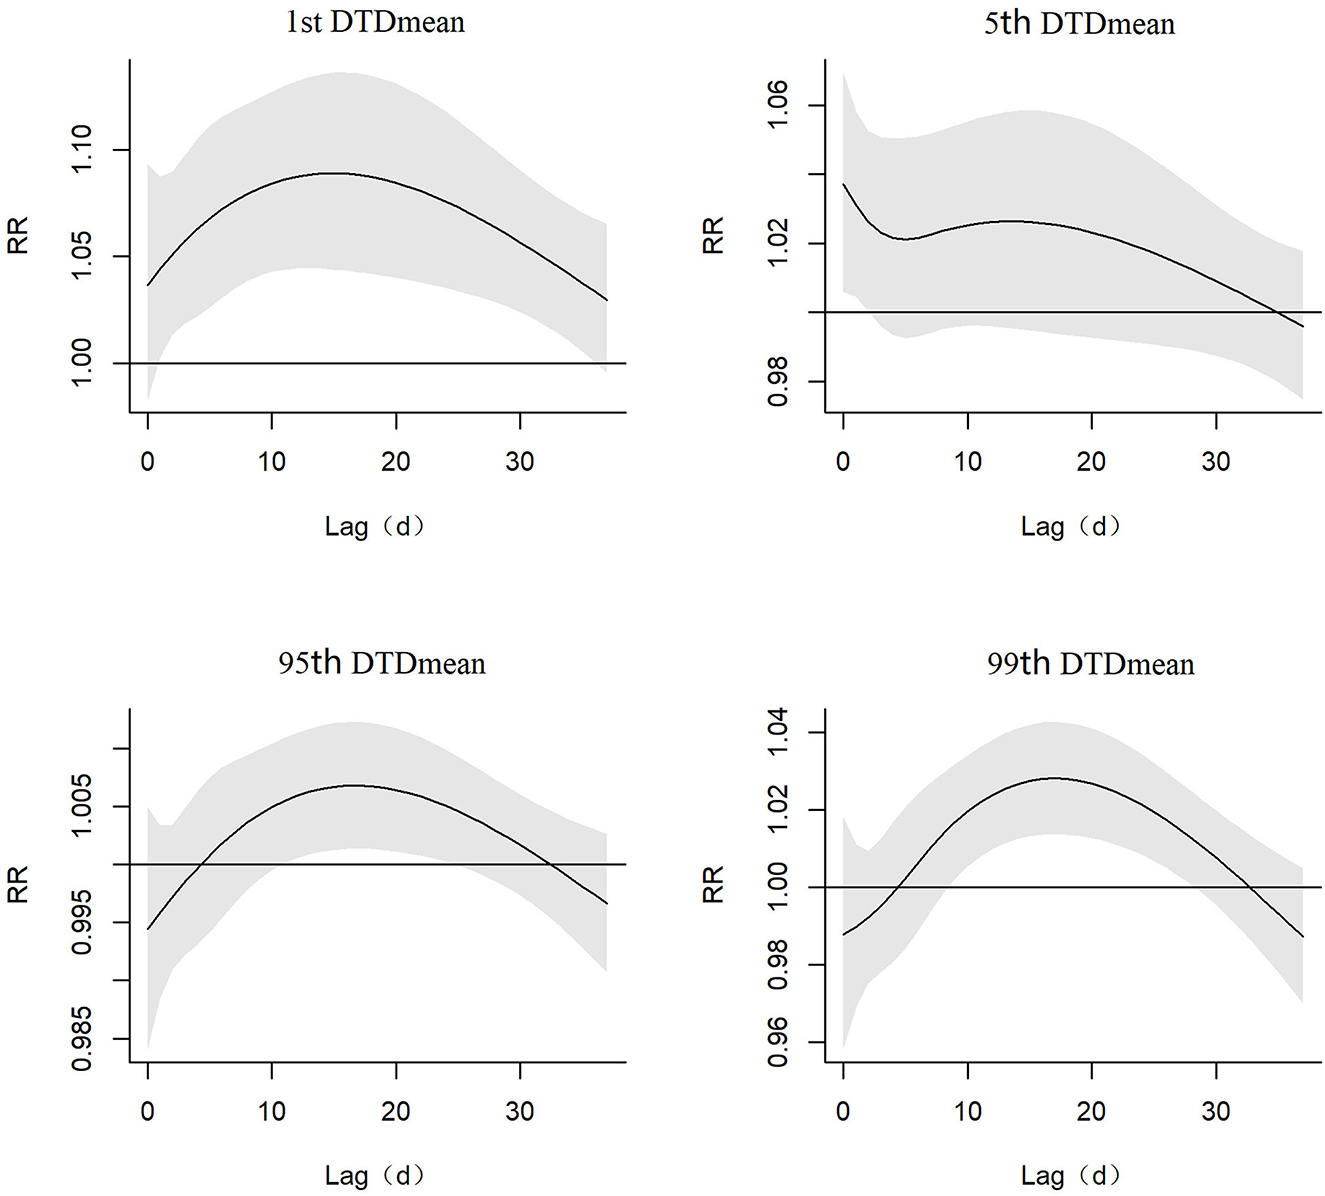
Figure 2. Relative risk (include 95% C.I.) of the extreme-cold, ultra-cold, ultra-hot, and extreme-hot of DTDmean temperature difference in AECOPD hospital admissions in different lag days.
3.3. Cumulated relative risk
Figure 3 showed the U-shaped curve association between the DTDmean and the 21 days CRR (95% C.I.) of AECOPD hospital admissions. From Table 3, we found that the 21 days CRR of AECOPD was significant when it was in the extreme-cold temperature difference (1st DTDmean), the ultra-hot temperature difference (95th DTDmean) and the extreme-hot temperature difference (99th DTDmean). When the DTDmean was −6°C, the 21 days cumulated relative risk was 1.79 (95% C.I. 1.08–2.96) and when the DTDmean was 5°C, the 21 days cumulated relative risk was 1.46 (95% C.I. 1.11–1.93).
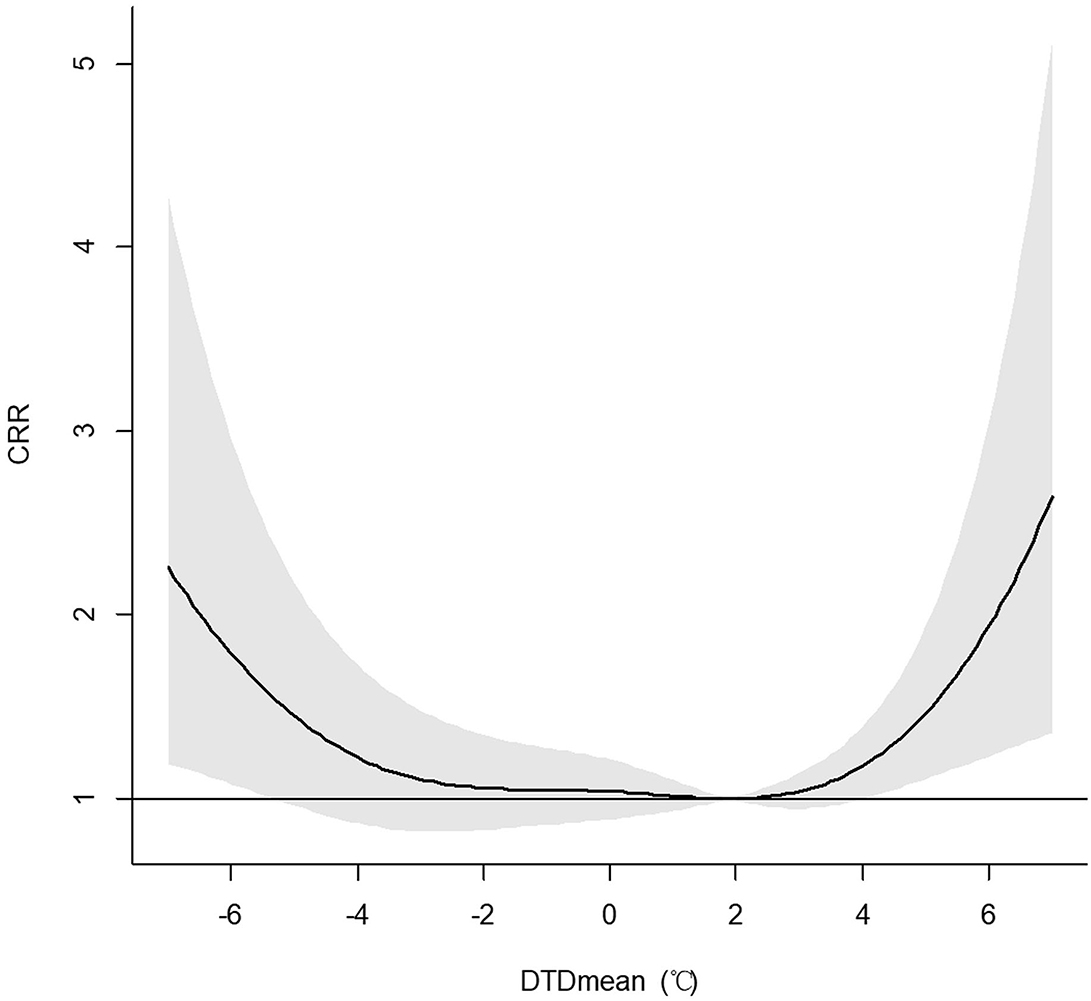
Figure 3. Association between the DTDmean and the 21 days cumulated relative risk (include 95% C.I.) of AECOPD hospital admissions among the total population in Beijing.
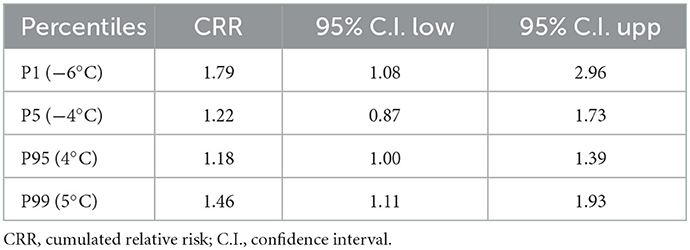
Table 3. The 21 days CRR and 95% C.I. of AECOPD in the total population in Beijing at the different DTDmean percentiles during the period from 2013 to 2016.
3.4. Stratification effect
Figure 4 and Table 4 depicted the results for the association between the DTDmean and the 21 days CRR of AECOPD hospital admissions in different gender groups in Beijing. It showed that the effect of DTDmean was similar in male and female population. For example, when the DTDmean was −6°C (1st DTDmean), the 21 days CRR for male and female subgroups were 1.70 (95% C.I. 0.96–3.00) and 1.89 (95% C.I. 0.91–3.92), respectively.
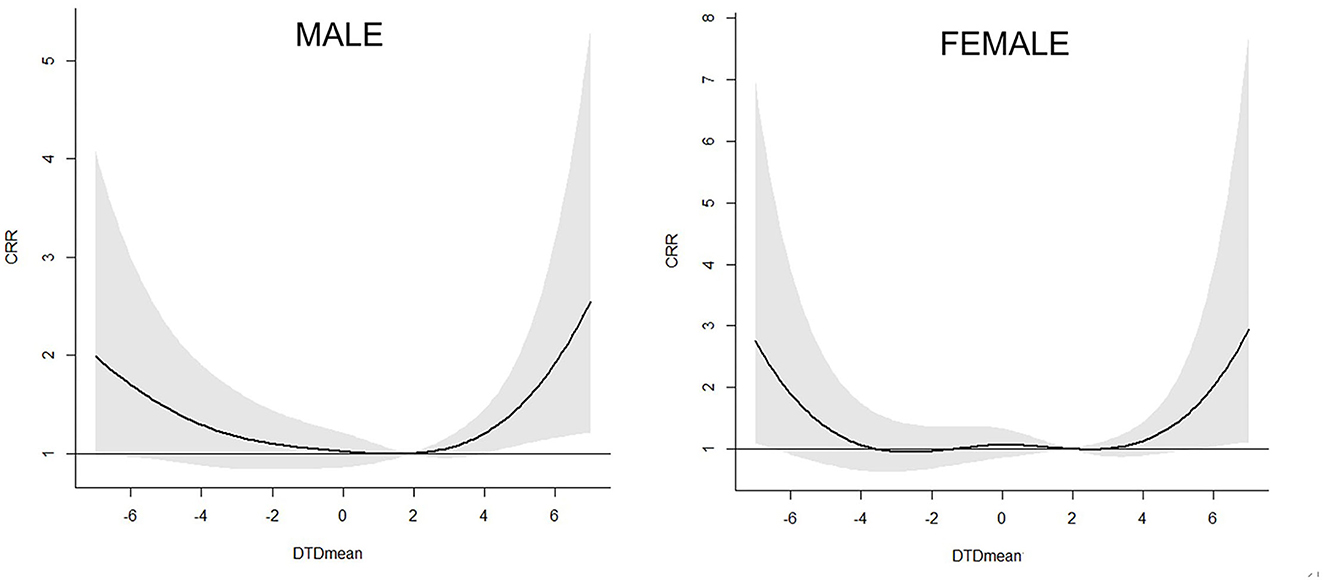
Figure 4. Association between the DTDmean and the 21 days cumulated relative risk (include 95% C.I.) of AECOPD hospital admissions in different gender subgroups in Beijing.
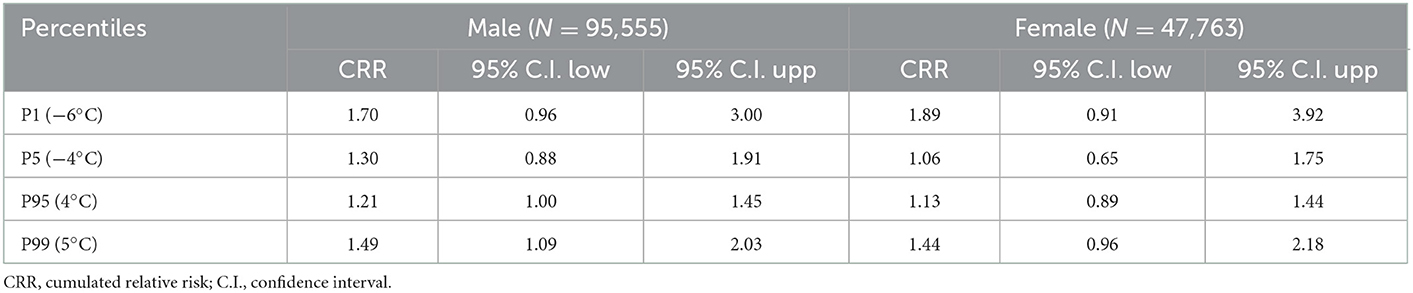
Table 4. The 21 days CRR and 95% C.I. of AECOPD in the different sex groups in Beijing at the different DTDmean percentiles during the period from 2013 to 2016.
Figure 5 and Table 5 depicted the results for the association between the DTDmean and the 21 days CRR of AECOPD hospital admissions among different age groups in Beijing. It showed that people older than 65 years were more susceptible to the extreme-hot and extreme-cold temperature difference. For example, when the DTDmean was −6°C (1st DTDmean), the 21 days CRR for younger and older subgroups were 1.41 (95% C.I. 0.53–3.37) and 1.87 (95% C.I. 1.11–3.14), respectively.
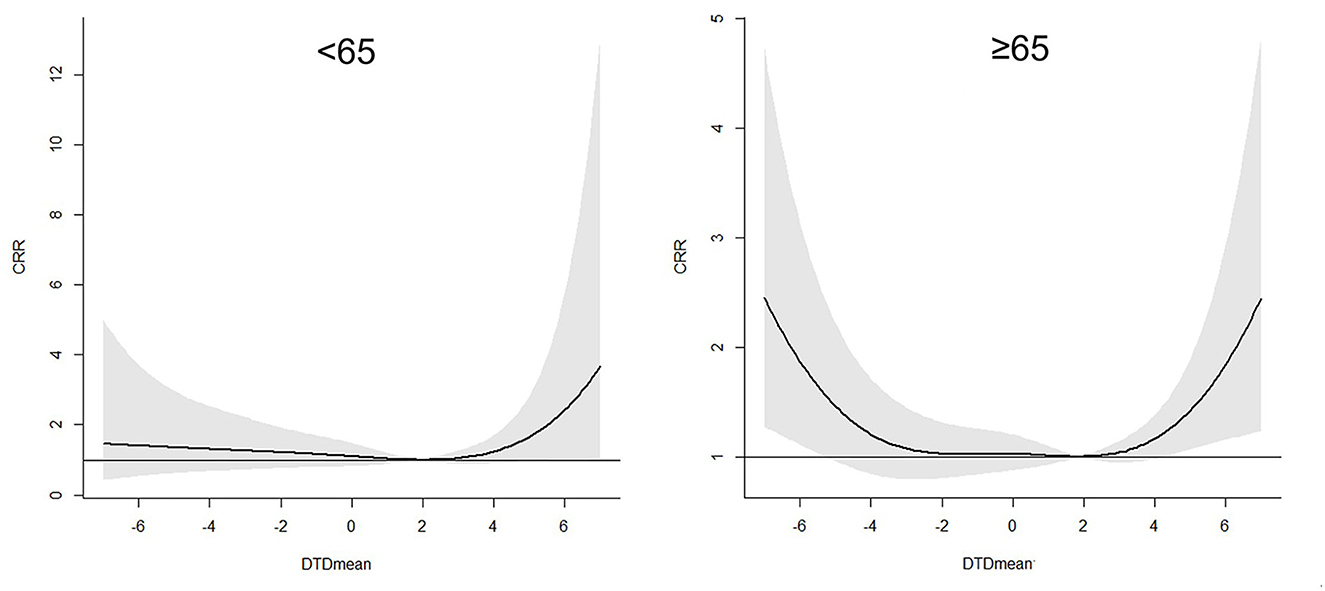
Figure 5. Association between the DTDmean and the 21 days cumulated relative risk (include 95% C.I.) of AECOPD hospital admissions in different age subgroups in Beijing.
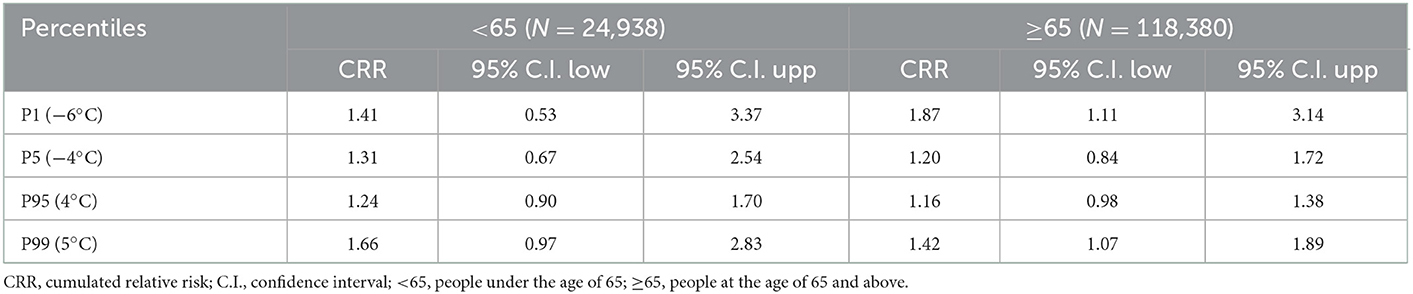
Table 5. The 21 days CRR and 95% C.I. of AECOPD in the different age groups in Beijing at the different DTDmean percentiles during the period from 2013 to 2016.
3.5. Other temperature differences
Additionally, we tried to look for the correlation between other temperature changes and AECOPD hospital admissions. However, most of them had no significance. Check out the Supplementary material for further information.
3.6. Sensitivity analysis
To examine how robust our results were, the degrees of freedom were modified. As shown in Supplementary Figures 7, 8, the results were in line with the original statistical model substantially. It showed that the primary models generated reliable findings.
4. Discussion
Utilizing a distributed lag non-linear model, our study discovered that there were significant correlations between the hospital admissions of AECOPD and the temperature difference. Overall, a large change in temperature could lead to a rise in AECOPD hospital admissions both when temperature raised and declined extremely.
Although different studies have different indicators of temperature change, most of the results were similar from different geological areas. For example, wintertime temperature variability was linked to a higher occurrence of incident respiratory disorders, according to a Chinese cohort of 66,820 older individuals in Hong Kong (≥65 years) with 10–13 years of follow-up. The HR per 1°C change in temperature variability (TV) was 1.20 (1.08–1.32) for all incident respiratory disorders and 1.41 (1.15–1.71) for COPD in wintertime (29). A Taiwan study showed that when the diurnal temperature range exceeded 9.6°C, COPD admissions to the emergency room rose by 14% (30). A Korean study found that daily temperature fluctuation was typically linked to emergency hospitalization for pneumonia, COPD and total respiratory. (31). Extreme temperature changes between adjacent days were linked to increased mortality for diseases like pneumonia, and COPD, according to a nationwide study that adopted mortality data from more than 100 cities in the USA (32). The study across 135 US cities found that the standard deviation of temperature was related to increases in the incidence of COPD mortality in yearly summer from 1985 to 2006 (33).
Several hypotheses can be made with care, even if the precise physiological processes of the temperature change effect on AECOPD are yet not completely understood. People's capacity to adjust to local climates was hampered by temperature variations, which could raise the chance of unfavorable health consequences like respiratory disorders (34, 35). Temperature changes have been proven to alter the physiological changes in the circulatory system, lower the immune system's response to respiratory infections, and create an inflammatory nasal response in people with persistent allergic rhinitis (36–39). All of these may trigger respiratory events. The effect also could be explained by the influence of extreme ambient temperatures in some way. The effects of temperature on the respiratory system were as follows: Patients with COPD may experience bronchoconstriction and inflammation due to the direct impacts of cold air, which became more pronounced as the temperature dropped (40). Cold temperature can also aggravate respiratory diseases by a rise in airway bacterial and viral infections, inflammatory factor infiltration, and mucus secretion that follows (41, 42). Cold temperature can affect mucin secretion through a variety of mechanisms, while abnormal airway mucin secretion can lead to obstruction of mucin clearance, increase the chance of infection, and contribute to the development of COPD (43). While cytokines may be released in response to a heated environment, this could lead to the inflammatory response and respiratory distress (44, 45).
In addition, our findings showed people older than 65 years were more sensitive to the extreme-cold or extreme-hot temperature difference. It was agreed with the results in previous studies. A nationwide study suggested that people over 75 and those with respiratory conditions were shown to be particularly vulnerable to temperature changes between days (32). Aging decreased thermoregulation ability and immune system responses to environmental factors (36, 46).
The study contains some solid points. First, the study collected information of over 143,000 AECOPD hospital admissions between January 1, 2013, and December 31, 2016. And the data covered all secondary and tertiary hospitals in Beijing. Longer study periods and larger sample sizes may yield more trustworthy and precise research findings. Furthermore, this is the first research on the association between temperature differences and hospital admissions for AECOPD in Beijing as far as we are aware. At the same time, we analyzed the various temperature differences to find the better indicators of temperature change. Lastly, a number of confounding variables were taken into account in the research, including the impact of the influenza, AQI, and statutory holiday. There are still some limitations to this study. Our research was limited to Beijing, thus results may not generalize to other locales. Besides, as the lack of individualized exposure data, many potential risk factors that could affect the AECOPD hospital admissions such as complication and medication situation were not included.
5. Conclusion
The AECOPD hospital admissions was correlated with the DTDmean temperature differences, especially the extreme-cold and extreme-hot temperature difference. Moreover, people older than 65 years were more susceptible to the extreme-hot and extreme-cold temperature difference.
Data availability statement
The datasets presented in this article are not readily available because this dataset is now confidential. Requests to access these datasets should be directed to ZmFuemhvbmdqaWVAcHVtY2guY24=.
Ethics statement
The studies involving human participants were reviewed and approved by Peking Union Medical College Hospital (PUMCH) Institutional Review Board. Written informed consent for participation was not required for this study in accordance with the national legislation and the institutional requirements.
Author contributions
The conception and design in the study were contributed by JF, CH, and ZF. The database was organized by YC, JF, and YL. The methodology was provided by ZF. The statistical analysis was done by ZC and YZ. The software was operated by K-FX and CH. The first draft of the manuscript was written by JF. The submitted version of the work was reviewed, revised, and approved by all authors.
Funding
This work was funded by National High Level Hospital Clinical Research Funding (2022-PUMCH-B-030, 2022-PUMCH-A-241, and 2022-PUMCH-C-024).
Conflict of interest
The authors declare that the research was conducted in the absence of any commercial or financial relationships that could be construed as a potential conflict of interest.
Publisher's note
All claims expressed in this article are solely those of the authors and do not necessarily represent those of their affiliated organizations, or those of the publisher, the editors and the reviewers. Any product that may be evaluated in this article, or claim that may be made by its manufacturer, is not guaranteed or endorsed by the publisher.
Supplementary material
The Supplementary Material for this article can be found online at: https://www.frontiersin.org/articles/10.3389/fpubh.2023.1112926/full#supplementary-material
References
1. Singh D, Agusti A, Anzueto A, Barnes PJ, Bourbeau J, Celli BR, et al. Global strategy for the diagnosis, management, and prevention of chronic obstructive lung disease: The GOLD science committee report 2019. Eur Respirat J. (2019) 53:2019. doi: 10.1183/13993003.00164-2019
2. Adeloye D, Song P, Zhu Y, Campbell H, Sheikh A, Rudan I. Global, regional, and national prevalence of, and risk factors for, chronic obstructive pulmonary disease (COPD) in 2019: A systematic review and modelling analysis. Lancet Respir Med. (2022) 2022:7. doi: 10.1016/S2213-2600(21)00511-7
3. Halpin DMG, Celli BR, Criner GJ, Frith P, Varela MV, Lopez Salvi S, et al. The GOLD summit on chronic obstructive pulmonary disease in low- and middle-income countries. Int J Tuberc Lung Dis. (2019) 23:1131–41. doi: 10.5588/ijtld.19.0397
4. GBD. Global, regional, and national deaths, prevalence, disability-adjusted life years, and years lived with disability for chronic obstructive pulmonary disease and asthma, 1990-2015: a systematic analysis for the Global Burden of Disease Study 2015. Lancet Respir Med. (2017) 5:691–706. doi: 10.1016/S2213-2600(17)30293-X
5. Mathers CD, Loncar D. Projections of global mortality and burden of disease from 2002 to 2030. PLoS Med. (2006) 3:e442. doi: 10.1371/journal.pmed.0030442
6. Global Initiative for Chronic Obstructive Lung Disease (GOLD) (2022). Available online at: http://www.goldcopd.org (accessed April 4, 2022).
7. Miravitlles M, Mayordomo C, Artes M, Sanchez-Agudo L, Nicolau F, Segu JL. Treatment of chronic obstructive pulmonary disease and its exacerbations in general practice EOLO Group Estudio Observacional De La Limitacion Obstructiva Al Flujo aEreo. Respir Med. (1999) 93:173–9. doi: 10.1016/S0954-6111(99)90004-5
8. Donaldson GC, Seemungal TA, Bhowmik A, Wedzicha JA. Relationship between exacerbation frequency and lung function decline in chronic obstructive pulmonary disease. Thorax. (2002) 57:847–52. doi: 10.1136/thorax.57.10.847
9. Soler-Cataluna JJ, Martinez-Garcia MA, Sanchez Roman P, Salcedo E, Navarro M, Ochando R. Severe acute exacerbations and mortality in patients with chronic obstructive pulmonary disease. Thorax. (2005) 60:925–31. doi: 10.1136/thx.2005.040527
10. Donaldson GC, Wilkinson TM, Hurst JR, Perera WR, Wedzicha JA. Exacerbations and time spent outdoors in chronic obstructive pulmonary disease. Am J Respir Crit Care Med. (2005) 171:446–52. doi: 10.1164/rccm.200408-1054OC
11. Seemungal TA, Donaldson GC, Paul EA, Bestall JC, Jeffries DJ, Wedzicha JA. Effect of exacerbation on quality of life in patients with chronic obstructive pulmonary disease. Am J Respir Crit Care Med. (1998) 157:1418–22. doi: 10.1164/ajrccm.157.5.9709032
12. Ruiz-Gonzalez A, Saez-Huerta E, Martinez-Alonso M, Bernet-Sanchez A, Porcel JM. A simple scoring system to differentiate bacterial from viral infections in acute exacerbations of COPD requiring hospitalization. Int J Chron Obstruct Pulmon Dis. (2022) 17:773–9. doi: 10.2147/COPD.S356950
13. Soler JJ, Perpiñá M, Sánchez L, Latorre M, Alamar J, Román P. Impacto Asistencial Hospitalario De La EPOC. Peso Específico Del Paciente Con EPOC De Alto Consumo Sanitario. Archivos de Bronconeumología. (2001) 37:375–81. doi: 10.1016/S0300-2896(01)78818-7
14. de Miguel-Diez J, Hernandez-Vazquez J, Lopez-de-Andres A, Alvaro-Meca A, Hernandez-Barrera V, Jimenez-Garcia R. Analysis of environmental risk factors for chronic obstructive pulmonary disease exacerbation: A case-crossover study (2004-2013). PLoS OnE. (2019) 14:e217143. doi: 10.1371/journal.pone.0217143
15. Tseng CM, Chen YT, Ou SM, Hsiao YH, Li SY, Wang SJ, et al. The effect of cold temperature on increased exacerbation of chronic obstructive pulmonary disease: A nationwide study. PLoS ONE. (2013) 8:e57066. doi: 10.1371/journal.pone.0057066
16. Lam HCY, Chan EYY, Goggins BW. Comparison of short-term associations with meteorological variables between COPD and pneumonia hospitalization among the elderly in Hong Kong-A time-series study. Int J Biometeorol. (2018) 18:2. doi: 10.1007/s00484-018-1542-2
17. Sint T, Donohue JF, Ghio AJ. Ambient air pollution particles and the acute exacerbation of chronic obstructive pulmonary disease. Inhal Toxicol. (2008) 20:25–9. doi: 10.1080/08958370701758759
18. Stevanovic I, Jovasevic-Stojanovic M, Stosic JJ. Association between ambient air pollution, meteorological conditions and exacerbations of asthma and chronic obstructive pulmonary disease in adult citizens of the town of Smederevo. Vojnosanitetski Pregled. (2016) 73:152–8. doi: 10.2298/VSP141111026S
19. Kim H, Na G, Park S, Ra SW, Kang SY, Kim HC, et al. The impact of life behavior and environment on particulate matter in chronic obstructive pulmonary disease. Environ Res. (2021) 198:111265. doi: 10.1016/j.envres.2021.111265
20. Kurai D, Saraya T, Ishii H, Takizawa H. Virus-induced exacerbations in asthma and COPD. Front Microbiol. (2013) 4:293. doi: 10.3389/fmicb.2013.00293
21. Jackson DJ, Johnston SL. The role of viruses in acute exacerbations of asthma. J Allergy Clin Immunol. (2010) 125:1178–89. doi: 10.1016/j.jaci.2010.04.021
22. Lee J, Jung HM, Kim SK, Yoo KH, Jung KS, Lee SH, et al. Factors associated with chronic obstructive pulmonary disease exacerbation, based on big data analysis. Sci Rep. (2019) 9:6679. doi: 10.1038/s41598-019-43167-w
23. Cowling BJ, Wong IO, Ho LM, Riley S, Leung GM. Methods for monitoring influenza surveillance data. Int J Epidemiol. (2006) 35:1314–21. doi: 10.1093/ije/dyl162
24. Lu BB, Gu SH, Wang AH, Ge T, Wang Y, Li XH, et al. Study on influence of air temperature on daily chronic obstructive pulmonary disease mortality in Ningbo. Zhonghua Liu Xing Bing Xue Za Zhi. (2017) 38:1528–32. doi: 10.3760/cma.j.issn.0254-6450.2017.11.018
25. Liu L, Breitner S, Pan X, Franck U, Leitte AM, Wiedensohler A, et al. Associations between air temperature and cardio-respiratory mortality in the urban area of Beijing, China: A time-series analysis. Environ Health. (2011) 10:51. doi: 10.1186/1476-069X-10-51
26. Gasparrini A, Armstrong B, Kenward MG. Distributed lag non-linear models. Stat Med. (2010) 29:2224–34. doi: 10.1002/sim.3940
27. Armstrong B. Models for the relationship between ambient temperature and daily mortality. Epidemiology. (2006) 17:624–31. doi: 10.1097/01.ede.0000239732.50999.8f
28. Armstrong BG, Gasparrini A, Tobias A. Conditional poisson models: A flexible alternative to conditional logistic case cross-over analysis. BMC Med Res Methodol. (2014) 14:122. doi: 10.1186/1471-2288-14-122
29. Sun S, Laden F, Hart JE, Qiu H, Wang Y, Wong CM, et al. Seasonal temperature variability and emergency hospital admissions for respiratory diseases: A population-based cohort study. Thorax. (2018) 73:951–8. doi: 10.1136/thoraxjnl-2017-211333
30. Liang WM, Liu WP, Kuo HA. Diurnal temperature range and emergency room admissions for chronic obstructive pulmonary disease in Taiwan. Int J Biometeorol. (2009) 53:17–23. doi: 10.1007/s00484-008-0187-y
31. Lim YH, Hong YC, Kim H. Effects of diurnal temperature range on cardiovascular and respiratory hospital admissions in Korea. Sci Tot Environ. (2012) 417–8:55–60. doi: 10.1016/j.scitotenv.2011.12.048
32. Zhan Z, Zhao Y, Pang S, Zhong X, Wu C, Ding Z. Temperature change between neighboring days and mortality in United States: A nationwide study. Sci Tot Environ. (2017) 584–5:1152–61. doi: 10.1016/j.scitotenv.2017.01.177
33. Zanobetti A, O'Neill MS, Gronlund CJ, Schwartz JD. Summer temperature variability and long-term survival among elderly people with chronic disease. Proc Natl Acad Sci U S A. (2012) 109:6608–13. doi: 10.1073/pnas.1113070109
34. Nielsen B, Hales JR, Strange S, Christensen NJ, Warberg J, Saltin B. Human circulatory and thermoregulatory adaptations with heat acclimation and exercise in a hot, dry environment. J Physiol. (1993) 460:467–85. doi: 10.1113/jphysiol.1993.sp019482
35. Lee M, Nordio F, Zanobetti A, Kinney P, Vautard R, Schwartz J. Acclimatization across space and time in the effects of temperature on mortality: A time-series analysis. Environ Health. (2014) 13:89. doi: 10.1186/1476-069X-13-89
36. Graudenz G, Landgraf R, Jancar S, Tribess A, Fonseca S, Fae K, et al. The role of allergic rhinitis in nasal responses tosudden temperature changes. J Allergy Clin Immunol. (2006) 118:1126–32. doi: 10.1016/j.jaci.2006.07.005
37. Bull GM. The weather and deaths from pneumonia. Lancet. (1980) 1:1405–8. doi: 10.1016/S0140-6736(80)92666-5
38. Schneider A, Schuh A, Maetzel FK, Ruckerl R, Breitner S, Peters A. Weather-induced ischemia and arrhythmia in patients undergoing cardiac rehabilitation: Another difference between men and women. Int J Biometeorol. (2008) 52:535–47. doi: 10.1007/s00484-008-0144-9
39. Carder M, McNamee R, Beverland I, Elton R, Cohen GR, Boyd J, et al. The lagged effect of cold temperature and wind chill on cardiorespiratory mortality in Scotland. Occup Environ Med. (2005) 62:702–10. doi: 10.1136/oem.2004.016394
40. Koskela HO, Koskela AK, Tukiaineu HO. Bronchoconstriction due to cold weather in COPD. The roles of direct airway effects and cutaneous reflex mechanisms. Chest. (1996) 110:632–6. doi: 10.1378/chest.110.3.632
41. Donaldson GC, Seemungal T, Jeffries DJ, Wedzicha JA. Effect of temperature on lung function and symptoms in chronic obstructive pulmonary disease. Eur Respirat J. (1999) 13:844–9. doi: 10.1034/j.1399-3003.1999.13d25.x
42. Larsson K, Tornling G, Gavhed D, Müller-Suur C, Palmberg L. Inhalation of cold air increases the number of inflammatory cells in the lungs in healthy subjects. Eur Respirat J. (1998) 12:825–30. doi: 10.1183/09031936.98.12040825
43. Zhang L, Wu T, Zhang X. Low temperature affects airway mucin secretion and promotes acute exacerbation of chronic obstructive pulmonary disease. Zhonghua Wei Zhong Bing Ji Jiu Yi Xue. (2020) 32:1273–6. doi: 10.3760/cma.j.cn121430-20200612-00465
44. Michelozzi P, Accetta G, De Sario M, D'Ippoliti D, Marino C, Baccini M, et al. High temperature and hospitalizations for cardiovascular and respiratory causes in 12 European Cities. Am J Respir Crit Care Med. (2009) 179:383–9. doi: 10.1164/rccm.200802-217OC
45. Malik AB, Johnson A, Tahamont MV, van der Zee H, Blumenstock FA. Role of blood components in mediating lung vascular injury after pulmonary vascular thrombosis. Chest. (1983) 83(Suppl.):21S–4S. doi: 10.1378/chest.83.5_Supplement.21S
Keywords: AECOPD, temperature change, temperature, temperature difference, distributed lag non-linear model
Citation: Fu J, Liu Y, Zhao Y, Chen Y, Chang Z, Xu K-F, Huang C and Fan Z (2023) Association between the temperature difference and acute exacerbations of chronic obstructive pulmonary disease: A time-series analysis with 143,318 hospital admissions in Beijing, China. Front. Public Health 11:1112926. doi: 10.3389/fpubh.2023.1112926
Received: 30 November 2022; Accepted: 09 January 2023;
Published: 26 January 2023.
Edited by:
Yunquan Zhang, Wuhan University of Science and Technology, ChinaReviewed by:
Giulia Squillacioti, University of Turin, ItalyFeifei Feng, Zhengzhou University, China
Copyright © 2023 Fu, Liu, Zhao, Chen, Chang, Xu, Huang and Fan. This is an open-access article distributed under the terms of the Creative Commons Attribution License (CC BY). The use, distribution or reproduction in other forums is permitted, provided the original author(s) and the copyright owner(s) are credited and that the original publication in this journal is cited, in accordance with accepted academic practice. No use, distribution or reproduction is permitted which does not comply with these terms.
*Correspondence: Zhongjie Fan,  ZmFuemhvbmdqaWVAcHVtY2guY24=; Cheng Huang, ZWVkYzIwMDNAc2luYS5jb20=