 Tung-Ling Chung
 Yi-Hsueh Liu
 Pei-Yu Wu
 Jiun-Chi Huang
 Szu-Chia Chen
95% of researchers rate our articles as excellent or good
Learn more about the work of our research integrity team to safeguard the quality of each article we publish.
Find out more
ORIGINAL RESEARCH article
Front. Public Health , 20 January 2023
Sec. Clinical Diabetes
Volume 11 - 2023 | https://doi.org/10.3389/fpubh.2023.1094471
This article is part of the Research Topic Influence of Lifestyle Factors in the Management of Diabetes Mellitus View all 15 articles
Background: Obesity is a major risk factor for diabetes mellitus (DM), which is in turn a major risk factor for cardiovascular diseases such as coronary artery disease and stroke. As few studies have investigated sex differences in the association between obesity and incidence of DM, the aim of this longitudinal study was to explore this issue in a large group of Taiwanese participants.
Methods: A total of 24,346 participants were enrolled in this study, of whom 8,334 (mean age, 50.6 ± 11.0 years) were male and 16,012 (mean age, 50.5 ± 10.1 years) were female. The following obesity-related indices were studied: body mass index, waist-to-height ratio, waist-to-hip ratio (WHR), body roundness index, conicity index (CI), body adiposity index, abdominal volume index, lipid accumulation product (LAP), and visceral adiposity index (VAI).
Results: The analysis showed significant associations between all of these indices with incidence of DM (all p < 0.001). In the male participants, the strongest predictors for incidence of DM were LAP (AUC = 0.692), WHtR (AUC = 0.684), and WHR (AUC = 0.683). In the female participants, the strongest predictors were LAP (AUC = 0.744), WHtR (AUC = 0.710) and VAI (AUC = 0.710), followed by BRI (AUC = 0.708).
Conclusion: Strong associations were found between the studied obesity-related indices and incidence of DM, and sex differences were found. Hence, to better control DM, reducing body weight may be beneficial in addition to lifestyle modifications, diet control, and pharmacological interventions.
Diabetes is one of the most prevalent metabolic disorders worldwide, and it is associated with severe complications and heavy financial and medical burdens. According to the 10th International Diabetes Federation Diabetes Atlas, the estimated global prevalence of diabetes among individuals aged 20 to 79 years in 2021 was 10.5% (536.6 million people) (1). According to the Taiwan Health Promotion Administration, the prevalence of diabetes mellitus (DM) in Taiwan between 2017 and 2020 was 11.05%, which is higher than the global prevalence (10.5%) (2).
Type 2 DM is the most common type of diabetes, characterized by insulin resistance, decrease in the number of beta cells, and hyperglycemia (3). Type 2 DM complications include cardiovascular diseases and other microvascular diseases affecting the kidneys, retina, and neurological system, leading to poor clinical outcomes (4). DM-related complications may pose a considerable economic burden on society even while having negative effects on society for patients and their families. Moreover, according to the cause of death statistics of 2021 from Taiwan Ministry of Health and Welfare, diabetes is one of Taiwan's top ten causes of death, and the number of deaths is increasing year by year (5). Therefore, it is of great importance to identify the risk factors associated with the development type 2 DM.
Many anthropometric indicators are simple and convenient tools for evaluating central obesity and the risk of metabolic syndrome. Such indicators include waist-to-hip ratio (WHR), waist-to-height ratio (WHtR), lipid accumulation product (LAP), body roundness index (BRI), visceral adiposity index (VAI), abdominal volume index (AVI), conicity index (CI), and body adiposity index (BAI) (6, 7). All of these anthropometric indicators can be calculated using simple clinical measurements such as waist circumference (WC), hip circumference (HC), body mass index (BMI), body height (BH), body weight (BW), triglycerides (TG), and high-density lipoprotein cholesterol (HDL-C). These obesity-related indices can evaluate obesity, which is defined by an excess accumulation of adipose tissue. Previous research has suggested the relationship between obesity with insulin resistance and type 2 diabetes, which is that non-esterified fatty acids secreted from adipose tissue in obese people may lead to insulin resistance and β-cell dysfunction (8). Our recent research revealed that these obesity indices are associated with fatty liver (9), albuminuria and advanced kidney disease (10), lung function (11), osteoporosis (12), hypertension (13), peripheral artery disease (14), and dementia (15). Previous studies have also demonstrated a relationship between obesity-related indices and DM (16–20). Nevertheless, few studies have investigated sex differences in the relationships between obesity-related indices and incidence of DM.
In this population-based cohort study, we enrolled over 26,000 participants from the Taiwan Biobank (TWB) and examined sex differences in the associations between obesity-related indices and incidence of DM. In addition, we determined the cutoff value of each obesity index to predict incidence of DM in men and women.
The population in Taiwan is rapidly aging, and hence the Ministry of Health and Welfare created the TWB to promote health care and prevent chronic diseases. The participants in the TWB are aged from 30 to 70 years and none have a previous diagnosis of cancer. Data available in the TWB include medical, genomic and lifestyle factors (21, 22). Ethical approval for the TWB was given by the Ethics and Governance Council of the TWB and Institutional Review Board on Biomedical Science Research, Academia Sinica, Taiwan.
During enrollment into the TWB, all participants provided data about their age and personal medical history (i.e. hypertension and DM). They also underwent physical examinations to obtain information on WC, HC, BW, BH and BMI. Fasting serum samples were obtained from all of the patients, and laboratory tests were conducted using an auto-analyzer (Roche Diagnostics GmbH, D-68298 Mannheim COBAS Integra 400). Laboratory data were also recorded at baseline after an 8-hour fast including: fasting glucose, glycated hemoglobin A1c (HbA1c), hemoglobin, TGs, total cholesterol, HDL-C, low-density lipoprotein cholesterol (LDL-C), estimated glomerular filtration rate (eGFR) [calculated using the 4-variable Modification of Diet in Renal Disease study equation (23)], and uric acid. Serum levels of creatinine were calculated using the compensated Jaffé (kinetic alkaline picrate) method using a calibrator that could traced in isotope-dilution mass spectrometry (24).
Systolic blood pressure (BP) and diastolic BP measurements were also performed in each participant with an automated BP monitor by a trained staff member. All measurements were made in triplicate after abstaining from smoking, caffeine, and exercise for at least 30 min. We used average BP measurements for analysis. Regular exercise was defined as exercising at least three times a week for at least 30 min each time, which is based on the projected “Physical Fitness 333 Plan,” promoted by the Ministry of Education in Taiwan in 1999 (25). Due to the widespread promotion, people in Taiwan still follow the “Physical Fitness 333 Plan” as a guideline for regular exercise. This study was conducted according to the Declaration of Helsinki, and approved by the Institutional Review Board of Kaohsiung Medical University Hospital [KMUHIRB-E(I)-20210058].
This study is an observational cohort study.
A total of 27,033 participants (males: 9,555; females: 17,478) were screened, of whom had follow-up data for a median of 4 years and signed informed consent forms. Those with no data on WC (n = 1), HC (n = 1), BH (n = 1), and BW (n = 4), those with no follow-up data on DM, serum fasting glucose or HbA1c (n = 43), and those with baseline DM (n = 2,637) were excluded. The remaining 24,346 participants (males: 8,334; females: 16,012) were enrolled (Figure 1).
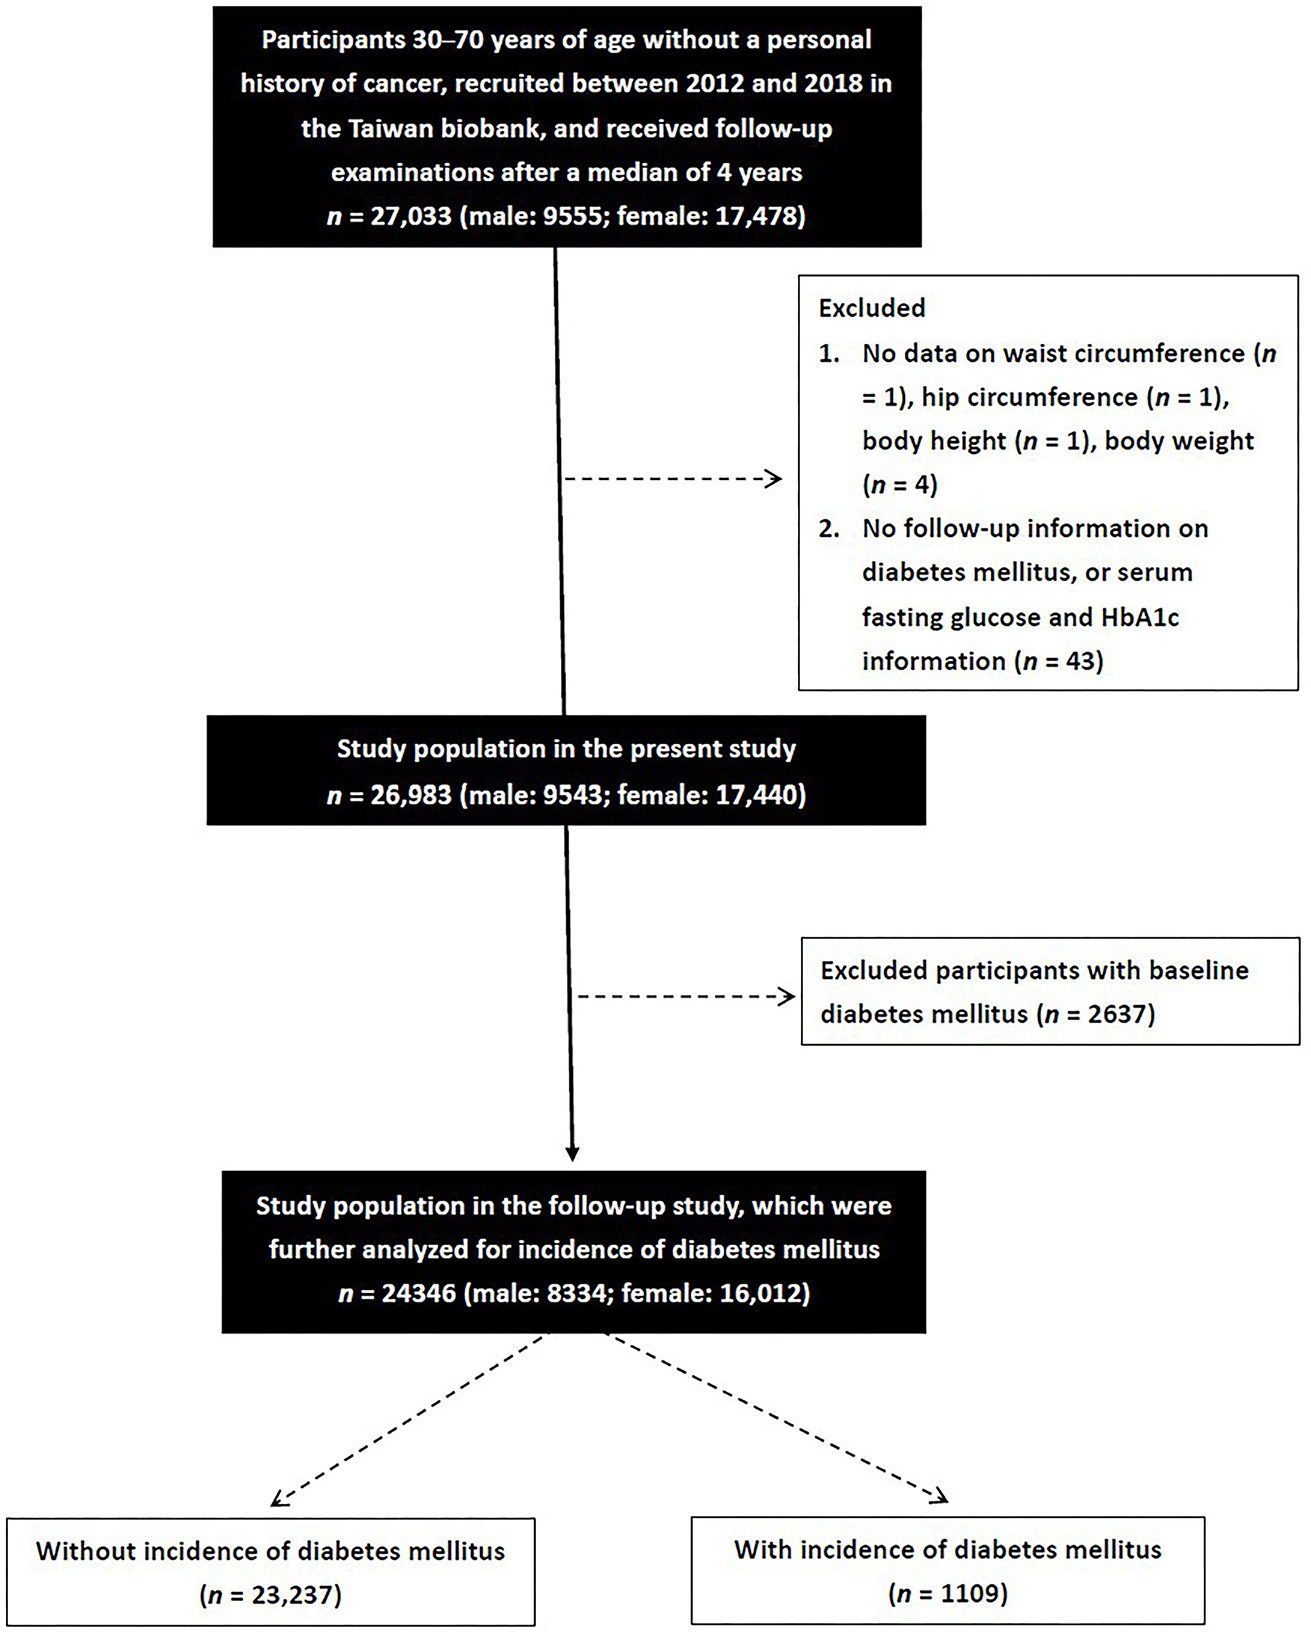
Figure 1. A total of 27,033 participants were screened. After exclusion those without waist circumference, hip circumference, body height, body weight, follow-up data on diabetes mellitus, serum fasting glucose or HbA1c, and those with baseline diabetes mellitus, the remaining 24,346 participants were enrolled.
Participants with an HbA1c level <6.5%, fasting glucose level <126 mg/dL, and no self-reported past history of DM were classified into the non-DM group. The participants in whom DM developed during follow-up, defined as an HbA1c level ≥6.5%, fasting glucose level ≥126 mg/dL (26), or self-reported DM, were classified into the incidence of DM group.
1. BMI was calculated as:
2. WHR was calculated as:
3. WHtR was calculated as:
4. BRI was calculated as:
(27).
5. CI was calculated using the Valdez equation based on BW, BH and WC as:
(28).
6. BAI was calculated according to the method of Bergman and colleagues as:
(29).
7. AVI was calculated as
(30).
8. LAP was calculated as:
(31).
9. VAI score was calculated as described previously (32) using the following sex-specific equations (with TG levels in mmol/l and HDL-cholesterol levels in mmol/l):
SPSS (version 19, IBM Inc., Armonk, NY) was used for all statistical analyses. All continuous variables are expressed as mean ± SD, categorical variables as percentages, or medians (25th-75th percentiles) were used to describe LAP and VAI. Normality tests were done to analyze the distribution of data collected for each group using the Kolmogorov-Smirnov. Homogeneity of variance was tested with the Levene test (Levene's test was used to assess the equality of variances, and an independent sample t-test). With respect to the comparison of data from different groups, the independent t-test was used for normally distributed variables, while the Mann–Whitney U test was used for non-normally distributed variables. Differences in categorical variables were examined by the chi-square test. Multivariable logistic regression analysis was performed to analyze associations between incidence of DM and the obesity-related indices, including all of the significant variables in univariate analysis. The natural logarithm was used for LAP and VAI. Receiver operating characteristic (ROC) curve analysis and areas under the ROC curves (AUCs) were used to assess the performance and predictive ability of the obesity-related indices for incidence of DM, respectively. The Optimal Cutoff Value was found as the cutoff with highest Youden Index, or equivalently, the highest Sensitivity + Specificity. P values < 0.05 were considered to be statistically significant.
The mean age of the 24,346 enrolled patients was 50.5 ± 10.4 years. The prevalence rate of incidence of DM was 5.7% in the males (n = 8,334) and 4.0% in the females (n = 16,012) (p < 0.001).
Compared to the male participants, the female participants had lower prevalence rates of hypertension, smoking and alcohol history, lower values of systolic and diastolic BP, BH, BW, WC, HC, fasting glucose, HbA1c, hemoglobin, TGs, LDL-C and uric acid, and higher total cholesterol, HDL-C and eGFR (Table 1). The values of eight of the nine studied obesity-related indices (BMI, WHR, WHtR, BRI, CI, AVI, LAP, and VAI but not BAI) were lower in the female participants than in the male participants.
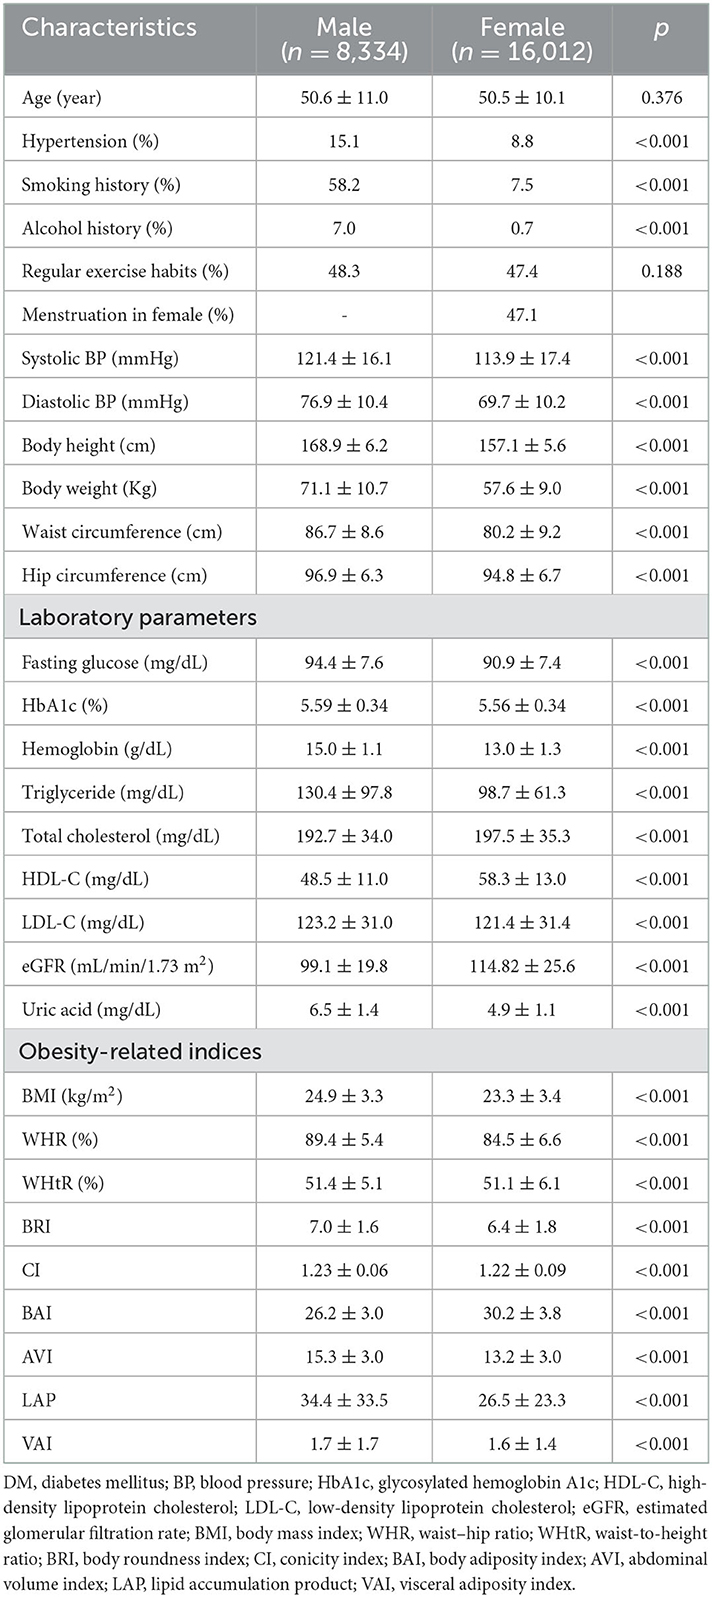
Table 1. Clinical characteristics of the study participants classified by sex.
The male participants with incidence of DM were older and had higher rates of hypertension and a history of smoking and alcohol consumption than those without incidence of DM (Table 2). In addition, the male participants with incidence of hypertension had higher systolic and diastolic BPs, BH, BW, WC, HC, fasting glucose, HbA1c, TGs, total cholesterol, LDL-C and uric acid, and lower HDL-C and eGFR than those without incidence of DM. Moreover, the male participants with incidence of DM had higher values of all nine obesity-related indices than those without incidence of DM.
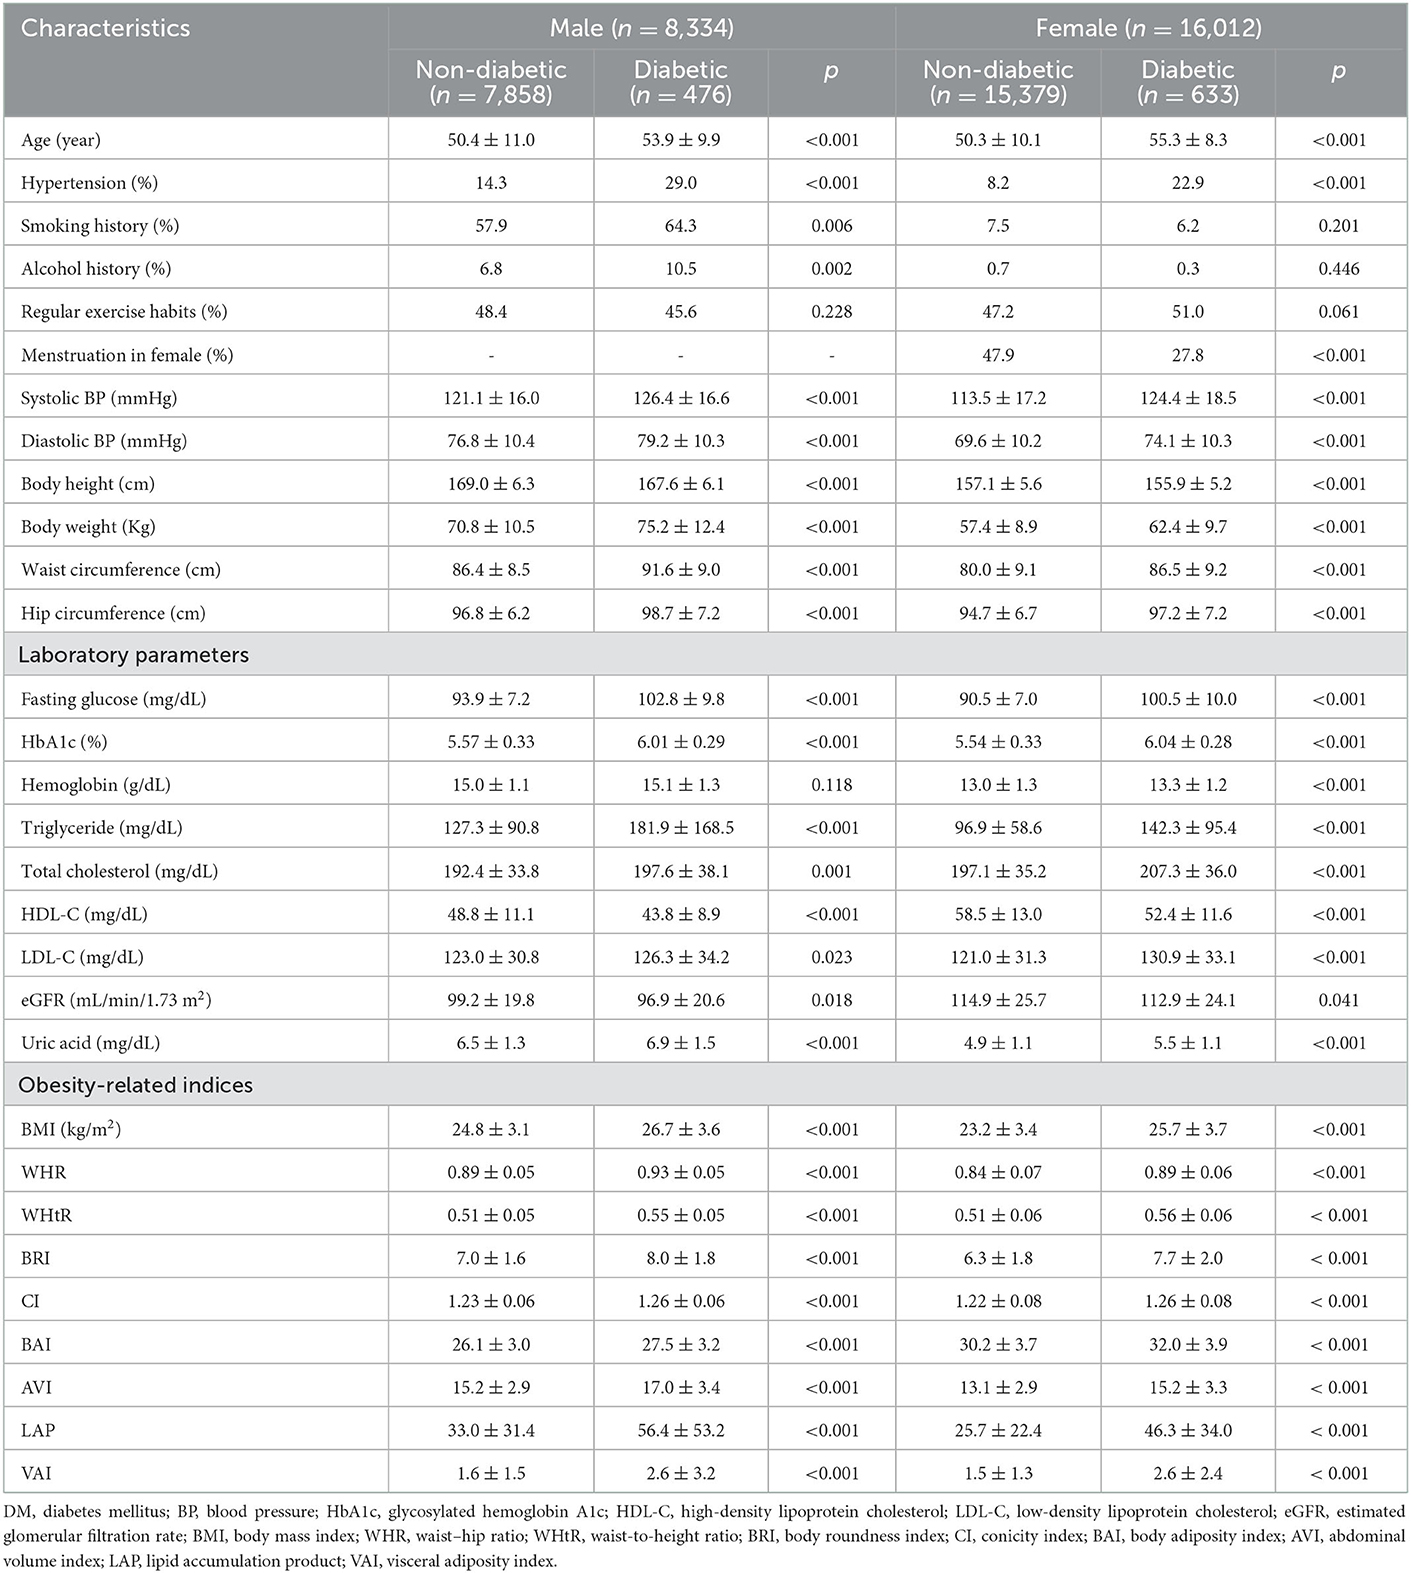
Table 2. Clinical characteristics of the study participants classified by the presence of different sex and incidence of DM.
The female participants with incidence of DM were older, had a higher prevalence rate of hypertension, lower menstruation status, higher systolic and diastolic BPs, BW, WC, HC, fasting glucose, HbA1c, hemoglobin, TGs, total cholesterol, LDL-C and uric acid, and lower BH, HDL-C and eGFR than those without incidence of DM. Moreover, the female participants with incidence of DM had higher values of all studied obesity-related indices than those without incidence of DM.
The following multivariable logistic regression models were used to examine the associations between each obesity-related index with incidence of DM by sex:
1. For WHtR, WHR, CI, BRI, BMI, BAI, and AVI: adjustments for age, hypertension, smoking and alcohol history, systolic and diastolic BPs, hemoglobin, TGs, total cholesterol, HDL-C, LDL-C, eGFR and uric acid in males (significant variables in Table 2); age, hypertension, menstruation status, systolic and diastolic BPs, hemoglobin, TGs, total cholesterol, HDL-C, LDL-C, eGFR and uric acid in females (significant variables in Table 2).
2. For LAP: the same adjustments as in model 1 except for TGs.
3. For VAI: the same adjustments as in model 1 except for TGs and HDL-C.
The results showed that high BMI (per 1 kg/m2; odds ratio [OR] = 1.140), WHR (per 0.01; OR = 1.082), WHtR (per 0.01; OR = 1.088), BRI (per 1; OR = 1.263), CI (per 0.1; OR = 1.425), BAI (per 1; OR = 1.082), AVI (per 1; OR = 1.124), LAP (log per 1; OR = 8.951) and VAI (log per 1; OR = 9.104) were significantly associated with incidence of DM in the male participants (all p < 0.001) (Table 3). Similarly, high BMI (per 1 kg/m2; OR = 1.099), WHR (per 0.01; OR = 1.051), WHtR (per 0.01; OR = 1.056), BRI (per 1; OR = 1.171), CI (per 0.1; OR = 1.233), BAI (per 1; OR = 1.043), AVI (per 1; OR = 1.095), LAP (log per 1; OR = 8.687), and VAI (log per 1; OR = 6.629) were significantly associated with incidence of DM in the female participants (all p < 0.001).
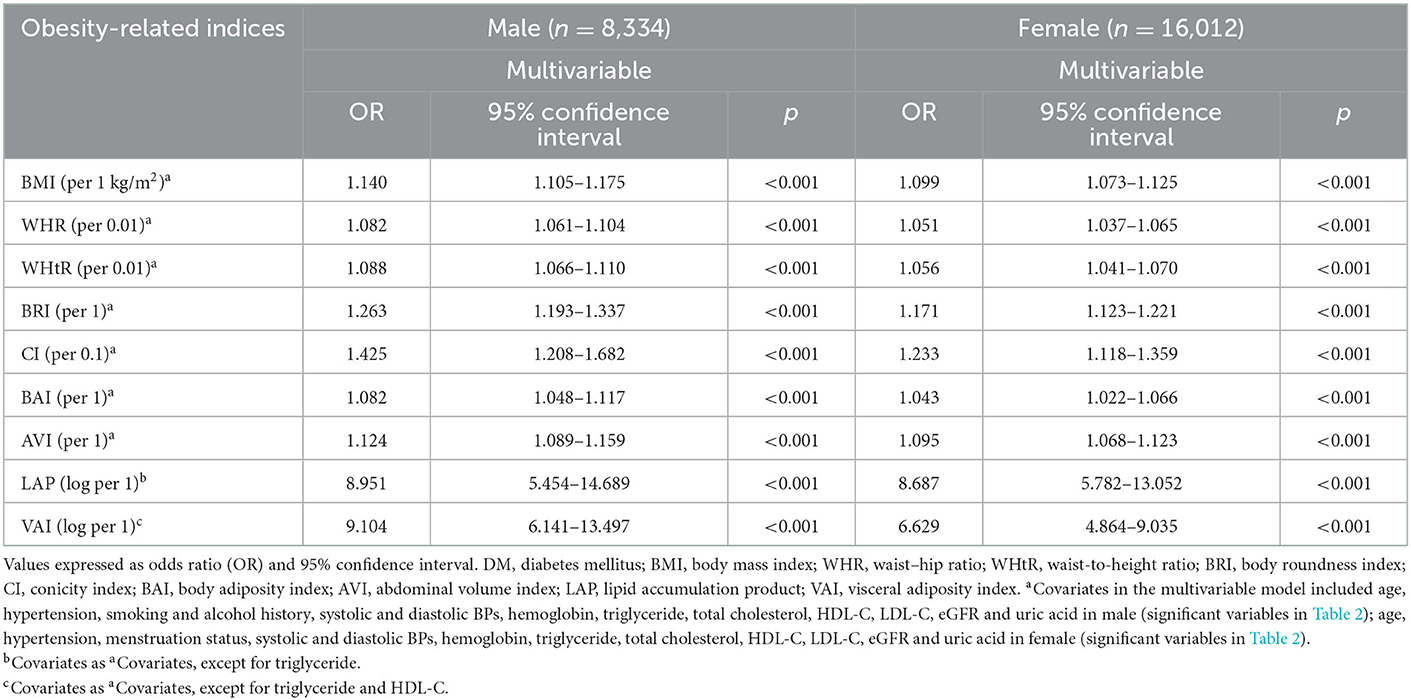
Table 3. Association of obesity-related indices with incidence of DM using multivariable logistic regression analysis.
Significant interactions were found between sex and WHR (β = −0.024; p = 0.022), CI (β = −0.232; p = 0.008), LAP (β = 0.008; p < 0.001), and VAI (β = 0.092; p = 0.001) on incident DM. However, no significant differences were found in the other indices. In the men, WHR and CI were more strongly correlated with incidence of DM than in the women, whereas LAP and VAI were more closely linked with incidence of DM in the women than in the men.
The performance (ROC curves), predictive ability (AUCs) and J value of the obesity-related indices to identify incidence of DM in the male and female participants were analyzed (Figure 2). Table 4 showed that in the male participants, LAP had the highest AUC (0.692), followed by WHtR (0.684), WHR (0.683), BRI (0.677), VAI (0.671), AVI (0.661), BMI (0.660), CI (0.630), and BAI (0.626). In addition, Table 5 showed that in the female participants, LAP also had the highest AUC (0.744), followed by WHtR (0.710), VAI (0.710), BRI (0.708), BMI (0.700), AVI (0.698), WHR (0.693), BAI (0.642), and CI (0.630).
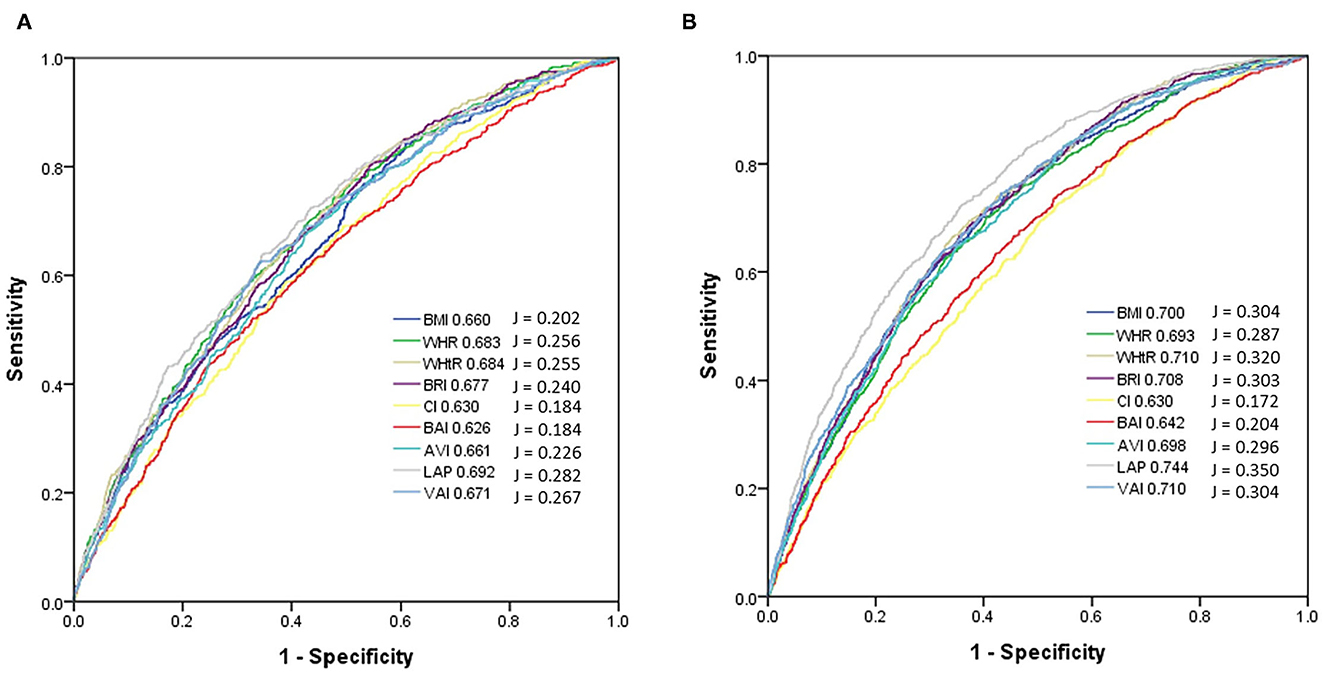
Figure 2. Comparison of the AUC and J values of 9 obesity-related indices for diagnosis of incidence of diabetes mellitus among (A) males and (B) females. In the male participants, LAP had the highest AUC (0.692) and J (0.282), followed by WHtR (AUC = 0.684, J = 0.255), WHR (AUC = 0.683, J = 0.256), BRI (AUC = 0.677, J = 0.240), VAI (AUC = 0.671, J = 0.267), AVI (AUC = 0.661, J = 0.226), BMI (AUC = 0.660, J = 0.202), CI (AUC = 0.630, J = 0.184), and BAI (AUC = 0.626, J = 0.184). In the female participants, LAP also had the highest AUC (0.744) and J (0.350), followed by WHtR (AUC = 0.710, J = 0.320), VAI (AUC = 0.710, J = 0.304), BRI (AUC = 0.708, J = 0.303), BMI (AUC = 0.700, J = 0.304), AVI (AUC = 0.698, J = 0.296), WHR (AUC = 0.693, J = 0.287), BAI (AUC = 0.642, J = 0.204), and CI (AUC = 0.630, J = 0.172).
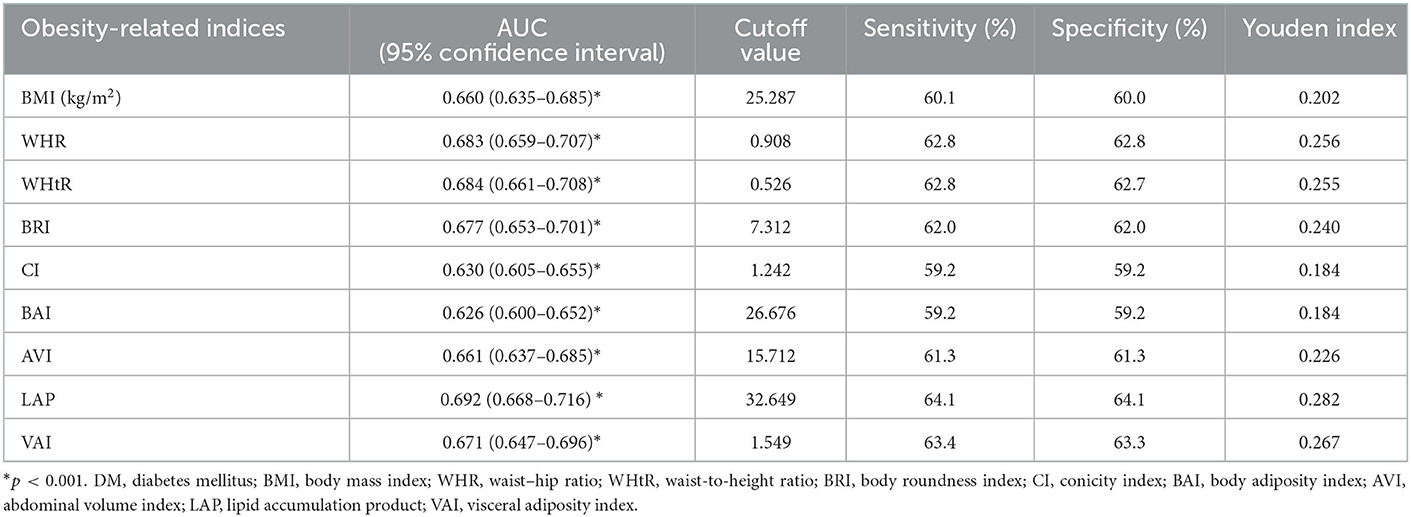
Table 4. Area under curve (AUC), cutoff value, sensitivity, specificity, and Youden index of 9 obesity-related indices for incidence of DM in male participants.
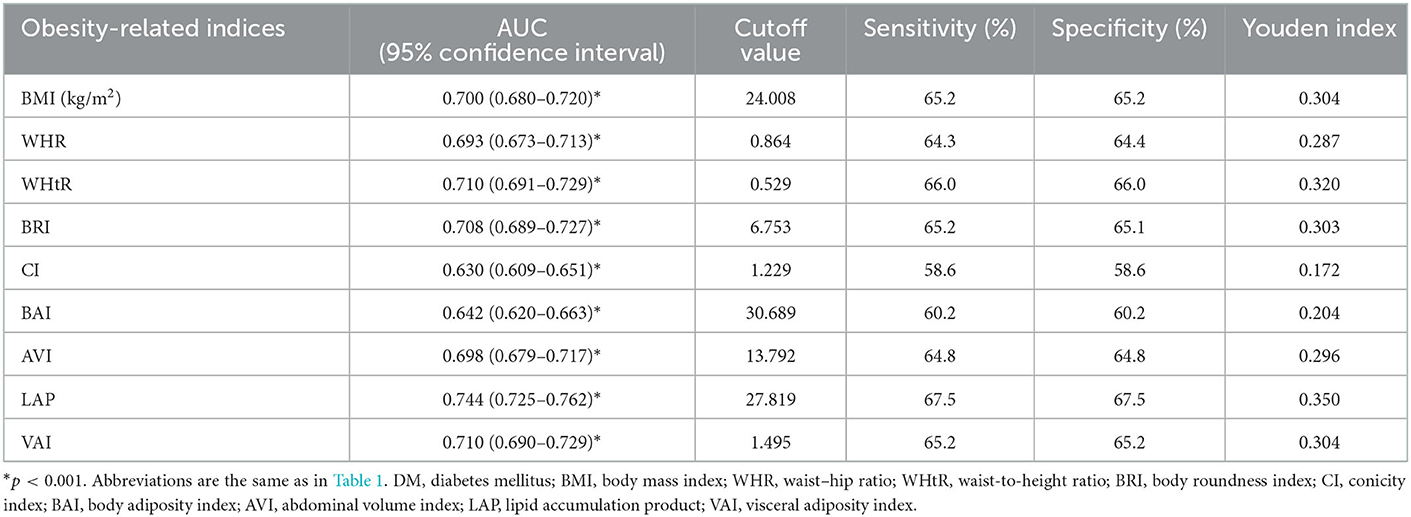
Table 5. Area under curve (AUC), cutoff value, sensitivity, specificity, and Youden index of 9 obesity-related indices for incidence of DM in female participants.
The AUC, cutoff, sensitivity, specificity, and Youden index values of the obesity-related indices to identify incidence of DM in the male and female participants are shown in Tables 4, 5, respectively. In male participants, LAP had the highest Youden index (0.282), followed by VAI (0.267) and WHR (0.256). In addition, in female participants, LAP had the highest Youden index (0.282), followed by WHtR (0.320), BMI (0.304), and VAI (0.256).
In this study, we investigated sex differences in the associations between nine obesity-related indices with incidence of DM after a median 4-year follow-up period. We found that all of the studied obesity indices were associated with incidence of DM in both the male and female participants. Furthermore, there were sex differences in the relationships between some of the obesity indices and incidence of DM. In the men, WHR and CI were more strongly correlated with incidence of DM than in the women, whereas LAP and VAI were more closely linked with incidence of DM in the women than in the men.
Our results demonstrate the predictive ability of obesity-related indices for incidence of DM. In the male participants, the strongest predictors for incidence of DM were LAP, WHtR, and WHR. In the female participants, the strongest predictors were LAP, WHtR, and VAI, followed by BRI. Previous epidemiologic studies have reported an association between central obesity and the incidence of DM (16–18, 33). Many obesity-related indices can be used to assess the degree of central obesity, of which LAP had the highest predictive ability for incidence of DM in both the male and female participants in the present study. In a Japanese study of 10,170 middle-aged individuals, a high LAP was associated with DM, with an OR of 19.09 (95% confidence interval: 6.57–55.50) in women and 7.40 (95% confidence interval: 5.10–10.75) in men (18). A 6-year cohort study conducted by Bozorgmanesh et al. with a total of 5,018 non-diabetic subjects also found that LAP was a strong predictor of incidence of DM in both sexes (34). LAP has two important components, namely WC and serum TG level, which reflect abdominal fat and lipid metabolism (35). Increased visceral fat and serum TG levels were linked with insulin resistance in a Japanese study of metabolically obese subjects with normal weight and glucose tolerance (36). The association between visceral fat and DM could be because adipocytokines are released by visceral fat rather than subcutaneous adipose tissue, and their circulating levels are associated with the development of insulin resistance (36, 37). Growing evidence supports that WHtR has a significant relationship with new-onset DM (38–41), and a meta-analysis found that WHtR had a higher predictive power for the risk of DM than WC and BMI (38). This could be because BMI only measures total BW and cannot discriminate between visceral adipose and skeletal muscle mass (40), while WC does not take tall and short body shapes into account. Other research has revealed an important and independent association between WHR and DM (17, 42, 43). However, the use of WHR is controversial due to its uncertain biologic interpretation, lack of sensitivity to weight gain, and high variability across age, sex, and different populations (17). Many studies have shown that BRI can be used to predict visceral fat (27), metabolic syndrome (44) and DM (19, 45). In a prospective cohort study, BRI and WHtR were shown to have a similar predictive ability for DM in hypertensive patients, possibly because both BRI and WHtR are calculated based on WC and height (46). Another useful predictor of DM is VAI, which was first described by Amato et al. as visceral adipose dysfunction associated with cardiometabolic risk in a healthy population (47). Previous studies have reported that VAI may predict DM (20, 48), and that it is an indicator of adipose tissue dysfunction (49). In addition, other studies have reported a positive correlation between VAI and adipocytokines, and this may explain the pathogenesis of developing insulin resistance (50, 51).
We also found sex differences in the predictive ability of the obesity-related indices for incidence of DM. Previous studies have demonstrated sex differences in fat distribution, and the type of fat deposition has been shown to have a varied effect on cardiometabolic risk (52–54). Many mechanisms, including fat microenvironment, cell-intrinsic features, and sex hormones have been postulated to explain the sex dimorphism in adipose distribution (52). In men, fat deposits are more likely to be centrally distributed or apple-shaped, which is correlated with an increased risk of cardiometabolic disease. In women, fat deposits are prone to peripheral fat distribution or pear-shaped, which may protect against cardiometabolic disease (52, 54). Prior studies have reported sex differences in lipid profiles. Compared to men, premenopausal women have higher levels of serum HDL, and lower levels of LDL, very-low-density lipoprotein and TGs, which may lead to a protective effect against cardiovascular disease by estrogen (55). On the other hand, excess visceral fat has been closely correlated with the impaired inhibition of free fatty acid release in response to insulin, along with hypertriglyceridemia and low HDL-C concentrations (56). Because women have a tendency to accumulate peripheral fat, elevated serum TGs along with reduced HDL-C, but not WC, may be better able to identify visceral adipocyte expansion in women. LAP is proportional to TG concentration and VAI is dependent on TG and HDL-C levels. Both can indicate the presence of extra lipid fuel and ectopic fat deposits, which increase the risk of metabolic disease. Our results suggest that abnormal lipid metabolism increases the risk of developing DM in women. In summary, this study suggested WHR and CI are more specific to men for predicting the development of type 2 DM, while LAP and VAI are more specific to women.
The strengths of this study include the large population-based investigation and follow-up of sex differences in the associations between nine obesity-related indices and incidence of DM. However, there were also some limitations. First, data on medications and other factors which could affect the findings of incidence of DM such as anti-diabetics, anti-hypertensives, lipid-lowering agents and proteinuria are not recorded in the TWB. This may have led to underestimation of the association between incidence of DM and the obesity-related indices. Second, this study was conducted in Taiwan with participants of Chinese ethnicity, and this may limit the generalizability of our findings. Third, as only approximately 25% of the enrollees in the TWB undergo follow-up evaluations, sample bias is possible.
In conclusion, we found that all nine studied obesity-related indices were significant predictors of incidence of DM, and we also found differences in the associations between the male and female participants. Hence, to better control DM, reducing body weight may be beneficial in addition to lifestyle modifications, diet control, and pharmacological interventions.
The raw data supporting the conclusions of this article will be made available by the authors, without undue reservation.
The studies involving human participants were reviewed and approved by Institutional Review Board of Kaohsiung Medical University Hospital [KMUHIRB-E(I)-20210058]. The patients/participants provided their written informed consent to participate in this study.
Conceptualization, methodology, validation, formal analysis, writing—review and editing, supervision, software, investigation, resources, project administration, funding acquisition, and visualization: S-CC. Data curation: T-LC, Y-HL, P-YW, J-CH, and S-CC. Writing—original draft preparation: T-LC and S-CC. All authors have read and agreed to the published version of the manuscript.
This work was supported partially by the Research Center for Precision Environmental Medicine, Kaohsiung Medical University, Kaohsiung, Taiwan from the Featured Areas Research Center Program within the framework of the Higher Education Sprout Project by the Ministry of Education (MOE) in Taiwan and by Kaohsiung Medical University Research Center Grant (KMU-TC111A01 and KMUTC111IFSP01).
The authors declare that the research was conducted in the absence of any commercial or financial relationships that could be construed as a potential conflict of interest.
All claims expressed in this article are solely those of the authors and do not necessarily represent those of their affiliated organizations, or those of the publisher, the editors and the reviewers. Any product that may be evaluated in this article, or claim that may be made by its manufacturer, is not guaranteed or endorsed by the publisher.
1. Sun H, Saeedi P, Karuranga S, Pinkepank M, Ogurtsova K, Duncan BB, et al. regional and country-level diabetes prevalence estimates for 2021 and projections for 2045. Diabetes Res Clin Pract. (2022) 183:109119. doi: 10.1016/j.diabres.2021.109119
2. Taiwan Health Promotion Administration. Survey on the Prevalence of Hypertension, Hyperglycemia and Hyperlipidemia in Taiwan (2021).
3. Stumvoll M, Goldstein BJ, van Haeften TW. Type 2 diabetes: principles of pathogenesis and therapy. Lancet. (2005) 365:1333–46. doi: 10.1016/S0140-6736(05)61032-X
4. Zheng Y, Ley SH, Hu FB. Global aetiology and epidemiology of type 2 diabetes mellitus and its complications. Nat Rev Endocrinol. (2018) 14:88–98. doi: 10.1038/nrendo.2017.151
6. Wu L, Zhu W, Qiao Q, Huang L, Li Y, Chen L. Novel and traditional anthropometric indices for identifying metabolic syndrome in non-overweight/obese adults. Nutr Metab (Lond). (2021) 18:3. doi: 10.1186/s12986-020-00536-x
7. Jao HF, Wung CH, Yu HC, Lee MY, Chen PC, Chen SC, et al. Sex difference in the associations among obesity-related indices with metabolic syndrome in patients with type 2 diabetes mellitus. Int J Med Sci. (2021) 18:3470–7. doi: 10.7150/ijms.63180
8. Kahn SE, Hull RL, Utzschneider KM. Mechanisms linking obesity to insulin resistance and type 2 diabetes. Nature. (2006) 444:840–6. doi: 10.1038/nature05482
9. Lin IT, Lee MY, Wang CW, Wu DW, Chen SC. Gender differences in the relationships among metabolic syndrome and various obesity-related indices with nonalcoholic fatty liver disease in a taiwanese population. Int J Environ Res Public Health. (2021) 18:857. doi: 10.3390/ijerph18030857
10. Ou YL, Lee MY, Lin IT, Wen WL, Hsu WH, Chen SC. Obesity-related indices are associated with albuminuria and advanced kidney disease in type 2 diabetes mellitus. Ren Fail. (2021) 43:1250–8. doi: 10.1080/0886022X.2021.1969247
11. Hsu YE, Chen SC, Geng JH, Wu DW, Wu PY, Huang JC. Obesity-related indices are associated with longitudinal changes in lung function: a large taiwanese population follow-up study. Nutrients. (2021) 13:4055. doi: 10.3390/nu13114055
12. Wung CH, Chung CY, Wu PY, Huang JC, Tsai YC, Chen SC, et al. Associations between metabolic syndrome and obesity-related indices and bone mineral density t-score in hemodialysis patients. J Pers Med. (2021) 11:775. doi: 10.3390/jpm11080775
13. Lee WC, Wu PY, Huang JC, Tsai YC, Chiu YW, Chen SC, et al. Sex difference in the associations among obesity-related indices with incident hypertension in a large taiwanese population follow-up study. J Pers Med. (2022) 12:972. doi: 10.3390/jpm12060972
14. Wung CH, Lee MY, Wu PY, Huang JC, Chen SC. Obesity-related indices are associated with peripheral artery occlusive disease in patients with type 2 diabetes mellitus. J Pers Med. (2021) 11:533. doi: 10.3390/jpm11060533
15. Huang SH, Chen SC, Geng JH, Wu DW, Li CH. Metabolic syndrome and high-obesity-related indices are associated with poor cognitive function in a large taiwanese population study older than 60 years. Nutrients. (2022) 14:1535. doi: 10.3390/nu14081535
16. Freemantle N, Holmes J, Hockey A, Kumar S. How strong is the association between abdominal obesity and the incidence of type 2 diabetes? Int J Clin Pract. (2008) 62:1391–6. doi: 10.1111/j.1742-1241.2008.01805.x
17. Vazquez G, Duval S, Jacobs DR, Silventoinen K. Comparison of body mass index, waist circumference, and waist/hip ratio in predicting incident diabetes: a meta-analysis. Epidemiol Rev. (2007) 29:115–28. doi: 10.1093/epirev/mxm008
18. Wakabayashi I, Daimon T. A strong association between lipid accumulation product and diabetes mellitus in japanese women and men. J Atheroscler Thromb. (2014) 21:282–8. doi: 10.5551/jat.20628
19. Chang Y, Guo X, Chen Y, Guo L, Li Z, Yu S, et al. A body shape index and body roundness index: two new body indices to identify diabetes mellitus among rural populations in northeast China. BMC Public Health. (2015) 15:794. doi: 10.1186/s12889-015-2150-2
20. Ahn N, Baumeister SE, Amann U, Rathmann W, Peters A, Huth C, et al. Visceral adiposity index (VAI), lipid accumulation product (LAP), and product of triglycerides and glucose (TyG) to discriminate prediabetes and diabetes. Sci Rep. (2019) 9:9693. doi: 10.1038/s41598-019-46187-8
21. Chen CH, Yang JH, Chiang CWK, Hsiung CN, Wu PE, Chang LC, et al. Population structure of Han Chinese in the modern Taiwanese population based on 10,000 participants in the Taiwan Biobank project. Hum Mol Genet. (2016) 25:5321–31. doi: 10.1093/hmg/ddw346
22. Fan CT, Hung TH, Yeh CK. Taiwan regulation of biobanks. J Law Med Ethics. (2015) 43:816–26. doi: 10.1111/jlme.12322
23. Levey AS, Bosch JP, Lewis JB, Greene T, Rogers N, Roth D. A more accurate method to estimate glomerular filtration rate from serum creatinine: a new prediction equation. Modification of diet in renal disease study group. Ann Internal Med. (1999) 130:461–70. doi: 10.7326/0003-4819-130-6-199903160-00002
24. Vickery S, Stevens PE, Dalton RN, van Lente F, Lamb EJ. Does the ID-MS traceable MDRD equation work and is it suitable for use with compensated Jaffe and enzymatic creatinine assays? Nephrol Dial Transplant. (2006) 21:2439–45. doi: 10.1093/ndt/gfl249
26. American Diabetes Association. Diagnosis and classification of diabetes mellitus. Diabetes Care. (2010) 33:S62–9. doi: 10.2337/dc10-S062
27. Thomas DM, Bredlau C, Bosy-Westphal A, Mueller M, Shen W, Gallagher D, et al. Relationships between body roundness with body fat and visceral adipose tissue emerging from a new geometrical model. Obesity (Silver Spring). (2013) 21:2264–71. doi: 10.1002/oby.20408
28. Valdez R. A simple model-based index of abdominal adiposity. J Clin Epidemiol. (1991) 44:955–6. doi: 10.1016/0895-4356(91)90059-I
29. Bergman RN, Stefanovski D, Buchanan TA, Sumner AE, Reynolds JC, Sebring NG, et al. A better index of body adiposity. Obesity (Silver Spring). (2011) 19:1083–9. doi: 10.1038/oby.2011.38
30. Guerrero-Romero F, Rodriguez-Morán M. Abdominal volume index. An anthropometry-based index for estimation of obesity is strongly related to impaired glucose tolerance and type 2 diabetes mellitus. Arch Med Res. (2003) 34:428–32. doi: 10.1016/S0188-4409(03)00073-0
31. H.S. Kahn. The “lipid accumulation product” performs better than the body mass index for recognizing cardiovascular risk: a population-based comparison. BMC Cardiovasc Disord. (2005) 5:26. doi: 10.1186/1471-2261-5-26
32. Amato MC, Giordano C, Galia M, Criscimanna A, Vitabile S, Midiri M, et al. Visceral Adiposity Index: a reliable indicator of visceral fat function associated with cardiometabolic risk. Diabetes Care. (2010) 33:920–2. doi: 10.2337/dc09-1825
33. Cao C, Hu H, Zheng X, Zhang X, Wang Y, He Y. Association between central obesity and incident diabetes mellitus among Japanese: a retrospective cohort study using propensity score matching. Sci Rep. (2022) 12:13445. doi: 10.1038/s41598-022-17837-1
34. Bozorgmanesh M, Hadaegh F, Azizi F. Diabetes prediction, lipid accumulation product, and adiposity measures; 6-year follow-up: Tehran lipid and glucose study. Lipids Health Dis. (2010) 9:45. doi: 10.1186/1476-511X-9-45
35. Mirmiran P, Bahadoran Z, Azizi F. Lipid accumulation product is associated with insulin resistance, lipid peroxidation, and systemic inflammation in type 2 diabetic patients. Endocrinol Metab (Seoul). (2014) 29:443–9. doi: 10.3803/EnM.2014.29.4.443
36. Katsuki A, Sumida Y, Urakawa H, Gabazza EC, Murashima S, Maruyama N, et al. Increased visceral fat and serum levels of triglyceride are associated with insulin resistance in Japanese metabolically obese, normal weight subjects with normal glucose tolerance. Diabetes Care. (2003) 26:2341–4. doi: 10.2337/diacare.26.8.2341
37. Lebovitz HE, Banerji MA. Point: visceral adiposity is causally related to insulin resistance. Diab Care. (2005) 28:2322–5. doi: 10.2337/diacare.28.9.2322
38. Kodama S, Horikawa C, Fujihara K, Heianza Y, Hirasawa R, Yachi Y, et al. Comparisons of the strength of associations with future type 2 diabetes risk among anthropometric obesity indicators, including waist-to-height ratio: a meta-analysis. Am J Epidemiol. (2012) 176:959–69. doi: 10.1093/aje/kws172
39. Jayawardana R, Ranasinghe P, Sheriff MH, Matthews DR, Katulanda P. Waist to height ratio: a better anthropometric marker of diabetes and cardio-metabolic risks in South Asian adults. Diab Res Clin Pract. (2013) 99:292–9. doi: 10.1016/j.diabres.2012.12.013
40. Mirzaei M, Khajeh M. Comparison of anthropometric indices (body mass index, waist circumference, waist to hip ratio and waist to height ratio) in predicting risk of type II diabetes in the population of Yazd, Iran. Diabetes Metab Syndr. (2018) 12:677–82. doi: 10.1016/j.dsx.2018.04.026
41. Xu Z, Qi X, Dahl AK, Xu W. Waist-to-height ratio is the best indicator for undiagnosed type 2 diabetes. Diabet Med. (2013) 30:e201–7. doi: 10.1111/dme.12168
42. Schmidt MI, Duncan BB, Canani LH, Karohl C, Chambless L. Association of waist-hip ratio with diabetes mellitus. Strength and possible modifiers. Diab Care. (1992) 15:912–4. doi: 10.2337/diacare.15.7.912
43. Qiao Q, Nyamdorj R. Is the association of type II diabetes with waist circumference or waist-to-hip ratio stronger than that with body mass index? Eur J Clin Nutr. (2010) 64:30–4. doi: 10.1038/ejcn.2009.93
44. Liu B, Liu B, Wu G, Yin F. Relationship between body-roundness index and metabolic syndrome in type 2 diabetes. Diabetes Metab Syndr Obes. (2019) 12:931–5. doi: 10.2147/DMSO.S209964
45. Zhao Q, Zhang K, Li Y, Zhen Q, Shi J, Yu Y, et al. Capacity of a body shape index and body roundness index to identify diabetes mellitus in Han Chinese people in Northeast China: a cross-sectional study. Diabet Med. (2018) 35:1580–7. doi: 10.1111/dme.13787
46. Liu Y, Liu X, Guan H, Zhang S, Zhu Q, Fu X, et al. Body roundness index is a superior obesity index in predicting diabetes risk among hypertensive patients: a prospective cohort study in China. Front Cardiovasc Med. (2021) 8:736073. doi: 10.3389/fcvm.2021.736073
47. Amato MC, Giordano C, Pitrone M, Galluzzo A. Cut-off points of the visceral adiposity index (VAI) identifying a visceral adipose dysfunction associated with cardiometabolic risk in a Caucasian Sicilian population. Lipids Health Dis. (2011) 10:183. doi: 10.1186/1476-511X-10-183
48. Bozorgmanesh M, Hadaegh F, Azizi F. Predictive performance of the visceral adiposity index for a visceral adiposity-related risk: type 2 diabetes. Lipids Health Dis. (2011) 10:88. doi: 10.1186/1476-511X-10-88
49. Amato MC, Giordano C. Visceral adiposity index: an indicator of adipose tissue dysfunction. Int J Endocrinol. (2014) 2014:730827. doi: 10.1155/2014/730827
50. Ciresi A, Amato MC, Pizzolanti G, Giordano Galluzzo C. Visceral adiposity index is associated with insulin sensitivity and adipocytokine levels in newly diagnosed acromegalic patients. J Clin Endocrinol Metab. (2012) 97:2907–15. doi: 10.1210/jc.2012-1518
51. Al-Daghri NM, Al-Attas OS, Alokail MS, Alkharfy KM, Charalampidis P, Livadas S, et al. Visceral adiposity index is highly associated with adiponectin values and glycaemic disturbances. Eur J Clin Invest. (2013) 43:183–9. doi: 10.1111/eci.12030
52. Lumish HS, O'Reilly M, Reilly MP. Sex differences in genomic drivers of adipose distribution and related cardiometabolic disorders: opportunities for precision medicine. Arterioscler Thromb Vasc Biol. (2020) 40:45–60. doi: 10.1161/ATVBAHA.119.313154
53. Chang E, Varghese M, Singer K. Gender and sex differences in adipose tissue. Curr Diab Rep. (2018) 18:69. doi: 10.1007/s11892-018-1031-3
54. Schorr M, Dichtel LE, Gerweck AV, Valera RD, Torriani M, Miller KK, et al. Sex differences in body composition and association with cardiometabolic risk. Biol Sex Differ. (2018) 9:28. doi: 10.1186/s13293-018-0189-3
55. Wang X, Magkos F, Mittendorfer B. Sex differences in lipid and lipoprotein metabolism: it's not just about sex hormones. J Clin Endocrinol Metab. (2011) 96:885–93. doi: 10.1210/jc.2010-2061
Keywords: obesity-related index, sex difference, incident diabetes mellitus, Taiwan biobank, follow-up
Citation: Chung T-L, Liu Y-H, Wu P-Y, Huang J-C and Chen S-C (2023) Sex difference in the associations among obesity-related indices with incidence of diabetes mellitus in a large Taiwanese population follow-up study. Front. Public Health 11:1094471. doi: 10.3389/fpubh.2023.1094471
Received: 10 November 2022; Accepted: 02 January 2023;
Published: 20 January 2023.
Edited by:
Gaetano Santulli, Albert Einstein College of Medicine, United StatesReviewed by:
Aleksandra Klisic, Primary Health Care Center Podgorica, MontenegroCopyright © 2023 Chung, Liu, Wu, Huang and Chen. This is an open-access article distributed under the terms of the Creative Commons Attribution License (CC BY). The use, distribution or reproduction in other forums is permitted, provided the original author(s) and the copyright owner(s) are credited and that the original publication in this journal is cited, in accordance with accepted academic practice. No use, distribution or reproduction is permitted which does not comply with these terms.
*Correspondence: Szu-Chia Chen,  c2NhcmNoZW5vbmVAeWFob28uY29tLnR3
Disclaimer: All claims expressed in this article are solely those of the authors and do not necessarily represent those of their affiliated organizations, or those of the publisher, the editors and the reviewers. Any product that may be evaluated in this article or claim that may be made by its manufacturer is not guaranteed or endorsed by the publisher.
Research integrity at Frontiers
Learn more about the work of our research integrity team to safeguard the quality of each article we publish.