 Yang Li
 Shoumei Jia
 Baohua Cao1*
 Zhongying Shi
 Hao Zhang
94% of researchers rate our articles as excellent or good
Learn more about the work of our research integrity team to safeguard the quality of each article we publish.
Find out more
ORIGINAL RESEARCH article
Front. Public Health, 13 March 2023
Sec. Public Mental Health
Volume 11 - 2023 | https://doi.org/10.3389/fpubh.2023.1079873
This article is part of the Research TopicMapping Symptom Networks among Co-occurrence of Psychological and Somatic SymptomsView all 6 articles
Introduction: Network theory conceptualizes somatic symptoms as a network of individual symptoms that are interconnected and influenced by each other. In this conceptualization, the network's central symptoms have the strongest effect on other symptoms. Clinical symptoms of patients with depressive disorders are largely determined by their sociocultural context. To our knowledge, no previous study has investigated the network structure of somatic symptoms among Chinese patients with depressive disorders. The aim of this study was to characterize the somatic symptoms network structure in patients with depressive disorders in Shanghai, China.
Method: A total of 177 participants were recruited between October 2018 and June 2019. The Chinese version of the Patient Health Questionnaire-15 was used to assess somatic symptoms. In order to quantify the somatic symptom network structure, indicators of “closeness,” “strength,” and “betweenness” were employed as identifiers for network-central symptoms.
Result: The symptoms of “feeling your heart pound or race,” “shortness of breath,” and “back pain” had the highest centrality values, indicating that these symptoms were central to the somatic symptom networks. Feeling tired or mentally ill had the strongest positive correlation with insomnia or other sleep problems (r = 0.419), followed by chest pain and breathlessness (r = 0.334), back pain, and limb or joint pain (r = 0.318).
Discussion: Psychological and neurobiological research that offers insights into somatic symptoms may focus on these central symptoms as targets for treatment and future research.
Approximately 3.8% of the world population is affected by depressive disorder and the total number of patients worldwide is ~280 million (1). Depression is a major contributor to death by suicide (2), and was the single most significant contributor to global disability and “non-fatal health loss,” accounting for more than 47 million disability-adjusted life years in 2019 (3).
Somatic symptoms are common among patients with depressive disorders. These are defined as physical disorders characterized by complaints of various physical discomfort symptoms that cannot be reasonably explained by the physiological disease process of experimental medicine (4). There are several distinct somatic symptoms associated with depressive disorder, including vegetative symptoms (including sleep disturbance, changes in appetite, and lack of energy), severe painful symptoms (such as headaches, backaches, stomachaches, and musculoskeletal pain), and non-painful symptoms (including palpitations, dizziness, dyspnea, and shortness of breath) (5).
According to a multicenter international study, ~66% of patients with depressive disorders were initially afflicted by somatic symptoms (6). In Western countries, the occurrence of somatic symptoms in patients with depression typically falls within the range of 66–93% (7). In China, patients with depressive disorder focus more on their somatic symptoms while ignoring shifts in emotion and frequently seek help outside of psychiatric contexts, which often leads to a higher prevalence of complaints regarding somatic symptoms, reported at 98.2% in general hospitals (7). Previous research has shown that somatic symptoms in patients with depression might indicate increased severity, worsening prognosis, worsening treatment response, chronicity, and delayed remission (8). The presence of various somatic symptoms is an important indicator of the two-year persistence of depression (OR = 1.69, 95%, confidence interval [CI] = 1.07–2.68, p = 0.03), as well as gastrointestinal, cardiopulmonary, and general symptomatic clusters (9). Indeed, the long-term, persistent somatic presentation of depression significantly contributes to individual experience of immense personal and familial suffering, as well as other adverse outcomes, such as functional impairment, misdiagnosis and missed diagnosis, financial burden, and increased risk of recurrence of depressive disorders (10). Somatic symptoms in patients with depression may persist even after therapy, therefore, impeding remission and raising the possibility of recurrence. Strong correlations between depression and somatic symptoms have been demonstrated with the majority of research concentrating on depression (11). Exploring the psychopathological mechanisms involved in somatic symptoms is essential to provide targeted and effective treatments.
In the common cause perspective of mental disorders, also known as the traditional theory of psychopathology, somatic symptoms are conceptualized as passive consequences of an underlying disorder (12). For example, an infection causes fever and pain in the same way that depression causes fatigue and sleep disturbances. The use of standardized depression measures in several research also suggest that somatic symptoms are seen as interchangeable manifestations of the same condition, since they tally individual answers to obtain a total score (13). The cluster of physical symptoms of depression are secondary to direct symptom-to-symptom linkages in the newly proposed psychopathology theory (i.e., the causal system view of mental diseases) (14), but they are not a common cause.Thus, somatic symptoms, such as fatigue and sleep disturbances are not the result of depression. In contrast, their effects upon one another occur through their own psychological and biological mechanisms. The existence and specificity of these interactions were identified via a network assessment. The key symptoms of the network showed the greatest correlation with many other symptoms. Furthermore, because central symptoms canactivate other symptoms, they may contribute heavily to the arrival and continuation of other symptoms. Therefore, it may be more efficient to target these central symptoms by focusing on biopsychosocial aspects (15). In network theory, although neighboring symptoms can activate each other, their activation can also be triggered by extrinsic circumstances, including significant and detrimental life experiences or medical health issues (14). Through network analysis, researchers can identify “bridge symptoms” that serve as catalysts for different syndromes. Therefore, compared to the classical model, the network perspective can potentially yield more clinically applicable insights into the role that early symptoms play in estimating the likelihood of future disorders.
Depressive symptoms have been analyzed using network analysis, excluding somatic symptoms, in several Western countries (16, 17). Therefore, we conducted this research with the purpose of characterizing the network structure of somatic symptoms as it applies to Chinese patients with depressive disorder.
This study was conducted in Shanghai, China, between October 2018 and June 2019. Using convenience sampling, 177 patients diagnosed with depressive disorders in the psychological outpatient department of a general hospital and the ward of a mental health hospital were invited to participate in this study. All participants fulfilled the following inclusion criteria: outpatients or inpatients aged 18 years or above whose diagnoses met the criteria for depressive disorder as defined by the International Classification of Diseases (ICD-10). The exclusion criteria were severe physical disease, schizophrenia, schizophrenic mental disorder, affective schizophrenic mental disorder, dementia, and a history of substance abuse. The study protocol was approved by the Medical Ethics Committee of the School of Nursing at Fudan University (reference number: IRB # 2018-12-06). Participants provided informed consent before participating in this research and they were assured of anonymity and confidentiality. They also retained the right to withdraw if desired.
The fifteen-item Patient Health Questionnaire's (PHQ-15) Chinese version was used to quantify the somatic complaints of patients with depression. This scale may be used to screen for somatic symptoms and rate their severity. It asks questions about 15 somatic symptoms, which together comprise more than 90% of the symptoms observed in primary care (18, 19). On a three-point Likert scale, participants were asked to rate the intensity of their symptoms during the previous 4 weeks as follows: 0 (not bothered at all), 1 (bothered a little), and 2 (bothered a lot). The overall score ranged from 0 to 30, with higher values indicating more severe somatic symptoms. To clearly demonstrate the intensity of the somatic symptoms, the total score was divided into one of four categories: minimum (PHQ-15 score 0–4), mild (score 5–9), moderate (score 10–14), and severe (score 15–30) (20, 21). Cronbach's alpha of PHQ-15's Chinese version is 0.73 (22). In the current study, the Cronbach's alpha was 0.86.
Demographic information for the patients with depression included age, sex, marital status, education level, and personal monthly income in the preceding 12 months. Clinical information included stage of disease, severity of depressive disorder, and frequency.
Patients with depressive disorders in the psychological outpatient department of a general hospital and the ward of a mental health hospital were investigated using questionnaires administered by two postgraduates. The investigators first explained the study's purpose, method, significance, and questionnaire to the patients. As soon as the patients provided informed consent, questionnaires were issued. The patients completed the questionnaires according to the investigators' instructions. If patients were unable to complete the form independently because of problems related to vision, education level, disease status, etc., the investigator asked the questions and filled them in a unified manner. Each questionnaire took 5–10 mins to complete, and all questionnaires were collected immediately. Following the completion of the questionnaires, the investigators examined them and asked the participants to provide any missing information. The questionnaires were regarded as invalid if all answers were identical, multiple answers were selected for the same question, or if 10% or more of the questions had not been answered.
In this study, we calculated the mean, standard deviation (SDs), skewness, and kurtosis for all items in the PHQ-15. A graphical Gaussian model (GGM) was used to estimate the network model (23).
Within the psychopathology network, ”node” represented every somatic symptom, and ”edge” represented the correlation between these symptoms. For network visualization, the association strength between nodes is represented by the thickness of the edges. Different colors were adopted to indicate the correlation direction (i.e., the red edge indicates a negative correlation and the blue edge indicates a positive correlation).
The Extended Bayesian information criteria were combined with the graphical Least Absolute Shrinkage and Selection Operator model (gLASSO) (24) in order to reduce the number of spurious edges and improve the stability of the network. Given that this study's sample size was limited, the parameters were set to γ 0.1 to delete edges with small or unstable correlations between entries, and to ensure that an accurate network could be estimated (25). The Fruchterman-Reingold algorithm was employed to draw the network diagram, and the nodes with more or stronger connections were placed at the center of the diagram, while the nodes with fewer connections were placed at the outer edge of the diagram. Network estimation was performed and visualized using the R software “qgraph” package (26).
In order to determine which symptoms in the somatic symptom network were most important, three key centrality indices (strength, betweenness, and closeness) were assessed (26). Strength, the most important centrality metric in this study, was defined as the absolute sum of the edge weights associated with a node, indicating the relevance of a certain element. The more this node might influence the entire network, the higher its strong centrality score. As opposed to closeness, which was calculated as the reciprocal of the sum of a node's distance from every other node in the network, betweenness was computed as the frequency of a node lying on all the shortest pathways between other nodes (26). The analyses were performed using the “IsingFit,” “networktools,” and “qgraph” packages in R (version 3.6.3).
Three approaches were employed to assess the accuracy and stability of the network model and gauge the robustness of the findings. First, the 95% confidence interval (CI) was calculated using the non-parametric bootstrap technique to determine the correctness of edge weights. The projected edge weight was more accurately predicted by a network with a tighter CI than that with a broader CI (26). Second, the subset bootstrap approach was used to assess the stability of the centrality indices using the correlation stability coefficient (CS-C) (27). If the node centrality indices do not substantially change after eliminating any samples from the dataset, the network topology may be assumed to be stable. The CS-C should be at least 0.25 and better than 0.5. The differences between the two strength indices were deemed statistically significant only when the 1000-bootstrap 95% non-parametric CIs did not include zero. Bootstrapped difference tests were used to assess variations in network characteristics (28). To evaluate whether there was a significant difference between the two edge weights or two node centrality indices, the test used 95% CIs.
The centrality indices and average scores of the PHQ-15 items, as well as the centrality indices and symptom SDs, were determined using Spearman's rank-order correlation. While the correlation between centrality indices and SDs was used to determine whether the centrality of symptoms could be attributed to the differential variability of the items, the correlation between centrality indices and the average score of PHQ-15 items was used to determine whether the most central symptoms were the most serious (16).
A total of 181 responses were collected, of which 177 were valid. The sociodemographic attributes and other clinical characteristics of the participants are presented in Table 1.
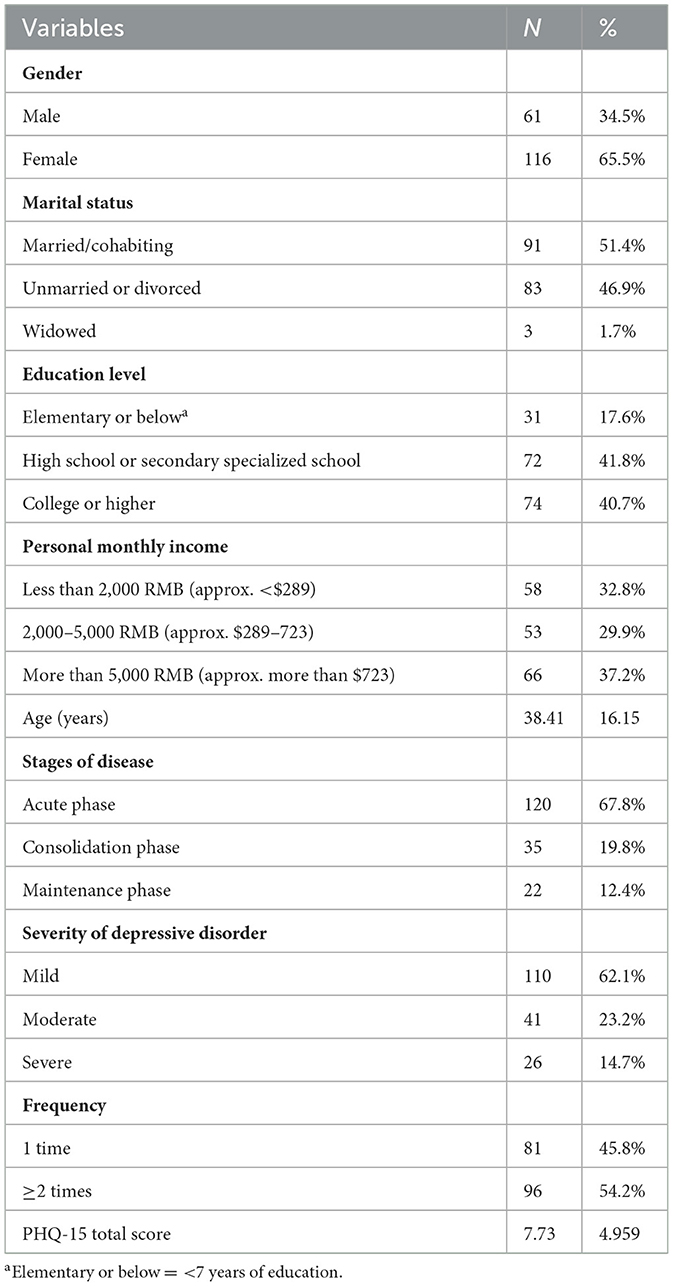
Table 1. Sociodemographic and clinical characteristics of participants (N = 177).
Detailed information on the mean, SD, skewness, and kurtosis of somatic symptoms based on the PHQ-15 is presented in Table 2. According to the PHQ-15, the mean (SD) total score was 7.73 ± 4.959. The symptom “fainting spells” received the lowest mean score, whereas the item “feeling fatigued or having little energy” had the highest mean score.
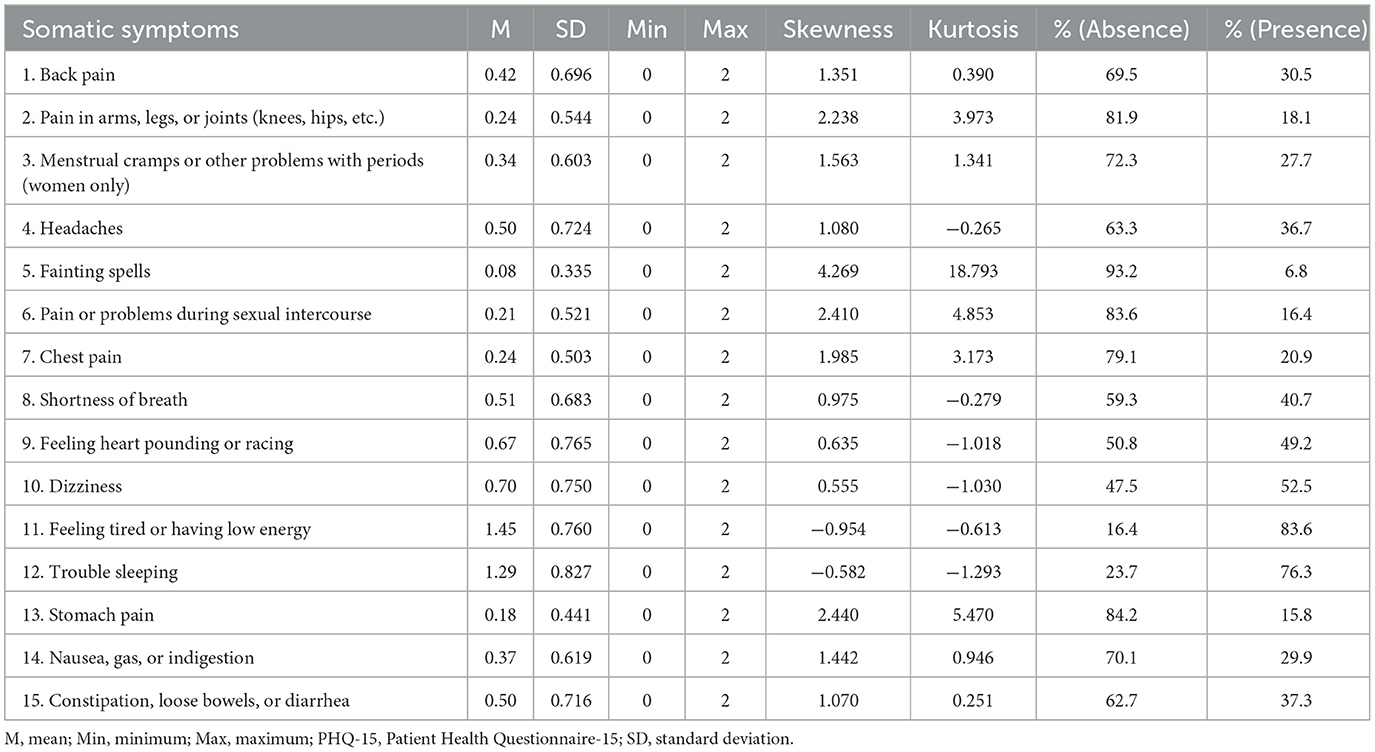
Table 2. Item description of somatic symptoms as measured by the PHQ-15 (N = 177).
Figure 1 shows the network of somatic symptoms calculated using the GGM. Chest discomfort, shortness of breath, and feeling the heart pound or race were all grouped as nodes in the middle of the figure, indicating that they were all intimately related to the other symptoms in the network. Additionally, there were significant positive associations between feeling exhausted or low in energy and having problems sleeping, as well as between chest discomfort and shortness of breath, back pain, and joint, arm, or leg pain. The numerical relationships between symptoms were investigated using a weighted adjacency matrix.
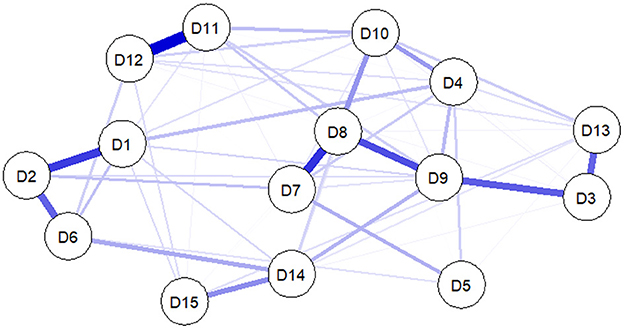
Figure 1. Estimated network plot for symptoms in the total sample. The network model was estimated using the GGM model. D1, back pain; D2, pain in arms, legs, or joints; D3, menstrual cramps or other problems with periods; D4, headaches; D5, fainting spells; D6, pain or problems during sexual intercourse; D7, chest pain; D8, shortness of breath; D9, feeling heart pounding or racing; D10, dizziness; D11, feeling tired or having low energy; D12, trouble sleeping; D13, stomach pain; D14, nausea, gas, or indigestion; D15, constipation, loose bowels, or diarrhea.
Figure 2 displays the network's strength, betweenness, and closeness centrality metrics for each symptom. The symptoms of racing or pounding of the heart were the strongest, closest, and most intense, followed by back discomfort and shortness of breath. Shortness of breath and back discomfort followed the indications of a quick heartbeat or acceleration, which were the strongest across a wide area.
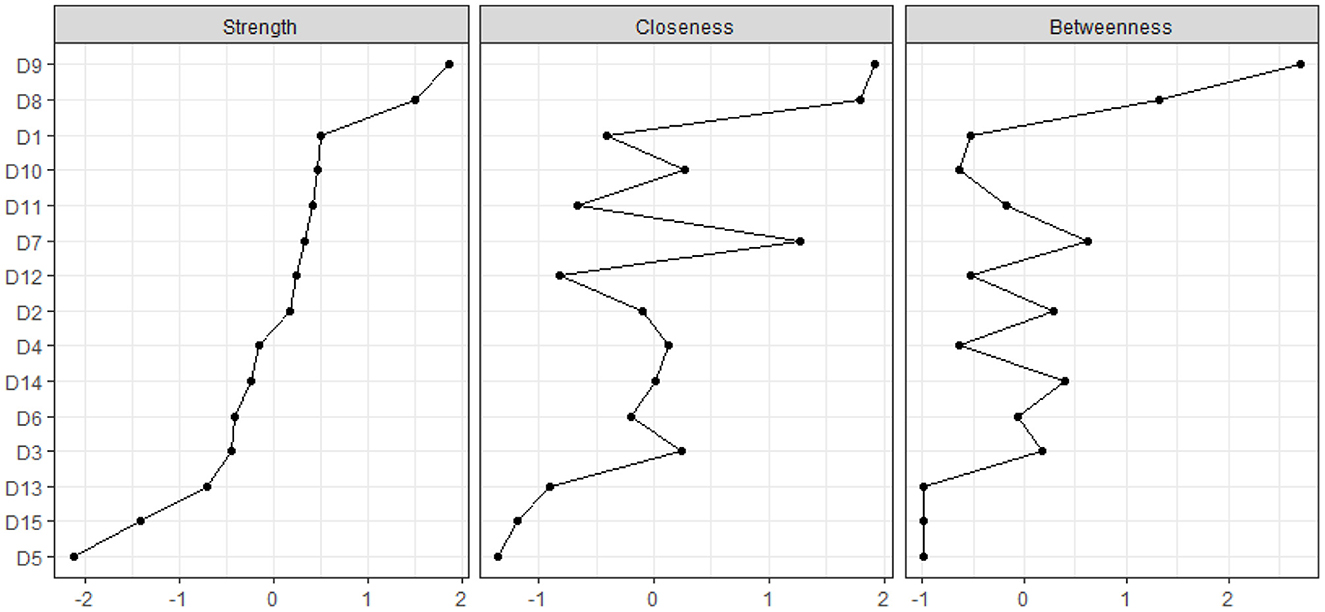
Figure 2. Centrality measures of all symptoms within the network. The figure shows the centrality measures (i.e., strength, betweenness, and closeness) of all factors within the network (z-scores).
The gray area in Figure 3 represents the 95% CI area of the edge weight obtained using the bootstrap method. The 95% CIs (gray intervals) for the edge weights were small, indicating that the edge weights were accurate through network analysis and that the edges estimated by the entire network were stable.

Figure 3. Edge accuracy plot depicting 95% confidence obtained from 2,500 bootstrap samples.
The case-dropping subset bootstrap approach demonstrated that the values of strength, betweenness, and closeness were consistent even after significant chunks of the sample were dropped. Although betweenness had a little lower stability than the primary one (CS-C = 0.051), while closeness had a better stability. In contrast, this sample's strength index was solid and trustworthy (CS-C = 0.441), which was relatively stable and could be used to explain the importance of symptoms (Figure 4). Therefore, we primarily focused on interpreting symptom strength using network analysis.
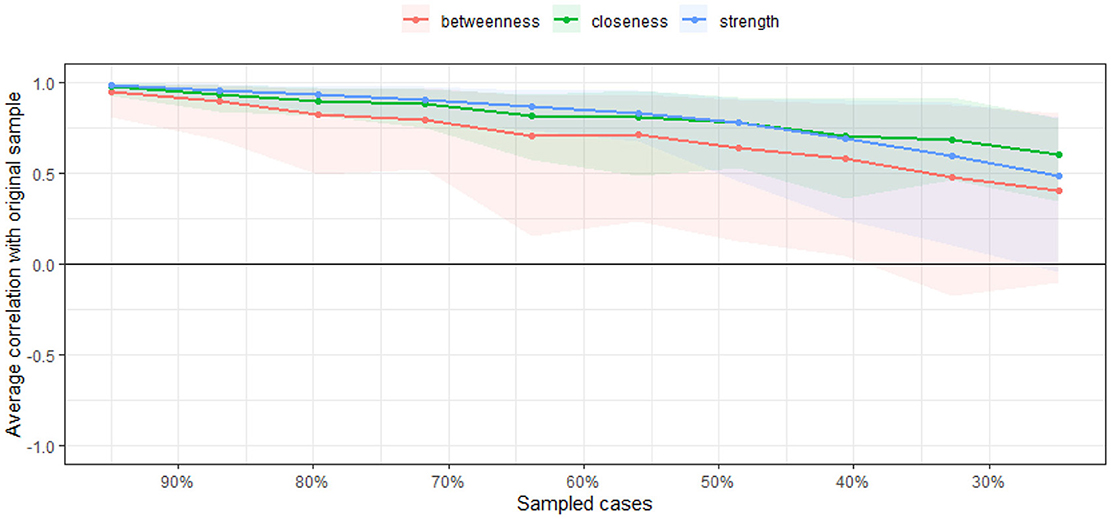
Figure 4. Correlation stability plot measuring the stability of strength.
In Figure 5 black squares indicate edges that do differ significantly from one-another, whereas gray squares indicate edges that do not differ significantly from one-another.It is found that the edges with strong connections, such as D11–D12, D07–D08, D01–D02, are significantly different from most other edges in the network structure, while the remaining edges with lower edge weights have no significant difference from one-another.
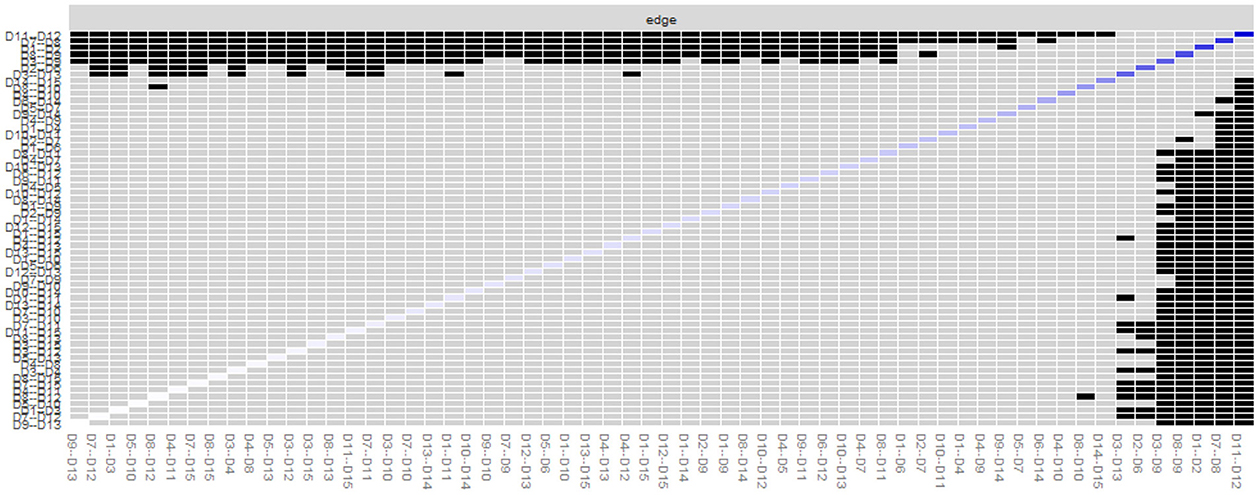
Figure 5. Bootstrapped difference test for edge weights.
Figure 6 shows that there was no difference in intensity centrality among some symptoms in the network estimation. However, D9 (feeling heart pound or race) and D8 (shortness of breath), the two most intense centrality symptoms, are different from other symptoms.
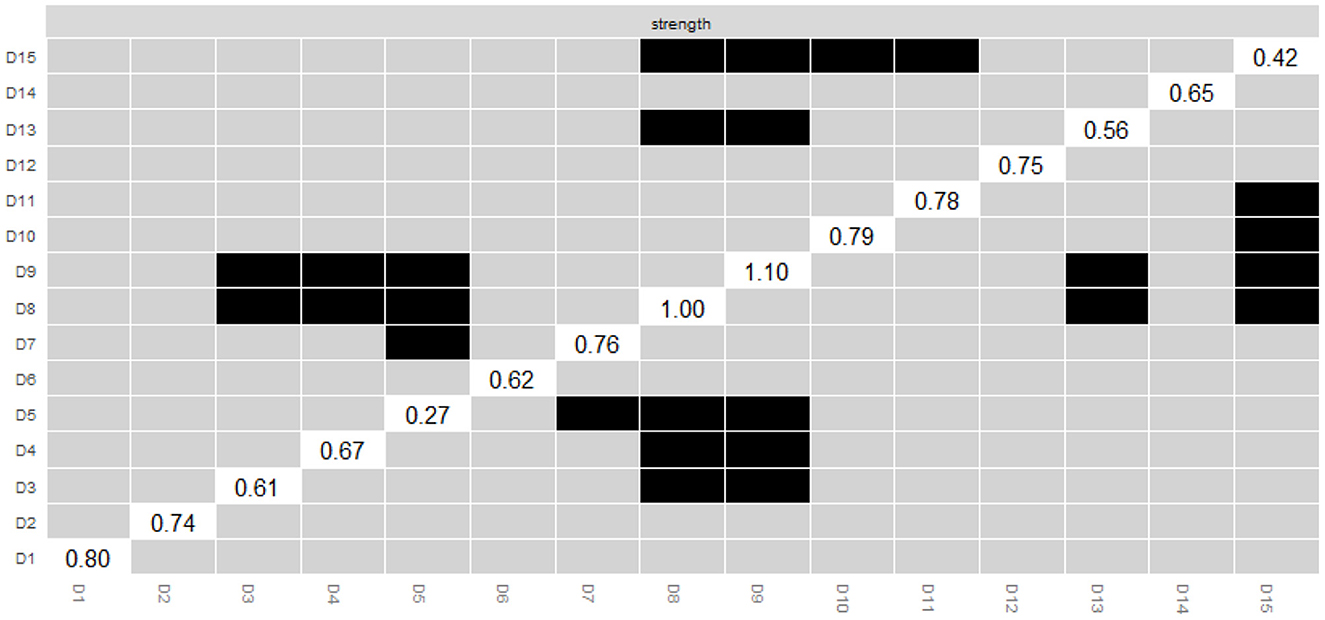
Figure 6. Estimation of node strength difference by bootstrapped difference test. Bootstrapped difference tests between-node strength of factors. Gray boxes indicate nodes that do not significantly differ from one another. Black boxes represent nodes that differ significantly from one another (α = 0.05). White boxes show the values of node strength.
This study determined that feeling one's heart pound or race was ranked as the most prominent somatic symptom, accompanied by shortness of breath and back pain. These three symptoms were arranged in the center of the diagram, suggesting they are highly connected with the remaining somatic symptoms and could maintain or trigger them in this sample. This result is consistent with the research of Yang Xiangyun on 1,497 outpatients in general hospitals, which showed that cardiothoracic discomfort scores (PHQ-15 score ranging from 10 to 14) in the group with multiple somatic symptoms were significantly higher than those without multiple somatic symptoms, indicating that the presence of cardiothoracic discomfort felt by patients would affect the occurrence of somatic symptoms in patients with depression (29). This may be related to the high mental stress caused by somatic symptoms and hyperthermia of the hypothalamus-pituitary-adrenal axis (HPA) caused by depressive symptoms (30). Hyperfunction of the HPA axis leads to feeling one's heart pound or race (heart palpitations) and shortness of breath (chest tightness), which are some of the most easily perceived and worrying physical manifestations among Chinese patients (31). Patients regard these two symptoms as manifestations of heart disease, so they use more medical services (such as repeating visits to a cardiology department or conducting various cardiac examinations) and avoid daily activities, which will cause patients' health anxiety – that is, causing them to pay too much attention to physical symptoms and promoting the emergence of other symptoms (32). In clinical practice, more attention should be focused on palpitations and chest tightness in patients with depressive disorder, and efforts increased toward early identification and targeted model management to ensure improvement in the somatic symptoms and treatment outcomes (7, 32).
Back pain is also considered one of the most common causes of patients seeking medical care in primary care and emergency settings, costing $200 billion annually in the United States (33). Influenced by Chinese culture, patients with depressive disorders tend to pay more attention to pain than emotional problems (32). Suicidal ideation in patients with low back pain was significantly greater than that in patients without comorbid conditions (31, 34). In a single patient, pain and depression can be attributed to one or more factors in various ways. First, the physical and psychological discomfort caused by chronic pain interacts with social and personal vulnerability to accelerate the onset of depressive episodes (35). Second, depression can be a precursor to and sometimes a contributor to pain. Major depression reduces an individual's ability to tolerate pain, and physical discomfort can be a prominent symptom. It should be noted that more than half of patients with depression consider pain as their main symptom when seeking primary care (36).
Feeling tired or mentally ill had the strongest positive correlation with insomnia or other sleep problems (r = 0.419), followed by chest pain and breathlessness (r = 0.334), and back pain, and limb or joint pain (r = 0.318). According to one study, there is a clear correlation between fatigue and sleep disorders, the more serious the sleep disorder, the more obvious the sense of fatigue (37). Long et al. (38) explored the causal model of fatigue symptoms in lung cancer patients and found that the greatest impacting factors on the degree of fatigue in patients were dyspnea, cough, and insomnia, of which insomnia was the most important factor that directly led to fatigue. In addition, sleep disorders can also mediate fatigue symptoms experienced by patients; Brown et al. reported that 35% of fatigue symptoms were caused by sleep disorders (39). Chest pain and breathlessness belong to the cardiothoracic discomfort symptom group, whereas back pain and limb joint pain belong to the pain symptom group, suggesting that various factors in the same symptom group affect each other and jointly promote the occurrence and development of symptoms. Attention should be paid to the synergy between symptoms during follow-up interventions.
The present study has some limitations. First, the cross-sectional information used to construct the network structure of depression-related somatic symptoms among patients cannot provide a detailed picture of symptom development over time nor can it determine the causal relationship between symptoms. In future studies, longitudinal follow-up should be conducted to explore the temporal causal relationship between symptoms. Second, the network structure in this study is specific to patients with depressive disorders in Shanghai, China. As different social and cultural backgrounds impact the symptom network, the study's results cannot be extended to the national population of patients with depressive disorders. Finally, this study evaluated the somatic symptom network structure at the patient group level, which may be different from the somatic symptom network structure at the individual level.
A network analysis was conducted to construct somatic symptoms of patients with depressive disorders, providing a supplementary method for the classification and dimension model of traditional mental disorders. This research is one of the few studies to explore the relationship between somatic symptoms in patients with depressive disorders using network methods, providing new insights for better understanding the functional relationship between somatic symptoms and the clinical significance of specific symptoms. Specifically, this study found that heart palpitations, chest tightness, and back pain constitute the “backbone” that sustained the somatic symptom structure among Chinese patients with depressive disorders, therefore, suggesting that considering these symptoms as the core target may help to further reduce the overall somatic symptom severity. Fatigue had the strongest positive correlation with insomnia or other sleep problems, followed by chest pain and breathlessness, back pain, and limb or joint pain, suggesting that attention should be paid to the synergy between symptoms during follow-up interventions.
The raw data supporting the conclusions of this article will be made available by the authors, without undue reservation.
This study was approved by the Medical Ethics Committee of the Fudan University School of Nursing (reference number: IRB # 2018-12-06). The participants provided informed consent prior to their participation in this study.
Study design and manuscript drafting: YL and SJ. Data collection: YL and LC. Analysis and interpretation: YL and HZ. Critical revision of the manuscript: SJ, ZS, and BC. All authors approval of the final version for publication.
This research project was funded by the 2018 Fudan University Fosun Nursing Research Fund (FNF201819) and First-class nursing discipline construction project of Fudan University School of Nursing (FNSYL202202).
We are grateful for the participation of the patients in this research and for the assistance and facilitation provided by the clinical practitioners during the data collection process. The authors had full access to all data used in the study, participated in the drafting and/or critical revision of the article, and approved the published version. The corresponding authors are responsible for the integrity of the data and accuracy of the data analysis.
The authors declare that the research was conducted in the absence of any commercial or financial relationships that could be construed as a potential conflict of interest.
All claims expressed in this article are solely those of the authors and do not necessarily represent those of their affiliated organizations, or those of the publisher, the editors and the reviewers. Any product that may be evaluated in this article, or claim that may be made by its manufacturer, is not guaranteed or endorsed by the publisher.
1. WHO Depression. Available online at: https://www.who.int/en/news-room/fact-sheets/detail/depression (accessed September 16, 2022).
2. Kessler RC, Bromet EJ. The epidemiology of depression across cultures. Annu Rev Publ Health. (2013) 34:119–138. doi: 10.1146/annurev-publhealth-031912-114409
3. GBD 2019 Mental Disorders Collaborators. Global, regional, and national burden of 12 mental disorders in 204 countries and territories, 1990–2019: a systematic analysis for the Global Burden of Disease Study 2019. Lancet Psychiatry. (2022) 9:137–50. doi: 10.1016/S2215-0366(21)00395-3
4. Baez LM, Newport DJ, Stowe ZN, Knight BT, Heller AS. The severity and role of somatic depressive symptoms in psychological networks in a longitudinal sample of peripartum women. J Psychiatr Res. (2021) 142:283–9. doi: 10.1016/j.jpsychires.2021.07.049
5. Henningsen P. Management of somatic symptom disorder. Dialogues Clin Neurosci. (2018) 20:23–31. doi: 10.31887/DCNS.2018.20.1/phenningsen
6. Wu X, Zhu Y, Wu Z, Huang J, Cao L, Wang Y, et al. Identifying the subtypes of major depressive disorder based on somatic symptoms: A longitudinal study using latent profile analysis. Front Psychiatry. (2022) 13:759334. doi: 10.3389/fpsyt.2022.759334
7. Jian Y, Jia S, Shi Z, Zhao Y, Li P, Chen L, et al. Characteristics of somatic symptoms among Chinese patients diagnosed with major depressive episode. Arch Psychiat Nurs. (2021) 35:27–33. doi: 10.1016/j.apnu.2020.11.001
8. Schaakxs R, Comijs HC, Lamers F, Kok RM, Beekman ATF, Penninx BWJH. Associations between age and the course of major depressive disorder: A 2-year longitudinal cohort study. Lancet Psychiatry. (2018) 5:581–90. doi: 10.1016/S2215-0366(18)30166-4
9. Bekhuis E, Boschloo L, Rosmalen JGM, de Boer MK, Schoevers RA. The impact of somatic symptoms on the course of major depressive disorder. J Affect Disorders. (2016) 205:112–8. doi: 10.1016/j.jad.2016.06.030
10. Fava M, Ball S, Nelson JC, Sparks J, Konechnik T, Classi P, et al. Clinical relevance of fatigue as a residual symptom in major depressive disorder. Depress Anxiety. (2014) 31:250–7. doi: 10.1002/da.22199
11. Lallukka T, Mekuria GB, Nummi T, Virtanen P, Virtanen M, Hammarström A. Co-occurrence of depressive, anxiety, and somatic symptoms: Trajectories from adolescence to midlife using group-based joint trajectory analysis. BMC Psychiatry. (2019) 19:236. doi: 10.1186/s12888-019-2203-7
12. Borsboom D. Psychometric perspectives on diagnostic systems. J Clin Psychol. (2008) 64:1089–108. doi: 10.1002/jclp.20503
13. Fried EI. Problematic assumptions have slowed down depression research: Why symptoms, not syndromes are the way forward. Front Psychol. (2015) 6:309. doi: 10.3389/fpsyg.2015.00309
14. Cheung T, Jin Y, Lam S, Su Z, Hall BJ, Xiang YT. Network analysis of depressive symptoms in Hong Kong residents during the COVID-19 pandemic. Transl Psychiat. (2021) 11:460. doi: 10.1038/s41398-021-01543-z
15. Malgaroli M, Calderon A, Bonanno GA. Networks of major depressive disorder: a systematic review. Clin Psychol Rev. (2021) 85:102000. doi: 10.1016/j.cpr.2021.102000
16. Mullarkey MC, Marchetti I, Beevers CG. Using network analysis to identify central symptoms of adolescent depression. J Clin Child Adolesc Psychol. (2019) 48:656–68. doi: 10.1080/15374416.2018.1437735
17. Belvederi Murri M, Amore M, Respino M, Alexopoulos GS. The symptom network structure of depressive symptoms in late-life: Results from a European population study. Mol Psychiatry. (2020) 25:1447–56. doi: 10.1038/s41380-018-0232-0
18. Kroenke K, Spitzer RL, Williams JBW. The PHQ-15: validity of a new measure for evaluating the severity of somatic symptoms. Psychosom Med. (2002) 64:258–66. doi: 10.1097/00006842-200203000-00008
19. Kroenke K. The prevalence of symptoms in medical outpatients and the adequacy of therapy. Arch Intern Med. (1990) 150:1685–9. doi: 10.1001/archinte.150.8.1685
20. Kroenke K, Spitzer RL, Williams JBW, Löwe B. The patient health questionnaire somatic, anxiety, and depressive symptom scales: a systematic review. Gen Hosp Psychiatry. (2010) 32:345–59. doi: 10.1016/j.genhosppsych.2010.03.006
21. Körber S, Frieser D, Steinbrecher N, Hiller W. Classification characteristics of the Patient Health Questionnaire-15 for screening somatoform disorders in a primary care setting. J Psychosom Res. (2011) 71:142–7. doi: 10.1016/j.jpsychores.2011.01.006
22. Qian J, Ren Z Q, De-Hua Y U, et al. The value of the patient health questionnaire-15 (PHQ-15) for screening somatic symptoms in general hospital. Chin Mental Health J. (2014) 28:173–8. doi: 10.3969/j.issn.1000-6729.2014.03.003
23. Epskamp S, Waldorp LJ, Mõttus R, Borsboom D. The Gaussian graphical model in cross-sectional and time-series data. Multivar Behav Res. (2018) 53:453–80. doi: 10.1080/00273171.2018.1454823
24. Friedman J, Hastie T, Tibshirani R. Sparse inverse covariance estimation with the graphical lasso. Biostatistics. (2008) 9:432–41. doi: 10.1093/biostatistics/kxm045
25. Hevey D. Network analysis: A brief overview and tutorial. Health Psychol Behav Med. (2018) 6:301–28. doi: 10.1080/21642850.2018.1521283
26. Borsboom D, Cramer AOJ. Network analysis: an integrative approach to the structure of psychopathology. Annu Rev Clin Psychol. (2013) 9:91–121. doi: 10.1146/annurev-clinpsy-050212-185608
27. Epskamp S, Borsboom D, Fried EI. Estimating psychological networks and their stability: a tutorial paper (2016). Behav Res Methods. (2018) 50:195–212. doi: 10.3758/s13428-017-0862-1
28. Gauld C. Introduction aux réseaux de symptômes en psychopathologie. Méd Sci. (2020) 36:163–8. doi: 10.1051/medsci/2020016
29. Yang XY, Cao RX, Zhang Y, et al. Detection rate and characteristics of adult outpatients with multiple somatic symptoms of general hospitals in Beijing. Chin J Psychiatry. (2019) 52:8. doi: 10.3760/cma.j.issn.1006-7884.2019.04.004
30. Ionescu CG, Talasman AA, Badarau IA. Somatization and sleep quality on patients with comorbid anxiety/depression. Maedica. (2021) 16:246–54. doi: 10.26574/maedica.2021.16.2.246
31. Chen L, Jia SM, Li P. Qualitative research on somatic symptoms in depression. J Chinese General Practice. (2019) 22: 3634–8. doi: 10.12114/j.issn.1007-9572.2019.00.023
32. Chen L, Jia S, Li P, Shi Z, Li Y. Experiences and coping strategies of somatic symptoms in patients with depressive disorder: a qualitative study. Arch Psychiatr Nurs. (2022) 38:6–13. doi: 10.1016/j.apnu.2022.01.004
33. Casiano VE, Sarwan G, Dydyk AM, Varacallo M. Back pain. In: StatPearls. Treasure Island (FL): StatPearls Publishing (2022).
34. Herrman H, Patel V, Kieling C, Berk M, Buchweitz C, Cuijpers P, et al. Time for united action on depression: a lancet–world psychiatric association commission. Lancet. (2022) 399:957–1022. doi: 10.1016/S0140-6736(21)02141-3
35. Zis P, Daskalaki A, Bountouni I, Sykioti P, Varrassi G, Paladini A. Depression and chronic pain in the elderly: Links and management challenges. Clin Interv Aging. (2017) 12:709–20. doi: 10.2147/CIA.S113576
36. IsHak WW, Wen RY, Naghdechi L, Vanle B, Dang J, Knosp M, et al. Pain and depression: a systematic review. Harvard Rev Psychiatry. (2018) 26:352–63. doi: 10.1097/HRP.0000000000000198
37. Kwekkeboom K, Zhang Y, Campbell T, Coe CL, Costanzo E, Serlin RC, et al. Randomized controlled trial of a brief cognitive-behavioral strategies intervention for the pain, fatigue, and sleep disturbance symptom cluster in advanced cancer. Psychooncology. (2018) 27:2761–9. doi: 10.1002/pon.4883
38. Long NH, Thanasilp S, Thato R. A causal model for fatigue in lung cancer patients receiving chemotherapy. Eur J Oncol Nurs. (2016) 21:242–7. doi: 10.1016/j.ejon.2015.10.010
Keywords: depression, somatic symptoms, network analysis, PHQ-15, China
Citation: Li Y, Jia S, Cao B, Chen L, Shi Z and Zhang H (2023) Network analysis of somatic symptoms in Chinese patients with depressive disorder. Front. Public Health 11:1079873. doi: 10.3389/fpubh.2023.1079873
Received: 25 October 2022; Accepted: 23 February 2023;
Published: 13 March 2023.
Edited by:
Wulf Rössler, Charité Universitätsmedizin Berlin, GermanyReviewed by:
Jie Chen, University of Maryland, Baltimore, United StatesCopyright © 2023 Li, Jia, Cao, Chen, Shi and Zhang. This is an open-access article distributed under the terms of the Creative Commons Attribution License (CC BY). The use, distribution or reproduction in other forums is permitted, provided the original author(s) and the copyright owner(s) are credited and that the original publication in this journal is cited, in accordance with accepted academic practice. No use, distribution or reproduction is permitted which does not comply with these terms.
*Correspondence: Shoumei Jia, amlhc2htQGZ1ZGFuLmVkdS5jbg==; Baohua Cao, Y2JoNTI4QGZtbXUuZWR1LmNu
Disclaimer: All claims expressed in this article are solely those of the authors and do not necessarily represent those of their affiliated organizations, or those of the publisher, the editors and the reviewers. Any product that may be evaluated in this article or claim that may be made by its manufacturer is not guaranteed or endorsed by the publisher.
Research integrity at Frontiers
Learn more about the work of our research integrity team to safeguard the quality of each article we publish.