- 1School of Nursing, Chengdu Medical College, Chengdu, China
- 2Sichuan Cancer Hospital and Institute, Sichuan Cancer Center, School of Medicine, University of Electronic Science and Technology of China, Chengdu, China
Objective: To develop a mapping algorithm that can be used to predict EQ-5D-5L health utility scores from FACT-H&N and obtain health utility parameters for Chinese patients with papillary thyroid carcinoma (PTC), which can be used for cost-utility analysis in health economic.
Methods: A total of 1,050 patients with PTC from a tertiary hospital in China were included, and they completed FACT-H&N and EQ-5D-5L. Four mapping algorithms of direct mapping functions were used to derive the models: Ordinary least squares (OLS), Tobit model (Tobit), Two-part model (TPM), and Beta mixture regression model (Beta). The goodness-of-fit of models was assessed by the mean absolute error (MAE), root mean square error (RMSE), Akaike information criteria (AIC), Bayesian information criteria (BIC), and absolute error (AE). A fivefold cross-validation method was used to test the stability of the models.
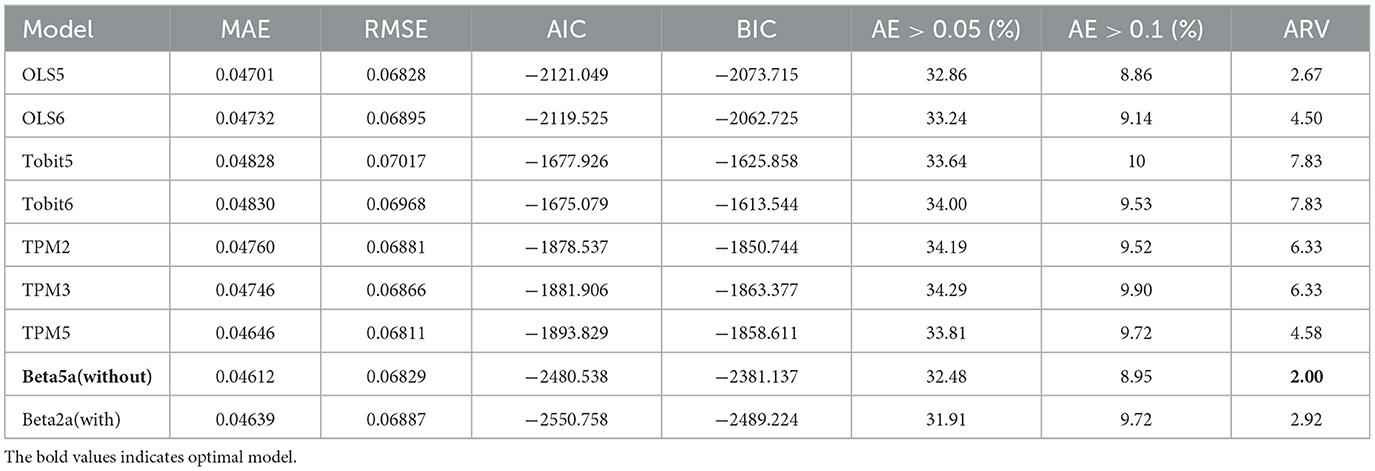
Results: The mean utility value of the EQ-5D-5L was 0.870 ± 0.094. The mean EQ-VAS score was 76.5 ± 13.0. The Beta mixture regression model mapping FACT-H&N to EQ-5D-5L achieved the best performance [fivefold cross-validation MAE = 0.04612, RMSE = 0.06829, AIC = −2480.538, BIC = −2381.137, AE > 0.05 (%) = 32.48, AE > 0.1 (%) = 8.95]. The independent variables in this model were Physical Well-Being (PWB), Emotional Well-Being (EWB), Head & Neck Cancer Subscale (HNCS) scores and its square term and interaction term scores.
Conclusions: This study calculated the health utility score of Chinese patients with PTC. The reported algorithms can be used to map the FACT-H&N into the EQ-5D-5L, which can be applied in the cost-utility related study of patients with PTC.
1. Introduction
Thyroid cancer is a most common head and neck cancer, with papillary thyroid carcinoma (PTC) accounting for approximately 90% in thyroid cancer (1). According to the global cancer statistics (2), the thyroid cancer is the ninth most malignant tumor. In China, the incidence and mortality of thyroid cancer continue to rise (3), affecting the patient's health-related quality of life (HRQoL) and the utilization of health resources. Health economic evaluation plays a key role in medical resource allocation and clinical decision-making, and its preferred method is cost-utility analysis (4).
In the cost-utility analysis of cancer treatment, the most important and commonly used health outcomes are quality-adjusted life years (QALYs) (5, 6). Calculating QALYs requires measuring health utility values. The EuroQol five-dimensional 5 level (EQ-5D-5L) is currently the most widely used preference-based health utility instrument at home and abroad that can be used to calculate health utility values (7, 8). Functional Assessment of Cancer Therapy (FACT) is one of the most widely used instruments to measure health-related quality of life in cancer patients (9) and related mapping studies have covered breast cancer (10–13), ovarian cancer (14), colorectal cancer (15, 16), lung cancer (15, 17), prostate cancer (18, 19) and others. However, FACT-H&N (Functional assessment questionnaire for the treatment of head and neck cancer) is a non-preference-based instrument and cannot be directly used for calculating health utility values. Meanwhile, in clinical experiments or work, the EQ-5D-5L is not universally measured, and non-preference-based instruments are more widely used. In such cases, it is common to use “mapping” to convert the available health status data from a non-preference-based measure to utility values for a generic preference-based measure (20). The mapping methods include direct mapping and indirect mapping methods (21). In this study, we adopted direct mapping method.
Ordinary least squares (OLS), Tobit model (Tobit), and Two-part model (TPM) are the most common mapping models of direct mapping functions, and Beta mixture regression models have been developed and gradually applied in recent years. By reviewing the literature, we did not find mapping studies of the FACT-H&N in thyroid cancer. The purpose of this study was to develop a mapping algorithm from the FACT-H&N to the EQ-5D-5L based on the Chinese PTC population.
2. Materials and methods
2.1. Study subjects
The study was conducted from May to December 2021 at Sichuan Cancer Hospital, a large tertiary-grade oncology hospital that provides medical services to most cancer patients in southwestern China. The inclusion criteria for this study were as follows: (1) patients with PTC diagnosed by pathology; (2) aged between 18 and 80 years old; (3) clear thinking, normal spirit, and a certain ability to understand and express; and (4) willing to participate in this study and sign the “informed consent form”. A total of 1,100 patients with PTC participated in the survey, and some patients were excluded due to missing values in their survey. Thus, 1,050 patients who completed the entire questionnaires were included in the data analysis. Three investigators who had received strict training participated in the investigation. The questionnaires included the general demographic data of the patients and instruments (FACT-H&N, EQ-5D-5L). The clinical treatment information of the patients was provided by the electronic medical record system of the hospital. After all questionnaires were completed, three investigators jointly checked whether there were any missing items so that we could contact the respondents.
2.2. Instruments
2.2.1. FACT-H&N
The FACT-H&N was designed at the Rush University Medical Center in Chicago, USA. The Chinese version of the FACT-H&N has good reliability and construct validity and can be used to determine the quality of life of Chinese patients with head and neck cancer (22–24). We contacted the research institution of the FACT-H&N; obtained the Chinese version and the scoring rules; and obtained the authorization of the instrument. The FACT-H&N investigates the situation of patients seven days before the day of investigation, and the specific subscale include Physical Well-being (PWB), Social/Family Well-being (SWB), Emotional Well-being (EWB), Functional Well-being (FWB) and Head & Neck Cancer Subscale (HNCS), with a total of 39 items. The scores of the items contained in each domain were summed to obtain the crude score of this domain, and the scores of these five domains were summed to obtain the total score, which ranged from 0 to 148, where a higher overall score indicates a better corresponding quality of life (25, 26).
2.2.2. EQ-5D-5L
The EQ-5D-5L was developed by the European Quality of Life Group, which is a commonly used preference-based health utility instrument (27–30). The instrument consists of a five-dimensional self-assessment and visual analogue instrument (EQ-VAS). Five dimensions include: mobility, self-care, daily activities, pain or discomfort, anxiety and depression, and each dimension is divided into no, slight, moderate, severe, extreme problems. The EQ-VAS is a instrument marked with numbers from zero to one hundred, with one hundred representing the best imaginary health condition and zero representing the worst imaginable health condition. The patients mark the instrument according to their perceived health condition on the day of the survey. We contacted the research and development institution of the EQ-5D-5L and obtained the instrument authorization and scoring rules. We used the Chinese population tariff to calculate the health utility score (31, 32), which can provide a valid reference for this value set. The Chinese tariff of the EQ-5D-5L was developed by the time trade-off (TTO) technique, which has a theoretical range of scores from −0.391 to 1.0 (33).
2.3. Statistical analysis
2.3.1. Descriptive statistical analysis
Statistical measures such as percentage, mean, and standard deviation were used to describe the patient characteristics. In our study, EQ-5D-5L health utility data showed a skewed distribution; therefore, univariate analysis was performed using the rank sum test for patient characteristics to obtain factors affecting health utility, of which the Wilcoxon rank sum test was used for two-category data and the Kruskal–Wallis H-test was used for multicategory data. Multivariate analysis of factors influencing health utility values using Tobit regression.
2.3.2. Correlations between instruments
Spearman's correlation coefficient was used to explore the correlation between the EQ-5D-5L and the FACT-H&N, if the correlation is poor, then the mapping function will perform poorly (34). The reference value for the strength of the relationship are as follows: 0–0.19 is regarded as very weak, 0.2–0.39 as weak, 0.40–0.59 as moderate, 0.6–0.79 as strong and 0.8–1 as very strong correlation (35).
2.3.3. Establishment of the mapping model
The following four modeling approaches were used to predict EQ-5D-5L health utility values.OLS is the most widely used method in the mapping literature (36, 37) and is a commonly used linear regression model. However, OLS can be affected by the ceiling effect, where a bias of underestimation with high values and overestimation with low values will occur; thus, the model is theoretically not fully applicable to the mapping of health utility values (38).
In some cases, Tobit model can mitigate ceiling effects in health utility measures. Tobit is a censored model that aims to estimate the linear relationship between variables when the dependent variable is left-censored or right-censored (39). Tobit is sensitive to violations of heteroskedasticity or non-normality (40).
The TPM model is considered an alternative estimation ways when analyzing skewed data, which reduces the bias in highly skewed distributions caused by the ceiling effect of the utility score (41). The first part of the TPM model uses logistic regression to estimate the probability that a patient is perfectly healthy, and the second part uses the previous OLS model to estimate a patient's health utility score when not perfectly healthy and then combines the two models to obtain the final health utility value.
Because mapping model's predictions can be outside the bounds, the typical linear regression models do not fit a bounded dependent variable and cannot manage extreme values (zero and one) on the bounds of that interval. Beta mixture regression models provide flexible means to regress outcome distributions with truncation support. The disadvantage of this model is that the irregularity of the distribution leads to inconsistent parameter estimates. The model generalizes to values that allow either or both boundaries by adding a degenerate distribution with a probability mass at the boundaries, which is called the truncated-inflated Beta model. The Beta model is flexible, where the first part analyses an incompletely healthy sample, and the second part uses the full sample and, based on the first part, estimates an inflated truncated mixed beta regression. The Beta model can fit models with and without truncation, as well as truncate models at the bottom or top of an interval range. It can predict health tools at various points, including negative values, observed peaks at full health or death, gap values between boundaries, and a mixture of the numeric components of the beta distribution. The command “truncation” in Stata software is used to determine whether there is a truncation in the model (42). Here we only consider the inflation part of the model at perfect health.
In our study, the mapping models of OLS, Tobit, TPM, and Beta were used to evaluate the following six different sets of independent variables:
Mode l: FACT-H&N total score as the primary predictor of health utility score, such as OLS1, Tobit1, etc.
Model 2: Such as OLS2, Tobit2, etc. The independent variables of the models were the score of each subscale of the FACT-H&N, including PWB, SWB, EWB, FWB, HNCS.
Model 3: Such as OLS3, Tobit3, etc. The independent variables were the meaningful subscale scores in each dimension score of Model 2: PWB, EWB, HNCS, where P < 0.01 were considered significant.
Model 4: Such as OLS4, etc. The independent variables were those of Model 3 and the squared terms of the meaningful subscale scores (PWB, EWB, HNCS).
Model 5: Such as OLS5, etc. The independent variables were those of Model 4 and the interaction terms of the meaningful subscale scores (PWB, EWB, HNCS).
Model 6: Such as OLS6, etc. The independent variables were those of Model 5 and age, gender.
The Beta model was explained here (see Table 3 for details):
Beta 1a: the first model of Beta was the total score of FACT-H&N, and there was one component.
Beta 1b: the first model of Beta was the total score of FACT-H&N, and there were two components.
Beta 1c: the first model of Beta was the total score of FACT-H&N, and there were three components.
Beta 2a: the first model of Beta was each dimension of the instrument, and there was one component.
Beta 3a: the first model of Beta was a meaningful dimension, there was one component, etc. Because the Beta model may have problems with convergence, some models can only have one component.
Beta model without truncation: the Beta model without a cut-off value.
Beta with truncation: the Beta model with a cut-off value.
2.3.4. Model validation and evaluation
A fivefold cross-validation method was used to test the predictive performance of the model, and all samples were randomly divided into two groups: 80% of the samples were used to estimate the dataset, 20% of the samples were used to validate the dataset, and the above four mapping algorithms were used to predict health utility values. The prediction procedure was repeated five times, and the mean absolute error (MAE), root mean square error (RMSE), Akaike information criteria (AIC), Bayesian information criteria (BIC), and absolute error (AE) of the nine better models were obtained. The smaller the values were, the better the model performance. Values from these indicators were ranked and summed to generate an average ranking (ARV). The model with the lowest ARV would be chosen as the optimal model (43, 44). In addition, the performance of the model can also be visualized by plotting the scatter plot, error histogram, etc. All statistical analyses were performed in Stata version 16.0.
3. Results
3.1. Patient characteristics and descriptive analysis
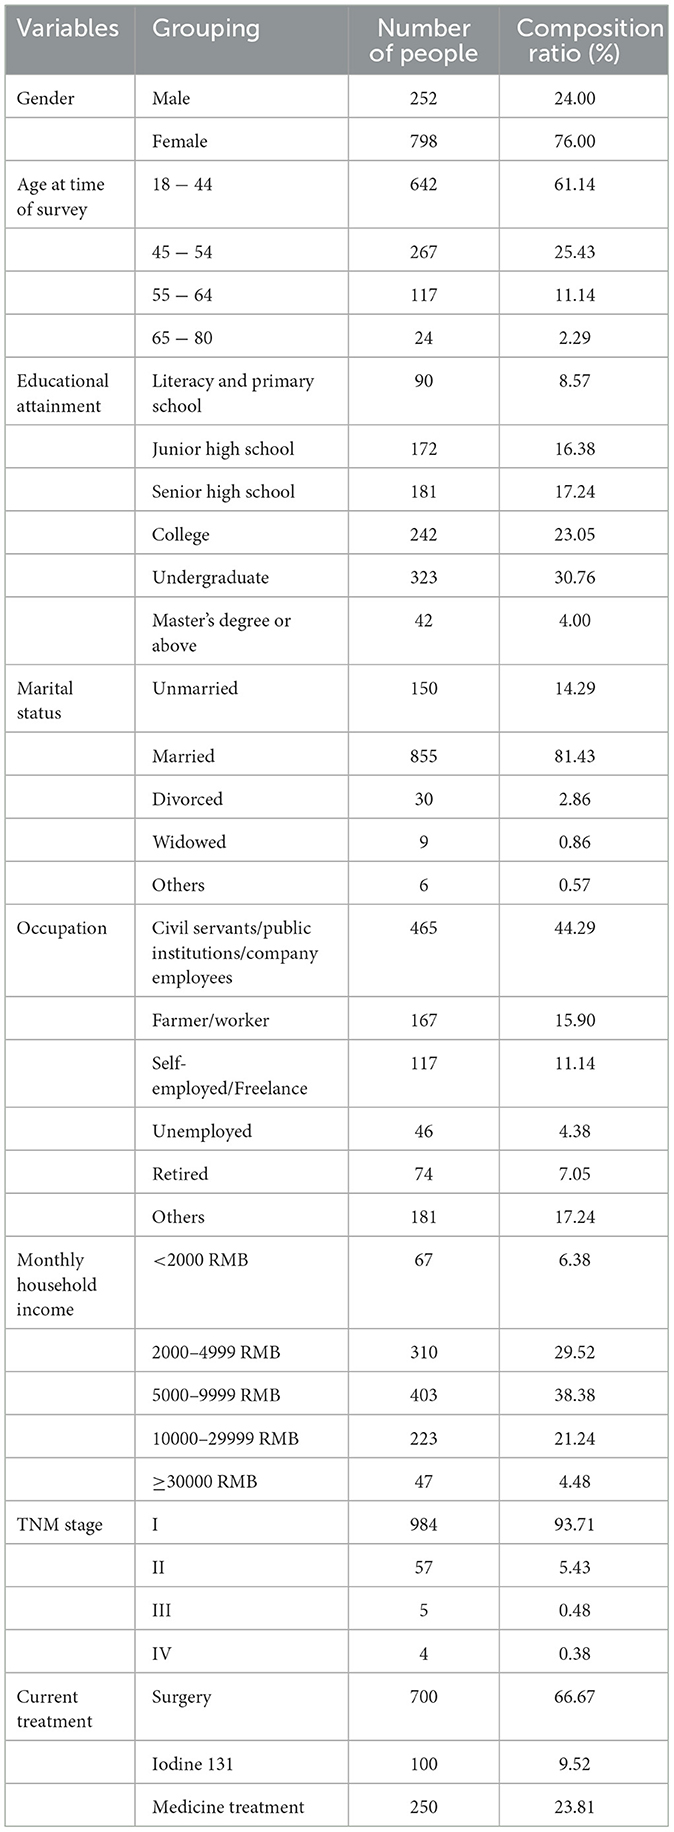
A total of 1,050 patients with PTC were included in this study. Women account for 76% of the sample size. The average age of the overall sample was 40.76 years old. Table 1 showed the patient characteristics. The mean utility score on the EQ-5D-5L was 0.870 (standard deviation 0.094), and the mean on the EQ-VAS was 76.5 (standard deviation 13.0). The mean of the FACT-H&N was 108.152 (standard deviation 15.478). The highest score in each subscale of the FACT-H&N was EWB, and the lowest score was FWB. Among the dimensions of the EQ-5D-5L, the dimension that accounted for the largest proportion was no difficulty in mobility (90%).
3.2. Correlations between instruments
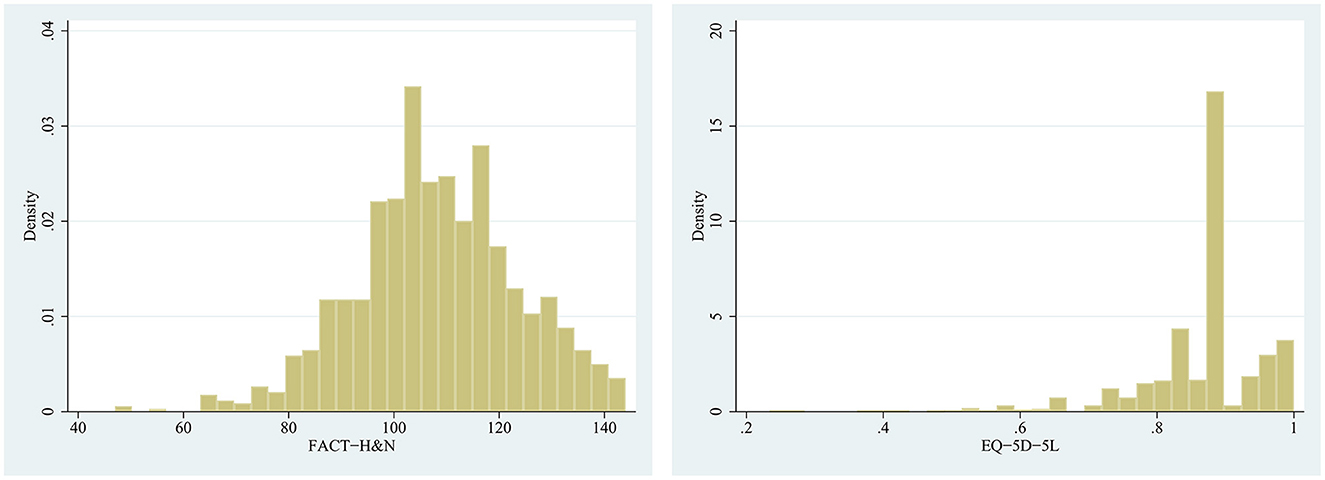
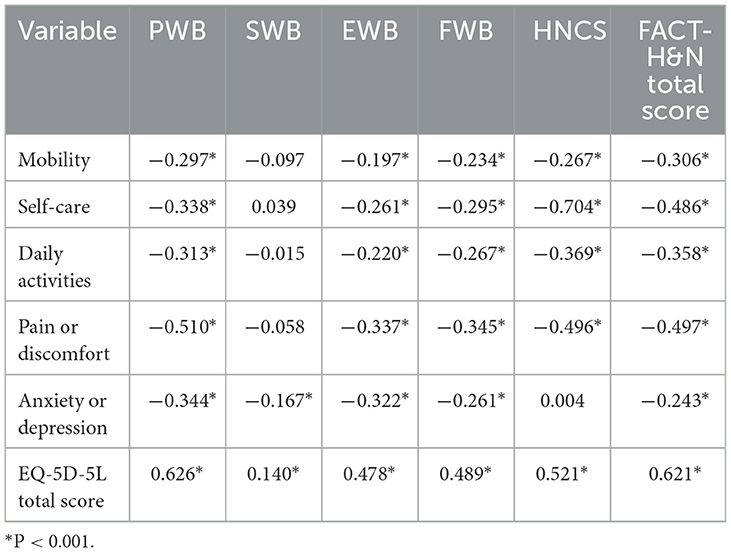
Figure 1 showed histograms of the FACT-H&N and the EQ-5D-5L scores, with the data for both scales being right skewed. Table 2 Spearman rank correlation analysis showed that the total score of EQ-5D-5L was significantly positively correlated with the total score of FACT-H&N (Spearman correlation coefficient was 0.621). The total score of the EQ-5D-5L and the scores of each dimension of the FACT-H&N were correlated, and the correlation coefficient ranged from 0.140 to 0.626. The correlation coefficient between the total score of the FACT-H&N and the scores of each item of the EQ-5D-5L was between −0.497 and −0.243, and the correlation coefficient between the scores of each dimension of the FACT-H&N and the scores of each item of the EQ-5D-5L was −0.704 to 0.039, except for SWB and individual items of HNCS (*P < 0.001).
3.3. Performance of the model
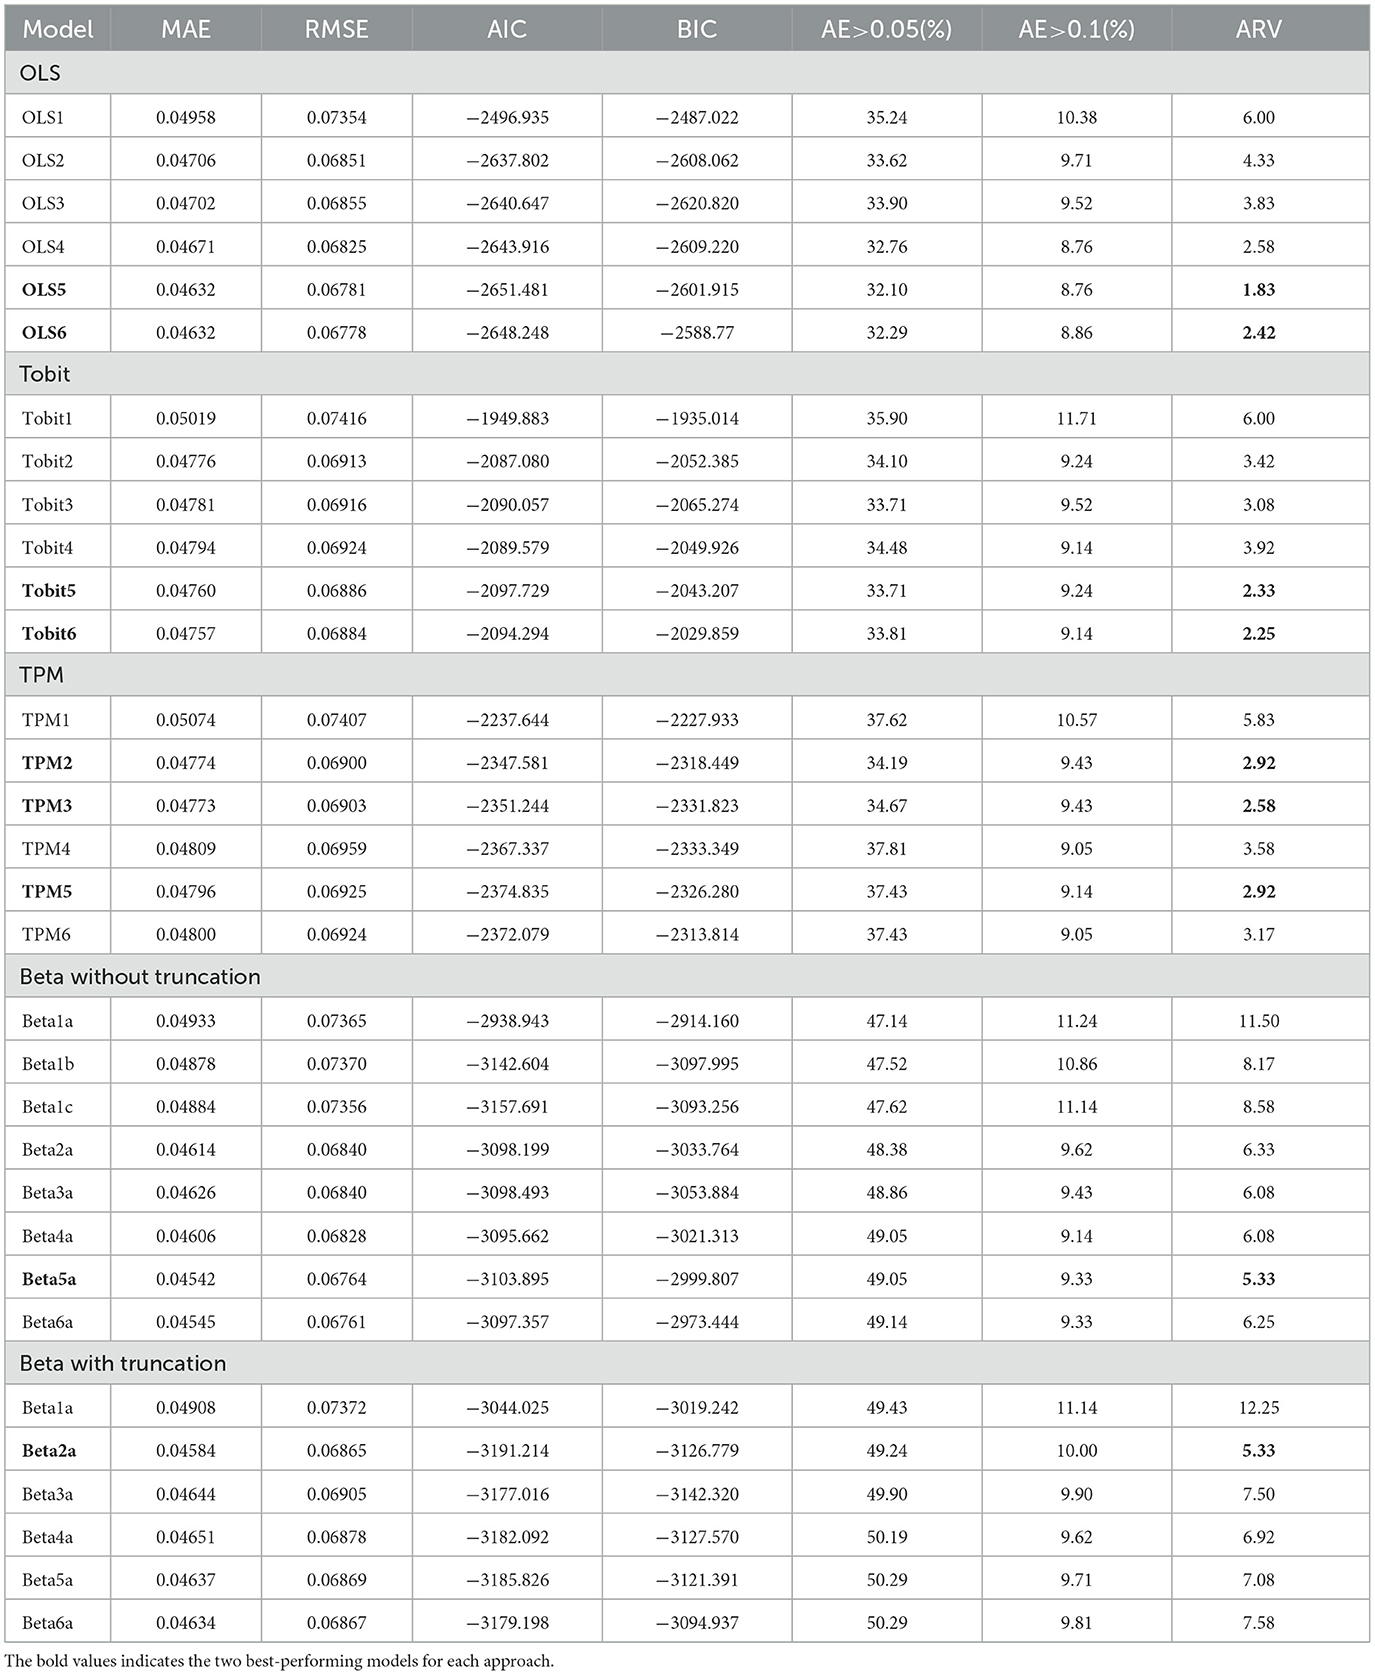
We used four mapping algorithms to build 32 models, including OLS (OLS1-6), Tobit (Tobit1-6), TPM (TPM1-6), Beta (Beta1a, Beta1b, Beta1c, Beta2a, Beta3a, Beta4a, Beta5a, Beta6a without/with truncation point). The detailed performance of 32 models was shown in Table 3, and we performed an average ranking (ARV) of the performance indicators of each model. The regression coefficients of each model and covariance matrix of coefficients of preferred Beta model were shown in Supplementary Tables 1–5.
In each model, we selected the two best models (the two lowest ARV models) for final model screening. OLS5 and OLS6, Tobit5 and Tobit6, TPM2, TPM3, and TPM5, Beta 5a without truncation and Beta 2a with truncation models performed best in their respective mapping algorithms. Fivefold cross-validation was performed on the selected nine models, as shown in Table 4. After comprehensive consideration, the EQ-5D-5L utility scores was best predicted by the Beta 5a (without truncation point) consisting of PWB scores, EWB scores, HNCS scores and its square and interaction terms scores (there was no cutoff value, component was 1).
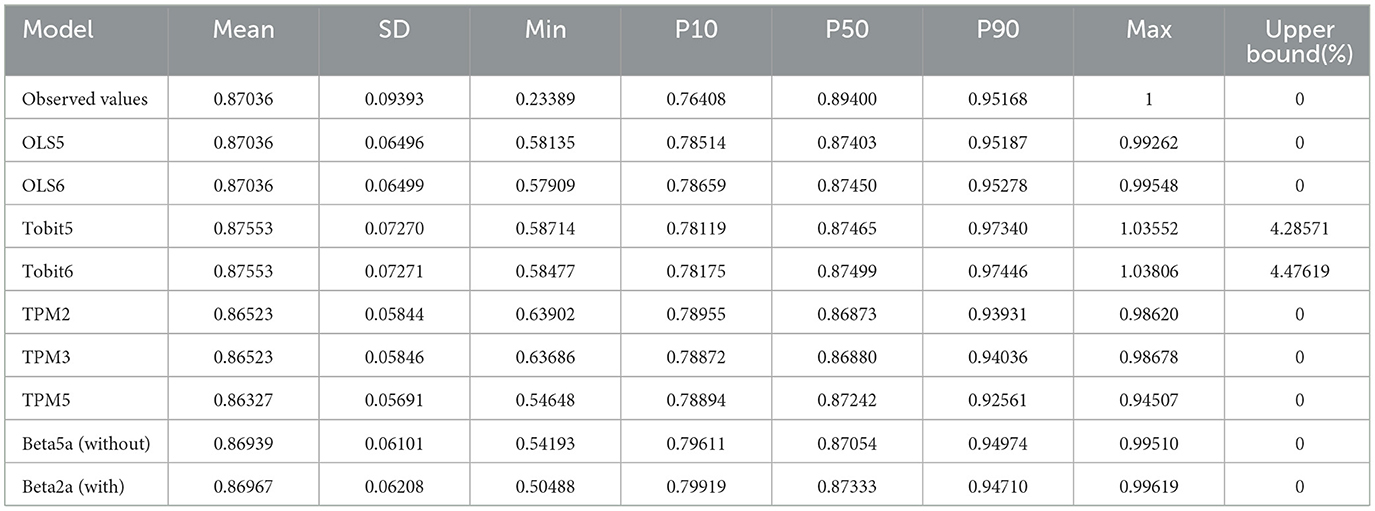
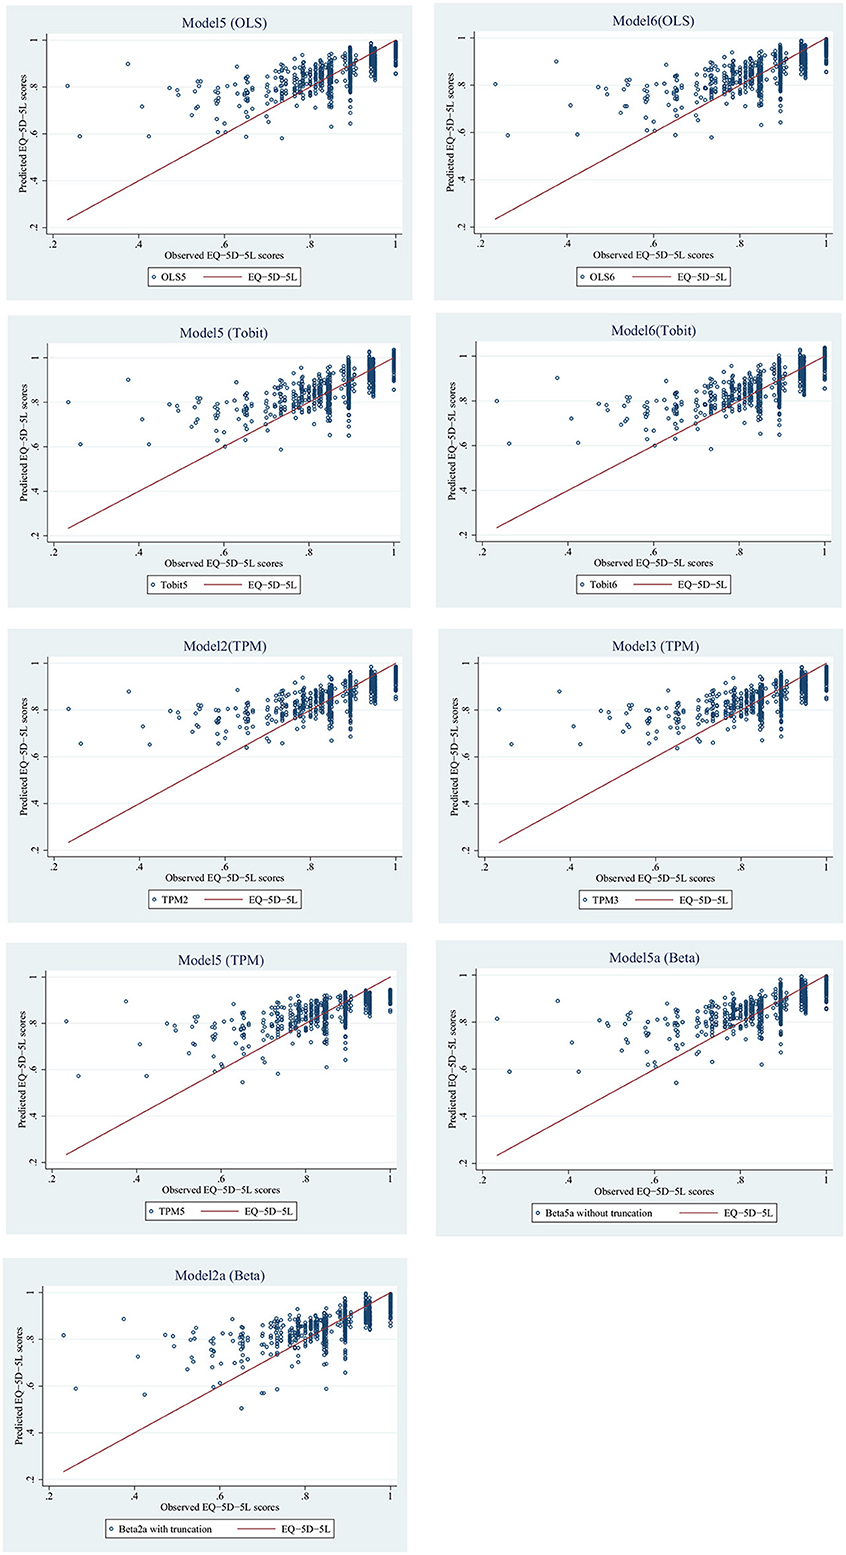
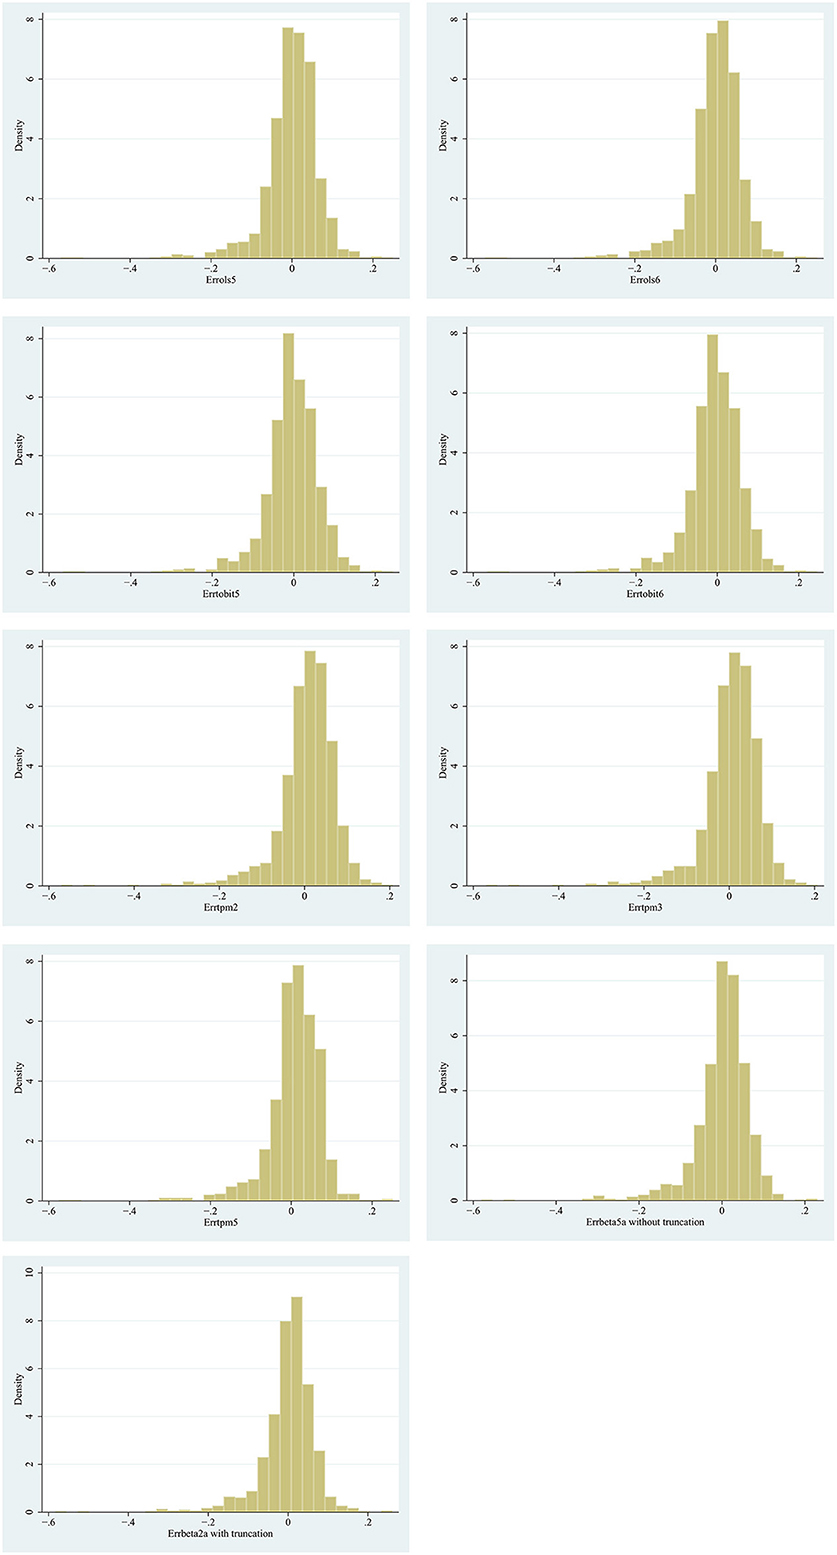
These nine models were used to estimate the predicted value of the EQ-5D-5L, and results were shown in Table 5, and their scatter plots and error histograms were plotted with these nine best models (Figures 2, 3). Based on the above results, OLS5, Tobit5, Tobit6, TPM5, and Beta5a (without truncation) were the best performing models in their respective mapping algorithms. The cumulative distribution function graph of these five models were shown below (Figure 4). Overall, the predicted value of Beta 5a (without truncation) was closest to the observed value. The excel calculator for the best-fitting model was provided in the Supplementary Table 5, which make it easy for the user to calculate the EQ-5D-5L from FACT-H&N scores.
4. Discussion
To knowledge, our study was the first to develop a mapping algorithm in PTC patients using the FACT-H&N and EQ-5D-5L and predict health utility values. We explored four different mapping methods with 32 models to find the most accurate predictive model to develop the mapping function. We mapped the FACT-H&N to the EQ-5D-5L using data from 1050 PTC patients in China.
EQ-5D itself has the nature of ceiling effect, resulting in utility scores that are not normally distributed (45). The EQ-5D-5L had lower rate in the ceiling effect than EQ-5D-3L (46, 47). In our study, a total of 101 (9.62%) respondents reported complete health, the ceiling effect of the EQ-5D-5L was not obvious, and the mean utility value of the EQ-5D-5L was 0.870 ± 0.094. Despite the mean EQ-5D-5L value was high, our ceiling effect was not evident, which may be due to the differences in health utility scores among thyroid patients with different status (surgery, Iodine 131, medicine treatment) in our study. It is worth noting that we also differed from other studies on EQ-5D-5L scores and ceiling effects. Compared with the other two breast cancer studies (48, 49), our EQ-5D-5L was higher (the other two: 0.5627, 0.52), and the ceiling effect was higher (the other two: 5.84%, 3.85%). This may be because different countries use different versions of the EQ-5D-5L, leading to differences in health preferences between countries. It could also be due to different sample sizes, diseases, and male to female ratios.
We found that the correlation coefficient between FACT-H&N and EQ-5D-5L was 0.621, indicating that there was a strong correlation between the two instruments. The variables included in the best model Beta 5a (without truncation point) were PWB, EWB, HNCS subscales scores and their squared and interactive terms scores, and the model was relatively robust. According to the five-fold cross-validation of the model, the Beta model had the lowest ARV, indicating that it fit the data best. According to the predicted value obtained by the model, the predicted value of Beta 5a (without truncation point) was nearest the observed value; thus, the Beta model was selected as the optimal model. Compared with several other mapping studies that used the Beta mixture regression model (40, 50, 51), our MAE, RMSE, AIC, BIC, and AE values were lower, and sample size was larger, which demonstrated that the model in our study was effective and achieved a better prediction performance.
Through extensive literature searches, we found that linear regression was typically used to map a quality of life instrument to the EQ-5D-5L, and the most commonly used model was OLS (37, 39, 40, 43, 52). Actually, the Beta model was more flexible because it was suitable for a bounded dependent variable in the interval and can take values at the boundary (40). In the mapping-related literature, the Beta mixture regression model has been used more in recent years (40, 50, 51). A systematic review noted that the introduction of square terms and interaction terms of independent variables into mapping models can improve model performance (53, 54). In our study, the OLS5, Tobit5, Tobit6, TPM5, and Beta 5a (without truncation) performed best, indicating that the square and interaction terms do improve model performance. Many studies illustrated that socio-demographic variables were independent varibles that affect the quality of life and can improve model performance (43, 52, 55). In the results of the study, we found gender to be statistically significant (P < 0.05) and did not find age to be statistically significant in predicting EQ-5D-5L scores. The significance of age found in other studies could be related to the type of cancer or the age range of the populations (56). According to the ISPOR guidelines (57), for most of mapping functions, the inclusion of age as a covariate was required even if not statistically significant. A recent systemic review of mapping studies showed that age was included as a potential predictor in 51% of the reported algorithms and gender was included in 55% (9). So we addded age and gender to Model 6. Only Tobit6 proved this, indicating that the improvement was small in our study.
The advantages of our study were as follows. First, the sample size was relatively large (n = 1,050). For other single-disease and single-center mapping-related studies, the sample size was primarily 200–300. Second, we used four mapping methods of direct mapping functions to develop a robust mapping model to predict the EQ-5D-5L health utility score in PTC patients, which can be used to assess the quality of life of PTC patients for use in health economics. Furthermore, to date, there were no published reports of the measurement of thyroid cancer health utility mapping models and related data on the Chinese population at home and abroad; thus, this study was important. Moreover, to improve the robustness of the model, this study performed five-fold cross-validation on the sample.
However, our study had the following limitations. First, due to the high survival rate and good prognosis of PTC patients, this cancer is commonly known as “happy cancer”, and the overall quality of life is better than that of other cancers. Respondents had generally high EQ-5D-5L scores, with only 24 (2.3%) having a utility value below 0.5, no negative utility value, and a small percentage of patients with poor quality of life, which may have affected the low-value prediction accuracy. Second, the sample size of the study was relatively large, but the survey was only conducted in one hospital and cannot be widely representative of all of China. Third, when examining the performance of mapping models, the lack of external validation in this study may limited the generalizability and extrapolation of its findings. Fourth, we used Chinese specific tariff, and whether the findings can be applied to other countries requires further research.
Despite these limitations, we demonstrated that the Beta mixture regression model performed much better than other models, and the mapping algorithm in the study could be used to predict the health utility value of the EQ-5D-5L in PTC patients.
Data availability statement
The raw data supporting the conclusions of this article will be made available by the authors, without undue reservation.
Ethics statement
The studies involving human participants were reviewed and approved by the Ethics Committee of Sichuan Cancer Hospital. The patients/participants provided their written informed consent to participate in this study.
Author contributions
Data collection and analysis were performed by JP, NC, and LJ. The first draft of the manuscript was written by QY and DH. All authors contributed to the article and approved the submitted version.
Funding
This work was supported by the Key Project of Department of Science and Technology of Sichuan Province, China (Grant Number: 2020YFS0397).
Acknowledgments
We thank all participants in Sichuan Cancer Hospital. We also thank Dr. Yuqiu Zhou, Dr. Yongjin Li, Dr. Jinmin Yang, and Dr. Xiaojing Li.
Conflict of interest
The authors declare that the research was conducted in the absence of any commercial or financial relationships that could be construed as a potential conflict of interest.
Publisher's note
All claims expressed in this article are solely those of the authors and do not necessarily represent those of their affiliated organizations, or those of the publisher, the editors and the reviewers. Any product that may be evaluated in this article, or claim that may be made by its manufacturer, is not guaranteed or endorsed by the publisher.
Supplementary material
The Supplementary Material for this article can be found online at: https://www.frontiersin.org/articles/10.3389/fpubh.2023.1076879/full#supplementary-material
Abbreviations
AIC, Akaike Information Criteria; AE, Absolute Error; ARV, Average ranking values; BIC, Bayesian Information Criteria; Beta, Beta mixture regression model; EQ-5D, EuroQol five-dimensional 5 level; EWB, Emotional Wellbeing; EQ-VAS, EQ-Visual Analog Scaling; FWB, Functional Wellbeing; FACT-H&N, Functional Assessment of Cancer Therapy-Head and neck cancer; HRQoL, Health-related quality of life; MAE, mean absolute error; OLS, Ordinary least squares; HNCS, Head and Neck Cancer Subscale; PWB, Physical Wellbeing; PTC, Papillary Thyroid Carcinoma; QALYs, Quality-adjusted life years; RMSE, root mean squared error; SWB, Social/family Wellbeing; Tobit, Tobit model; TPM, Two-Part Model.
References
1. Siegel RL, Miller KD, Jemal A. Cancer statistics, 2020. CA Cancer J Clin. (2020) 70:7–30. doi: 10.3322/caac.21590
2. Sung H, Ferlay J, Siegel RL, Laversanne M, Soerjomataram I, Jemal A, et al. Global cancer statistics 2020: GLOBOCAN estimates of incidence and mortality worldwide for 36 cancers in 185 countries. CA Cancer J Clin. (2021) 71:209–49. doi: 10.3322/caac.21660
3. Zheng R, Zhang S, Zeng H, Wang S, Sun K, Chen R, et al. Cancer incidence and mortality in China, 2016. JNCC-J Nat Cancer Cent. (2022) 2:1–9. doi: 10.1016/j.jncc.2022.02.002
4. Hettiarachchi RM, Kularatna S, Downes MJ, Byrnes J, Kroon J, Lalloo R, et al. The cost-effectiveness of oral health interventions: a systematic review of cost-utility analyses. Commun Dent Oral Epidemiol. (2018) 46:118–24. doi: 10.1111/cdoe.12336
5. Yuan S, Thompson J, Walker AS, Paton NI, Villacian J. Mapping the medical outcomes study HIV health survey (MOS-HIV) to the EuroQoL 5 dimension (EQ-5D-3L) utility index. Health Qual Life Outcomes. (2019) 17:83. doi: 10.1186/s12955-019-1135-8
6. Hagiwara Y, Shiroiwa T, Taira N, Kawahara T, Konomura K, Noto S, et al. Mapping EORTC QLQ-C30 and FACT-G onto EQ-5D-5L index for patients with cancer. Health Qual Life Outcomes. (2020) 18:354. doi: 10.1186/s12955-020-01611-w
7. Su J, Liu T, Li SP, Zhao Y, Kuang YH, A. mapping study in mainland China: predicting EQ-5D-5L utility scores from the psoriasis disability index. J Med Econ. (2020) 23:737–43. doi: 10.1080/13696998.2020.1748636
8. Noel CW, Stephens RF, Su J, Xu W, Krahn M, Monteiro E, et al. Mapping the EORTC QLQ-C30 and QLQ-H&N35, onto EQ-5D-5L and HUI-3 indices in patients with head and neck cancer. Head Neck. (2020) 42:2277–86. doi: 10.1002/hed.26181
9. Mukuria C, Rowen D, Harnan S, Rawdin A, Wong R, Ara R, et al. An Updated systematic review of studies mapping (or cross-walking) measures of health-related quality of life to generic preference-based measures to generate utility values. Appl Health Econ Health Policy. (2019) 17:295–313. doi: 10.1007/s40258-019-00467-6
10. Nahvijou A, Safari H, Yousefi M, Rajabi M, Arab-Zozani M, Ameri H. Mapping the cancer-specific FACT-B onto the generic SF-6Dv2. Breast Cancer. (2021) 28:130–6. doi: 10.1007/s12282-020-01141-9
11. Gray LA, Wailoo AJ, Hernandez Alava M. Mapping the FACT-B instrument to EQ-5D-3L in patients with breast cancer using adjusted limited dependent variable mixture models versus response mapping. Value Health. (2018) 21:1399–405. doi: 10.1016/j.jval.2018.06.006
12. Lee CF, Ng R, Luo N, Cheung YB. Development of conversion functions mapping the FACT-B Total Score to the EQ-5D-5L utility value by three linking methods and comparison with the ordinary least square method. Appl Health Econ Health Policy. (2018) 16:685–95. doi: 10.1007/s40258-018-0404-8
13. Yang Q, Yu XX, Zhang W, Li H. Mapping function from FACT-B to EQ-5D-5 L using multiple modelling approaches: data from breast cancer patients in China. Health Qual Life Outcomes. (2019) 17:153. doi: 10.1186/s12955-019-1224-8
14. Hettle R, Borrill J, Suri G, Wulff J. Estimating health-state utility values for patients with recurrent ovarian cancer using functional assessment of cancer therapy - general mapping algorithms. Clinicoecon Outcomes Res. (2015) 7:615–27. doi: 10.2147/CEOR.S92078
15. Teckle P, McTaggart-Cowan H, Van der Hoek K, Chia S, Melosky B, Gelmon K, et al. Mapping the FACT-G cancer-specific quality of life instrument to the EQ-5D and SF-6D. Health Qual Life Outcomes. (2013) 11:1–10. doi: 10.1186/1477-7525-11-203
16. Wong CK, Lam CL, Rowen D, McGhee SM, Ma K-P, Law W-L, et al. Mapping the functional assessment of cancer therapy-general or-colorectal to SF-6D in Chinese patients with colorectal neoplasm. Value Health. (2012) 15:495–503. doi: 10.1016/j.jval.2011.12.009
17. Meregaglia M, Borsoi L, Cairns J, Tarricone R. Mapping health-related quality of life scores from FACT-G, FAACT, and FACIT-F onto preference-based EQ-5D-5L utilities in non-small cell lung cancer cachexia. Eur J Health Econ. (2019) 20:181–93. doi: 10.1007/s10198-017-0930-6
18. Diels J, Hamberg P, Ford D, Price PW, Spencer M, Dass R. Mapping FACT-P to EQ-5D in a large cross-sectional study of metastatic castration-resistant prostate cancer patients. Qual Life Res. (2015) 24:591–8. doi: 10.1007/s11136-014-0794-5
19. Wu EQ, Mulani P, Farrell MH, Sleep D. Mapping FACT-P and EORTC QLQ-C30 to patient health status measured by EQ-5D in metastatic hormone-refractory prostate cancer patients. Value Health. (2007) 10:408–14. doi: 10.1111/j.1524-4733.2007.00195.x
20. Brazier JE, Yang Y, Tsuchiya A, Rowen DL, A. review of studies mapping (or cross walking) non-preference based measures of health to generic preference-based measures. Eur J Health Econ. (2010) 11:215–25. doi: 10.1007/s10198-009-0168-z
21. Mortimer D, Segal L. Comparing the incomparable? A systematic review of competing techniques for converting descriptive measures of health status into QALY-weights. Med Decis Making. (2008) 28:66–89. doi: 10.1177/0272989X07309642
22. Chang JT, Chang CH, Juang YY, Hsiao JC, Lin CY, Huang SF, et al. Internal consistency of the traditional chinese character version of the functional assessment of cancer therapy-head and neck (FACT-H&N). Chang Gung Med J. (2008) 31:384–94.
23. Zhang Y, Cui CY, Wang Y, Wang L. Effects of stigma, hope and social support on quality of life among Chinese patients diagnosed with oral cancer: a cross-sectional study. Health Qual Life Outcomes. (2020) 18:112. doi: 10.1186/s12955-020-01353-9
24. Lo PS, Lo SK, Tong MC, Ku PK, Leung SF, van Hasselt CA. Quality-of-life measurement in patients undergoing radiation therapy for head and neck cancer: a Hong Kong experience. J Oncol Manag. (2004) 13:13–23.
25. Steen-Olsen EB, Stormoen DR, Kristensen CA, Vogelius IR, Hollander-Mieritz C, Pappot H. Patient-reported outcome during radiotherapy for head and neck cancer: the use of different PRO questionnaires. Eur Arch Otorhinolaryngol. (2022) 279:4199–206. doi: 10.1007/s00405-022-07364-0
26. Gomes E, Aranha AMF, Borges AH, Volpato LER. Head and neck cancer patients' quality of life: analysis of three instruments. J Dent. (2020) 21:31–41. doi: 10.30476/DENTJODS.2019.77677.0
27. Yang F, Devlin N, Luo N. Cost-utility analysis using EQ-5D-5l data: does how the utilities are derived matter? Value Health. (2019) 22:45–9. doi: 10.1016/j.jval.2018.05.008
28. Thom L, Lowe D, Rogers SN. Implications of the quality of life metric in head and neck cancer. Br J Oral Maxillofac Surg. (2022) 60:810–16. doi: 10.1016/j.bjoms.2021.12.005
29. Jensen MB, Jensen CE, Gudex C, Pedersen KM, Sorensen SS, Ehlers LH. Danish population health measured by the EQ-5D-5L. Scand J Public Healt. (2021) 30:14034948211058060. doi: 10.1177/14034948211058060
30. Feng YS, Kohlmann T, Janssen MF, Buchholz I. Psychometric properties of the EQ-5D-5L: a systematic review of the literature. Qual Life Res. (2021) 30:647–73. doi: 10.1007/s11136-020-02688-y
31. Zhou T, Guan HJ, Wang LY, Zhang Y, Rui MJ, Ma AX. Health-related quality of life in patients with different diseases measured with the EQ-5D-5L: a systematic review. Front Public Health. (2021) 9:675523. doi: 10.3389/fpubh.2021.675523
32. Wang P, Liu GG, Jo MW, Purba FD, Yang ZH, Gandhi M, et al. Valuation of EQ-5D-5L health states: a comparison of seven Asian populations. Expert Rev Pharmacoecon Outcomes Res. (2019) 19:445–51. doi: 10.1080/14737167.2019.1557048
33. Luo N, Liu G, Li M, Guan H, Jin X, Rand-Hendriksen K. Estimating an EQ-5D-5L value set for China. Value Health. (2017) 20:662–9. doi: 10.1016/j.jval.2016.11.016
34. Longworth L, Rowen D. Mapping to obtain EQ-5D utility values for use in nice health technology assessments. Value Health. (2013) 16:202–10. doi: 10.1016/j.jval.2012.10.010
36. Dakin H, Abel L, Burns R, Yang YL. Review and critical appraisal of studies mapping from quality of life or clinical measures to EQ-5D: an online database and application of the MAPS statement. Health Qual Life Outcomes. (2018) 16:31. doi: 10.1186/s12955-018-0857-3
37. Abdin E, Chong SA, Seow E, Verma S, Tan KB, Subramaniam M. Mapping the positive and negative syndrome scale scores to EQ-5D-5L and SF-6D utility scores in patients with schizophrenia. Qual Life Res. (2019) 28:177–86. doi: 10.1007/s11136-018-2037-7
38. Wu MJ, Brazier JE, Kearns B, Relton C, Smith C, Cooper CL. Examining the impact of 11 long-standing health conditions on health-related quality of life using the EQ-5D in a general population sample. Eur J Health Econ. (2015) 16:141–51. doi: 10.1007/s10198-013-0559-z
39. Ameri H, Yousefi M, Yaseri M, Nahvijou A, Arab M, Akbari Sari A. Mapping the cancer-specific QLQ-C30 onto the generic EQ-5D-5L and SF-6D in colorectal cancer patients. Expert Rev Pharmacoecon Outcomes Res. (2019) 19:89–96. doi: 10.1080/14737167.2018.1517046
40. Lim J, Choi SE, Bae E, Kang D, Lim EA, Shin GS. Mapping analysis to estimate EQ-5D utility values using the COPD assessment test in Korea. Health Qual Life Outcomes. (2019) 17:97. doi: 10.1186/s12955-019-1148-3
41. Liu T, Li SP, Wang M, Sun Q, Chen G. Mapping the Chinese version of the EORTC QLQ-BR53 Onto the EQ-5D-5L and SF-6D utility scores. Patient. (2020) 13:537–55. doi: 10.1007/s40271-020-00422-x
42. Gray LA, Alava MH, A. command for fitting mixture regression models for bounded dependent variables using the beta distribution. Stata Journal. (2018) 18:51–75. doi: 10.1177/1536867X1801800105
43. Abdin E, Chong SA, Seow E, Tan KB, Subramaniam M. Mapping the PHQ-8 to EQ-5D, HUI3 and SF6D in patients with depression. BMC Psychiatry. (2021) 21:451. doi: 10.1186/s12888-021-03463-0
44. Yang F, Wong CK, Luo N, Piercy J, Moon R, Jackson J. Mapping the kidney disease quality of life 36-item short form survey (KDQOL-36) to the EQ-5D-3L and the EQ-5D-5L in patients undergoing dialysis. Eur J Health Econ. (2019) 20:1195–206. doi: 10.1007/s10198-019-01088-5
45. Xie F, Pullenayegum EM Li SC, Hopkins R, Thumboo J, Lo NN. Use of a disease-specific instrument in economic evaluations: mapping WOMAC onto the EQ-5D utility index. Value Health. (2010) 13:873–8. doi: 10.1111/j.1524-4733.2010.00770.x
46. Kim SH, Kim HJ, Lee SI, Jo MW. Comparing the psychometric properties of the EQ-5D-3L and EQ-5D-5L in cancer patients in Korea. Qual Life Res. (2012) 21:1065–73. doi: 10.1007/s11136-011-0018-1
47. Scalone L, Ciampichini R, Fagiuoli S, Gardini I, Fusco F, Gaeta L, et al. Comparing the performance of the standard EQ-5D 3L with the new version EQ-5D 5L in patients with chronic hepatic diseases. Qual Life Res. (2013) 22:1707–16. doi: 10.1007/s11136-012-0318-0
48. Yousefi M, Nahvijou A, Sari AA, Ameri H. Mapping QLQ-C30 Onto EQ-5D-5L and SF-6D-V2 in Patients with colorectal and breast cancer from a developing country. Value Health Reg Issues. (2021) 24:57–66. doi: 10.1016/j.vhri.2020.06.006
49. Nahvijou A, Safari H, Ameri H. Comparing the performance of the EQ-5D-5L with two versions of the SF-6Dv2 in patients with breast cancer. Health Serv Outcome. (2020) 20:183–94. doi: 10.1007/s10742-020-00215-7
50. Martin-Fernandez J, Morey-Montalvo M, Tomas-Garcia N, Martin-Ramos E, Munoz-Garcia JC, Polentinos-Castro E, et al. Mapping analysis to predict EQ-5D-5L utility values based on the Oxford Hip Score (OHS) and Oxford Knee Score (OKS) questionnaires in the Spanish population suffering from lower limb osteoarthritis. Health Qual Life Outcomes. (2020) 18:184. doi: 10.1186/s12955-020-01435-8
51. Beck A-JC, Kieffer JM, Retèl VP, van Overveld LF, Takes RP, van den Brekel MW, et al. Mapping the EORTC QLQ-C30 and QLQ-H&N35 to the EQ-5D for head and neck cancer: can disease-specific utilities be obtained? PLoS ONE. (2019) 14:e0226077. doi: 10.1371/journal.pone.0226077
52. Peiris CL, Taylor NF, Watts JJ, Shields N, Brusco NK, Mortimer D. Mapping the Functional Independence Measure to a multi-attribute utility instrument for economic evaluations in rehabilitation: a secondary analysis of randomized controlled trial data. Disabil Rehabil. (2020) 42:3024–32. doi: 10.1080/09638288.2019.1582720
53. Crott R, Briggs A. Mapping the QLQ-C30 quality of life cancer questionnaire to EQ-5D patient preferences. Eur J Health Econ. (2010) 11:427–34. doi: 10.1007/s10198-010-0233-7
54. Rowen D, Brazier J, Roberts J. Mapping SF-36 onto the EQ-5D index: how reliable is the relationship? Health Qual Life Outcomes. (2009) 7:27. doi: 10.1186/1477-7525-7-27
55. Sturkenboom RA-O, Keszthelyi D, Brandts L, Weerts Z, Snijkers JTW, Masclee AAM, et al. The estimation of a preference-based single index for the IBS-QoL by mapping to the EQ-5D-5L in patients with irritable bowel syndrome. Qual Life Res. (2022) 31:1209–21. doi: 10.1007/s11136-021-02995-y
56. Wong CK, Lam CL, Wan YF, Rowen D. Predicting SF-6D from the European organization for treatment and research of cancer quality of life questionnaire scores in patients with colorectal cancer. Value Health. (2013) 16:373–84. doi: 10.1016/j.jval.2012.12.004
Keywords: papillary thyroid carcinoma, mapping, FACT-H&N, EQ-5D-5L, Beta mixture regression model
Citation: Huang D, Peng J, Chen N, Yang Q and Jiang L (2023) Mapping study of papillary thyroid carcinoma in China: Predicting EQ-5D-5L utility values from FACT-H&N. Front. Public Health 11:1076879. doi: 10.3389/fpubh.2023.1076879
Received: 26 October 2022; Accepted: 02 February 2023;
Published: 23 February 2023.
Edited by:
Kyriakos Souliotis, University of Peloponnese, GreeceReviewed by:
Edimansyah Abdin, Institute of Mental Health, SingaporeHosein Ameri, Shahid Sadoughi University of Medical Sciences and Health Services, Iran
Copyright © 2023 Huang, Peng, Chen, Yang and Jiang. This is an open-access article distributed under the terms of the Creative Commons Attribution License (CC BY). The use, distribution or reproduction in other forums is permitted, provided the original author(s) and the copyright owner(s) are credited and that the original publication in this journal is cited, in accordance with accepted academic practice. No use, distribution or reproduction is permitted which does not comply with these terms.
*Correspondence: Qing Yang,  eWFuZ3FpbmdzY0AxNjMuY29t
 Deyu Huang1
 Qing Yang
 Longlin Jiang