- 1Department of Ophthalmology, Joint Shantou International Eye Center of Shantou University and The Chinese University of Hong Kong, Shantou University Medical College, Shantou, China
- 2Department of Preventive Medicine, Shantou University Medical College, Shantou, Guangdong, China
Background: The global rising prevalence and incidence of multiple sclerosis (MS) has been reported during the past decades. However, details regarding the evolution of MS burden have not been fully studied. This study aimed to investigate the global, regional, and national burden and temporal trends in MS incidence, deaths, and disability-adjusted life years (DALYs) from 1990 to 2019 using the age-period-cohort analysis.
Methods: We performed a secondary comprehensive analysis of incidence, deaths, and DALYs of MS by calculating the estimated annual percentage change from 1990 to 2019 obtained from the Global Burden of Disease (GBD) 2019 study. The independent age, period, and birth cohort effects were evaluated by an age-period-cohort model.
Results: In 2019, there were 59,345 incident MS cases and 22,439 MS deaths worldwide. The global number of incidences, deaths, and DALYs of MS followed an upward trend, whereas the age-standardized rates (ASR) slightly declined from 1990 to 2019. High socio-demographic index (SDI) regions had the highest ASR of incidences, deaths, and DALYs in 2019, while the rate of deaths and DALYs in medium SDI regions are the lowest. Six regions which include high-income North America, Western Europe, Australasia, Central Europe, and Eastern Europe had higher ASR of incidences, deaths, and DALYs than other regions in 2019. The age effect showed that the relative risks (RRs) of incidence and DALYs reached the peak at ages 30–39 and 50–59, respectively. The period effect showed that the RRs of deaths and DALYs increased with the period. The cohort effect showed that the later cohort has lower RRs of deaths and DALYs than the early cohort.
Conclusion: The global cases of incidence, deaths, and DALYs of MS have all increased, whereas ASR has declined, with different trends in different regions. High SDI regions such as European countries have a substantial burden of MS. There are significant age effects for incidence, deaths, and DALYs of MS globally, and period effects and cohort effects for deaths and DALYs.
Key messages
- What is already known on this topic:
We searched PubMed for articles published until September 2022 focusing on the incidence, deaths, and overall burden of multiple sclerosis (MS), using the terms “global burden,” “incidence,” “deaths,” “disability-adjusted life years,” “epidemiology,” “multiple sclerosis,” and “age–period–cohort analysis”. A previous study reported the global burden of MS, and its time range is from 1990 to 2016. However, an assessment of the global MS disease burden, trends, and age-period-cohort effects based on the new estimates from GBD 2019 has not been done.
- What this study adds:
This study provided a comprehensive assessment of the burden of MS at the global, regional, and country-specific levels, which included incidence, deaths, and DALYs, by age, sex, and SDI from 1990 to 2019. There are significant age effects for incidence, deaths, and DALYs of MS globally, and period effects and cohort effects for deaths and DALYs.
- How this study might affect research, practice, or policy:
High SDI regions such as European countries have a substantial burden of MS, indicating that health policymakers should take appropriate measures to reduce the MS burden. The age-period-cohort analysis contributes to interpreting temporal changes in epidemiological rates and to further analyzing the risk factors of MS.
Introduction
Multiple sclerosis (MS) is a chronic inflammatory demyelinating disease of the central nervous system that may cause neurological dysfunction in young adults (1–3). It has been reported that MS ranked the 10th leading cause of disease burden (4). Previous studies have shown that MS has a genetic susceptibility and is also associated with several environmental risk factors including Epstein-Barr virus infection, vitamin D insufficiency, smoking, and childhood obesity (5–8). However, the exact etiology of the disease is still not fully understood.
The distribution of MS varies substantially among regions. Studies have shown that Western Europe and North America have the highest prevalence, followed by Central and Eastern Europe, the Balkans, Australia, and New Zealand, while Asia, Africa, and the Middle East have the lowest prevalence (9, 10). During the past decades, previous studies have reported the increasing incidence and prevalence of MS globally (9–13). More importantly, the significantly increasing trend of MS incidence and prevalence was observed in regions considered low-prevalence areas such as India (14), Latin America (15, 16), Iran (10, 17), Japan (18), the Greater Hobart cohort of Tasmania, and Australia (19).
Over recent decades, there have been changes in the risk factors of MS contributing to the increase in MS incidence and prevalence. Previously, significant period and cohort effects have been reported for the increasing female incidence in Danish and Swiss populations (20, 21). However, evidence regarding the interactions between the effects of age, period, and cohort in MS globally is limited. Age-period-cohort (APC) analysis is an important model to investigate how and why disease trends change over time. It is a tool for interpreting temporal variables in epidemiological rates (22). The age effect represents the variations in different age groups. Period effects reflect changes over the period that affect people of all age groups simultaneously. Cohort effects are the discriminations between early and later birth cohort groups that experience the same initial exposure environment (23).
Previously, by using the 2016 GBD data, the global and regional MS burden has been reported (23). However, an assessment of the global MS disease burden, trends, and age-period-cohort effects based on the new estimates from GBD 2019 has not been done. In the current study, we aimed to demonstrate the global and regional temporal trends in MS incidence, deaths, and disability-adjusted life years from 1990 to 2019. We further investigated the effects of age, period, and cohort by using the age-period-cohort analysis.
Method
Study population and data resource
Annual estimates of global, regional, and national incidence, deaths, and DALYs data of MS from 1990 to 2019 were extracted from the database of the 2019 Global Burden of Diseases, Injuries, and Risk Factors (GBD) study (http://ghdx.healthdata.org/gbd-results-tool) (3). For the 2019 GBD, there are 195 countries and territories that can be categorized into five regions based on SDI quintiles from 0 (less developed) to 1 (most developed) (24): high SDI, high-middle SDI, middle SDI, low-middle SDI, and low SDI, and 21 GBD regions in terms of birth status, education, income, etc. To analyze the effect of age on incidence, death, and DALYs rate, we extracted the data of the 10 different age groups from 1 to 99 years. To compare the disease burden of MS with the other neurological disorders, we also collected data on Parkinson's disease, headache disorders, Alzheimer's disease, idiopathic epilepsy, and motor neuron disease from 2019 GBD.
Age-standardized rates (ASR) and estimated annual percentage change (EAPC)
Age-standardized rate of incidence (ASIR), death (ASDR), and DALYs in MS were available in 2019 GBD and can be used to calculate EAPC, which can identify temporal trends of ASR relative changes of MS from 1990 to 2019 (25). We first constructed a regression linear model about ASR, i.e., ln (ASR) = α +βx +ε, where α represents intercept, β represents the slope of the fitted line, x refers to calendar year, and ε is the error term. Then we calculated EAPC as 100 × (eβ – 1) (26). ASR is considered an increasing trend if both EAPC and its lower limit of 95% confidence interval > 0; conversely, ASR is considered a decreasing trend if both EAPC and its upper limit of 95% confidence interval <0; ASR is considered to be stable along with year otherwise (27). R software (R Foundation for Statistical Computing, Vienna, Austria, version 4.1.0) was used to perform the EAPC calculation. A p-value of < 0.05 was considered to be statistically significant.
Age–period–cohort model
The APC model was used to analyze the impact of three types of time-related variations—age, period, and cohort—on global incidence, death, and DALYs rate of MS. To construct the APC model, we first used the number of cases as the dependent variable and assumed that the number follows a Poisson distribution. For the incidence rate, we can construct a log-linear regression form as follows:
where Eij represents the expected incidence number in the cell (i, j) of MS; Pij is the total exposed population for the same period; μ is the intercept or adjusted average incidence rate; αi represents the coefficient of ith age group; βj represents the coefficient of the jth period group; and γk represents the coefficient of the kth cohort group (28).
Since there is multicollinearity between the age, period, and cohort, i.e., a linear correlation between any two variables, we used the intrinsic estimator (IE) method to calculate the relative coefficient. Then, the relative risks (RRs) are obtained in the exponential form of the coefficient to analyze the incidence, death, and DALYs rate of each age, period, and cohort group to the total groups (29). We used the Akaike information criterion (AIC) and the Bayesian information criterion (BIC) to evaluate the goodness of model fit, with lower AIC-value and BIC-value indicating less information loss and better goodness of fit (30, 31).
As the 95% confidence interval (CI) of parameters was unreasonably small due to the large sample size (global population) according to GBD 2019 study, to obtain a reasonable 95% confidence interval, normal distribution was used instead of Poisson distribution. The model used “rate” as the dependent variable, which was obtained by simply dividing the number of a specific group of patients by the number of exposure of the corresponding group, and presumed to follow a normal distribution with a log link function. The “apc_ie” command in STATA version 16.0 software (Stata Corp., College Station, TX, USA) was used to perform the APC analysis.
Results
The global incidence, deaths, and DALYs of MS and other neurological disorders
At the global level, the incidence, deaths, and DALYs number increased 41.8 [from 41,854 (95% uncertainty interval [UI] 36,306.1–47,444.9) to 59,345.4 (51,817.8–66,942.6)], 68.0 [from 13,356 (11,903.5–17,571.1) to 22,439 (20,226–27,791.5)], and 59.7% [from 726,065.6 (621,892.3–867,796) to 1,159,831.8 (1,001,179.9–1,381,870.2)] from 1990 to 2019, respectively (Tables 1–3, Figures 1A–C). The incidence rate showed a relatively stable trend from 1990 to 2019, while mortality and DALYs rates presented an upward trend slightly in the same period (Figures 1D–F). However, the ASIR, ASDR, and age-standardized DALYs rates all have decreased trends in the same period, with EAPC being −0.19 (95% CI, −0.24 to −0.13), −0.62 (−0.67 to −0.56) and −0.56 (−0.6 to −0.52) (Tables 1–3, Figures 1G–I), respectively. With regard to other neurological disorders, a consistent increase both for counts and age-standardized DALYs rates was observed for Parkinson's disease [EAPC = 0.1 (95% CI, 0.04–0.16)], headache disorders [EAPC = 0.04 (0.03–0.05)], Alzheimer's disease, and other dementias [EAPC = 0.15 (0.13–0.16)] from 1990 to 2019, whereas a decrease both for counts and age-standardized DALYs rate was observed for idiopathic epilepsy [EAPC = −0.78 (−0.82 to −0.73)] and motor neuron disease [EAPC = −0.24 (−0.28 to −0.19)] (Supplementary Table 2, Supplementary Figure 1A). Overall, DALYs of MS contributed to 1.30% of all neurological disorders (Supplementary Figure 1B). Women have higher global morbidity, mortality, and, DALYs than men (Figure 2). We found that female to male ratio with MS in 2019 was greatest in the 25–29 age group and then decreased gradually for both incidence number and rate. The incidence rate peaked at the 25–29 age group in 2019 ahead of peaking at 30–34 in 1990 (Figures 2A, B).
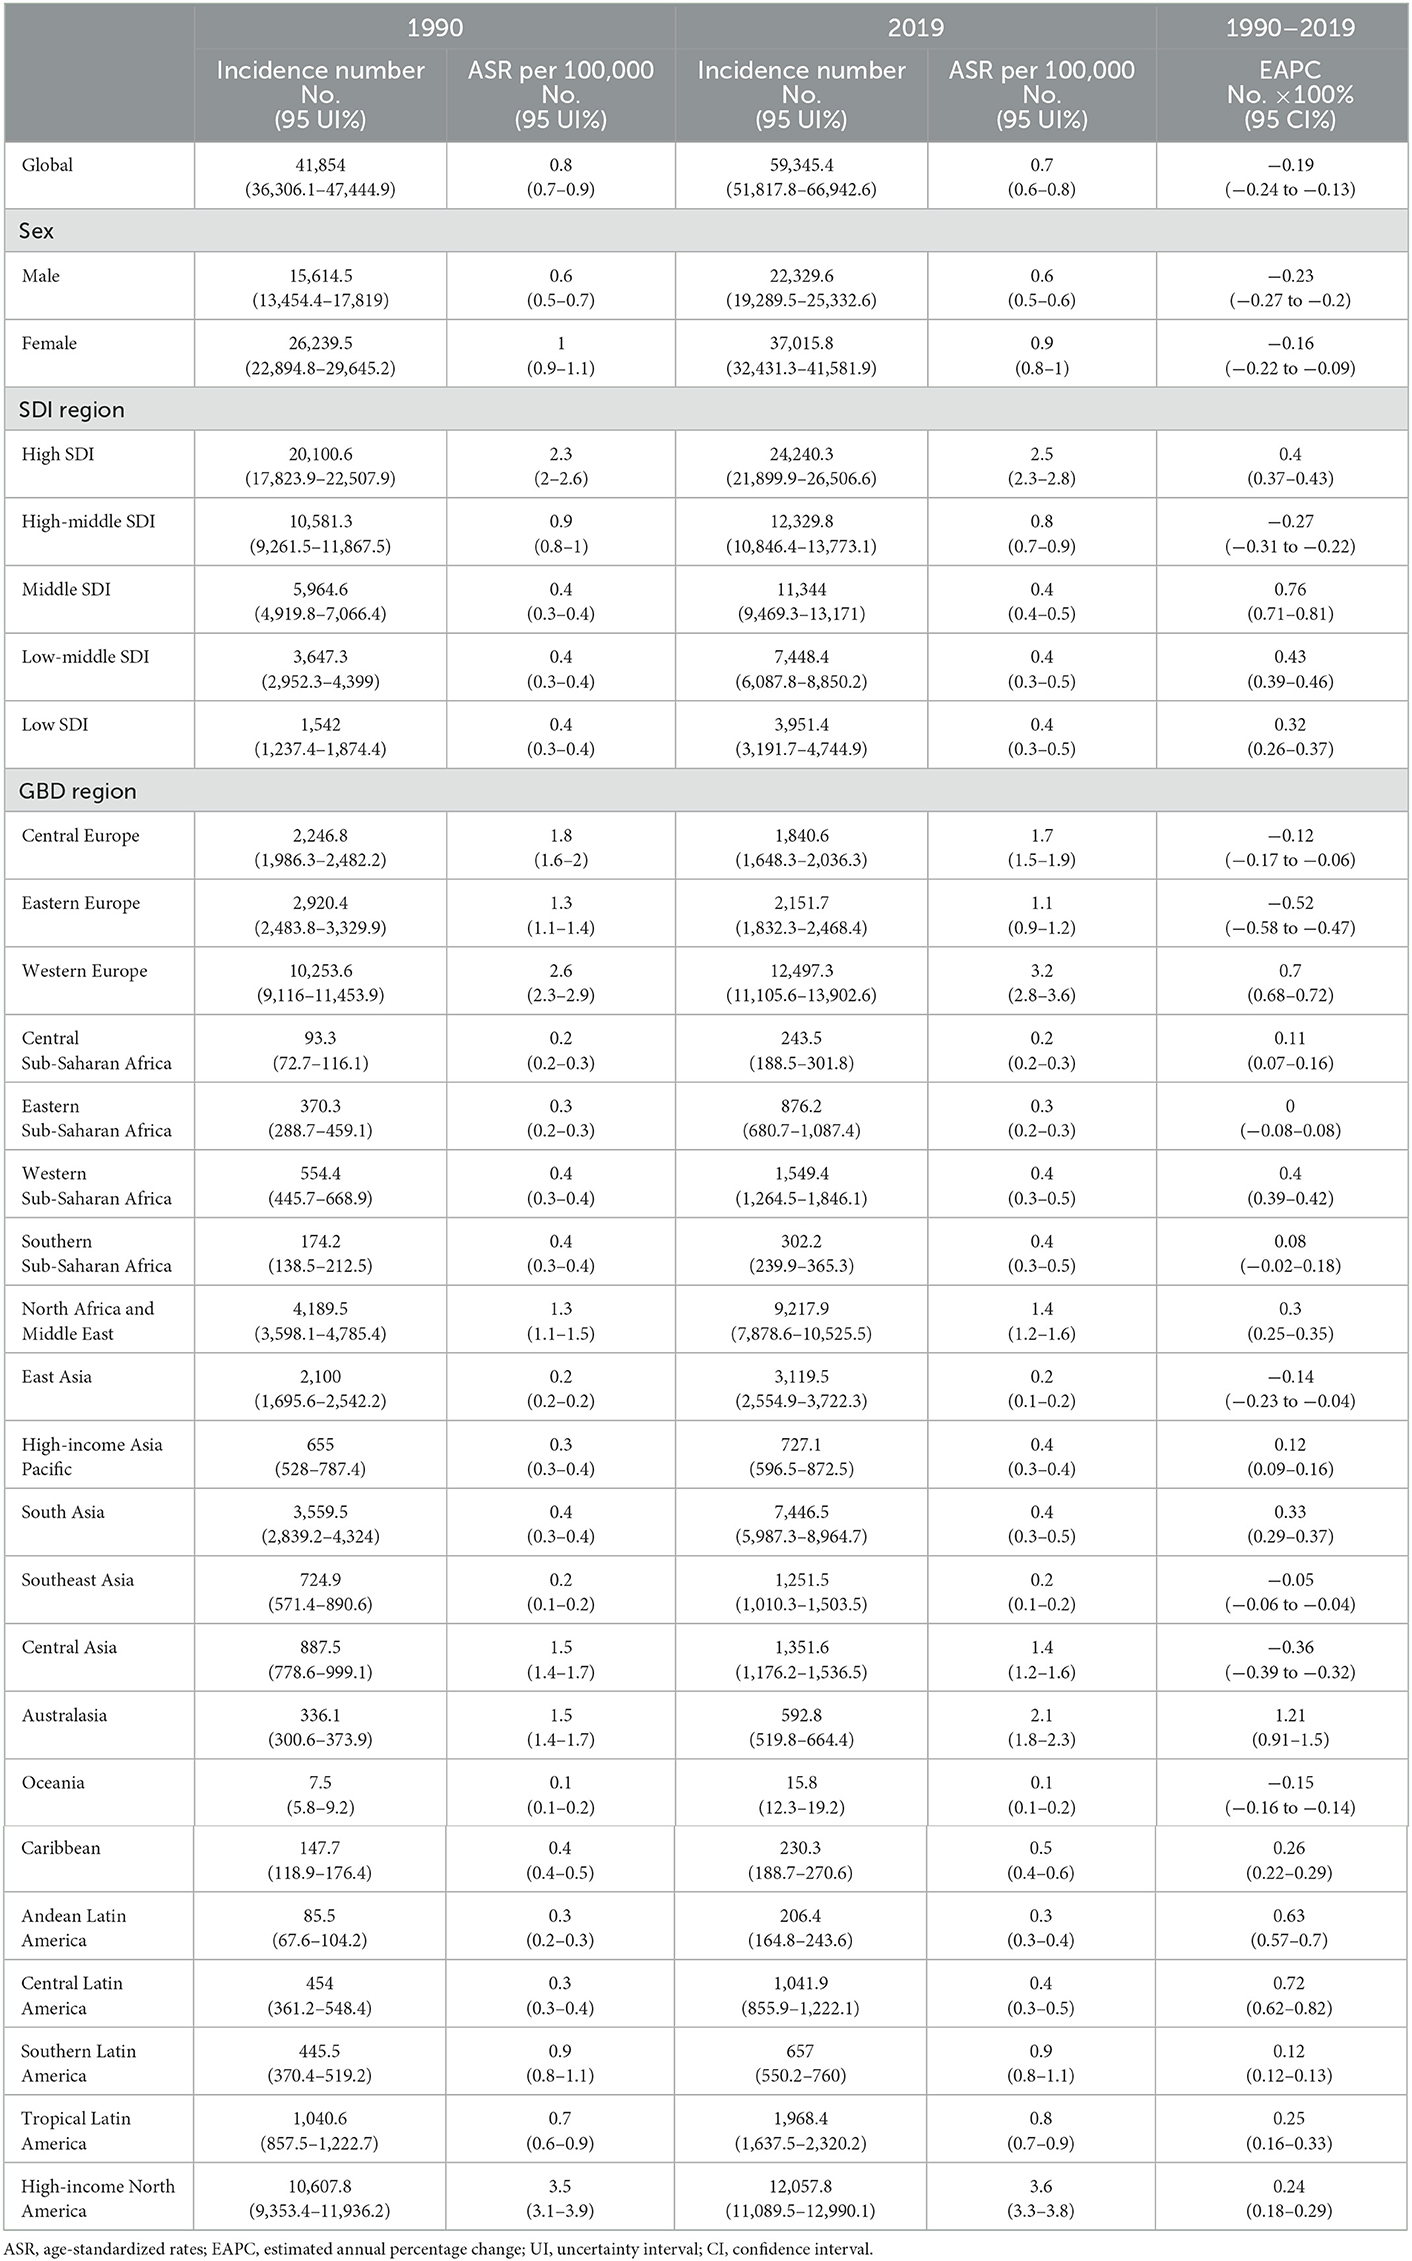
Table 1. Incidence number and ASR of multiple sclerosis in 1990 and 2019, and EAPC of ASR from 1990 to 2019.
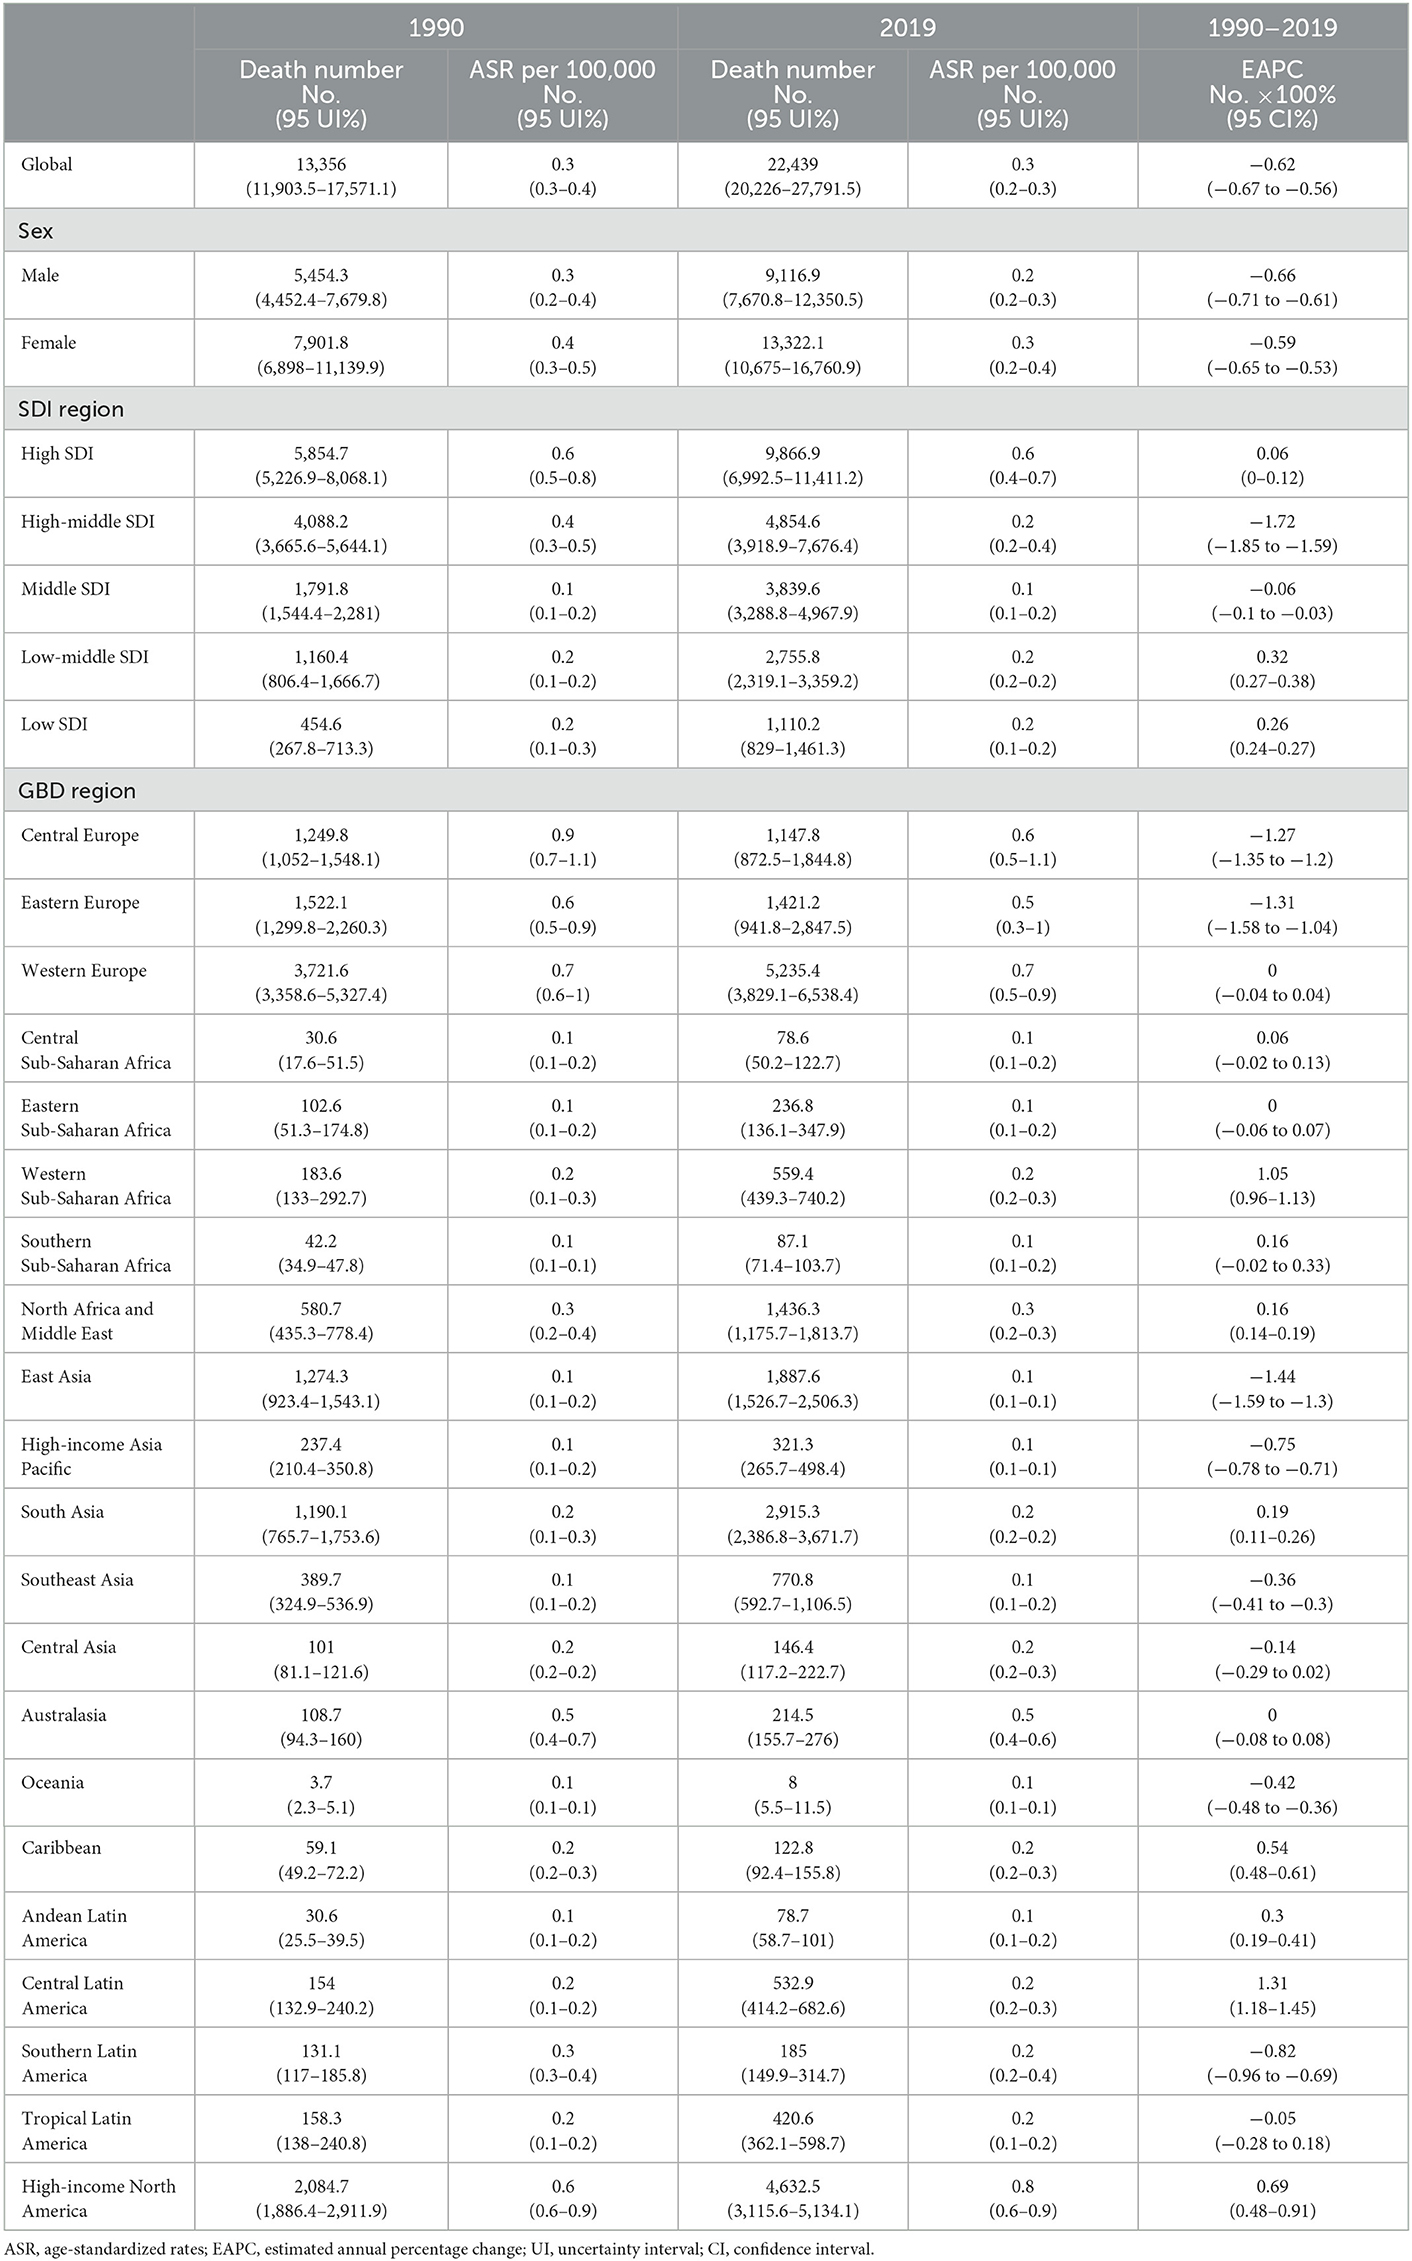
Table 2. Deaths number and ASR of multiple sclerosis in 1990 and 2019, and EAPC of ASR from 1990 to 2019.
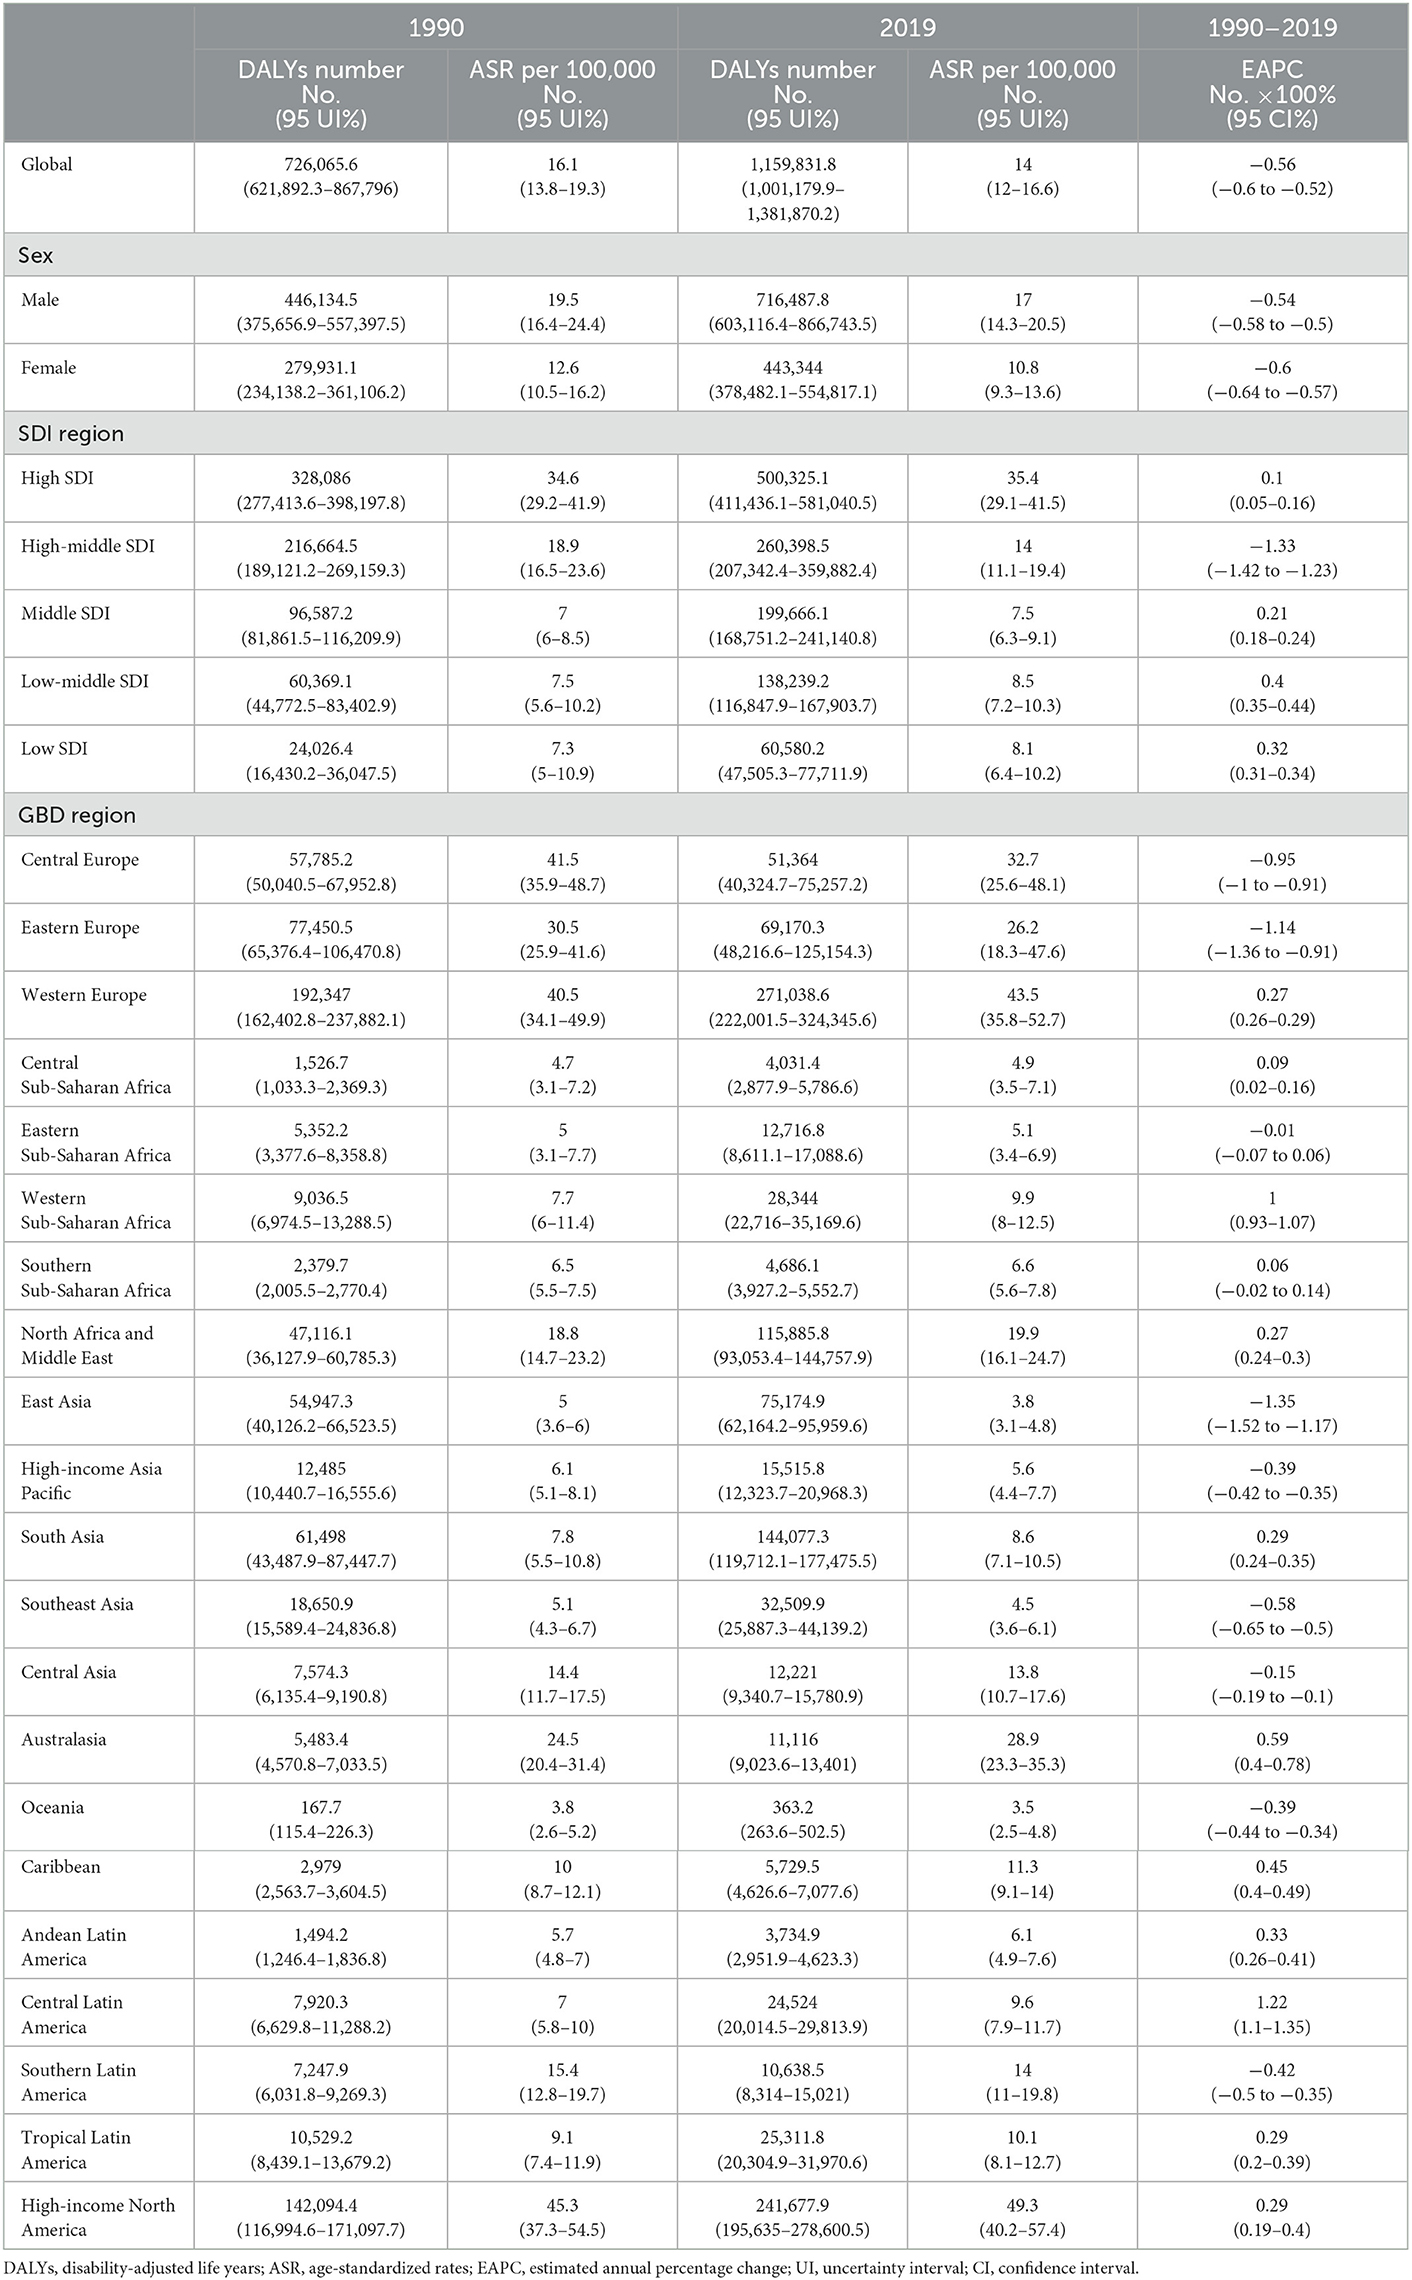
Table 3. DALYs number and ASR of multiple sclerosis in 1990 and 2019, and EAPC of ASR from 1990 to 2019.
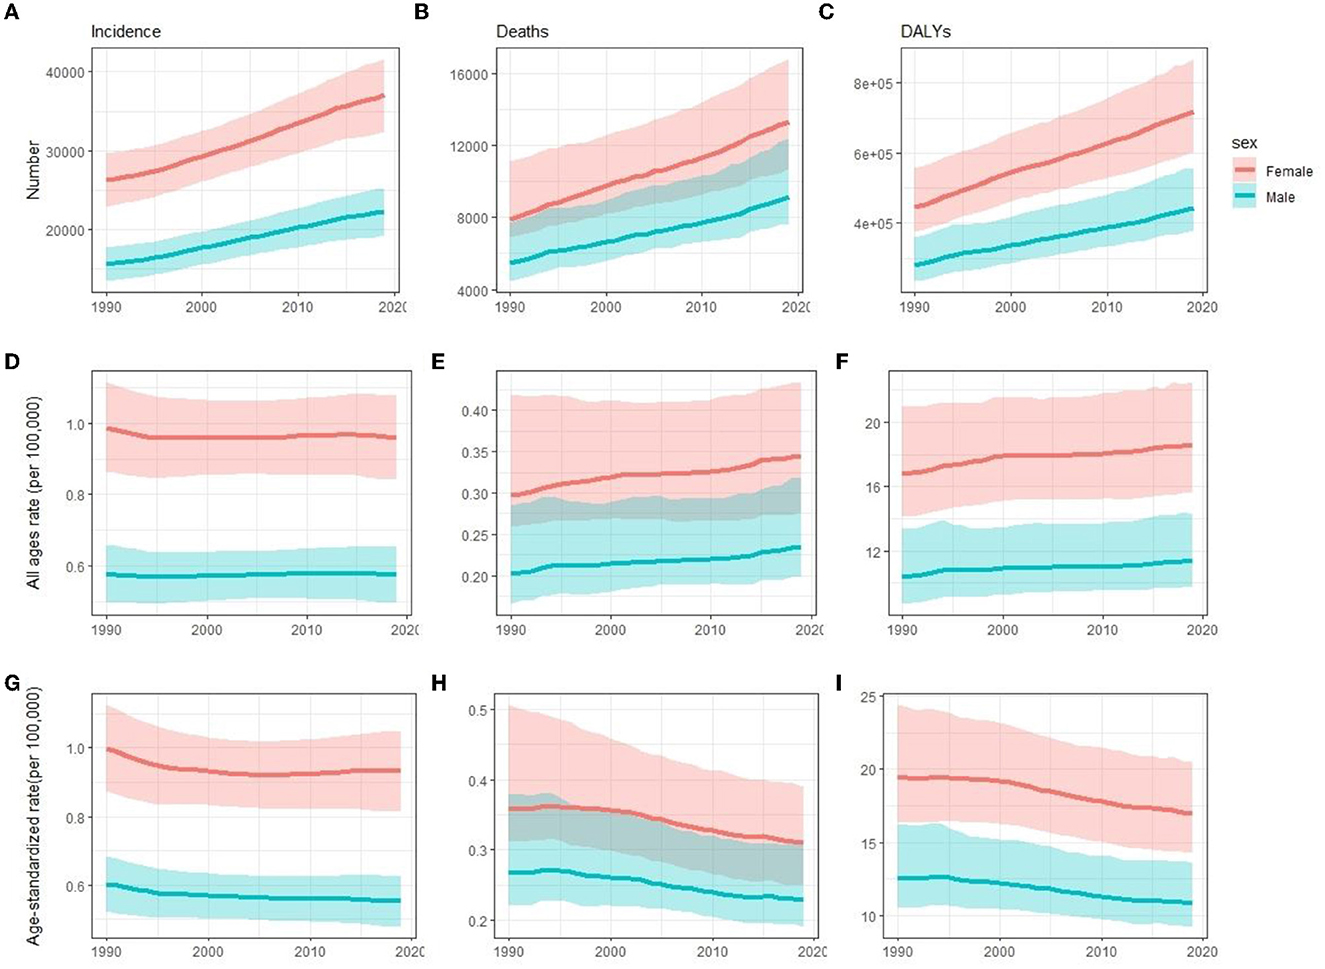
Figure 1. Comparison of time trends between women and men in incidence (A, D, G), deaths (B, E, H), and DALYs (C, F, I) number, all-age rate, and ASR of multiple sclerosis globally for 1990–2019, respectively. Error bars represented the 95% confidence intervals. DALYs, disability-adjusted life years; ASR, age-standardized rates.
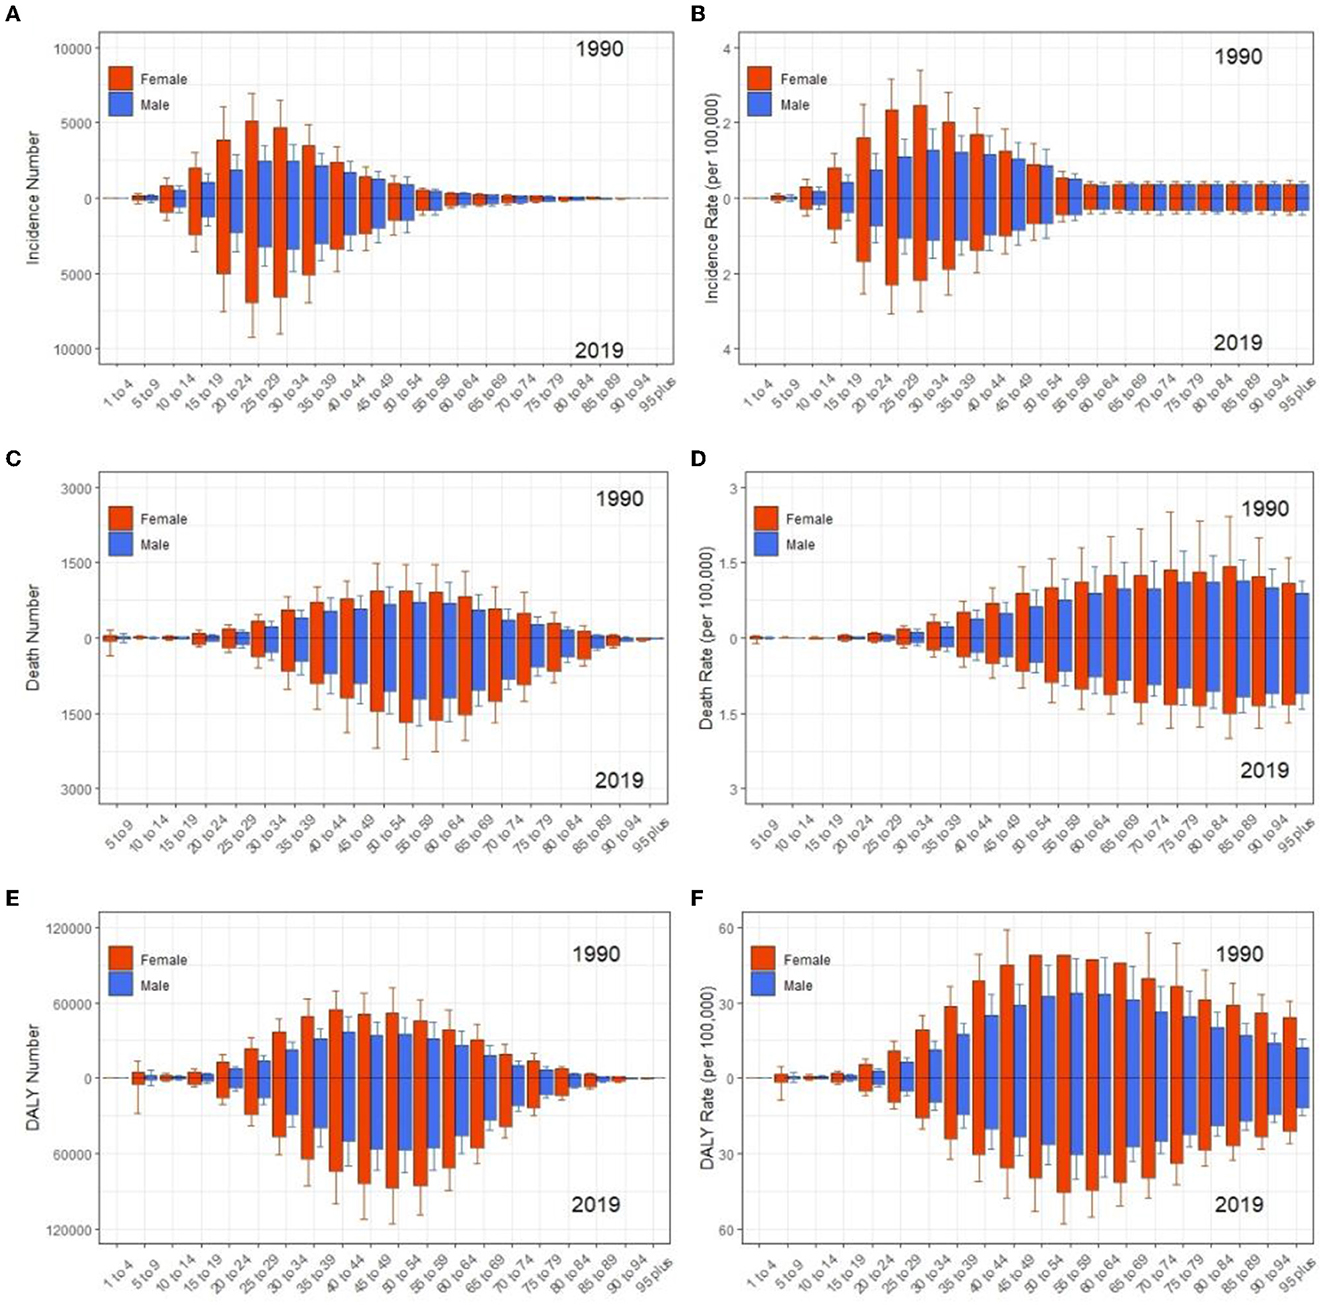
Figure 2. Comparison of age trends between women and men in incidence (A, B), deaths (C, D), and DALYs (E, F) number and rate of MS globally from 1990 to 2019, respectively. Error bars represented the 95% confidence intervals. DALYs, disability-adjusted life years.
The incidence, deaths, and DALYs in SDI regions and countries of MS
Regions and countries with higher SDI had a higher number and ASR of incidence, death, and DALYs both in 1990 and 2019, while EAPC of countries from 1990 to 2019 had a low correlation with SDI (Tables 1–3, Supplementary Table 1, Figures 3, 4). ASIR increased over time in most SDI regions except the high-middle SDI region, where there was a stable decreasing trend in ASIR with EAPC is −0.27 (95% CI, −0.31 to −0.22). Among them, the ASIR of middle SDI had the highest increasing speed with EAPC being 0.76 (95% CI, 0.71–0.81) (Table 1, Figure 4). The ASDRs and ASR of DALYs of MS in medium SDI region had the lowest value in both 1990 (ASDRs = 0.1 (95% UI, 0.1–0.2)/100,000 persons, ASR of DALYs = 7 (6–8.5)/100,000 persons) and 2019 (ASDRs = 0.1 (0.1–0.2)/100,000 persons, ASR of DALYs = 7.5 (6.3–9.1)/100,000 persons). High-middle SDI had the fastest decreasing trend in ASDRs and ASR of DALYs with EAPC being −1.72 (95% CI, −1.85 to −1.59) and −1.33 (−1.42 to −1.23), respectively, while low-middle SDI had the most increasing trend with EAPC being 0.32 (0.27–0.38) and 0.4 (0.35–0.44) (Tables 2, 3, Figure 4).
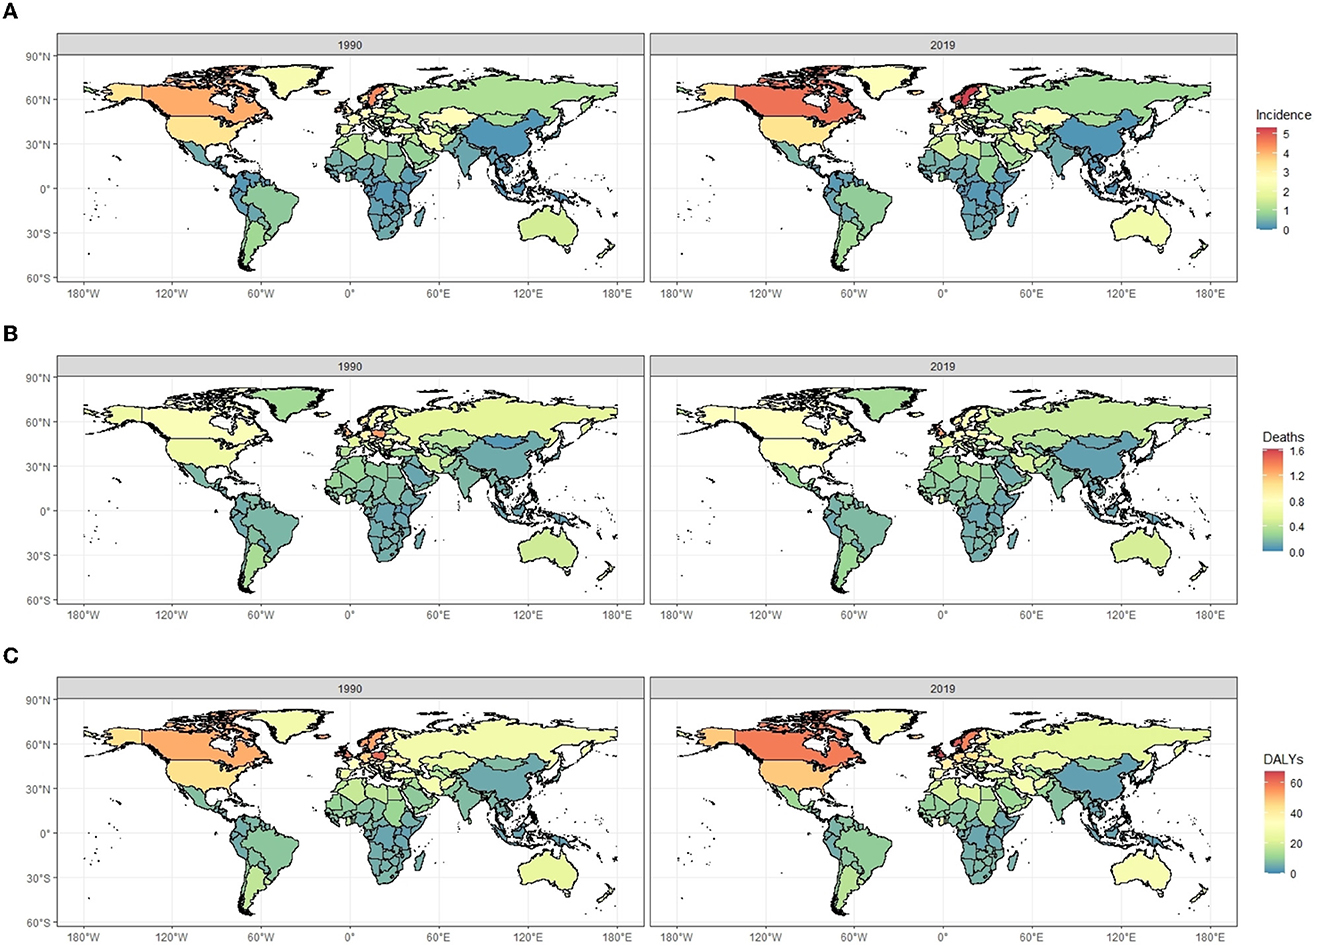
Figure 3. The comparisons of age-standardized incidence rates (A), death rates (B), and DALYs rates (C) of multiple sclerosis (per 100,000 population) between 1990 and 2019 for both sexes, by location. DALYs, disability-adjusted life years.
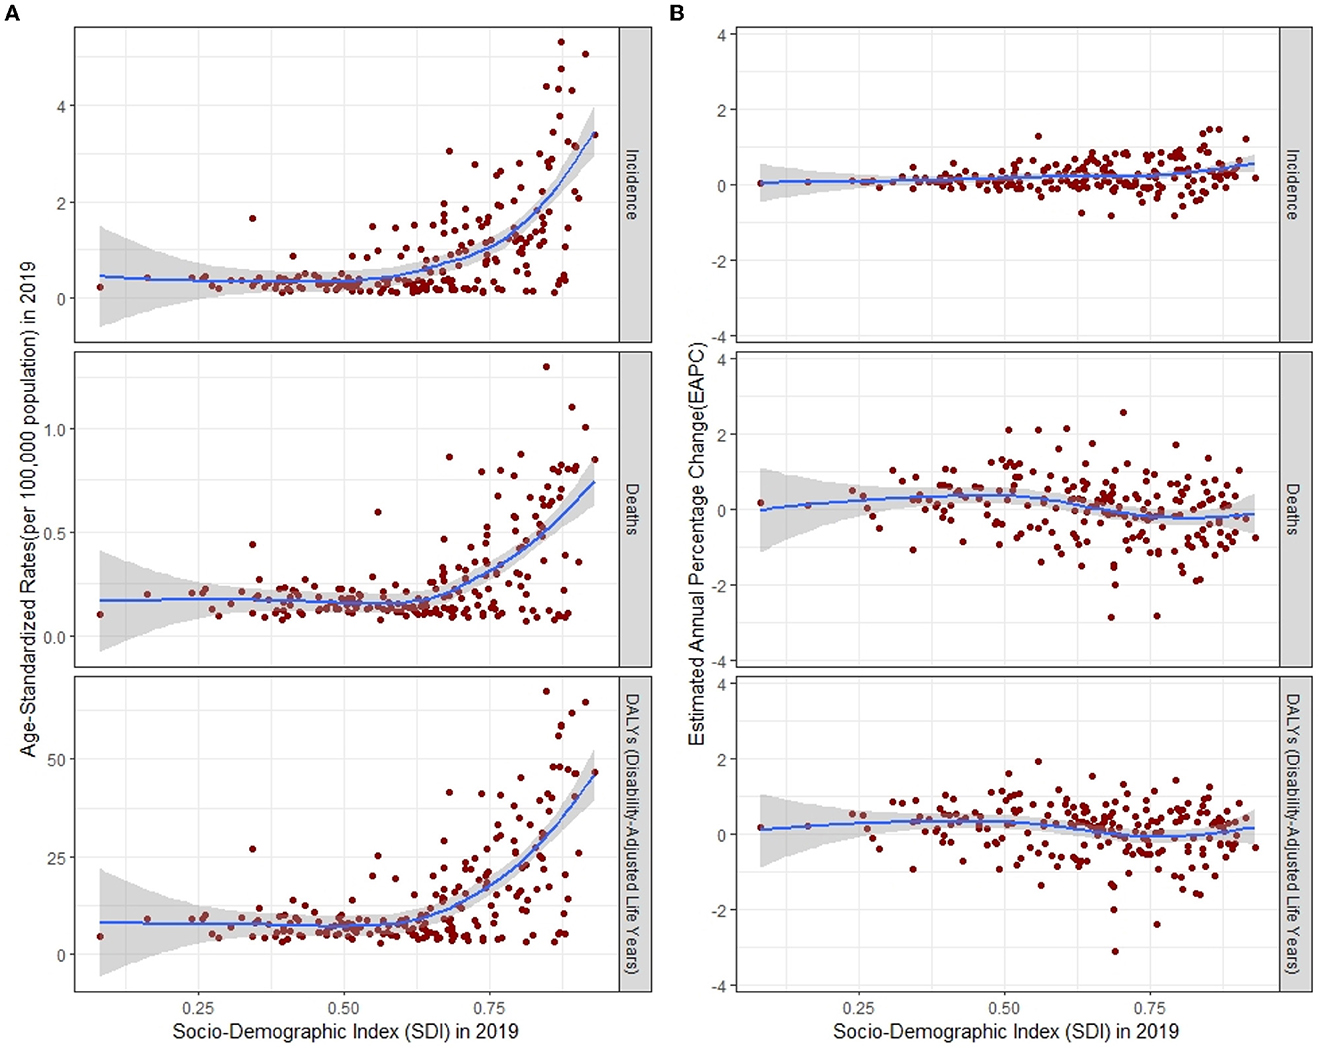
Figure 4. ASR (A) and its EAPC (B) of incidence, deaths, and DALYs for multiple sclerosis by SDI, 1990–2019, expected value-based SDI. The blue line represents the average expected relationship between SDI and corresponding disease burden indicator values. ASR, age-standardized rates; EAPC, estimated annual percentage change; DALYs, disability-adjusted life years; SDI, Socio-demographic Index.
The incidence, deaths, and DALYs in GBD regions of MS
For the GBD region, the top two regions with the highest incidence number of MS were Western Europe [12,497.3 (95% UI, 11,105.6–13,902.6)] and high-income North America [12,057.8 (11,089.5–12,990.1)]. High-income North America [3.6 (95% UI, 3.3–3.8) per 100,000], Western Europe [0.7 (0.68–0.72) per 100,000], Australasia [1.21 (0.91–1.5) per 100,000], Central Europe [1.7 (1.5–1.9) per 100,000], and Eastern Europe [1.1 (0.9–1.2) per 100,000] had the highest ASIR of MS in 2019 than other regions. Australasia [EAPC = 1.21 (95% CI, 0.91–1.5)] and Eastern Europe [EAPC = −0.52 (−0.58 to −0.47)] had the most increase and decrease in ASIRs from 1990 to 2019, respectively (Table 1, Figures 3A, 5A, B). Regarding deaths and DALYs, absolute numbers of MS cases increased in most regions except Central Europe [1,249.8 (95% UI, 1,052–1,548.1) to 1,147.8 (872.5–1,844.8) for deaths] [57,785.2 (50,040.5–67,952.8) to 51,364 (40,324.7–75,257.2) for DALYs] and Eastern Europe [1,522.1 (1,299.8–2,260.3) to 1,421.2 (941.8–2,847.5) for deaths] [77,450.5 (65,376.4–106,470.8) to 69,170.3 (48,216.6–125,154.3) for DALYs] from 1990 to 2019. High-income North America [0.8 (95% UI, 0.6–0.9) per 100,000 persons for deaths] [49.3 (40.2–57.4) per 100,000 persons for DALYs] and Western Europe [0.7 (0.5–0.9) per 100,000 persons for deaths] [43.5 (35.8–52.7) per 100,000 persons for DALYs] were the top two regions with the highest ASDRs and ASR of DALYs in 2019. The EAPCs of ASDRs varied in different GBD regions: the most significant increasing trend was detected in Central Latin America (EAPC = 1.31, 95% CI 1.18–1.45), while East Asia (EAPC = −1.44, −1.59 to −1.3) had the most significant decrease trend. Trends in DALYs by region were broadly consistent with changes in deaths (Tables 2, 3, Figures 3B, C, 5C–F).
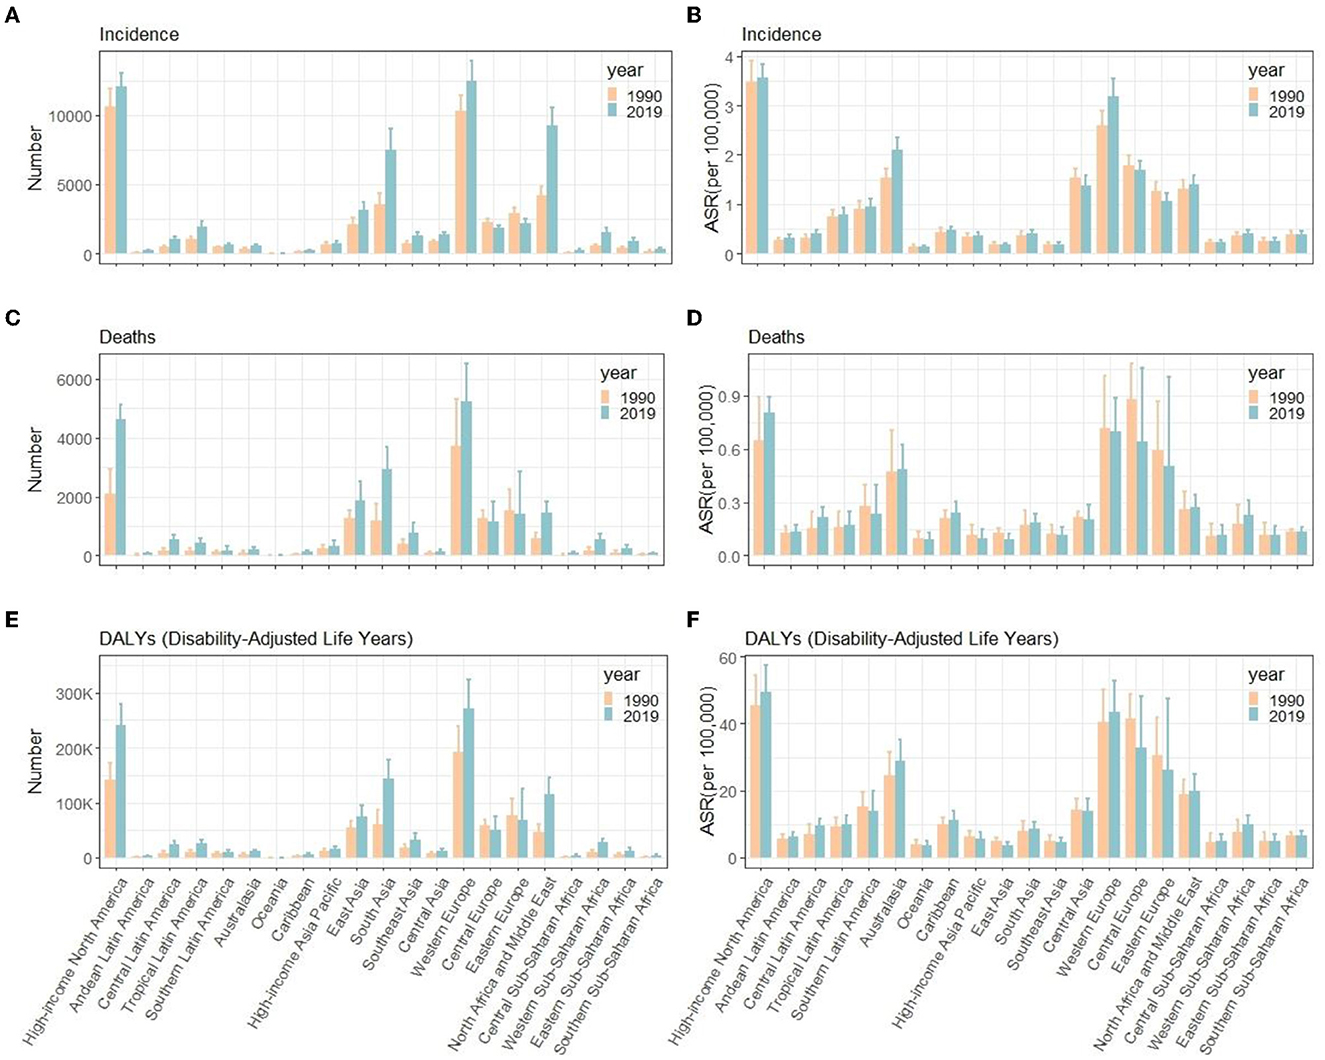
Figure 5. Number and ASR of incidence (A, B), deaths (C, D), and DALYs (E, F) of multiple sclerosis in different GBD countries, 1990 and 2019. ASR, age- standardized rates; DALYs, disability-adjusted life years; GBD, global burden of diseases, injuries, and risk factors study.
Age–period–cohort analysis of MS incidence, deaths, and DALYs
Table 4 shows the results of age–period–cohort analysis for incidence, death, and DALYs rates globally. Figure 6 shows the coefficient of MS incidence, death, and DALYs rates globally from 1990 to 2019 due to age, period, and cohort effects. After controlling for the period and cohort effects, the age effect significantly impacts the MS incidence, death, and DALYs rates. The RRs for incidence rate rise until age 30–39, then decline and plateaus after age 50–59, and the RRs for death rate and DALYs peak at 50–59 years and keep stable or decline slightly thereafter, respectively. Regarding period effect, the risk value in the death rate and DALYs had an increasing trend over time, while the incidence rate had a relatively small period effect. In terms of cohort effect, we observed decreasing trends in the risk of deaths and DALYs in later birth cohorts (Table 4, Figure 6).
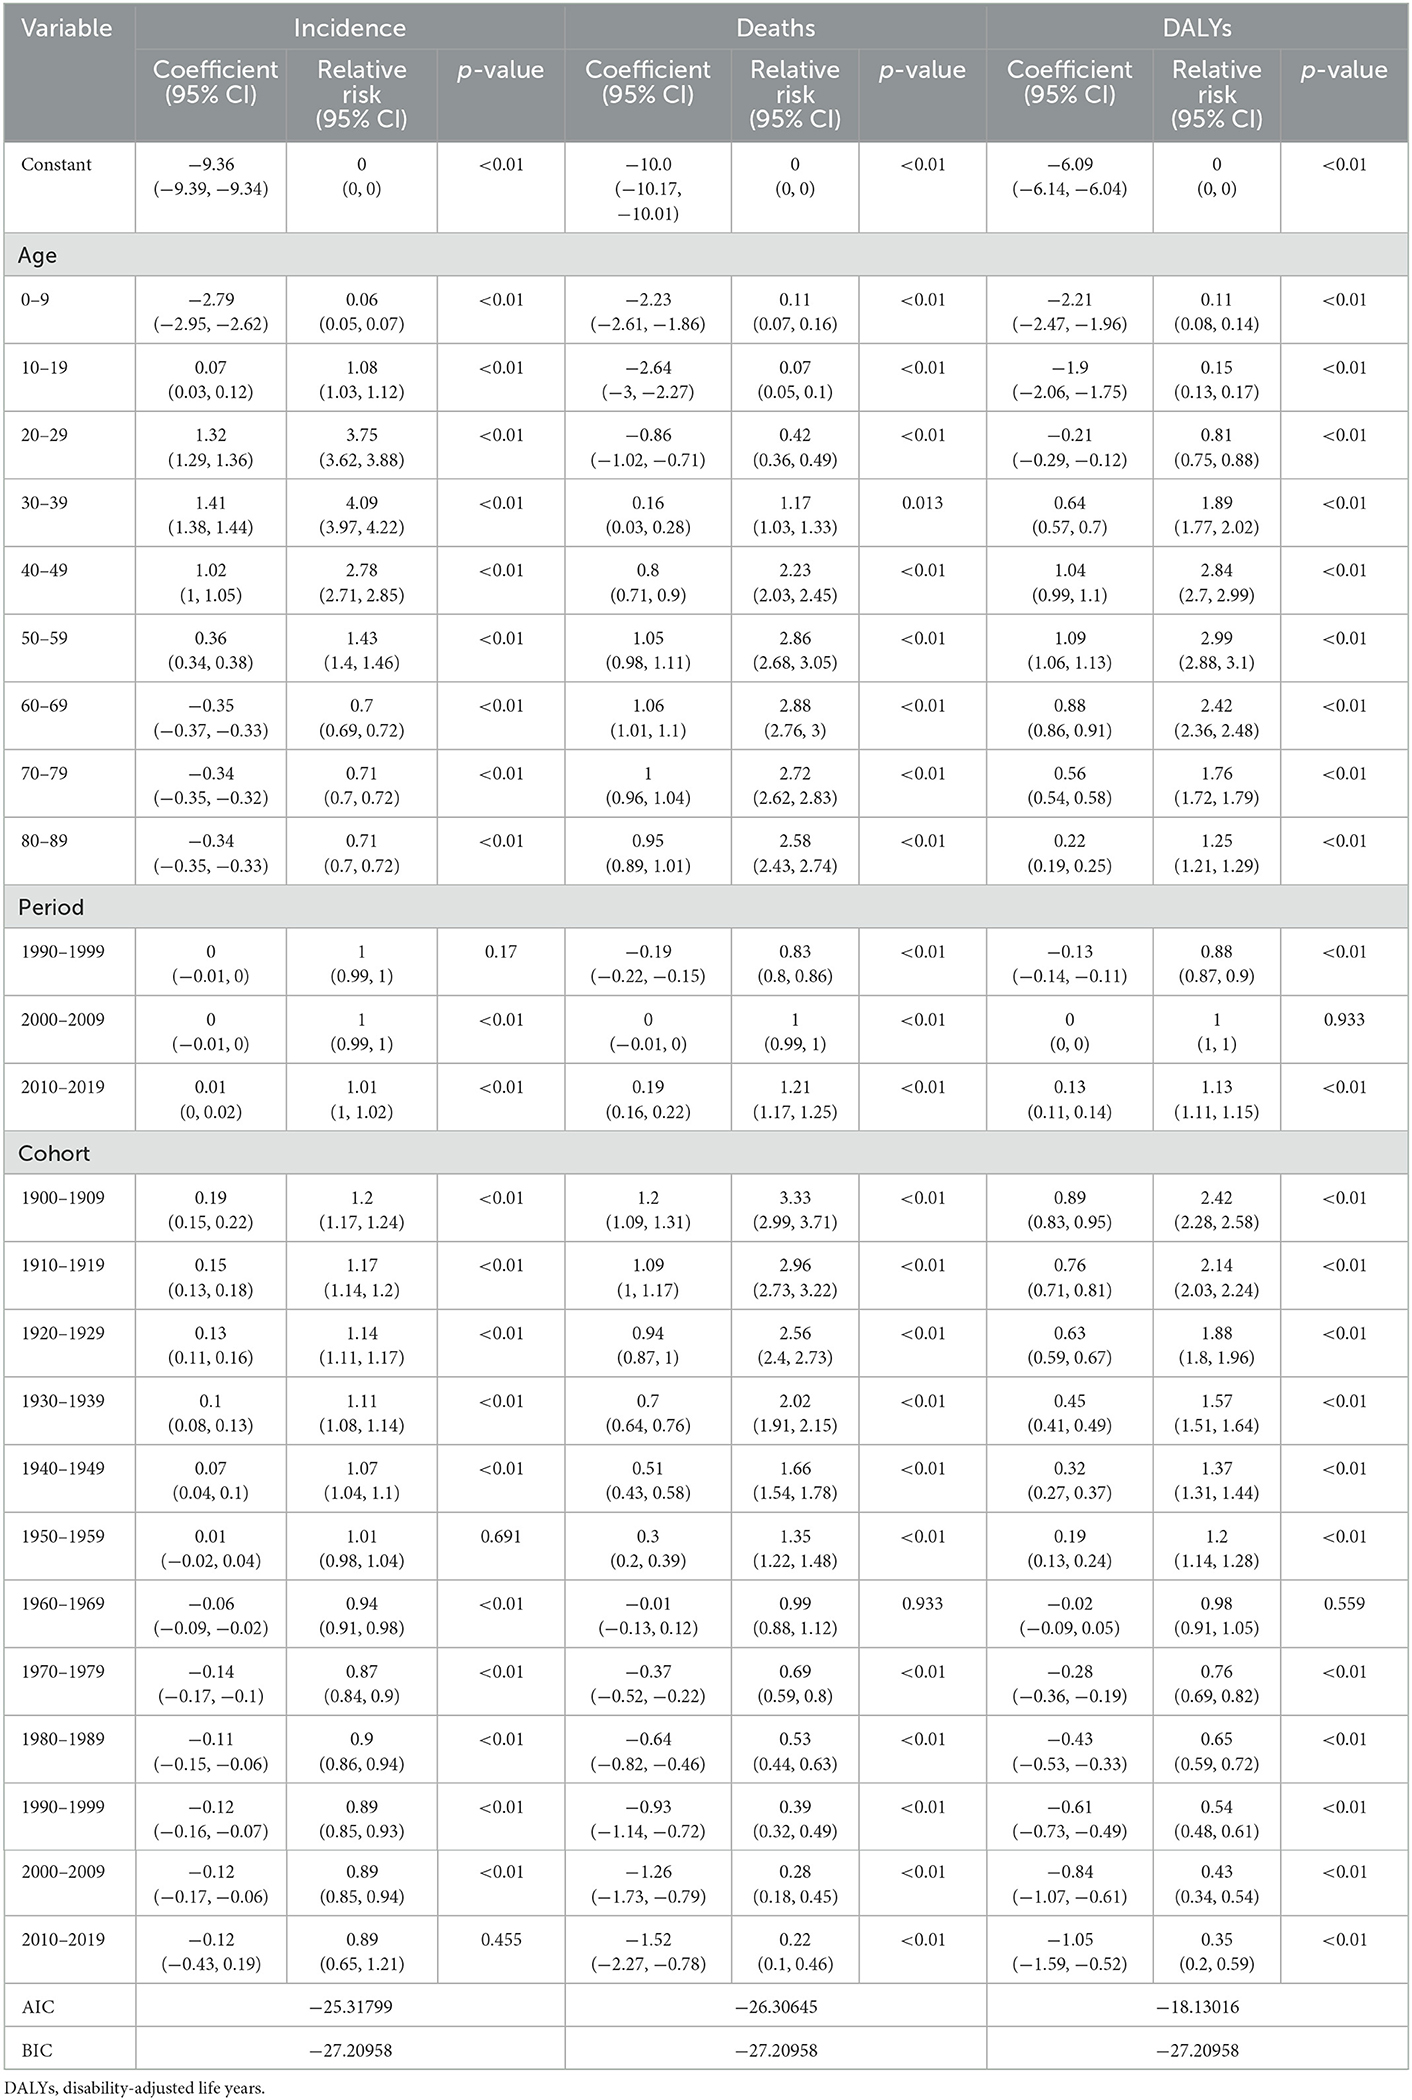
Table 4. The age, period, and cohort effect on the global incidence, death, and DALYs rate of multiple sclerosis.
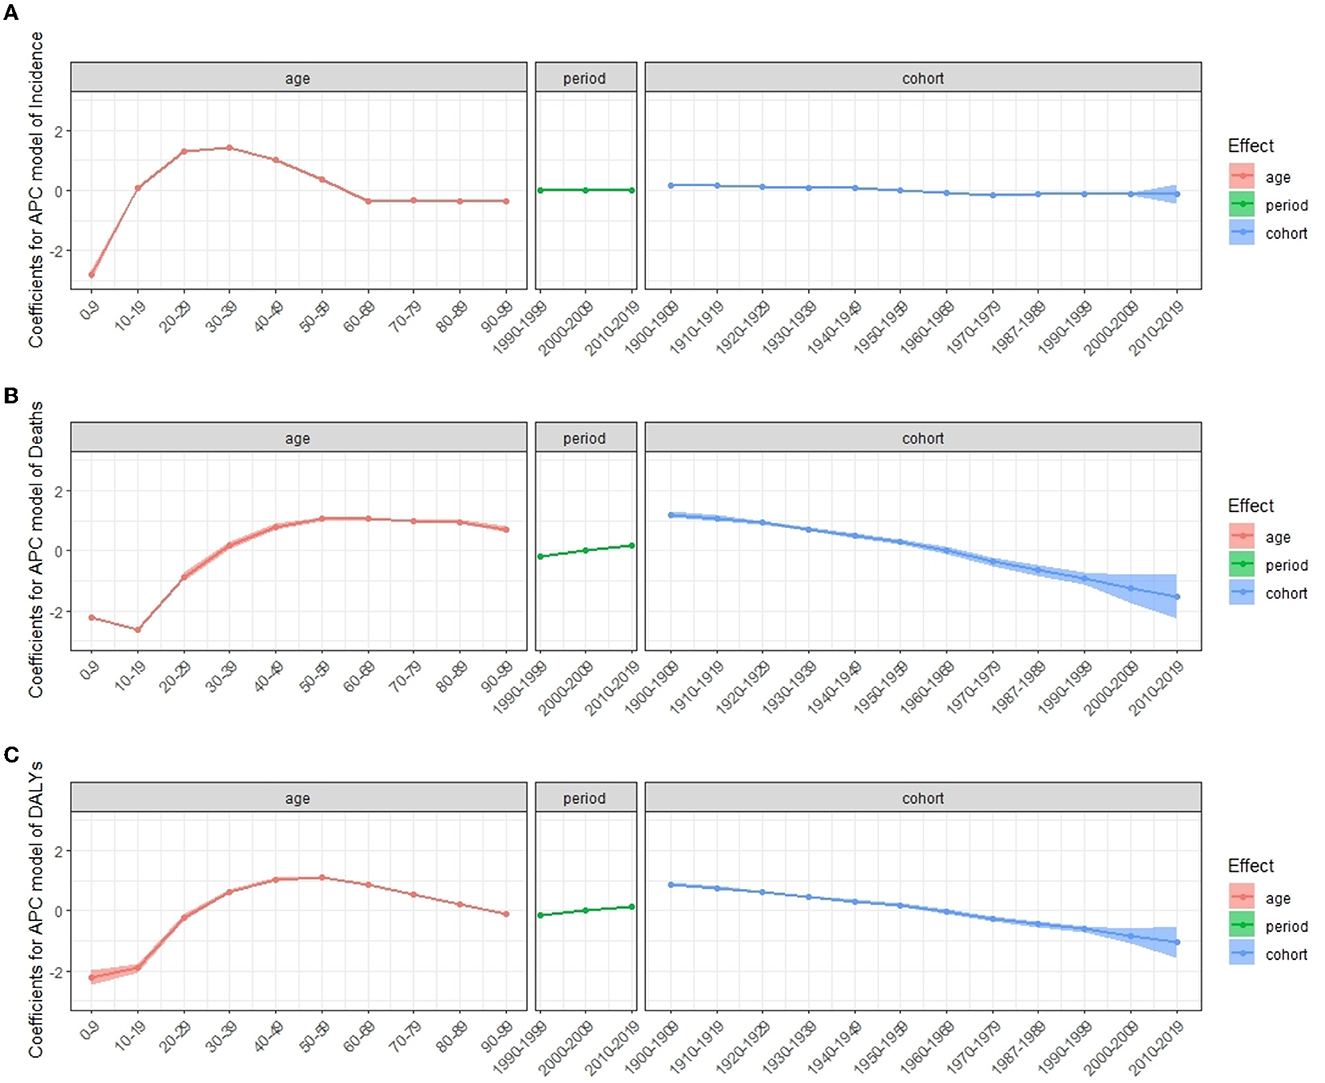
Figure 6. Coefficients for APC model of multiple sclerosis incidence (A), deaths (B), and DALYs (C) from 1990 to 2019. Error bars represented the 95% confidence intervals. APC, age–period–cohort; DALYs, disability-adjusted life years.
Under the influence of three temporal risk factors, the rates of incidence, death, and DALYs changed accordingly as shown in Figure 7. The incidence rate of MS in all periods increased over age and peaked at age 30–39, which then decreased and dropped to its lowest level at 60–69 (Figures 7A, D). For all periods, the death rate increased with age (Figures 7B, E), and the DALYs rate peaks at age 50–59 (Figures 7C, F). The distribution by period according to cohorts did not show significant variation (Figures 7A–C, G–I). Cohorts from 1960 to 1989 had the highest incidence rate and dropped fast afterward (Figure 7G). Death rates and DALYs rates were lower for younger generations than they were for older generations for all periods (Figures 7H, I).
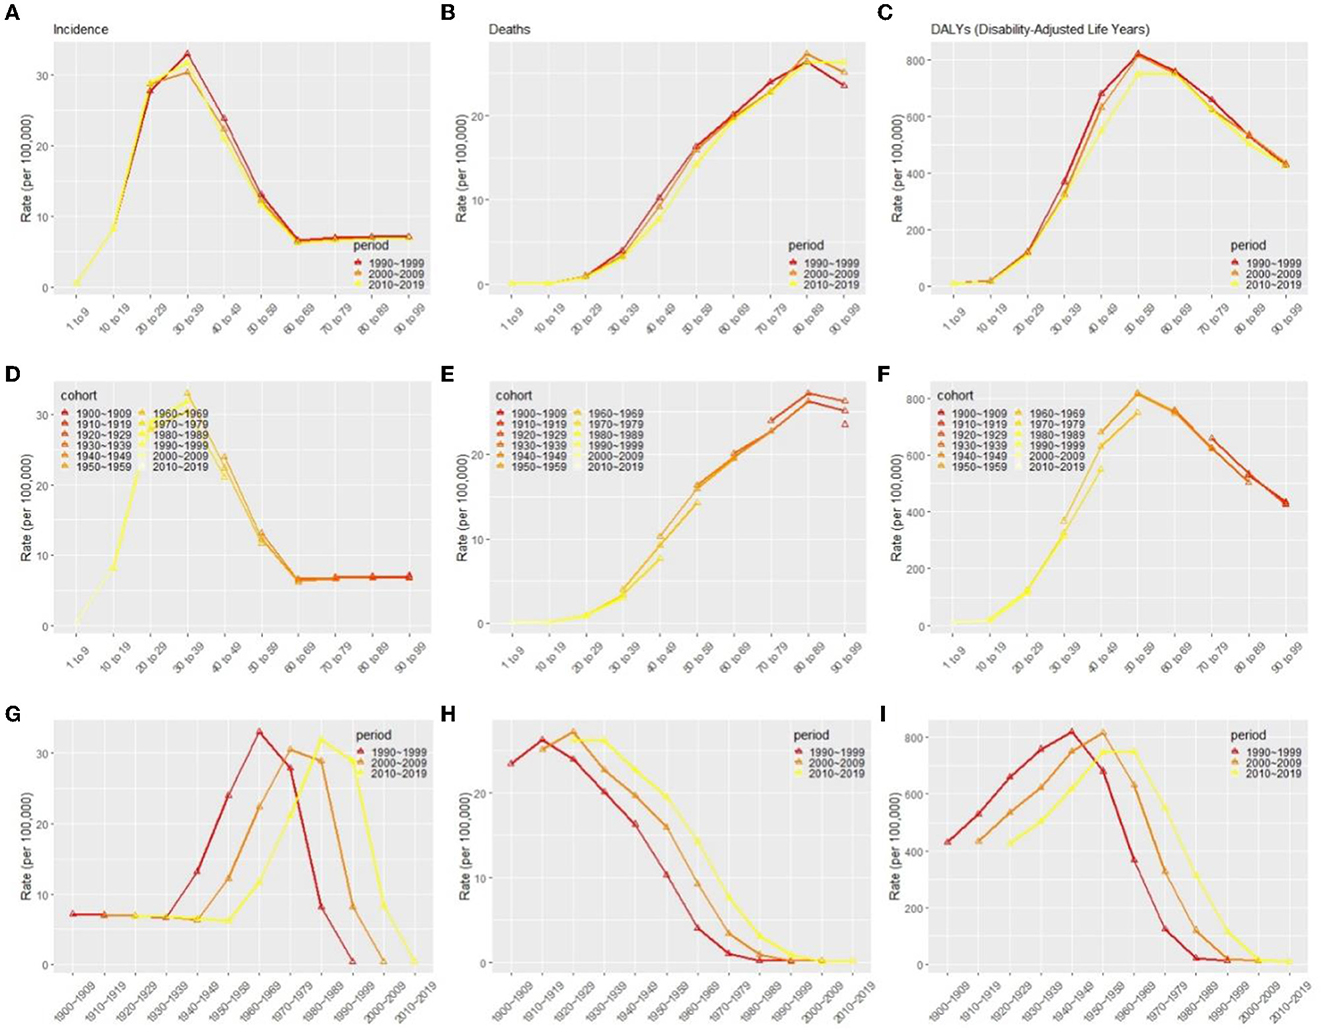
Figure 7. Effects of age (A–C), period (D–F), and cohort (G–I) on incidence rate, death rates, and DALYs in patients with multiple sclerosis globally, respectively. DALYs, disability-adjusted life years.
Discussion
In the current study, we evaluated the most recent examination of the global, regional, and national burden and temporal trends in MS by using the age–period–cohort analysis. From 1990 to 2019, we found that the global number of incidences, deaths, and DALYs of MS increased while the ASR decreased. The incidence rate remained relatively stable, whereas death and DALYs rates increased somewhat. Regions and countries with a higher SDI had a greater number and ASR of incidence, death, and DALYs. High-income North America and Western Europe were the top two regions with the highest ASIRs, ASDRs, and age-standardized DALYs. The age effect showed that the RRs of incidence and DALYs reached the peak at ages 30–39 and 50–59, respectively. The period effect showed that the RRs of deaths and DALYs increased with the period. The cohort effect showed that the later cohort has lower RRs of deaths and DALYs than the early cohort.
Previous studies have shown a relatively stable or slightly increasing incidence rate of MS in whites over the past four or five decades (32, 33). Our data from GBD 2019 showed that the number of incidences is increasing globally, however, the rate is flat or mildly decreasing. The combined estimate of the total MS incidence in 75 countries was 2.1 (95% CI, 2.09–2.12) per 100,000 persons/year (12), which differs from our estimate of 0.7 (95% UI, 0.6–0.8) per 100,000 persons in 2019. The lack of incidence data in some regions contributes to the discrepancy in global estimates of total incidence. We found that DALYs of MS made up 1.30% of all neurological disorders in 2019. Although the burden of MS is less than other neurological disorders such as headache disorders, Alzheimer's disease, and other dementias, the early age of MS onset and the significant impact on life quality and productivity cause a considerable non-fatal burden (11). The decreasing burden of MS, idiopathic epilepsy, and motor neuron disease observed since 1990 is partly in line with a rapidly improving quality of care, whereas an increasing burden of Parkinson's disease, Alzheimer's disease, and other dementias, which reflects increasing longevity and declining birth rates (34, 35). Several previous studies have reported a much higher crude death rate and ASDR in people with MS compared with the general population (36–38).
A positive correlation between age-standardized DALYs and SDI has been reported previously by using the GBD 2016 data (11). In agreement with the previous studies, we also detected a similar positive association between age-standardized DALY and SDI. Moreover, we found that ASIR and age-standardized DALYs in the high-medium SDI region declined significantly from 1990 to 2019 and the general improvement of clinical care and the abundance of medical resources in the regions may be the underlying causes. Our study found that ASIR from 1990 to 2019 in high SDI regions was the highest and that ASIR was moderately correlated with SDI levels, which confirmed that developed countries have a higher incidence of MS than developing countries (39). In high SDI regions, patients with MS are more likely to be treated and reported due to the availability of a robust healthcare system and adequate healthcare resources. Whereas, in low SDI regions, medical resources are so scarce that mild MS may go undetected. The significant ASIR in high SDI regions may account for its high DALYs rates. At the same time, the overall burden of MS may be much heavier than we estimated, given that data collection is limited to areas with underdeveloped health systems. The reason for the increased incidence trend of MS in most SDI regions may be that the immune system has undergone inappropriate changes over the past few decades in developed countries through the increasing use of healthy vaccinations and antibiotics, leaving people more vulnerable to autoimmune diseases (40).
Our results are consistent with some previous reports on the burden of MS in various regions (10, 11). The Atlas of MS has shown that Europe has the highest incidence, followed by the United States; South-Central Asia and Africa have the lowest incidence (12). An analysis of data from the Danish Multiple Sclerosis Registry showed that the incidence doubled in women between 1950 and 2009, while the increase in men was more modest. In contrast, the excess death rate among MS patients in Denmark has declined since 1950 (41). The incidence has been rising sharply in Iran between 1990 and 2017, possibly due to the growth of urbanization, which leads to changes in lifestyle, exposure to more weather pollutants, more stress, and consumption of fast food. DALYs are lower in the Middle East and Northern Africa, possibly due to the more benign course of MS disease (10). On the other hand, a study by Mansouri et al. indicated Latin America and the Caribbean showed increasing trends of incidence in recent years. Lack of vitamin D intake and genetic risk factors have been cited as the possible causes of this increasing trend (40).
Discrepancies in MS burden were also found across different age groups and genders. From 1990 to 2019, across all age groups, women had higher ASIR, ASDR, and ASR of DALYs due to MS. This result was consistent with those of previous studies carried out in Italy (42), Denmark (41), France (43), Australia (19, 44), and Norway (45), which similarly showed an increase in female incidence rates (46, 47). Gonadal hormones, lifestyle changes, lactation patterns, oral contraceptives, reduced physical activity, and increased stress may be the basis of this phenomenon (11, 47). Moreover, we found an earlier onset age for women in 2019 compared to 1990, indicating that more effort should be invested in women to combat MS.
There is an evident age effect on MS incidence and mortality as expected. Age effects explain the variation of indicators of interest in disease with age and reflect the nature of age changes (23, 48). The global high-risk age group for MS is 30–39 years old, which shows a similar age at MS onset patterns in published MS literature (9, 43, 49). Several countries, such as Kuwait (49), Newcastle, and Australia (44), show an age-specific bimodal distribution at MS onset during 1986–2011, indicating the existence of at least two age population segments at risk for MS. MS develops during the prime of life, and with the increasing aging of the global population (50), the burden on people living with MS will increase further, and the cost to society may soar in future. This finding broadly supports the previous study in this area that DALYs of MS globally peaked in the sixth decade (11). Higher life expectancy and early onset age have resulted in a high number of DALYs.
Although the global period effect and cohort effect of MS incidence have not been reported, the period effect and cohort effect have been evaluated in different regions previously. The period effect and cohort effect showed no significant change in the incidence of MS globally among the RRs of the different period groups and the same results showed in Lorraine, France between 1996 and 2015 (43), implying that genetic and environmental factors (5–8) that influence the disease's risk have not changed significantly or that factors that mitigate the disease's onset have emerged that have not yet been detected. On the other hand, Denmark and Kuwait show a significant period effect and cohort effect in incidence (41, 49). Moreover, a study in Norway found that the period effect on mortality was stable in men in the last three decades but increased for women (45). However, the period effect of mortality in Spain is decreasing from 1951 to 1997, probably due to an increasing life expectancy, while the risk of the birth cohort showed an increasing trend (51). A cohort effect analysis of MS-related mortality in North America and several European countries also showed a decline after the 1910–1930 generations (52). In the current study, the period effect showed that the RRs of deaths and DALYs increased with the period. The cohort effect showed that the later cohort has lower RRs of deaths and DALYs than the early cohort. Over the birth cohorts covered in our dataset, changes in lifestyle and environmental factors may have changed the risk of one cohort group over another. The late birth cohort, in comparison to the early birth cohort, received greater education, had a higher degree of awareness about health and illness prevention, and was more actively involved in treatment (22, 53). Furthermore, increasing risk factors for MS were discovered over time, raising public awareness of the disease. In APC analyses, birth cohort effects were largely unaffected by period effects due to changes in diagnostic criteria. In general, such changes are more likely too vague underlying birth cohort patterns than to emerge by chance (54).
One limitation of our current study is that the accuracy of our findings depends on the integrity and reliability of the GBD. However, insufficient diagnosis of diseases due to limited medical care in less developed regions and few national incidence and prevalence studies in high-income countries have led to the lack of partial data on the GBD, which in turn has resulted in biased models for predicting rates. In addition, the disease prediction models used in the database lack robust covariates for a more reliable risk assessment of the population (11). A second major limitation is that models are based on superimposed assumptions of age, period, and cohort effects. This not only creates identification problems but also led to a poor approximation of how social change occurs. Therefore, additional new models and methods are needed to test other theories of social change (23).
In conclusion, the cases of incidence, deaths, and DALYs of MS globally have all increased, whereas ASR has declined, with different trends in different regions. High SDI regions have a substantial burden of MS. Furthermore, we found significant age effects for incidence, deaths, and DALYs of MS globally, and period effects and cohort effects for deaths and DALYs. Health promotion, disease prevention, and rehabilitation should all receive significant attention, especially in high-risk areas.
Data availability statement
The original contributions presented in the study are included in the article/Supplementary material, further inquiries can be directed to the corresponding authors.
Author contributions
ZQ: study design and manuscript drafting. YL: data collection, data analysis, and drawing graphs. KZ, YD, SY, BC, HW, and JJ: data collection and data analysis. KQ, ZG, and MZ: study design, data analysis, results interpretation, and manuscript reviewing. All authors contributed to the review of manuscript and the final version of paper.
Funding
This study was partly supported by the Special Fund for Science and Technology of Guangdong Province (Grant Number: 2019ST024) and the Science and Technology Plan Project of Shantou (Grant Number: 汕府科 [2019]106).
Acknowledgments
We thank the works of the Global Burden of Diseases, Injuries, and Risk Factors 2019 study collaborators.
Conflict of interest
The authors declare that the research was conducted in the absence of any commercial or financial relationships that could be construed as a potential conflict of interest.
Publisher's note
All claims expressed in this article are solely those of the authors and do not necessarily represent those of their affiliated organizations, or those of the publisher, the editors and the reviewers. Any product that may be evaluated in this article, or claim that may be made by its manufacturer, is not guaranteed or endorsed by the publisher.
Supplementary material
The Supplementary Material for this article can be found online at: https://www.frontiersin.org/articles/10.3389/fpubh.2023.1073278/full#supplementary-material
References
1. Compston A, Coles A. Multiple sclerosis. Lancet. (2002) 359:1221–31. doi: 10.1016/S0140-6736(02)08220-X
3. Dobson R, Giovannoni G. Multiple sclerosis: a review. Eur J Neurol. (2019) 26:27–40. doi: 10.1111/ene.13819
4. Group GBDNDC. Global, regional, and national burden of neurological disorders during 1990–2015: a systematic analysis for the Global Burden of Disease Study 2015. Lancet Neurol. (2017) 16:877–97. doi: 10.1016/S1474-4422(17)30299-5
5. Fletcher J, Bishop EL, Harrison SR, Swift A, Cooper SC, Dimeloe SK, et al. Autoimmune disease and interconnections with vitamin D. Endocr Connect. (2022) 11:814. doi: 10.1530/EC-21-0554
6. Ebers GC. Environmental factors and multiple sclerosis. Lancet Neurol. (2008) 7:268–77. doi: 10.1016/S1474-4422(08)70042-5
7. Olsson T, Barcellos LF, Alfredsson L. Interactions between genetic, lifestyle and environmental risk factors for multiple sclerosis. Nat Rev Neurol. (2017) 13:25–36. doi: 10.1038/nrneurol.2016.187
8. Belbasis L, Bellou V, Evangelou E, Ioannidis JP, Tzoulaki I. Environmental risk factors and multiple sclerosis: an umbrella review of systematic reviews and meta-analyses. Lancet Neurol. (2015) 14:263–73. doi: 10.1016/S1474-4422(14)70267-4
9. Koch-Henriksen N, Sorensen PS. The changing demographic pattern of multiple sclerosis epidemiology. Lancet Neurol. (2010) 9:520–32. doi: 10.1016/S1474-4422(10)70064-8
10. Abbastabar H, Bitarafan S, Mohammadpour Z, Mohammadianinejad SE, Harirchian MH. The trend of incidence, prevalence, and DALY of multiple sclerosis in the Middle East and Northern Africa region compared to global, West Europe and, Iran's corresponding values during 1990–2017: retrieved from global burden of diseases data. Mult Scler Relat Disord. (2021) 52:102949. doi: 10.1016/j.msard.2021.102949
11. Collaborators GBDMS. Global, regional, and national burden of multiple sclerosis 1990–2016: a systematic analysis for the Global Burden of Disease Study 2016. Lancet Neurol. (2019) 18:269–85. doi: 10.1016/S1474-4422(18)30443-5
12. Walton C, King R, Rechtman L, Kaye W, Leray E, Marrie RA, et al. Rising prevalence of multiple sclerosis worldwide: insights from the Atlas of MS. Multiple Scler J. (2020) 26:1816–21. doi: 10.1177/1352458520970841
13. Lane J, Ng HS, Poyser C, Lucas RM, Tremlett H. Multiple sclerosis incidence: a systematic review of change over time by geographical region. Mult Scler Relat Disord. (2022) 63:103932. doi: 10.1016/j.msard.2022.103932
14. Zahoor I, Haq E. Multiple sclerosis in India: iceberg or volcano. J Neuroimmunol. (2017) 307:27–30. doi: 10.1016/j.jneuroim.2017.03.015
15. Negrotto L, Correale J. Evolution of multiple sclerosis prevalence and phenotype in Latin America. Mult Scler Relat Disord. (2018) 22:97–102. doi: 10.1016/j.msard.2018.03.014
16. Mellinger S, Dias D, Flores N, Palavecino A, Vigo G, Burgos D, et al. Multiple sclerosis prevalence in Salta City, Argentina. Mult Scler Relat Disord. (2018) 25:212–5. doi: 10.1016/j.msard.2018.07.033
17. Hosseinzadeh A, Baneshi MR, Sedighi B, Kermanchi J, Haghdoost AA. Geographic variations of multiple sclerosis in Iran: a population based study. Mult Scler Relat Disord. (2019) 28:244–9. doi: 10.1016/j.msard.2019.01.001
18. Houzen H, Niino M, Hata D, Nakano F, Kikuchi S, Fukazawa T, et al. Increasing prevalence and incidence of multiple sclerosis in northern Japan. Multiple Scler. (2008) 14:887–92. doi: 10.1177/1352458508090226
19. Simpson-Yap S, Atvars R, Blizzard L, van der Mei I, Taylor BV. Increasing incidence and prevalence of multiple sclerosis in the Greater Hobart cohort of Tasmania, Australia. J Neurol Neurosurg Psychiatry. (2022) 93:723–31. doi: 10.1136/jnnp-2022-328932
20. Ajdacic-Gross V, Schmid M, Mutsch M, Steinemann N, von Wyl V, Bopp M. The change in the sex ratio in multiple sclerosis is driven by birth cohort effects. Eur J Neurol. (2017) 24:98–104. doi: 10.1111/ene.13160
21. Ajdacic-Gross V, Tschopp A, Schmid M, Bopp M, Gutzwiller F. Missed epidemics and missing links: international birth cohort trends in multiple sclerosis. Eur J Neurol. (2013) 20:440–7. doi: 10.1111/j.1468-1331.2012.03802.x
22. Holford TR. Understanding the effects of age, period, and cohort on incidence and mortality rates. Annu Rev Public Health. (1991) 12:425–57. doi: 10.1146/annurev.pu.12.050191.002233
23. Yang Y, Schulhofer-Wohl S, Fu Wenjiang J, Land Kenneth C. The intrinsic estimator for age-period-cohort analysis: what it is and how to use it. Am J Sociol. (2008) 113:1697–736. doi: 10.1086/587154
24. Bragazzi NL, Zhong W, Shu J, Abu Much A, Lotan D, Grupper A, et al. Burden of heart failure and underlying causes in 195 countries and territories from 1990 to 2017. Eur J Prevent Cardiol. (2021) 28:1682–90. doi: 10.1093/eurjpc/zwaa147
25. Hankey BF, Ries LA, Kosary CL, Feuer EJ, Merrill RM, Clegg LX, et al. Partitioning linear trends in age-adjusted rates. Cancer Causes Control. (2000) 11:31–5. doi: 10.1023/A:1008953201688
26. Gao S, Yang WS, Bray F, Va P, Zhang W, Gao J, et al. Declining rates of hepatocellular carcinoma in urban Shanghai: incidence trends in 1976–2005. Eur J Epidemiol. (2012) 27:39–46. doi: 10.1007/s10654-011-9636-8
27. Liu Z, Jiang Y, Yuan H, Fang Q, Cai N, Suo C, et al. The trends in incidence of primary liver cancer caused by specific etiologies: Results from the Global Burden of Disease Study 2016 and implications for liver cancer prevention. J Hepatol. (2019) 70:674–83. doi: 10.1016/j.jhep.2018.12.001
28. Yang Y, Fu WJ, Land KC. 2. A methodological comparison of age–period–cohort models: the intrinsic estimator and conventional generalized linear models. Sociol Methodol. (2016) 34:75–110. doi: 10.1111/j.0081-1750.2004.00148.x
29. He H, Liang L, Han D, Xu F, Lyu J. Different trends in the incidence and mortality rates of prostate cancer between China and the USA: a joinpoint and age–period–cohort analysis. Front Med. (2022) 9:824464. doi: 10.3389/fmed.2022.824464
30. Akaike H. A new look at the statistical model identification. IEEE Trans Autom Control. (1974) 19:716–23. doi: 10.1109/TAC.1974.1100705
31. Vrieze SI. Model selection and psychological theory: a discussion of the differences between the Akaike information criterion (AIC) and the Bayesian information criterion (BIC). Psychol Methods. (2012) 17:228–43. doi: 10.1037/a0027127
32. Langer-Gould A, Brara SM, Beaber BE, Zhang JL. Incidence of multiple sclerosis in multiple racial and ethnic groups. Neurology. (2013) 80:1734–9. doi: 10.1212/WNL.0b013e3182918cc2
33. Wallin MT, Culpepper WJ, Coffman P, Pulaski S, Maloni H, Mahan CM, et al. The Gulf War era multiple sclerosis cohort: age and incidence rates by race, sex and service. Brain. (2012) 135(Pt 6):1778–85. doi: 10.1093/brain/aws099
34. Prince M, Bryce R, Albanese E, Wimo A, Ribeiro W, Ferri CP. The global prevalence of dementia: a systematic review and metaanalysis. Alzheimer's Dement J Alzheimer's Assoc. (2013) 9:63–75.e2. doi: 10.1016/j.jalz.2012.11.007
35. Dorsey ER, Bloem BR. The Parkinson pandemic: a call to action. JAMA Neurol. (2018) 75:9–10. doi: 10.1001/jamaneurol.2017.3299
36. Manouchehrinia A, Tanasescu R, Tench CR, Constantinescu CS. Mortality in multiple sclerosis: meta-analysis of standardised mortality ratios. J Neurol Neurosurg Psychiatry. (2016) 87:324–31. doi: 10.1136/jnnp-2015-310361
37. Bronnum-Hansen H, Koch-Henriksen N, Stenager E. Trends in survival and cause of death in Danish patients with multiple sclerosis. Brain. (2004) 127(Pt 4):844–50. doi: 10.1093/brain/awh104
38. Lunde HMB, Assmus J, Myhr KM, Bo L, Grytten N. Survival and cause of death in multiple sclerosis: a 60-year longitudinal population study. J Neurol Neurosurg Psychiatry. (2017) 88:621–5. doi: 10.1136/jnnp-2016-315238
39. Moghaddam VK, Dickerson AS, Bazrafshan E, Seyedhasani SN, Najafi F, Hadei M, et al. Socioeconomic determinants of global distribution of multiple sclerosis: an ecological investigation based on Global Burden of Disease data. BMC Neurol. (2021) 21:145. doi: 10.1186/s12883-021-02170-3
40. Mansouri S, Zayeri F. Global and regional trends of multiple sclerosis disability-adjusted life years rates: a 25-year assessment. Neuroepidemiology. (2019) 52:17–24. doi: 10.1159/000492819
41. Koch-Henriksen N, Thygesen LC, Stenager E, Laursen B, Magyari M. Incidence of MS has increased markedly over six decades in Denmark particularly with late onset and in women. Neurology. (2018) 90:e1954–e63. doi: 10.1212/WNL.0000000000005612
42. Raggi A, Monasta L, Beghi E, Caso V, Castelpietra G, Mondello S, et al. Incidence, prevalence and disability associated with neurological disorders in Italy between 1990 and 2019: an analysis based on the Global Burden of Disease Study 2019. J Neurol. (2022) 269:2080–98. doi: 10.1007/s00415-021-10774-5
43. Gbaguidi B, Guillemin F, Soudant M, Debouverie M, Mathey G, Epstein J. Age–period–cohort analysis of the incidence of multiple sclerosis over twenty years in Lorraine, France. Sci Rep. (2022) 12:1001. doi: 10.1038/s41598-022-04836-5
44. Ribbons K, Lea R, Tiedeman C, Mackenzie L, Lechner-Scott J. Ongoing increase in incidence and prevalence of multiple sclerosis in Newcastle, Australia: a 50-year study. Multiple Scler. (2017) 23:1063–71. doi: 10.1177/1352458516671819
45. Nakken O, Lindstrom JC, Holmoy T. Sex ratio in multiple sclerosis mortality over 65 years; an age–period–cohort analysis in Norway. J Neurol. (2018) 265:1295–302. doi: 10.1007/s00415-018-8832-9
46. Magyari M, Sorensen PS. The changing course of multiple sclerosis: rising incidence, change in geographic distribution, disease course, and prognosis. Curr Opin Neurol. (2019) 32:320–6. doi: 10.1097/WCO.0000000000000695
47. Leray E, Moreau T, Fromont A, Edan G. Epidemiology of multiple sclerosis. Rev Neurol. (2016) 172:3–13. doi: 10.1016/j.neurol.2015.10.006
48. Gao Y, Liu X. Secular trends in the incidence of and mortality due to Alzheimer's disease and other forms of dementia in China from 1990 to 2019: an age–period–cohort study and joinpoint analysis. Front Aging Neurosci. (2021) 13:709156. doi: 10.3389/fnagi.2021.709156
49. Akhtar S, Al-Abkal J, Al-Hashel JY, Alroughani R. Age–period–cohort modeling of multiple sclerosis incidence rates in Kuwait: 1980–2014. Neuroepidemiology. (2017) 49:152–9. doi: 10.1159/000484318
50. Partridge L, Deelen J, Slagboom PE. Facing up to the global challenges of ageing. Nature. (2018) 561:45–56. doi: 10.1038/s41586-018-0457-8
51. Llorca J, Guerrero-Alonso P, Prieto-Salceda D. Mortality trends of multiple sclerosis in Spain, 1951–1997: an age–period–cohort analysis. Neuroepidemiology. (2005) 24:129–34. doi: 10.1159/000083000
52. Sonnenberg A, Ajdacic-Gross V. Similar birth-cohort patterns in Crohn's disease and multiple sclerosis. Multiple Scler. (2018) 24:140–9. doi: 10.1177/1352458517691620
53. Cohen AK, Syme SL. Education: a missed opportunity for public health intervention. Am J Public Health. (2013) 103:997–1001. doi: 10.2105/AJPH.2012.300993
Keywords: multiple sclerosis, burden, global, regional, national, age-period-cohort effects
Citation: Qian Z, Li Y, Guan Z, Guo P, Zheng K, Du Y, Yin S, Chen B, Wang H, Jiang J, Qiu K and Zhang M (2023) Global, regional, and national burden of multiple sclerosis from 1990 to 2019: Findings of global burden of disease study 2019. Front. Public Health 11:1073278. doi: 10.3389/fpubh.2023.1073278
Received: 18 October 2022; Accepted: 16 January 2023;
Published: 17 February 2023.
Edited by:
Alessandra Lugaresi, University of Bologna, ItalyReviewed by:
Bruno Colombo, University of Milan, ItalyFrancesco Patti, University of Catania, Italy
Copyright © 2023 Qian, Li, Guan, Guo, Zheng, Du, Yin, Chen, Wang, Jiang, Qiu and Zhang. This is an open-access article distributed under the terms of the Creative Commons Attribution License (CC BY). The use, distribution or reproduction in other forums is permitted, provided the original author(s) and the copyright owner(s) are credited and that the original publication in this journal is cited, in accordance with accepted academic practice. No use, distribution or reproduction is permitted which does not comply with these terms.
*Correspondence: Kunliang Qiu,  cWtsQGpzaWVjLm9yZw==; Mingzhi Zhang,
  em16QGpzaWVjLm9yZw==
†These authors have contributed equally to this work
‡ORCID: Kunliang Qiu orcid.org/0000-0003-4414-9758
Mingzhi Zhang orcid.org/0000-0001-9032-7274
 Zhen Qian
 Yuancun Li
 Zhiqiang Guan1†
 Pi Guo
 Yali Du
 Hongxi Wang
 Kunliang Qiu
 Mingzhi Zhang