- 1School of Public Health, Wuhan University, Wuhan, Hubei, China
- 2The Third Affiliated Hospital of Zhengzhou University, Zhengzhou, Henan, China
- 3Central China Normal University, Wuhan, China
- 4Huangpi District People's Hospital, Wuhan, China
- 5Wuhan Health Medical Cosmetic Hospital, Wuhan, China
- 6School of Public Health, Hubei University of Medicine, Shiyan, China
Introduction: It has become a common contemporary phenomenon for grandparents to provide care for young children in their family in both urban and rural areas. This study attempted to investigate psychological wellbeing and quality of life among grandparents involved in childcare in China, and to explore the relationships between sociodemographic characteristics, quality of life, and life satisfaction in this group.
Methods: Using stratified random cluster sampling, we conducted a survey of grandparent caregivers in Wuhan in November and December of 2020 (N = 1,640). Descriptive statistics to univariate analysis, multiple linear regression, and structural equation modeling were carried out.
Results: Across all respondents, mean scores on life satisfaction, sleep quality, and quality of life were 14.05 ± 3.50, 5.02 ± 3.37, and 74.51 ± 16.88, respectively. Marital status, income, chronic diseases, family relationships, and physical exercise were found to be associated with life satisfaction. The results of structural equation modeling indicated that quality of life, sleep quality, and sociodemographic characteristics may exert direct and indirect effects on life satisfaction. Mediating effects accounted for 30.0% of the total effects.
Conclusion: Overall, grandparent caregivers have poor life satisfaction, quality of life, and sleep quality. A higher household income, better relationships with family members, healthy lifestyle habits, and high-quality sleep may effectively help to improve life satisfaction among grandparent caregivers.
1. Introduction
Life satisfaction, as a subjective factor, is an important component of an individual's subjective experience of wellbeing (1); the term refers to the subjective way in which people perceive and respond to life events. Life satisfaction is a cognitive component of subjective wellbeing and can be defined as an individual's appraisal of the quality of their own life, including the perception that they are progressing toward their goals in life (2). In the literature, life satisfaction has been found to be associated with quality of life, which consists of four dimensions: physical health; psychological health; social functioning and social inclusion; and material circumstances (3).
International studies have highlighted the influence of income, marital status, physical environment, and other factors on life satisfaction (4–6), and have examined the mechanisms by which external factors affect subjective perceptions among adults (6–8). Material wealth (9, 10) and health (11) are considered to be the two most important factors influencing subjective life satisfaction among middle-aged and older adults. Older people who are in poor physical condition or whose financial circumstances are poor report lower levels of life satisfaction (10). Good physical health leads to higher levels of life satisfaction among older adults, while studies reported weaker associations between social support and life satisfaction than might be expected (12). However, a recent study in other populations has demonstrated that social support may affect individuals' physical and mental health (13). Additionally, in a study conducted in Russia, respondents' life satisfaction was found to be influenced by the circumstances of the people surrounding them. If the life satisfaction of their peers was worse than their own, the respondents reported higher levels of life satisfaction (14).
Researchers began to pay increasing amounts of attention to indices of life satisfaction and happiness in China from the 1980's. Most researches has focused primarily on defining the concept of life satisfaction, identifying the factors that influence it, and designing measurement tools for life satisfaction. Studies have shown that the external living environment of urban residents has a significant impact on life satisfaction: for example, individuals report positive emotions, such as optimism, joy, and contentment, if they live in a safe urban area with good access to amenities such as parks and gardens. Major life events, such as divorce or unemployment (15, 16), external living environment, income, views on social equity and justice (6), psychological resilience (13, 17), age (18, 19), community location (20), and social support from family, friends, or other social activities (13, 21) all are factors that have been reported to be associated with life satisfaction and happiness.
Grandparental caregiving has become increasingly common alongside increases in longevity and reductions in fertility (22). According to the Survey of Health, Aging, and Retirement in Europe, over 50% of families make use of grandparental childcare, with the figures for individual countries ranging from 37 to 59% (23). Similarly, approximately 46% of grandparents living in rural China migrate to major cities to provide care for their grandchildren (24). At present, in both urban and rural areas, it has become a widespread phenomenon that grandparents provide care for their grandchildren. Providing grandparental childcare may affect grandparents' quality of life and life satisfaction as they grow older. On the one hand, taking care of children is not only physically challenging, but also causes psychological distress and other negative feelings for grandparents who are required to take on childcare duties, affecting their interactions and relationships with their grandchildren and creating pressure, tension, and distress. On the other hand, taking care of grandchildren also has a range of positive effects, such as improvements in lifestyle, eating habits, physical activity, and social interaction. In addition, providing childcare can enrich the lives of grandparent caregivers by enabling them to maintain a close relationship with their family members. Despite these benefits, the prevalence of grandparental childcare has resulted in increasing concern for the life satisfaction of the grandparents providing this.
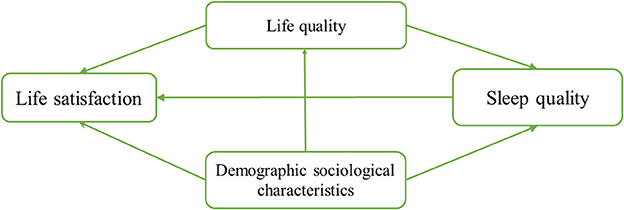
Given the to differences in grandparents participate in family childcare, it is difficult to predict or speculate on their self-perceived quality of life and life satisfaction. Given that previous studies have obtained various outcomes and drawn various conclusions, this study focused on self-perceived levels of life satisfaction and related social determinants of health and wellbeing, such as sleep quality, among grandparent caregivers. The hypothesis was that sleep quality plays a mediating role on the effect of quality of life satisfaction among grandparent caregivers and plays a mediating role in the relationship between quality of life and sociodemographic characteristics on their life satisfaction. Figure 1 shows the conceptual framework employed in this study. The study had two purposes: the first was to assess the life satisfaction of Chinese grandparent caregivers; the second was to investigate the relationships between life satisfaction, quality of life, sleep quality, and sociodemographic characteristics using structural equation modeling (SEM).
2. Sampling and methodology
2.1. Participants and sampling
This study was conducted using stratified random cluster sampling. During November and December of 2020, participants were recruited from a total of 60 kindergartens and elementary schools in four districts in Wuhan (Wuchang, Hongshan, Donghu High-tech Zone, and Hanyang).
With the help of teachers at each of the kindergartens and elementary schools, grandparents who were taking care of their grandchild were identified. The inclusion criteria for participation in this survey included confirmation that the grandparent had been performing childcare duties for more than 6 months, and that they understood the purpose of the survey and agreed to participate voluntarily. Potential participants who had speech disorders or difficulties with cognitive functioning were excluded. A total of 1,657 questionnaires were distributed as part of this study, and 1,640 valid sets of responses were collected, for a response rate of 98.97%. This study was approved by the research ethics committee of Wuhan University (Approval No. 2020YF0064).
After the survey was complete, the researchers constructed a database using Epidata 3.1, with double entry to ensure the quality of data input. After database cleaning and processing, including the elimination of questionnaires with missing answers or contradictory information, a total of 1,481 cases remained (90.30% of the total received). These correctly completed questionnaires were entered into the analysis.
2.2. Measurement instruments
This study used self-administered questionnaires to investigate the psychological wellbeing and quality of life of the grandparents who were included in the sample. The questionnaire consisted of five sections.
In Section 1, sociodemographic information was collected, including gender, age, place of residence, educational status, marital status, employment, monthly household income, the number of children in the household, chronic diseases, the age of the youngest grandchild receiving care from grandparents, employment status of the children's mother, and hired a assistant with childcare.
In Section 2, information was collected on the behaviors and lifestyles of family members, such as smoking, drinking, physical exercise, dietary patterns, and tea drinking.
In Section 3, life satisfaction was evaluated using the Life Satisfaction Index A (LSIA) (25), which consists of 20 items. Possible scores range from 0 to 20. Higher scores indicating higher perceived life satisfaction. This scale is often used to evaluate the life satisfaction of older adults, and has been reported to have good reliability and validity (26, 27).
In Section 4, sleep quality was evaluated using the Pittsburgh Sleep Quality Index (PSQI) (28), which consists of 18 items. The 18 items are categorized into 7 dimensions: (a) subjective sleep quality, (b) sleep latency, (c) sleep duration, (d) habitual sleep efficiency, (e) sleep disturbance, (f) use of sleep medication, and (g) daytime dysfunction; each of these subscales is scored on a scale of 0-3. The total score across each of the 7 dimensions is the total PSQI score, which can range from 0 to 21. The higher the score, the worse the respondent's sleep quality; an overall score above 5 is considered to represent poor sleep quality. Studies have shown that the PSQI has a high degree of reliability and validity in multiple contexts (28).
Finally, in Section 5, quality of life was evaluated using the 36-Item Short Form Health Survey (SF-36), which was originally developed by RAND Health Care and includes eight dimensions: (a) physical functioning, (b) social functioning, (c) role of physical health, (d) body pain, (e) mental health, (f) role of emotion, (g) vitality, and (h) general health. Scores of each of the 8 dimensions are calculated on the basis of the score for each relevant item. The raw score on each dimension is the sum of the scores for all items on this dimension. The final score for each dimension is obtained by adjusting the raw score as follows: final score = [(actual score - lowest possible score for that dimension)] / [(highest possible score for that dimension - lowest possible score for that dimension)] × 100. The higher the respondent's SF-36 score, the better their quality of life is. Numerous studies have verified the reliability and validity of the Chinese version of the SF-36 (29).
2.3. Statistical analysis
SPSS 22.0 and Amos 22.0 were used for statistical analysis in this study. Descriptive statistics, univariate analysis and multiple linear regression analyses were performed. Descriptive statistics are reported to describe the sociodemographic characteristics of respondents. T-tests or analyses of variance were used for numerical variables. Univariate analysis and multivariate linear regression were used to explore the relationships between sociodemographic characteristics, sleep quality, quality of life, and life satisfaction. Subsequently, structural equation models were constructed to identify mediating effects on associations of sociodemographic characteristics, sleep quality, and quality of life with life satisfaction. We evaluated the adjusted model by the basis of the chi-squared goodness-of-fit test (χ2/df ≤ 3.00 indicates a good model fit), the root mean square error of approximation (RMSEA; values ≤ 0.08 indicate a very good fit), the goodness of fit index (GFI), the Tucker–Lewis index (TLI), the comparative fit index (CFI), and the incremental fit index (IFI; values ≥0.90 indicate a very good fit).
3. Results
3.1. Sociodemographic characteristics
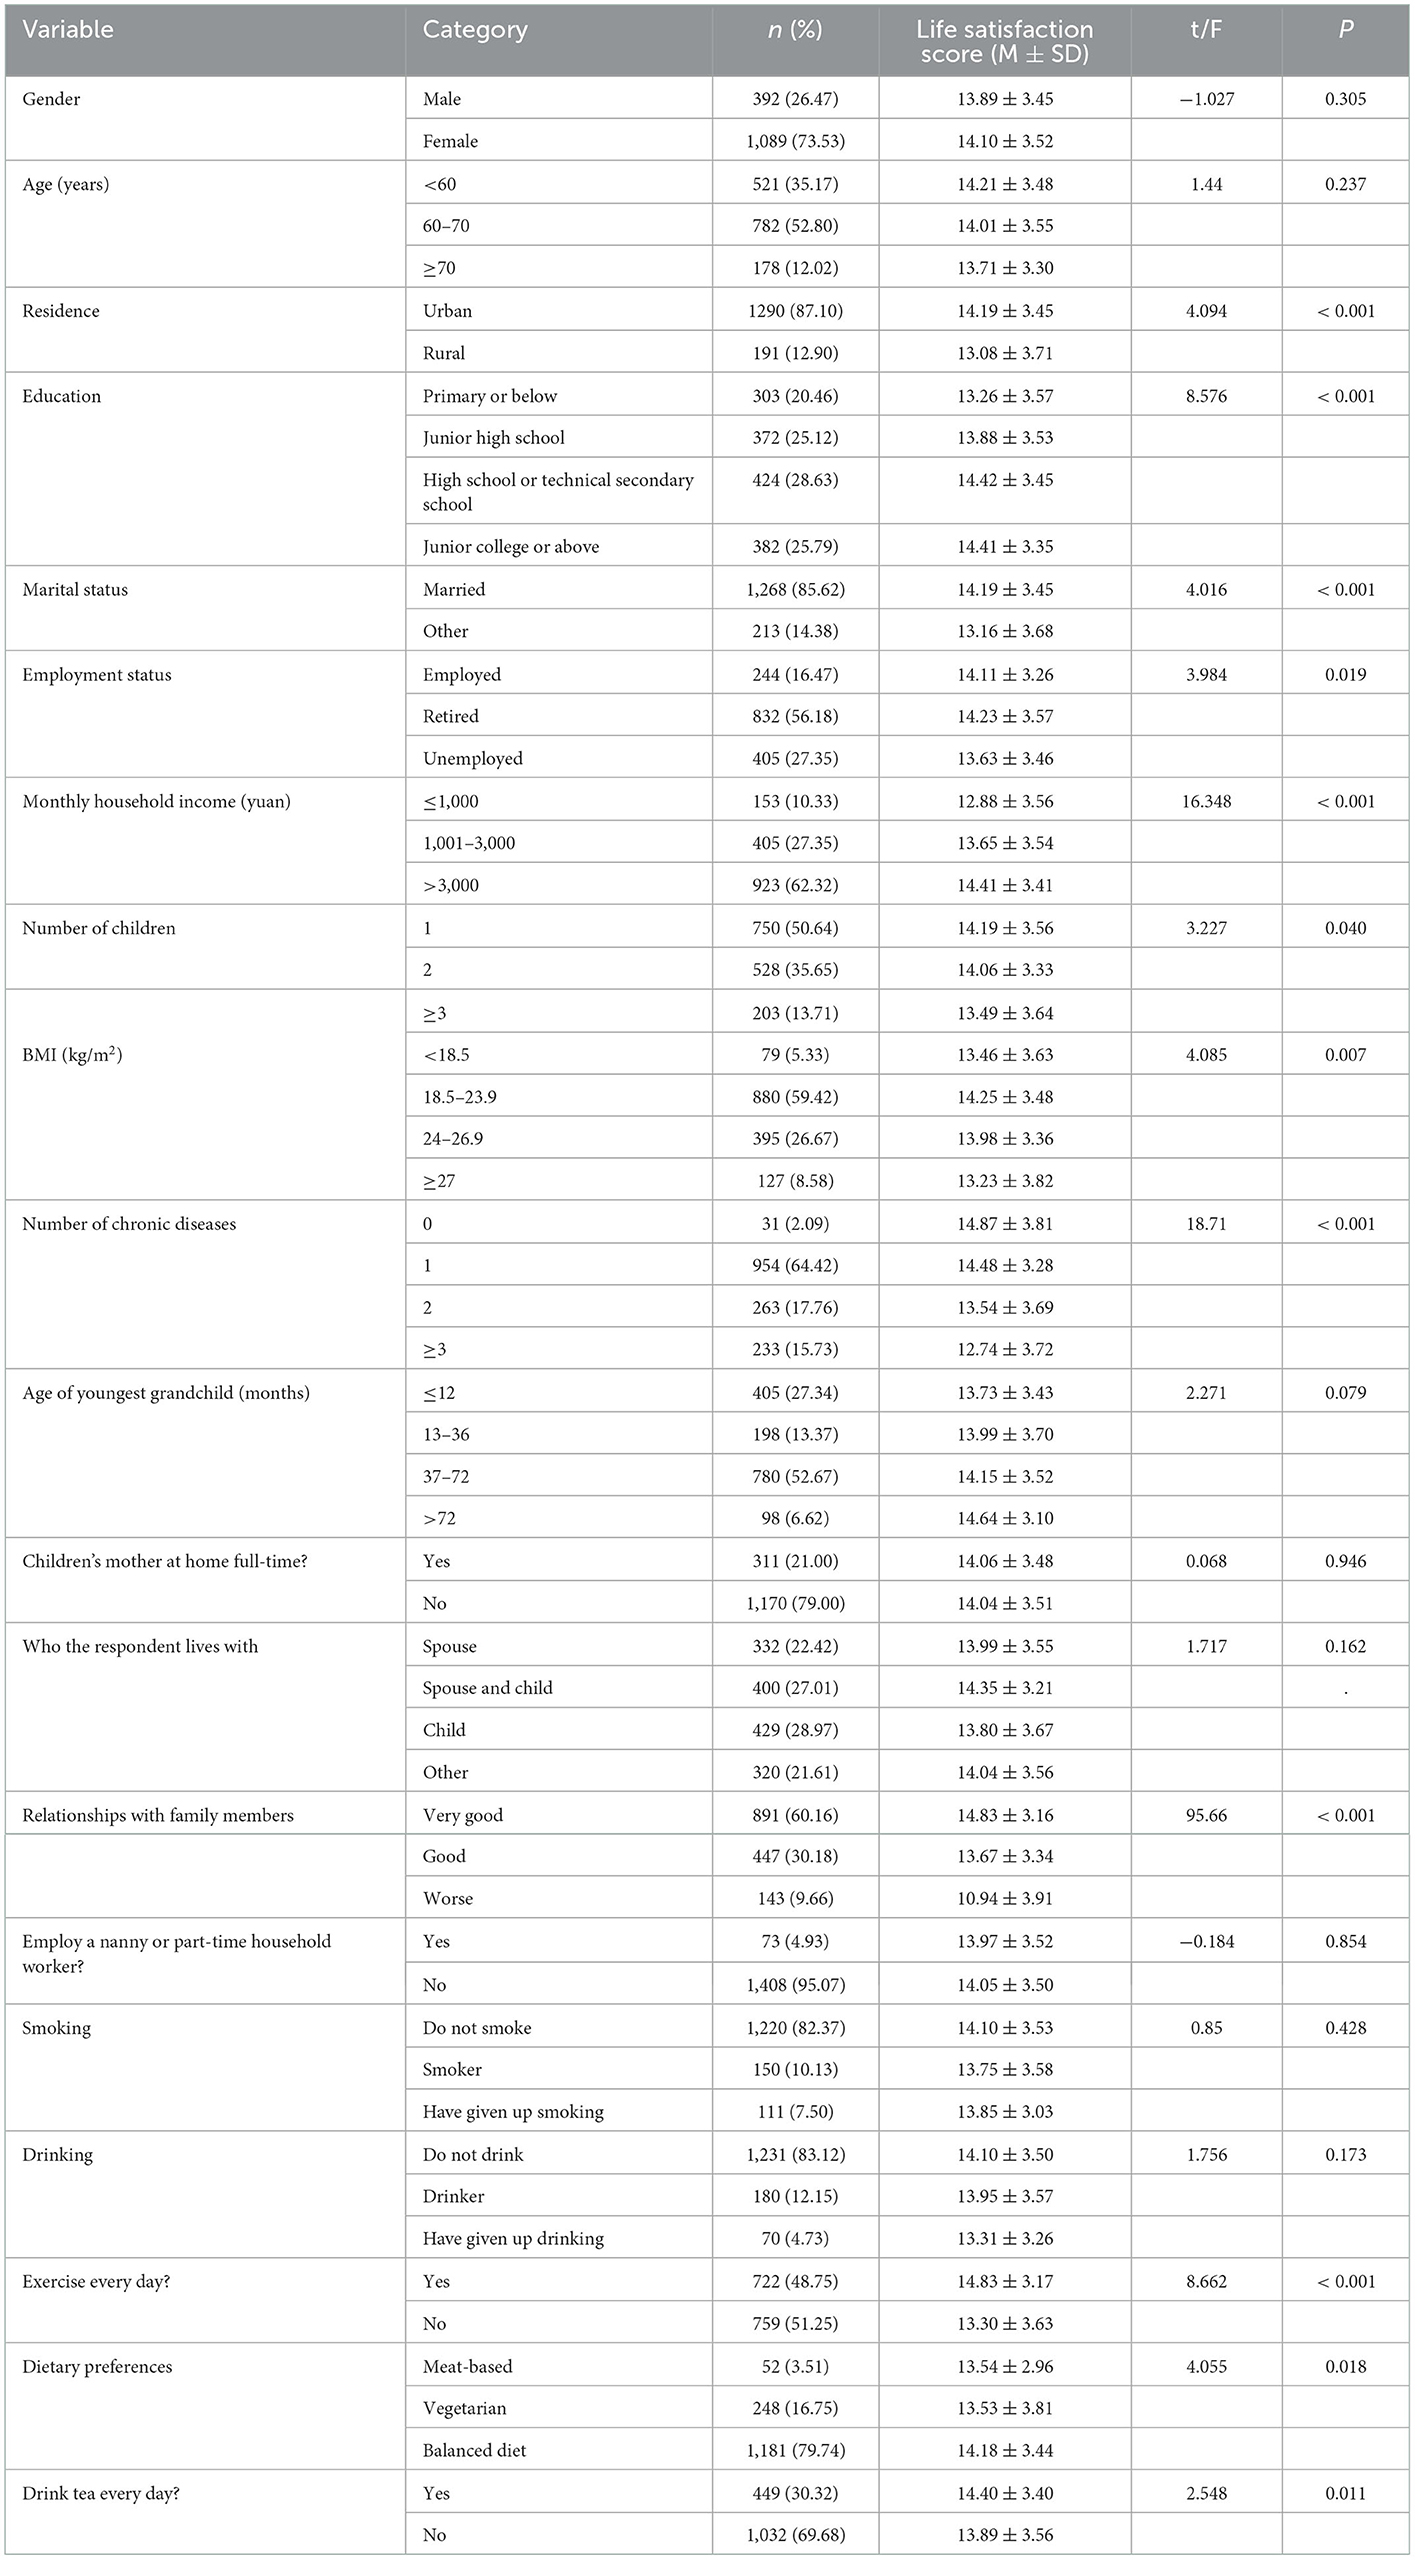
A total of 1,481 participants were included in this study, 26.47% of whom were men. The average age across all participants was 62.11 ± 5.98 years. In terms of education, approximately 28.63% of respondents had completed high school or technical secondary school, while 20.46% had an elementary or lower level of education. More than half of respondents (56.18%) were retired, while 16.47% were employed. More than a quarter of respondents (27.35%) were unemployed.
Only 6.62% of respondents provided care to a grandchild more than 6 years old; more than half (52.67%) provided care to a grandchild between 3 and 6 years old, while 13.37% provided care to a grandchild between 1 and 3 years old, and 27.34% provided care to a grandchild under one year old. Most of the respondents (60.16%) reported having good relationships with other members of their family. The vast majority of respondents (95.07%) indicated that they did not employ household workers for assistance with childcare or housework.
Regarding health behaviors, only 10.13% of respondents were smokers, and only 12.15% of respondents reported drinking alcohol. Almost half of participants (48.75%) reported engaging in regular physical exercise. Approximately 80% of respondents reported eating a diet consisting of a balance between meat and vegetables, while 16.75% were vegetarians. Detailed information is presented in Table 1.
3.2. Sleep quality
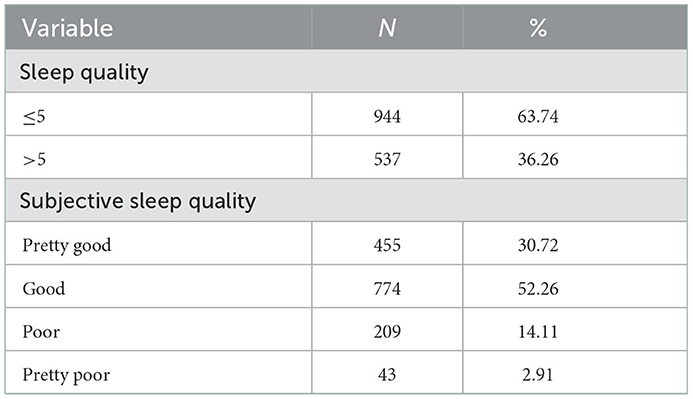
The average PSQI score was 5.02 ± 3.37. Considering the threshold score of 5, 36.26% of respondents reported experiencing sleep problems. Across all participants, 14.11% of respondents reported “poor” subjective sleep quality, and 2.91% of respondents reported that their subjective sleep quality was “pretty poor.” Detailed information is presented in Table 2.
In addition, 24.92% of participants reported taking 31–60 min to fall asleep, while 5.54% needed more than 60 min. Over half of respondents (50.30%) reported sleeping more than 7 h per night, and 27.14% indicated that they slept <6 h per night. Furthermore, approximately 65.43% of the respondents reported a sleep efficiency higher than 85%, while efficiency was below 65% for 7.29% of respondents. The proportion of respondents with a severe sleep disorder (with an overall score of 2 or 3) was 20.32%, while the proportion of respondents who had sleep medication during the past month was 3.65%. Nearly half of respondents (44.90%) reported experiencing daytime dysfunction due to sleep disturbances.
3.3. Quality of life
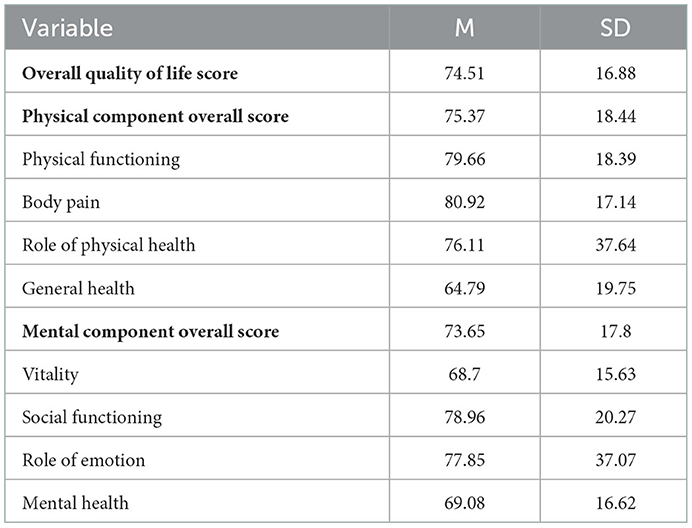
The average SF-36 score among all respondents was 74.51 ± 16.88, where higher scores indicate a higher quality of life. Across all participants, the average score of dimensions relating to physical health was 75.37 ± 18.44, and the average score of dimensions relating to psychological health was 73.65 ± 17.80. Among all dimensions of the SF-36, the highest-scoring was body pain, with an average score of 80.92 ± 17.14. Detailed information is presented in Table 3.
3.4. Associations between sociodemographic characteristics and life satisfaction
The average score of life satisfaction among all respondents was 14.05 ± 3.50. Univariate analysis indicated several variables were associated with life satisfaction. The relevant factors included (1) residence, (2) education, (3) marital status, (4) employment, (5) family income, (6) number of children in the household, (7) BMI, (8) chronic illnesses, (9) family relationships, (10) physical activities, (11) diet, and (12) tea drinking. These variables each had a significant impact on subjective life satisfaction among grandparent caregivers. Specifically, a higher level of education, a higher monthly family income, and good family relationships were beneficial for life satisfaction among grandparent caregivers. The full results of this analysis are presented in Table 1.
3.5. Multiple linear regression analyses of the influence of sociodemographic characteristics on life satisfaction
Univariate analysis indicated that there were multiple factors affecting life satisfaction among grandparent caregivers. In order to further explore the relationships between these factors and life satisfaction, a multiple linear regression model was constructed. After adjustment for related variables, respondents who were not married or in a committed relationship were found to report lower levels of life satisfaction in comparison to married respondents. Respondents with a monthly household income of more than 3,000 yuan had higher life satisfaction scores than those with a lower monthly income. Respondents with one or more chronic diseases reported lower levels of life satisfaction in comparison to those with no chronic diseases. Respondents with negative relationships with their family members had lower levels of life satisfaction in comparison to those with positive relationships. Furthermore, life satisfaction was lower among participants who did not engage in regular exercise than among those who routinely engaged in physical exercise. The details of these results are presented in Table 4.
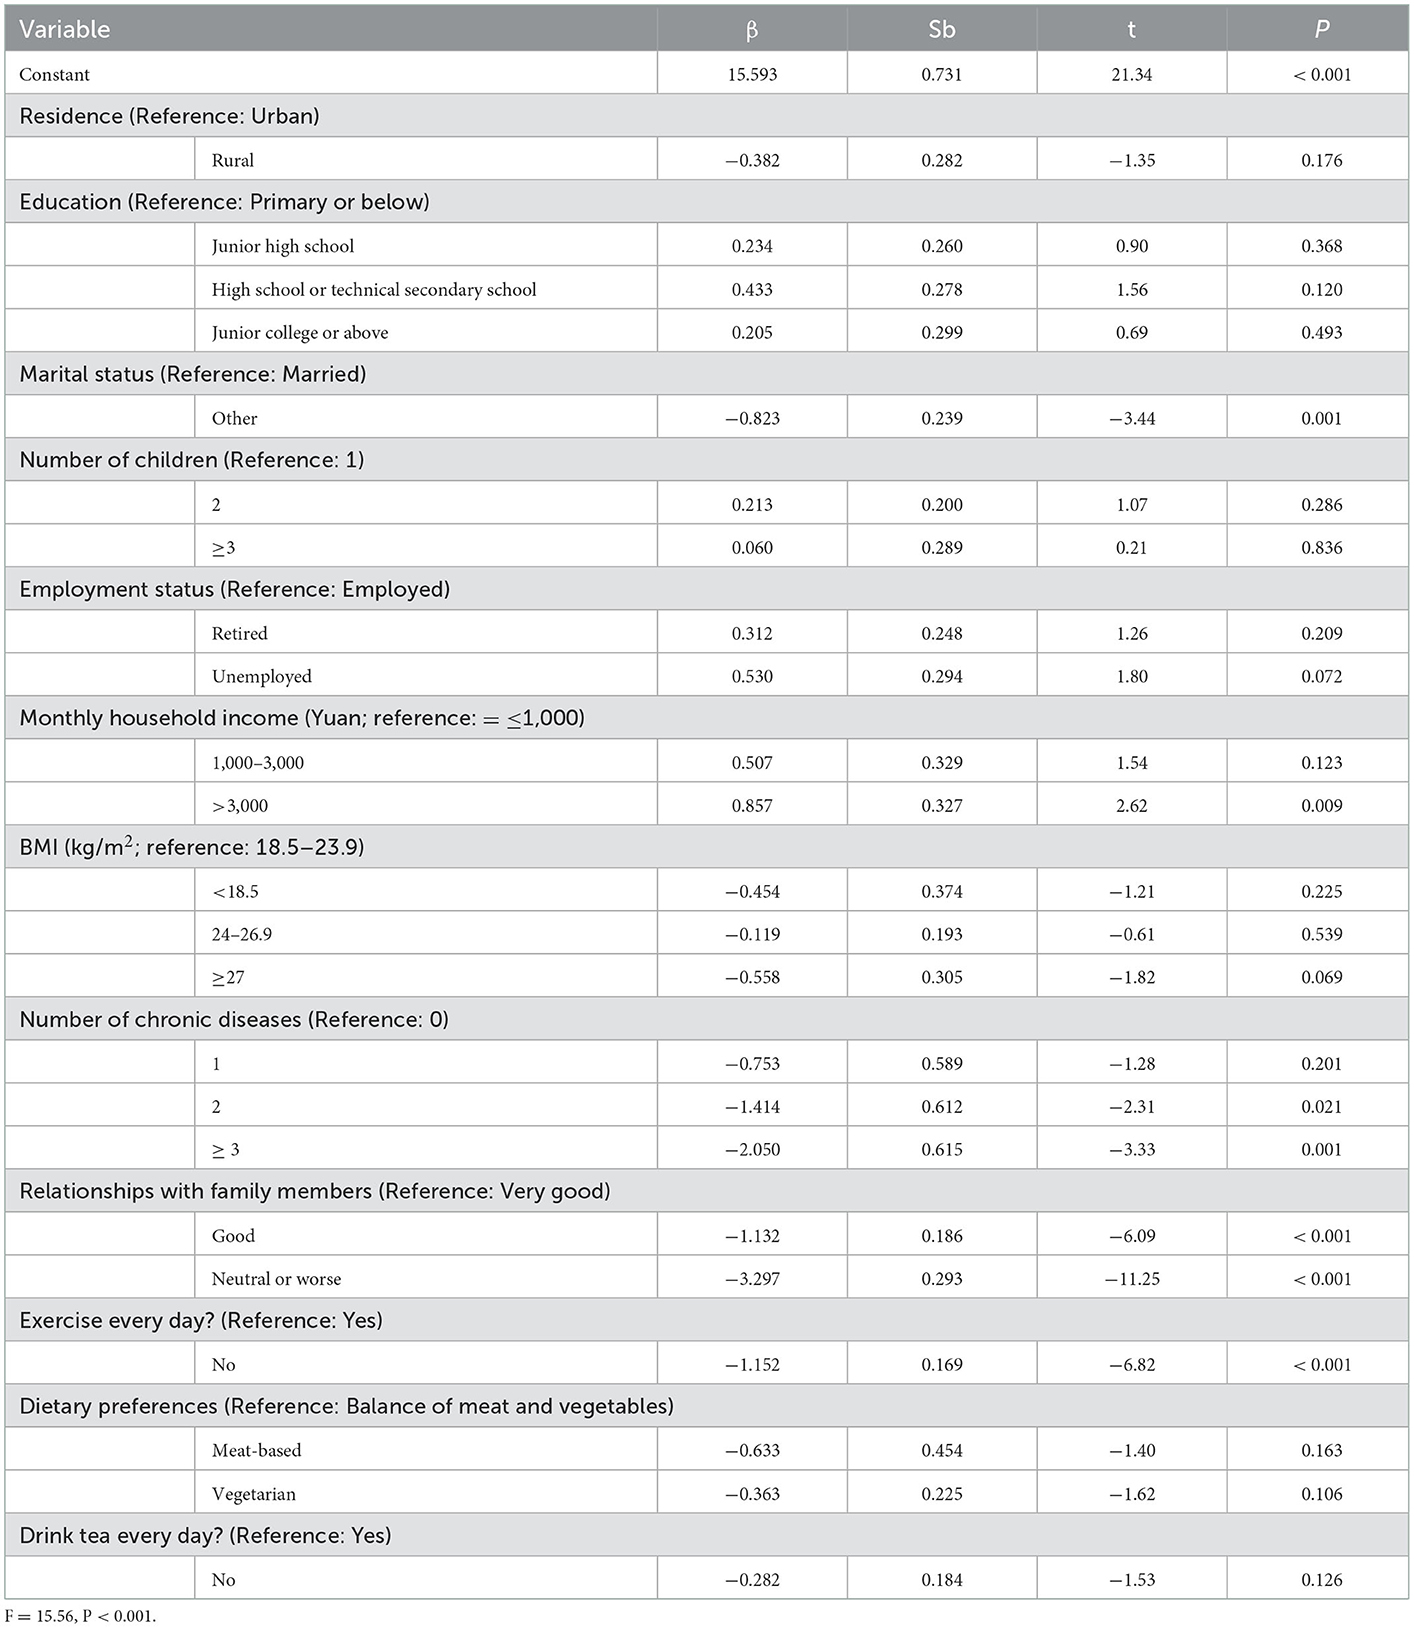
Table 4. Multivariate analysis of factors influencing life satisfaction among grandparent caregivers.
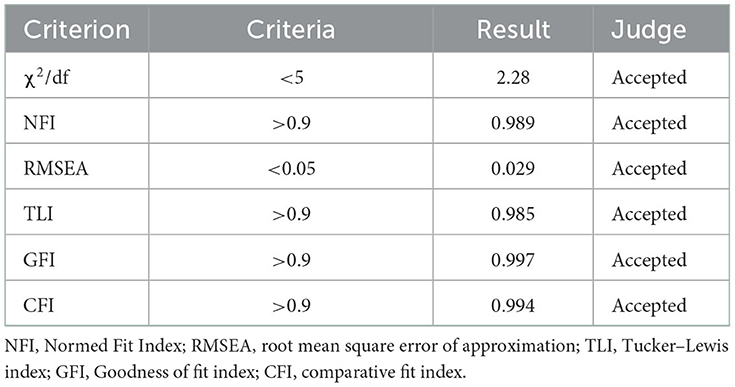
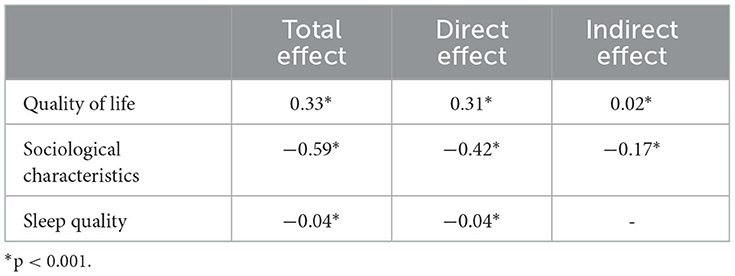
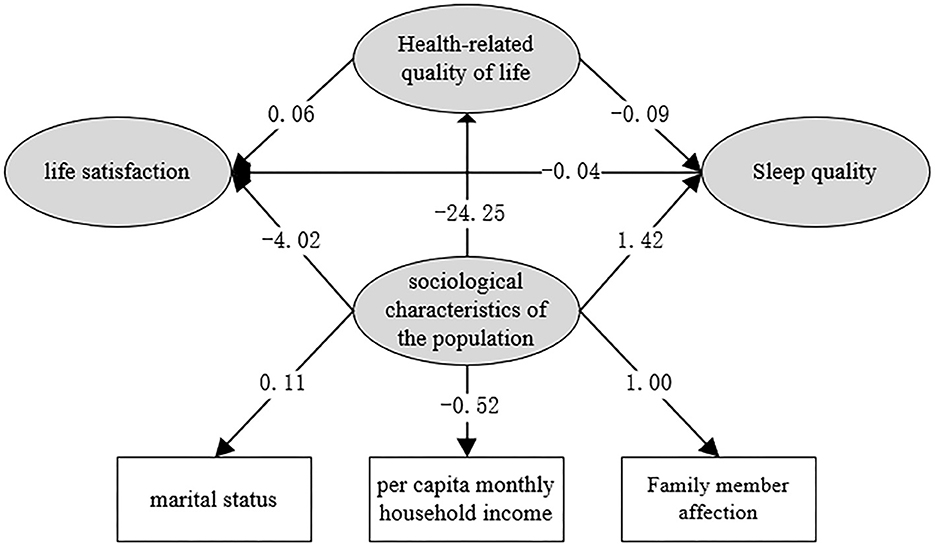
Sociodemographic, sociological, and lifestyle factors identified as relevant in the multivariate analysis, along with quality of life and sleep quality, were entered into the structural equation modeling analysis. Structural equation models were constructed to identify the factors influencing life satisfaction using the Maximum Likelihood method. Path relationships between each of the variables were calculated, and indicators of model fit were subsequently computed. Differences between models were considered to be statistically significant at P < 0.05. The mediation model represented a good fit to the data: χ2/df =2.28; RMSEA = 0.0029; CFI = 0.997 (see Table 5). The direct, indirect, and total effects of quality of life on life satisfaction were 0.31, 0.02, and 0.33, respectively. The total effect of sleep quality score on life satisfaction was −0.04. Finally, the direct, indirect, and total effects of sociodemographic characteristics on life satisfaction were −0.42, −0.17, −0.59, and respectively. Full details of the direct and indirect effects and the mediation model are presented in Table 6 and Figure 2.
4. Discussion
Based on a survey of grandparent caregivers in Wuhan, this study attempted to investigate the psychological wellbeing and quality of life of grandparents involved in childcare, and to explore the relationships between sociodemographic characteristics, quality of life, and life satisfaction in this population. Various sociodemographic characteristics were found to be associated with life satisfaction, and mediating effects of quality of life and sleep quality were also found to be in operation in this relationship. A chain effects of sociodemographic characteristics-quality of life- sleep quality- life satisfaction was also observed. Physical exercise, quality of life, and sleep quality were significant predictors of life satisfaction among grandparent caregivers.
Higher life satisfaction scores were observed among respondents who were married or in a committed relationship, which is consistent with results reported by Lee et al. (8). Presumably, people who live alone or are unmarried, divorced, or widowed tend to lack care from their peers as well as interaction and connection with others, and they are prone to feeling lost or lonely. The relationship between marital status and health (30, 31), including physical and mental health (4, 32, 33), has also been confirmed by many studies.
Consistent with the findings of Smith et al. (34), higher household income was found to be associated with higher life satisfaction. Increases in income are always accompanied by improvements in living conditions and opportunities relating to residence, diet, lifestyle, and social activities. Members of low-income families are at a higher risk of experiencing negative life events, such as unemployment, divorce, separation, and poor family relationships. These negative life experiences and challenges place older adults at a higher risk of experiencing emotional disorders, such as sadness, depression, hopelessness, nervousness, helplessness, or lacking of purpose. Previous studies have reported that people with a low income or who are unemployed have lower life satisfaction (5).
In line with the findings of Garrison's (1998) study (35), we observed lower levels of life satisfaction among respondents with one or more chronic medical conditions. According to previous studies, poor health is detrimental to mental health and happiness, affecting an individual's daily life and reducing their life satisfaction (4). Consistent with previous studies (31), our findings indicated a positive correlation between life satisfaction and engagement in physical exercise. The positive effects of physical exercise on life satisfaction can be explained by the fact that regular exercise was also associated with a lower risk of chronic disease, good sleep quality, and higher quality of life. High-quality sleep has a positive effect on physical and mental health, as the body needs high-quality sleep in order to be prepared for the next day. In order to achieve the grand goal of “healthy aging” proposed by the WHO in 1993, scholars all over the world have investigated the various factors that can affect quality of life among people of all demographic groups, not only older adults. Sleep quality has been found to be a crucial contributing factor in quality of life. Existing studies have also shown that factors such as age (36), sex (37, 38), sleep habits (39), physical illnesses and chronic conditions (40), mental illness (41), environmental factors (42), psychosocial factors (43), and treatment for insomnia (44) affect sleep quality among older adults.
According to previous studies, close social relationships may exert a powerful influence on physical health and wellbeing in later adulthood (45). In our study, respondents who had negative relationships with their family members reported lower levels of life satisfaction than those whose family relationships were positive. This can probably be attributed to the psychological strain of living in a household where there is a lack of positive communication and interaction. There is a consensus across both Eastern and Western studies that family relationships affect life satisfaction among grandparents (46). However, a study of cultural differences between China and the United States has suggested that family relationships are closely related to life satisfaction among Chinese older adults, while relationships with friends are more closely associated with life satisfaction among American older adults (47). Given that China's social security system and social pension resources are still relatively weak, family pensions are still the main form of pension in China. Therefore, older adults with harmonious family relationships are prone to achieve higher levels of life satisfaction.
In this study, several sociodemographic characteristics were found to be associated with life satisfaction, as well as quality of life, among grandparent caregivers. Additionally, sociodemographic characteristics and quality of life exerted indirect effects on life satisfaction via sleep quality. Therefore, increasing household income, improving family relationships, building healthy lifestyle habits, and improving sleep quality may help to improve levels of life satisfaction among grandparent caregivers.
Several limitations of this study should be noted. First, although the subjective scales used in this study have been demonstrated to be reliable and valid in multiple studies, our results may inevitably deviate quantifiably from objective reality. In addition, the study was limited to a specific geographical area, and the results therefore cannot be extrapolated to other regions without certain methodological innovations. Finally, this study was cross-sectional in nature and no longitudinal data were collected, which limits the extent to which causal relationships between variables can be explored. Cohort studies could be carried out in future to determine whether the relationships identified in this study are in fact causal and not simply incidental.
5. Conclusion
Various sociodemographic characteristics may affect life satisfaction, with quality of life and sleep quality playing mediating roles in this relationship. A higher household income, better relationships with family members, healthy lifestyle habits, and high-quality sleep may effectively help to improve life satisfaction among grandparent caregivers.
Data availability statement
The raw data supporting the conclusions of this article will be made available by the corresponding authors upon reasonable request.
Author contributions
XDT: conceptualization. YX, LZ, SYM, and SZ: methodology and formal analysis. XDT, YX, LZ, SYM, and SZ: validation. YX, LZ, SZ, SZP, QZ, and WWW: investigation. XDT, YX, and WWW: resources. YX, LZ, SZ, and WWW: data curation. YX, LZ, and SYM: writing–original draft preparation. XDT and WWW: writing–review and editing and supervision. LZ and SYM: visualization. All authors have read and agreed to the published version of the manuscript.
Acknowledgments
We would like to thank all participants for their support of this study.
Conflict of interest
The authors declare that the research was conducted in the absence of any commercial or financial relationships that could be construed as a potential conflict of interest.
Publisher's note
All claims expressed in this article are solely those of the authors and do not necessarily represent those of their affiliated organizations, or those of the publisher, the editors and the reviewers. Any product that may be evaluated in this article, or claim that may be made by its manufacturer, is not guaranteed or endorsed by the publisher.
References
2. Garcia-Castro FJ, Bendayan R, Blanca MJ. Measurement Invariance and validity of the satisfaction with life scale in informal caregivers. Psicothema. (2022) 34:299–307. doi: 10.7334/psicothema2021.313
3. Shah M, Mavers M, Bree A, Fosko S, Lents NH. Quality of life and depression assessment in nevoid basal cell carcinoma syndrome. Int J Dermatol. (2011) 50:268–76. doi: 10.1111/j.1365-4632.2010.04658.x
4. Zhang L, Jiang J, Wang P. Social cohesion associated with health mediated by emotional experience and life satisfaction: evidence from the internal migrants in China. Appl Res Qual Life. (2020) 16:1285–1303. doi: 10.1007/s11482-020-09818-1
5. Wang P, Xu Y, Zhang L. Economic Factors and Life Satisfaction in Internal Migrants: A Moderated Mediation Model of Perceived Stress and Social Integration. Springer Singapore. (2020). p. 89–102.
6. Hui Z, Wang Y, Wu D, Chen J. Evolutionary path of factors influencing life satisfaction among Chinese elderly: a perspective of data visualization. Data. (2018) 3:35. doi: 10.3390/data3030035
7. Zhang K, Pei J, Wang S, Rolcpelnis K, Yu X. Life Satisfaction in China, 2010–2018: trends and unique determinants. Appl Res Qual Life. (2022) 17:2311–48. doi: 10.1007/s11482-021-10031-x
8. Lee SH, Lee J, Choi I. Life satisfaction in later life: the interplay of marital condition and income among elderly Koreans. Sustainability. (2020) 12. doi: 10.3390/su12083483
9. Cheung F, Lucas RE. When does money matter most? Examining the association between income and life satisfaction over the life course. Psychol Aging. (2015) 30:120–35. doi: 10.1037/a0038682
10. Reed L. Thirty years of research on the subjective well-being of older Americans. J Gerontol. (1978) 109–25. doi: 10.1093/geronj/33.1.109
11. Fu SK, Anderson D, Courtney M, McAvan B. The relationship between country of residence, gender and the quality of life in Australian and Taiwanese midlife residents. Soc Indic Res. (2006) 79:25–49. doi: 10.1007/s11205-005-3002-8
12. Bowling A. Associations with life satisfaction among very elderly people living in a deprived part of inner London. Soc Sci Med. 1990 31:1003. doi: 10.1016/0277-9536(90)90112-6
13. Zhang L, Fu B, Xu Y, Zhang Q, Peng S, Tan X. Association between social support and perceived stress: a cross-sectional study on staffs of the epidemic prevention during the COVID-19 epidemic in China. Front Public Health. (2022) 10. doi: 10.3389/fpubh.2022.844139
14. Eggers A, Gaddy C, Graham C. Well-being and unemployment in Russia in the 1990s: can society's suffering be individuals' solace? J Socio Econ. (2006) 35:209–42. doi: 10.1016/j.socec.2005.11.059
15. Chen S, Yue G. Research on life satisfaction of urban residents and its influencing factors. J Psychol Sci. (2001) 24:664–6+765.
16. Taylor DG, Campbell A. The sense of well-being in America: recent patterns and trends. Contemp Sociol A J Rev. (1982) 11:276.
17. Kong F, Wang X, Hu S, Liu J. Neural correlates of psychological resilience and their relation to life satisfaction in a sample of healthy young adults. Neuroimage. (2015) 123:165–72. doi: 10.1016/j.neuroimage.2015.08.020
18. Berenbaum H, Chow PI, Schoenleber M, Flores LE. Pleasurable emotions, age, life satisfaction. J Posit Psychol. (2013) 8:140–3. doi: 10.1080/17439760.2013.772221
19. Steptoe A, Deaton A, Stone AA. Subjective wellbeing, health, and ageing. Lancet. (2015) 385:640–8. doi: 10.1016/S0140-6736(13)61489-0
20. Chen Y, Lü B, Chen R. Evaluating the life satisfaction of peasants in concentrated residential areas of Nanjing, China: A fuzzy approach. Habitat Int. (2016) 53:556–68. doi: 10.1016/j.habitatint.2016.01.002
21. Heintzelman SJ, Bacon PL. Relational self-construal moderates the effect of social support on life satisfaction. Pers Individ Differ. (2015) 73:72–7. doi: 10.1016/j.paid.2014.09.021
22. Li H, Hiilamo H, Zhu YD, Lin K. Exploring the association between grandparental care and child development: evidence from China. Health Soc Care Community. (2022) 30:e4122–32. doi: 10.1111/hsc.13806
23. Igel C, Szydlik M. Grandchild care and welfare state arrangements in Europe. J Eur Soc Policy. (2011) 21:210–24. doi: 10.1177/0958928711401766
24. Wang Y, Gonzales E. Examining the prevalence, risk and protective factors to family caregiving in China: findings from CHARLS. China J Soc Work. (2019) 12:3–19. doi: 10.1080/17525098.2019.1591697
25. Neugarten BL, Havighurst RJ, Tobin SS. The measurement of life satisfaction. J Gerontol. (1961) 134. doi: 10.1037/t06514-000
26. Fagerström C, Lindwall M, Berg AI, Rennemark M. Factorial validity and invariance of the Life Satisfaction Index in older people across groups and time: addressing the heterogeneity of age, functional ability, and depression. Arch Gerontol Geriatr. (2012) 55:349–56. doi: 10.1016/j.archger.2011.10.007
27. Suba F, Hayran O. Evaluation of life satisfaction index of the elderly people living in nursing homes. Arch Gerontol Geriatr. (2005) 41:23–9. doi: 10.1016/j.archger.2004.10.005
28. Buysse DJ, Reynolds CF 3rd, Monk TH, Berman SR, Kupfer DJ. The Pittsburgh Sleep Quality Index: a new instrument for psychiatric practice and research. Psychiatry Res. (1989) 28. doi: 10.1016/0165-1781(89)90047-4
29. Ren XS, Amick B 3rd, Zhou L, Gandek B. Translation and psychometric evaluation of a chinese version of the SF-36 health survey in the United States. J Clin Epidemiol. (1998) 51:1129–38. doi: 10.1016/S0895-4356(98)00104-8
30. Zhang L, Tan X. Educational assortative mating and health: a study in Chinese internal migrants. Int J Environ Res Publ Health. (2021) 18:1375. doi: 10.3390/ijerph18041375
31. Kim ES, Delaney SW, Tay L, Chen Y, Diener ED, Vanderweele TJ. Life Satisfaction and subsequent physical, behavioral, and psychosocial health in older adults. Milbank Q. (2021) 99:209–39. doi: 10.1111/1468-0009.12497
32. Steptoe A. Happiness and Health. Annu Rev Public Health. (2019) 40:339–59. doi: 10.1146/annurev-publhealth-040218-044150
33. Park S, Lee S, Kim Y, Lee Y, Kang MW, Kim K, et al. Causal effects of positive affect, life satisfaction, depressive symptoms, and neuroticism on kidney function: a mendelian randomization study. J Am Soc Nephrol. (2021) 32:1484–96. doi: 10.1681/ASN.2020071086
34. Smith J, Fleeson W, Geiselmann B, Settersten RA, Kunzmann U. Sources of Well-being in Very Old Age. The Berlin Aging Study: Aging from 70 to 100. (1999) 450–71.
35. Garrison MEB. Determinants of the quality of life of rural families. J Rural Health. (1998) 14:146–54. doi: 10.1111/j.1748-0361.1998.tb00616.x
37. Newman AB, Enright PL, Manolio TA, Haponik EF, Wahl PW. Sleep disturbance, psychosocial correlates, and cardiovascular disease in 5201 older adults: the cardiovascular Health Study. J Am Geriatr Soc. (1997) 45:1–7. doi: 10.1111/j.1532-5415.1997.tb00970.x
38. Cybulski M, Cybulski L, Krajewska-Kulak E, Orzechowska M, Cwalina U, Kowalczuk K. Sleep disorders among educationally active elderly people in Bialystok, Poland: a cross-sectional study. BMC Geriatr. (2019) 19:225. doi: 10.1186/s12877-019-1248-2
39. Liu X, Liu L Sleep Sleep habits and insomnia in a sample of elderly persons in China. Sleep. (2005) 1579–87. doi: 10.1093/sleep/28.12.1579
40. Doghramji K. Treatment strategies for sleep disturbance in patients with depression. J Clin Psychiatry. (2003) 64:24–9. doi: 10.1016/S0887-6185(02)00239-6
41. Fuller KH, Waters WF, Binks PG, Anderson T. Generalized anxiety and sleep architecture: a polysomnographic investigation. Sleep. (1997) 20:370–6. doi: 10.1093/sleep/20.5.370
42. Li G, Zhu Z, Hu M, He J, Yang W, Zhu J, et al. Effects of carbon dioxide and green space on sleep quality of the elderly in rural areas of Anhui Province, China. Environ Sci Pollut Res. (2022) 29:21107–18. doi: 10.1007/s11356-021-17296-7
43. Bliwise NG. Factors related to sleep quality in healthy elderly women. Psychol Aging. (1992) 7:83. doi: 10.1037/0882-7974.7.1.83
44. Holmquist IB, Svensson B, Hoglund P. Perceived anxiety, depression, and sleeping problems in relation to psychotropic drug use among elderly in assisted-living facilities. Eur J Clin Pharmacol. (2005) 61:215–24. doi: 10.1007/s00228-004-0857-6
45. Rook KS, Charles ST. Close social ties and health in later life: Strengths and vulnerabilities. Am Psychol. (2017) 72:567–77. doi: 10.1037/amp0000104
46. Herrera MS, Galkuté M, Fernández MB, Elgueta R. Grandparent-grandchild relationships, generativity, subjective well-being and self-rated health of older people in Chile. Soc Sci Med. (2022) 296:114786. doi: 10.1016/j.socscimed.2022.114786
Keywords: personal satisfaction, quality of life, sleep quality (SQ), grandparent caregiver, structural equation modeling
Citation: Xu Y, Zhang L, Mao SY, Zhang S, Peng SZ, Zhang Q, Wu WW and Tan XD (2023) Sociodemographic determinants of life satisfaction among grandparent caregivers. Front. Public Health 11:1044442. doi: 10.3389/fpubh.2023.1044442
Received: 14 September 2022; Accepted: 04 January 2023;
Published: 26 January 2023.
Edited by:
Saeid Safiri, Tabriz University of Medical Sciences, IranReviewed by:
Andrei Shpakou, Medical University of Bialystok, PolandMateusz Cybulski, Medical University of Bialystok, Poland
Copyright © 2023 Xu, Zhang, Mao, Zhang, Peng, Zhang, Wu and Tan. This is an open-access article distributed under the terms of the Creative Commons Attribution License (CC BY). The use, distribution or reproduction in other forums is permitted, provided the original author(s) and the copyright owner(s) are credited and that the original publication in this journal is cited, in accordance with accepted academic practice. No use, distribution or reproduction is permitted which does not comply with these terms.
*Correspondence: Xiaodong Tan,  MDAzMDA0NjlAd2h1LmVkdS5jbg==; Wenwen Wu,
  d3V3ZW53ZW4xMDhAMTI2LmNvbQ==
†These authors have contributed equally to this work
 Yi Xu
Yi Xu Ling Zhang
 Shuyuan Mao2†
 Qi Zhang
 Wenwen Wu
 Xiaodong Tan