 Chao Huang1†
 Erwei Gao1†Feng Xiao2Qiongzhen Wu2Wei Liu1Yi Luo3
 Xiaohu Ren1
 Xiao Chen1
 Kaiwu He1
 Haiyan Huang1Qian Sun1Desheng Wu1
 Jianjun Liu1*
- 1Shenzhen Key Laboratory of Modern Toxicology, Shenzhen Medical Key Discipline of Health Toxicology (2020–2024), Shenzhen Center for Disease Control and Prevention, Shenzhen, Guangdong, China
- 2Food Inspection and Quarantine Technology Center of Shenzhen Customs, Shenzhen, Guangdong, China
- 3Shenzhen Luohu Hospital for Traditional Chinese Medicine, Shenzhen Luohu Hospital Group, Shenzhen, Guangdong, China
Objective: Independent and interactive effects of multiple metals levels in urine on the risk of hyperuricemia (HUA) in the elderly were investigated.
Methods: A total of 6,508 individuals from the baseline population of the Shenzhen aging-related disorder cohort were included in this study. We detected urinary concentrations of 24 metals using inductively coupled plasma mass spectrometry, fitted unconditional logistic regression models, and the least absolute shrinkage and selection operator regression models for the selection of metals as well as unconditional stepwise logistic regression models and restricted cubic spline logistic regression models for assessing the associations of urinary metals and HUA risk, and finally applied generalized linear models to determine the interaction with urinary metals on the risk of HUA.
Results: Unconditional stepwise logistic regression models showed the association between urinary vanadium, iron, nickel, zinc, or arsenic and HUA risk (all P < 0.05). We revealed a negative linear dose–response relationship between urinary iron levels and HUA risk (Poverall < 0.001, Pnonliner = 0.682), a positive linear dose–response relationship between urinary zinc levels and HUA risk (Poverall < 0.001, Pnonliner = 0.513), and an additive interaction relationship between urinary low-iron and high-zinc levels and HUA risk (RERI = 0.31, 95% CI: 0.03–0.59; AP = 0.18, 95%CI: 0.02–0.34; S = 1.76, 95%CI: 1.69–3.49).
Conclusion: Urinary vanadium, iron, nickel, zinc, or arsenic levels were associated with HUA risk, and the additive interaction of low-iron (<78.56 μg/L) and high-zinc (≥385.39 μg/L) levels may lead to a higher risk of HUA.
Introduction
Hyperuricemia (HUA) is the second most common metabolic disease in China; it has been a concern because of its association with cardiovascular diseases and chronic kidney diseases (1–3). HUA is defined as a serum uric acid (SUA) level of ≥ 7.0 mg/dl for men and ≥ 6.0 mg/dl for women. A meta-analysis of 59 studies on HUA in China during 1995–2010 suggested that the crude prevalence of HUA in the Chinese population was 13.3, 19.4% for men and 7.9% for women (3), and the age-standardized prevalence of HUA in the Chinese population increased with age from 9.5% in individuals aged 60–64 years to 21.9% in those aged 80+ years (4). Individuals with higher SUA were at high risk for hypertension, metabolic syndrome, acute myocardial infarction, and Alzheimer's disease (5–8). Moreover, a relationship between SUA levels and traditional risk factors including gender, age, dietary habit, and body mass index (BMI) was found (9); however, limited evidence of non-traditional risk factors for elevated serum SUA levels is available in the literature.
Multiple metals can enter the body through the inhalation of air, tobacco smoking, ingestion of drinking water and food, and skin contact, which may induce pathological responses as well as many diseases, such as cardiovascular disease, cancer, and kidney disease (10–13). Evidence indicated that environmental exposure to metals is related to HUA in American and Chinese adults (14–17) and multiple metals exposure can cause metabolic disorders and cognitive impairment in elderly Chinese persons (18, 19). Based on the data from the National Health and Nutrition Examination Survey (NHANES) during the period from 2003 to 2010, Kuo et al. found that HUA risk was 1.84 times higher in men with total urinary arsenic (As) of ≤ 4.2 μg/L than those with total urinary As of >17.3 μg/L (14). A recent cross-sectional study in Shenzhen, China regarding routine physical examination data (n = 1,406, ranging in age from 31 to 91 years) suggested a positive dose–response relationship between plasma levels of zinc (Zn) or As and HUA risk (15). Several studies in Changsha, China showed that among 6,212 adults aged above 40 years, serum copper (Cu) levels showed a positive relationship with HUA risk after adjusting for potential confounders (age, gender, BMI, smoking, drinking, education, occupation, hypertension, and diabetes) (16), and among 2,120 adults aged 20–75 years, only women with total blood lead (Pb, >126 μg/L) had a 2.19-fold higher risk of HUA (17). Nevertheless, literature regarding the adverse effects of multiple metals co-exposure on HUA is limited.
Certain metals could show synergistic and antagonistic interactions with other metals on human health by promoting or inhibiting the absorption of other metals (20). The NHANES (2011–2016) study revealed that whole-blood Pb showed a synergistic interaction with blood manganese on the reduced bone mineral density (21). A recent study (n = 2,882 individuals with a mean age of 65.58 years) from the Dongfeng-Tongji cohort indicated that higher plasma concentrations of selenium (Se) with Zn decreased the positive association between plasma Cu and C-reactive protein (22). However, many studies on plasma or serum levels of metals indicated the differences in metal concentrations in various biological samples and their biological significance. For example, urinary cadmium (Cd) concentrations reflect a long-term accumulation of Cd in the kidneys (23), while blood Cd concentrations mainly reflect recent exposure to Cd (24). Therefore, the relationship between metal concentrations in humans and HUA risk cannot be fully explained by blood metal concentrations. We measured urinary metal concentrations (25) and SUA levels to explore the association between urinary levels of multiple metals with hyperuricemia risk in elderly residents in Shenzhen.
Materials and methods
Subjects
This cross-sectional study is based on the baseline data from the Shenzhen aging-related disorder cohort (26). The baseline population consisted of 9,411 elderly residents (≥ 60 years) with a Shenzhen household registration from the 51 community rehabilitation centers in a district of Shenzhen by random cluster sampling methods, during the period from July 2017 to November 2018. They participated in a health questionnaire and physical examination. To investigate the association between urinary metals levels and HUA risk, we first excluded 36 individuals with self-reported kidney diseases and 1,022 individuals with an estimated glomerular filtration rate (eGFR) of <60 ml/min per 1.73 m2 from the baseline population. Thereafter, we excluded 1,845 individuals who missed data on educational information (n = 75), marital status (n = 123), passive smoking status (n = 71), drinking status (n = 16), hypertension (n = 14), hyperlipidemia (n = 14), diabetes (n = 23), kidney diseases (n = 10), BMI (n = 88), and serum creatinine (n = 21), as well as 1,390 individuals without urinary metal values. Finally, 6,508 individuals were included in this study. The research protocol was approved by the Medical Ethics Research Committee of Shenzhen Center for Disease Control and Prevention (approval numbers: R2017001 and R2018020). Each participant signed an informed consent form before engaging in the study.
Data collection
We collected data on the health questionnaire from the participants through the trained investigators in face-to-face interviews. The health questionnaire contained the following items: general demographics, personal and family health histories, tobacco smoking, and alcohol drinking. In this study, HUA was defined as SUA of >420 μmol/L in male participants and >360 μmol/L in female participants (27). Current smoking was defined as those who smoked at least one cigarette per day for more than 6 months; quit smoking was defined as those who had quit smoking at the time of the survey; the rest were considered as never smoking. Current drinking was defined as those who drank at least once a week for over 6 months; quit drinking was defined as those who had quit drinking at the time of the survey; the rest were considered never drinking. Hypertension was defined as systolic blood pressure (SBP) of ≥140 mmHg, diastolic blood pressure (DBP) of ≥90 mmHg, previously diagnosed patients with hypertension patients, or antihypertensive drug use. Diabetes was defined as fasting blood glucose concentration of ≥7.0 mmol/L, previously diagnosed diabetes, or hypoglycemic drug use. Hyperlipidemia was defined as total cholesterol of ≥5.18 mmol/L, triglyceride of ≥1.7 mmol/L, low-density lipoprotein cholesterol of ≥3.37 mmol/L, high-density lipoprotein cholesterol of ≤ 1.0 mmol/L, or previously diagnosed hyperlipidemia or lipid-lowering drug use. eGFR was calculated according to the formula recommended by the Chronic Kidney Disease Epidemiology Collaboration (CKD-EPI) (2009 edition) (28): serum creatinine (Scr) ≤ 0.7 mg/dL, eGFR = 144 × (Scr/0.7)−0.329 × (0.993) age; Scr > 0.7 mg/dL, eGFR = 144 × (Scr/0.7)−1.209 × (0.993) age for female participants; Scr ≤ 0.9 mg/dL, eGFR = 141 × (Scr/0.9)−0.411 × (0.993) age; Scr > 0.9 mg/dL, eGFR = 141 × (Scr/0.9)−1.209 × (0.993) age for male participants. Data were expressed in ml/min per 1.73 m2.
Urinary metal concentrations
We measured 24 urinary metals in urine samples, including lithium, beryllium (Be), aluminum (Al), titanium, vanadium (V), chromium (Cr), manganese, iron (Fe), cobalt, nickel (Ni), Cu, Zn, As, Se, rubidium, strontium, molybdenum (Mo), Cd, indium (In), tin, antimony (Sb), barium, thallium (Tl), and Pb using inductively coupled plasma-mass spectrometry (ICP-MS, NEXION 300X. PerkinElmer Inc. Waltham, Massachusetts, USA). Briefly, urine samples were thawed at room temperature and then centrifuged (4,200 rpm × 10 min) at room temperature. Afterward, 0.5 ml of supernatant from each urine sample was added into a 15 ml polypropylene tube, and then 4.5 ml of 2% nitric acid solution (10 times the diluted urine sample) was added. To assess the accuracy of the measurements, SeronomTM Trace Elements Urine L-1 (Sero Incorporated Company. Billingstad, Norway), SeronomTM Trace Elements Urine L-2 (Sero Incorporated Company. Billingstad, Norway), and Trace Elements in Natural Water (SRM1640a) (National Institute of Standards and Technology. Gaithersburg, Maryland, USA) were added as quality control samples for each batch. As shown in Supplementary Table 1, the range values of 66.04–152.86% in urinary metals were considered acceptable for spike recoveries. The limits of detection (LOD) ranged from 0 to 1.66 μg/L for urinary Fe and from 0 to 0.13 μg/L for urinary Zn. The limits of quantification (LOQ) ranged from 0.01 to 5.54 μg/L for urinary Fe and from 0 to 0.44 μg/L for urinary Zn. Urinary concentrations of Be, In, and Sb were excluded from further analysis because the values of Be, In, and Sb in more than 80% of individuals were below the corresponding LOD. Values of urinary metals below the LOQ were replaced by LOQ/2.
Statistical analysis
A Student's t-test, Mann-Whitney U-test, and Chi-square test were correspondingly used to compare normally, non-normally continuous (including eGFR, urine creatinine, and urinary metals concentrations), and categorical variables (including age, gender, education level, marital status, active smoking status, passive smoking status, drinking status, hypertension, diabetes, hyperlipidemia, and BMI) between the non-hyperuricemia and hyperuricemia groups. Values of urinary metals were log10-transformed before analysis to approximately normal distributions. Values of Spearman's rank correlations coefficient were calculated among the 21 urinary metal concentrations.
We identified individual urinary metals by unconditional logistic regression models or LASSO regression models for further analysis. When constructing unconditional logistic regression models, the participants were divided into four subgroups (i.e., ≤ P25 as the reference group, P25, P50, and P75) according to the quartile values of urinary concentrations of individual metal, after adjusting for potential confounders, including age (<67 or ≥67 years old), gender (male or female), education level (<9, ≥9, or ≥13 years), marital status (married or other marital status), active smoking status (never, quit, or current), passive smoking status (yes or no), drinking status (never, quit, or current), hypertension (yes or no), diabetes (yes or no), hyperlipidemia (yes or no), BMI (<24 or ≥24 kg/m2), estimated glomerular filtration rate (eGFR: mL/min per 1.73 m2), and urine creatinine (μmol/L). The median value in each metal quartile (log10-transformed urinary metal value) was entered into the logistic regression model as a continuous variable. In the LASSO regression model, 10-fold cross-validation was used to select metals based on the lambda (λ) parameter with minimum mean square error (minimum MSE). Identified metals by both logistical regression models and LASSO regression were included in unconditional stepwise logistic regression models (enter = 0.05 and remove = 0.10). Herein, we adjusted for the same potential confounders in both logistical regression models and LASSO regression. RCS logistic regression models were constructed to analyze the dose–response relationship between urinary metals levels and HUA risk. The knots were set to the 10th, 50th, and 90th percentiles of each metal value, and the 25th percentiles of each metal were set as the corresponding reference value. We also used multiple linear regression models to evaluate the associations between urinary metals and SUA levels.
Generalized linear model (GLM) was used to evaluate the additive interaction of urinary metals on the risk of HUA. Individuals were classified into high (≥ median) and low (<median) subgroups based on urinary metals values. Relative excess risk due to interaction (RERI), attributable proportion due to interaction (AP), and synergy index (S) were used to assess the additive interaction between urinary metals concentrations and HUA risk (29). A regression tree is a machine-learning algorithm known to detect multiple interactions between covariates (30). We used a regression tree to explore multiple interactions between urinary metals and SUA levels.
Subgroup analyses of age, gender, BMI, hypertension, diabetes, or hyperlipidemia were conducted. Individuals were divided into high- and low-metal subgroups according to urinary median values (log10-transformed) of urinary metals. The interaction was examined by adding an interaction term between a specific metal and the stratification variable and adjusted for the same confounders in unconditional logistic regression models. All data were analyzed using Statistical Program for Social Sciences 17.0 (SPSS Inc., Chicago, Illinois, USA). LASSO regression analysis was performed with R 4.2 (Lucent Technologies, USA) “glmnet” package. RCS analysis was conducted using SAS 9.2 (SAS Institute Inc., Cary, North Carolina, USA) (RCS_Reg macro) (31). Statistical significance was defined as a P-value of < 0.05 (two-tailed).
Results
Participants characteristics
As shown in Table 1, among the 6,508 participants, 2,731 were men and 3,777 were women, and 4,147 were in the non-HUA subgroup and 2,361 were in the HUA subgroup. When compared with individuals in the non-HUA subgroup, those in the HUA subgroup had lower urinary levels of lithium, V, Cr, Fe, Ni, strontium, or Mo as well as higher urinary levels of Zn or As (all P < 0.05). As shown in Supplementary Figure 1, Spearman correlation analysis revealed the correlations among 21 metals with each other (all P < 0.05), wherein Se showed a strong correlation with titanium, Zn, As, rubidium, and Mo (the corresponding correlation coefficients: 0.76, 0.71, 0.76, 0.74, and 0.74, all P < 0.05). However, the correlation of V with Al was weak (correlation coefficient: 0.13, P < 0.05).
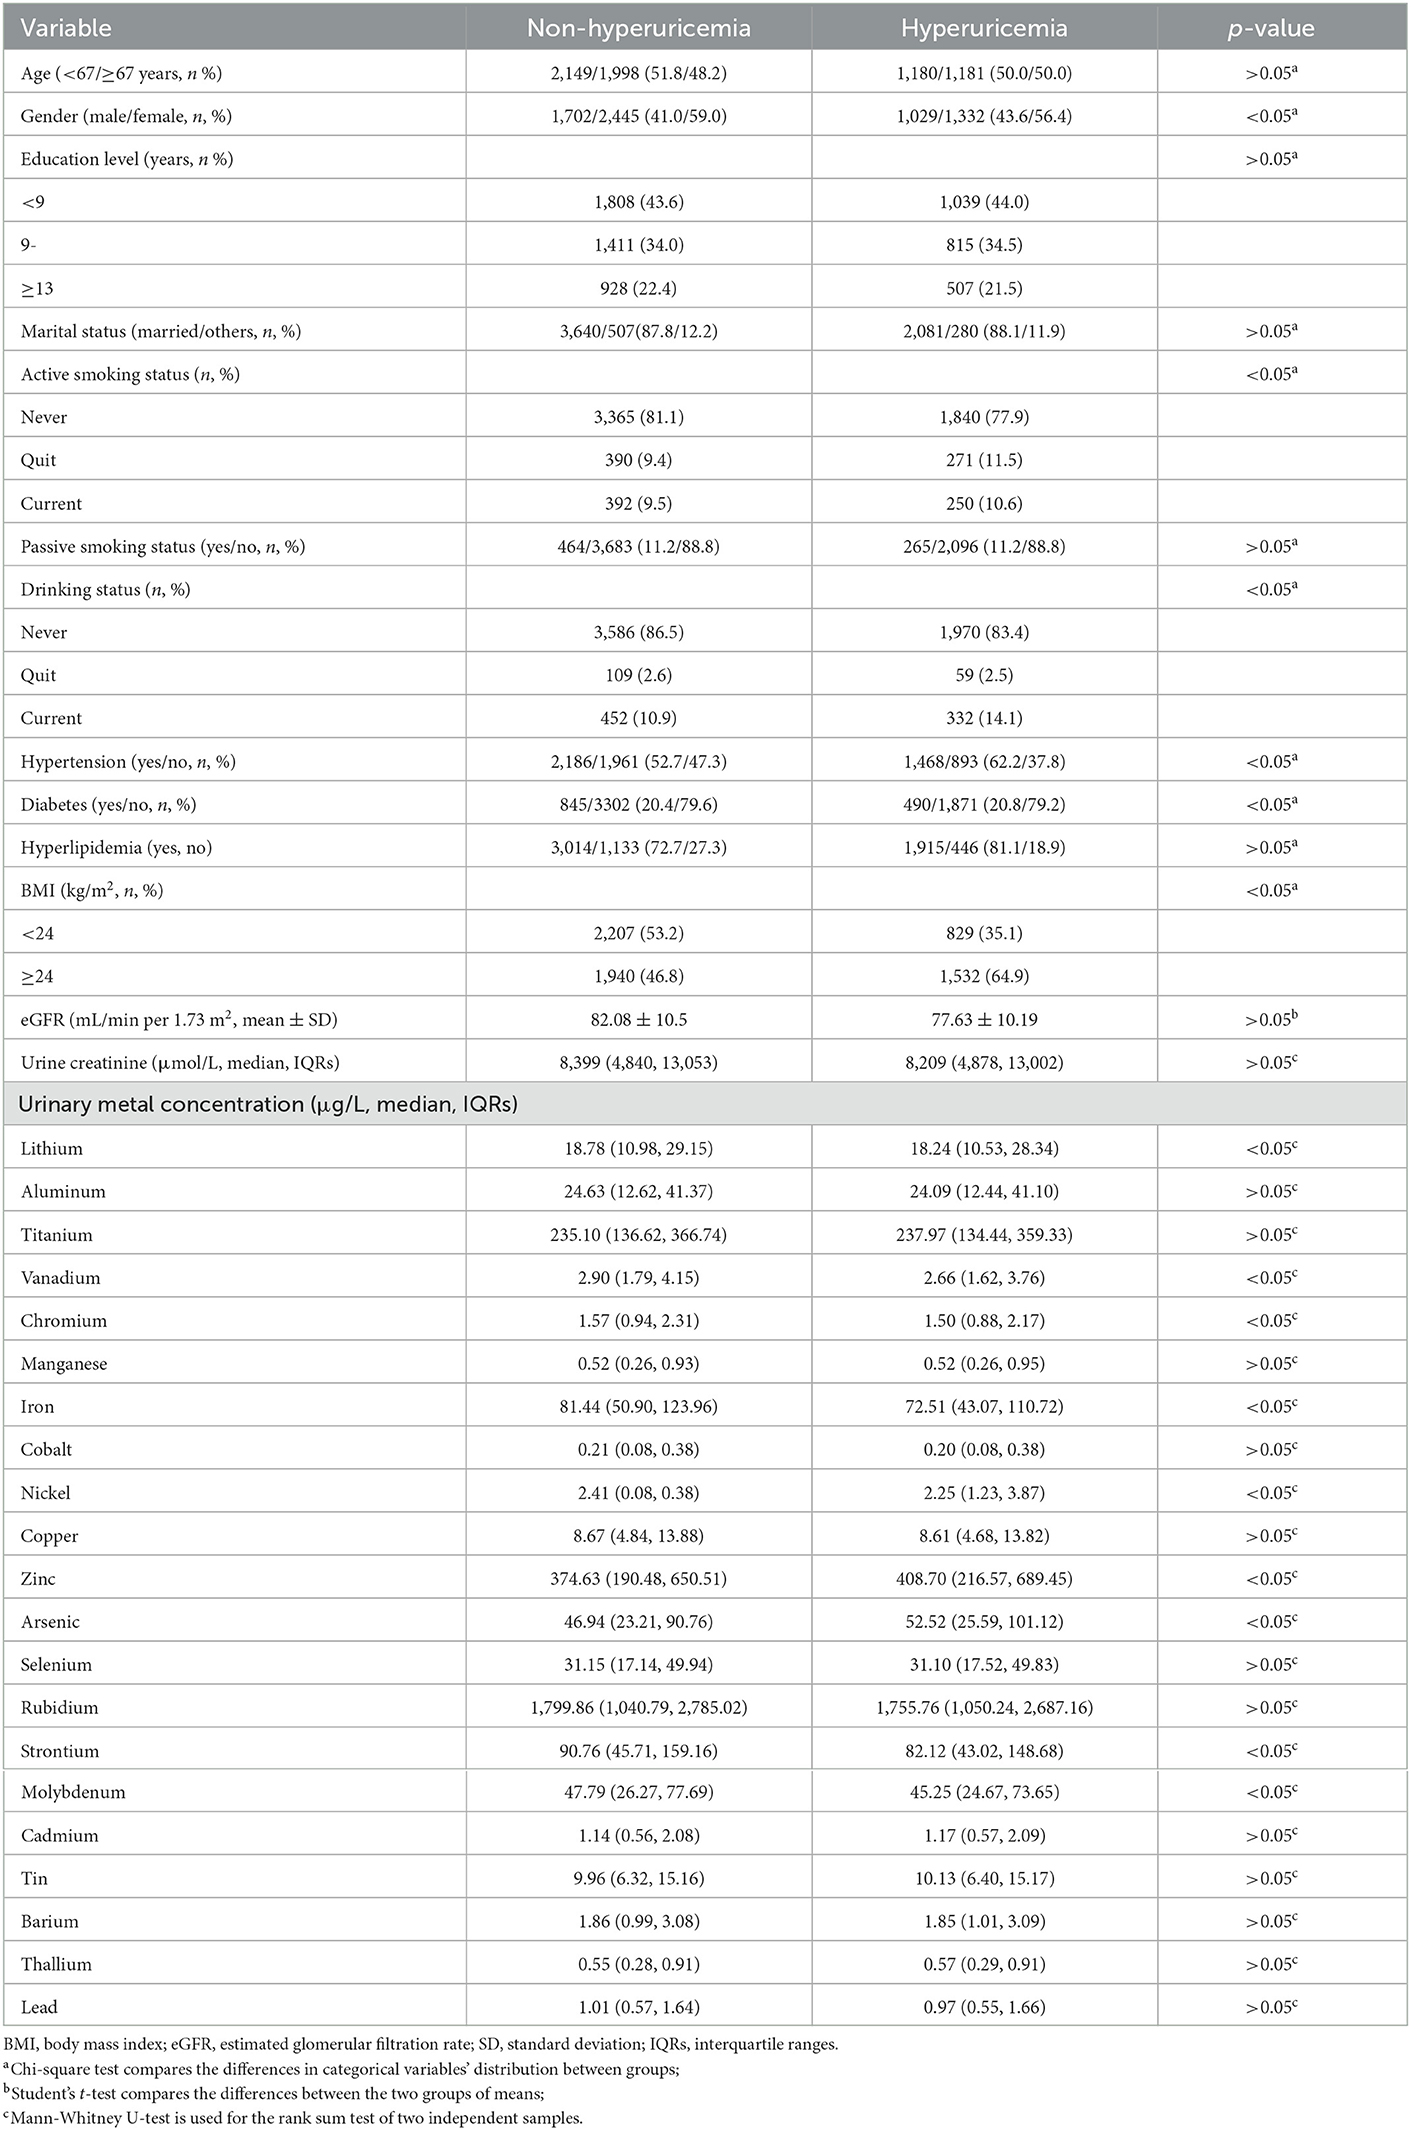
Table 1. Characteristics and urinary metal concentrations of the study population.
Urinary levels of individual metals and HUA risk
As shown in Supplementary Table 2, unconditional logistic regression models suggested the association between urinary V (OR = 0.67, 95%CI: 0.57–0.78), Cr (OR = 0.78, 95%CI: 0.66–0.92), Fe (OR = 0.64, 95%CI: 0.55–0.75), Ni (OR = 0.81, 95%CI: 0.68–0.95), Zn (OR = 1.36, 95%CI: 1.14–1.63), and As levels (OR = 1.46, 95%CI: 1.23–1.72) and HUA risk (all Ptrend < 0.05), after adjusting for potential confounders (age, gender, education level, marital status, active smoking status, passive smoking status, drinking status, hypertension, diabetes, hyperlipidemia, BMI, eGFR, and urine creatinine). As shown in Supplementary Figure 2, LASSO regression determined the optimal λ (−4.50) through 10-fold cross-validation based on the minimum MSE. After adjusting for the same confounders in unconditional logistic regression models, urinary metals, V, Fe, Ni, Zn, As, and Mo, were selected as optimal predictors according to LASSO regression models. As shown in Figure 1, we incorporated V, Cr, Fe, Ni, Zn, As, and Mo into the unconditional stepwise logistic regression models, after adjusting for the same confounders in unconditional logistic regression models and found that urinary V (OR = 0.70, 95%CI: 0.58–0.84), Fe (OR = 0.56, 95%CI: 0.47–0.68), and Ni (OR = 0.71, 95%CI: 0.58–0.86) levels were negatively associated with HUA risk (all Ptrend < 0.05), but urinary Zn (OR = 1.92, 95%CI: 1.54–2.39) and As levels (OR = 1.75, 95%CI: 1.45–2.11) were positively associated with HUA risk (all Ptrend < 0.05). As shown in Figure 2, multiple linear regression models showed a lower SUA level of 34.27 (95%CI: −41.32 to −27.22) for a 1-SD increment in log-transformed Fe and a higher SUA level of 34.58 (27.67–41.48) for a 1-SD increment in log-transformed Zn (P < 0.001).
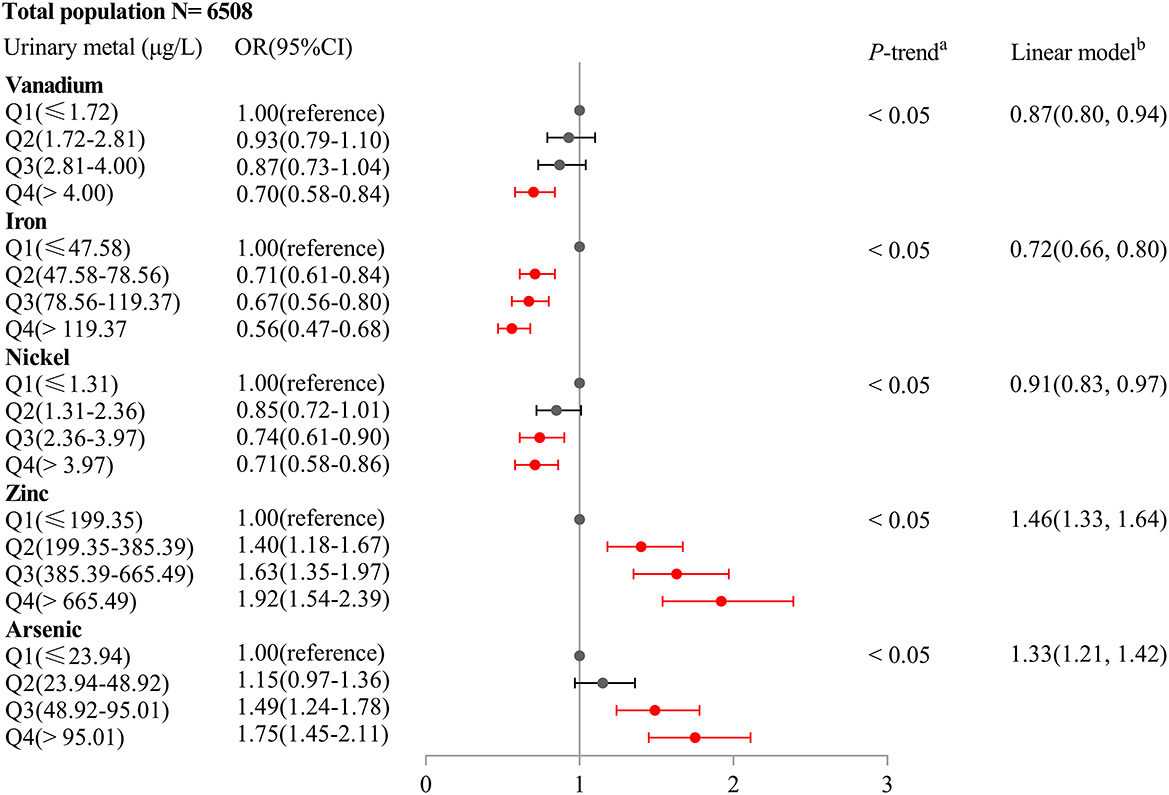
Figure 1. Association of an IQR increase in urinary metal concentrations of vanadium, iron, nickel, zinc, and arsenic with hyperuricemia risk (Odds ratio and 95% confidence interval). Unconditional stepwise logistic regression models were performed and adjusted for age, gender, education level, marital status, active smoking status, passive smoking status, drinking status, hypertension, diabetes, hyperlipidemia, BMI, eGFR, and urine creatinine.
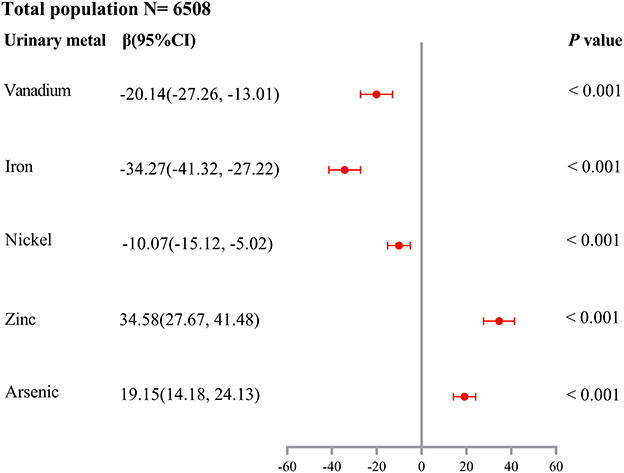
Figure 2. Association of a 1-SD increase in log-transformed urinary metal concentrations of vanadium, iron, nickel, zinc, and arsenic with SUA levels (β and 95% confidence interval). Multiple linear regression models were performed and adjusted for age, gender, education level, marital status, active smoking status, passive smoking status, drinking status, hypertension, diabetes, hyperlipidemia, BMI, eGFR, and urine creatinine.
As shown in Table 2, we found that Fe was negatively associated with HUA risk in all subgroups (all Ptrend < 0.05). We also found positive associations between the highest quartile (the 75th quartile) of urinary Zn levels and HUA risk in the subgroups of gender, age, BMI, hypertension, diabetes (no), and hyperlipidemia (yes) (all Ptrend < 0.05).
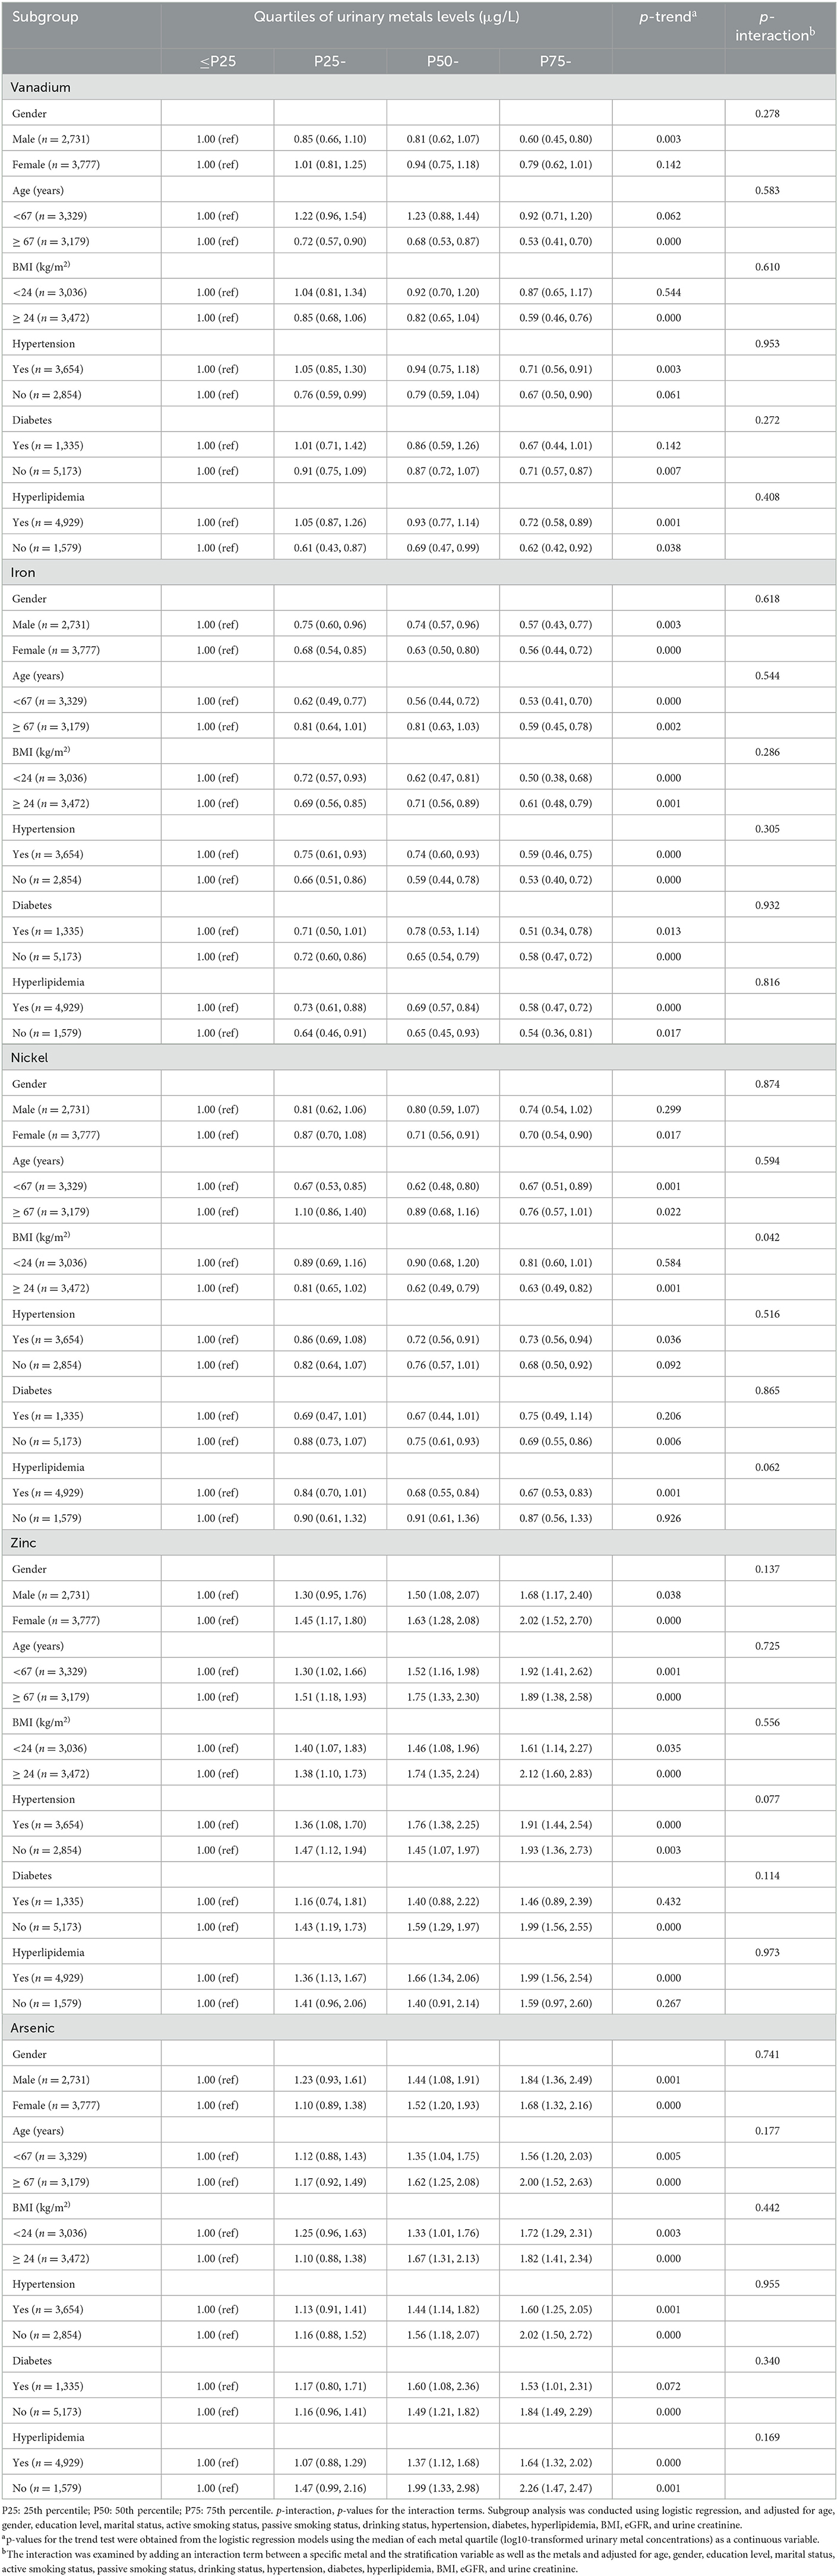
Table 2. Subgroup analysis of urinary metal vanadium, iron, nickel, zinc, and arsenic with hyperuricemia risk (OR, 95% CI).
Dose–response relationship of urinary metals with HUA risk
As shown in Figure 3, after adjusting for the same confounders in unconditional logistic regression models, RCS logistic regression models showed that there was a negative non-linear dose–response relationship between urinary V levels and HUA risk (Poverall < 0.001, Pnonliner = 0.008), but a negative linear dose–response relationship between both urinary Fe (Poverall < 0.001, Pnonliner = 0.682) and Ni levels (Poverall = 0.009, Pnonliner = 0.953) and HUA risk. A positive linear relationship was found between urinary Zn (Poverall < 0.001, Pnonliner = 0.513), or As levels (Poverall < 0.001, Pnonliner = 0.743) and HUA risk.
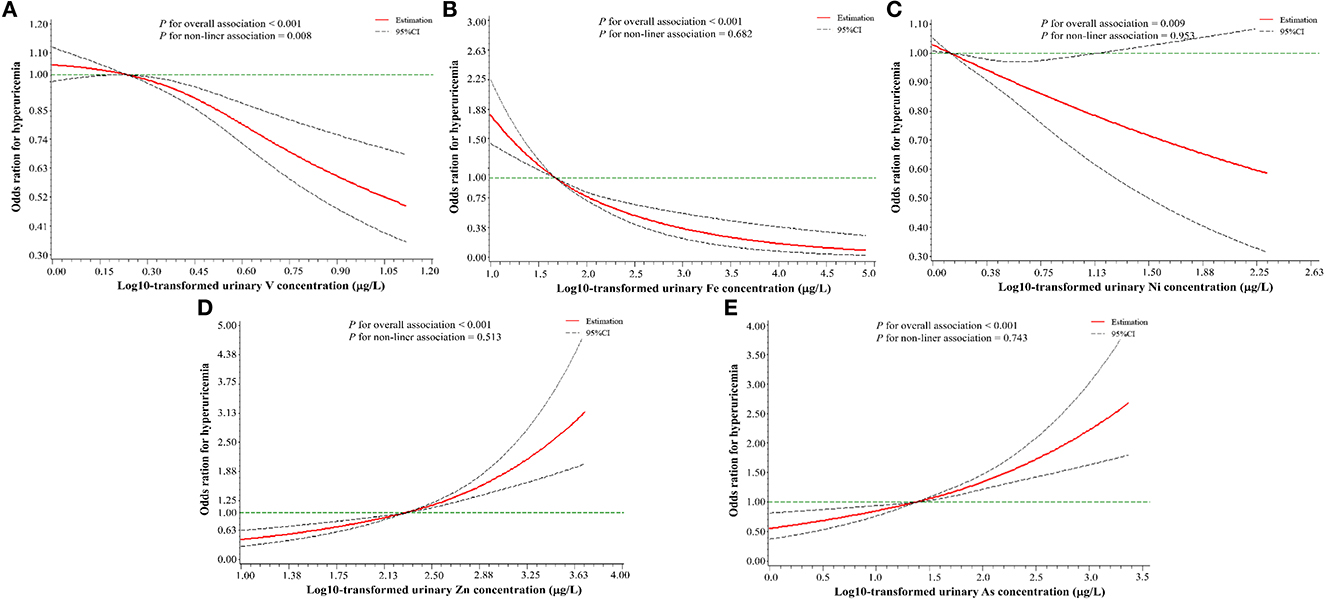
Figure 3. A restricted cubic spline regression model with three knots (the 10th, 50th, and 90th percentile) for urinary metals levels and hyperuricemia risk. (A) V (vanadium); (B) Fe (iron); (C) Ni (nickel); (D) Zn (zinc); (E) As (arsenic). The X-axis indicates the log10-transformed urinary metal concentrations. Odds ratios (OR) and 95% confidence intervals were estimated, and metal concentrations (log10-transformed) at the 25th percentile were used as the reference value. All of the restricted cubic spline regression models were constructed after adjusting for age, gender, education level, marital status, active smoking status, passive smoking status, drinking status, hypertension, diabetes, hyperlipidemia, BMI, eGFR, and urine creatinine.
Effect of additive interaction of Fe and Zn on HUA risk
As shown in Table 3, GLM showed an additive interaction between urinary low-Fe (<78.56 μg/L) and high-Zn (≥ 385.39 μg/L) levels on an increased risk of HUA (RERI = 0.31, 95%CI: 0.03–0.59; AP = 0.18, 95%CI: 0.02–0.34; S = 1.76, 95%CI: 1.69–3.49). However, no interaction between the other metals on HUA risk was found. As shown in Figure 4, the regression tree showed urinary Zn levels of ≥ 312.33 μg/L and urinary Fe levels of <102.25 were likely to have the highest concentrations of SUA (Node 7).
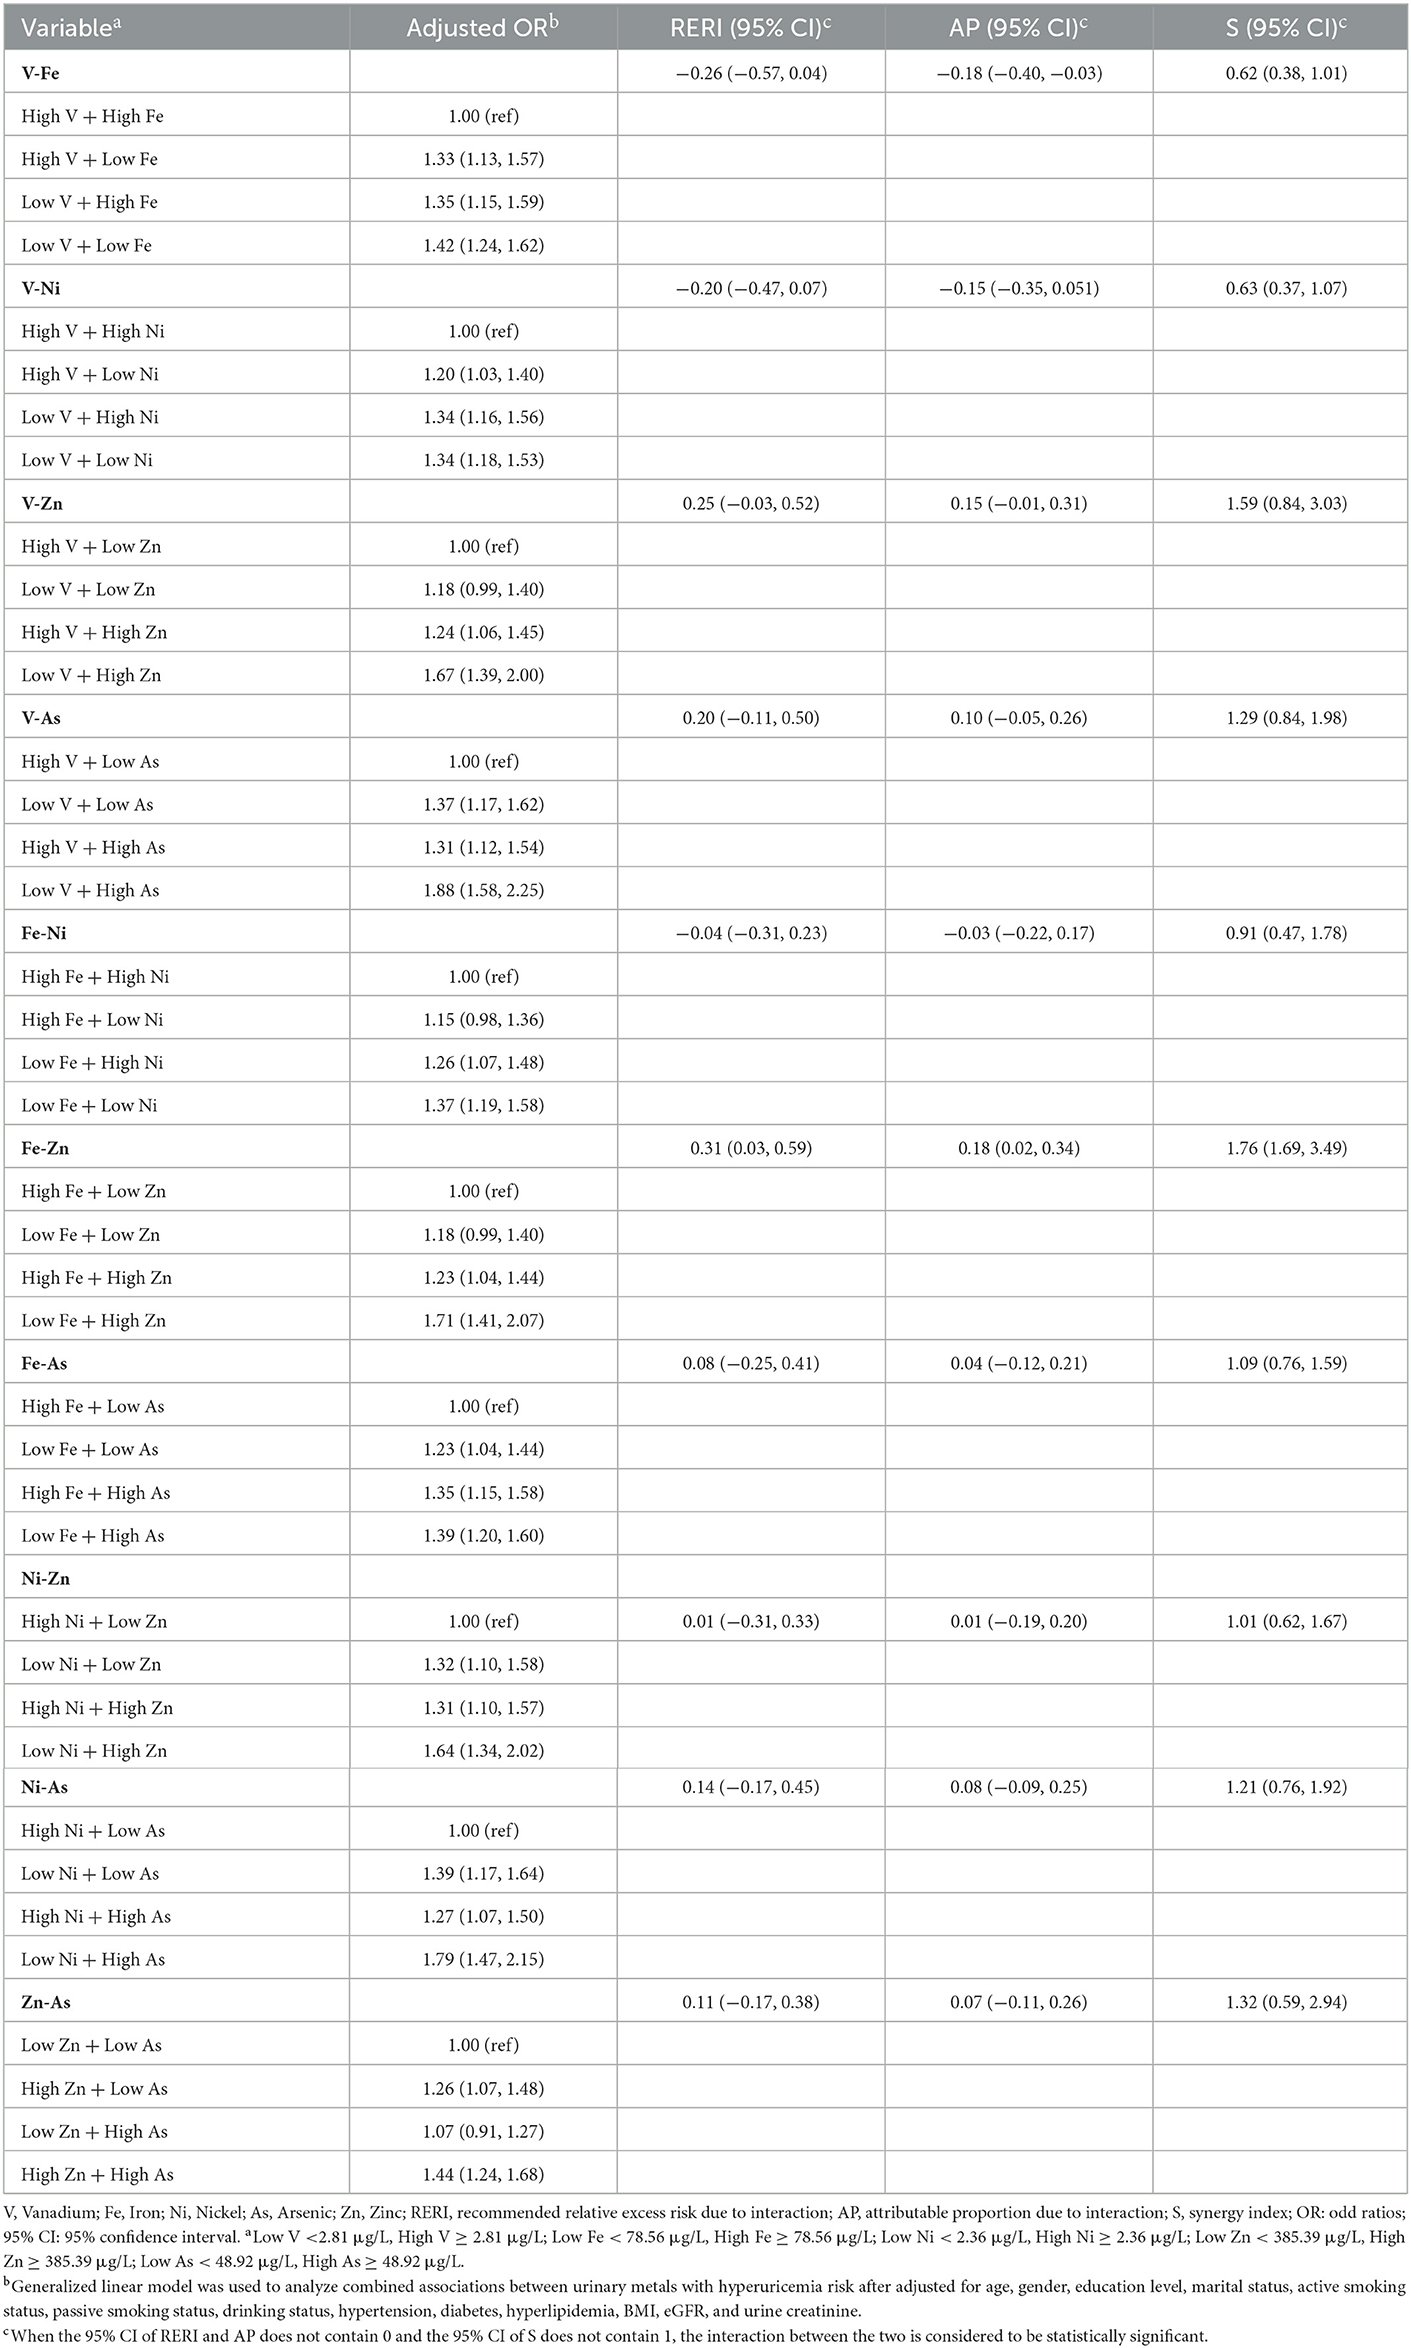
Table 3. Combined associations of urinary metals with hyperuricemia risk (OR, 95% CI).
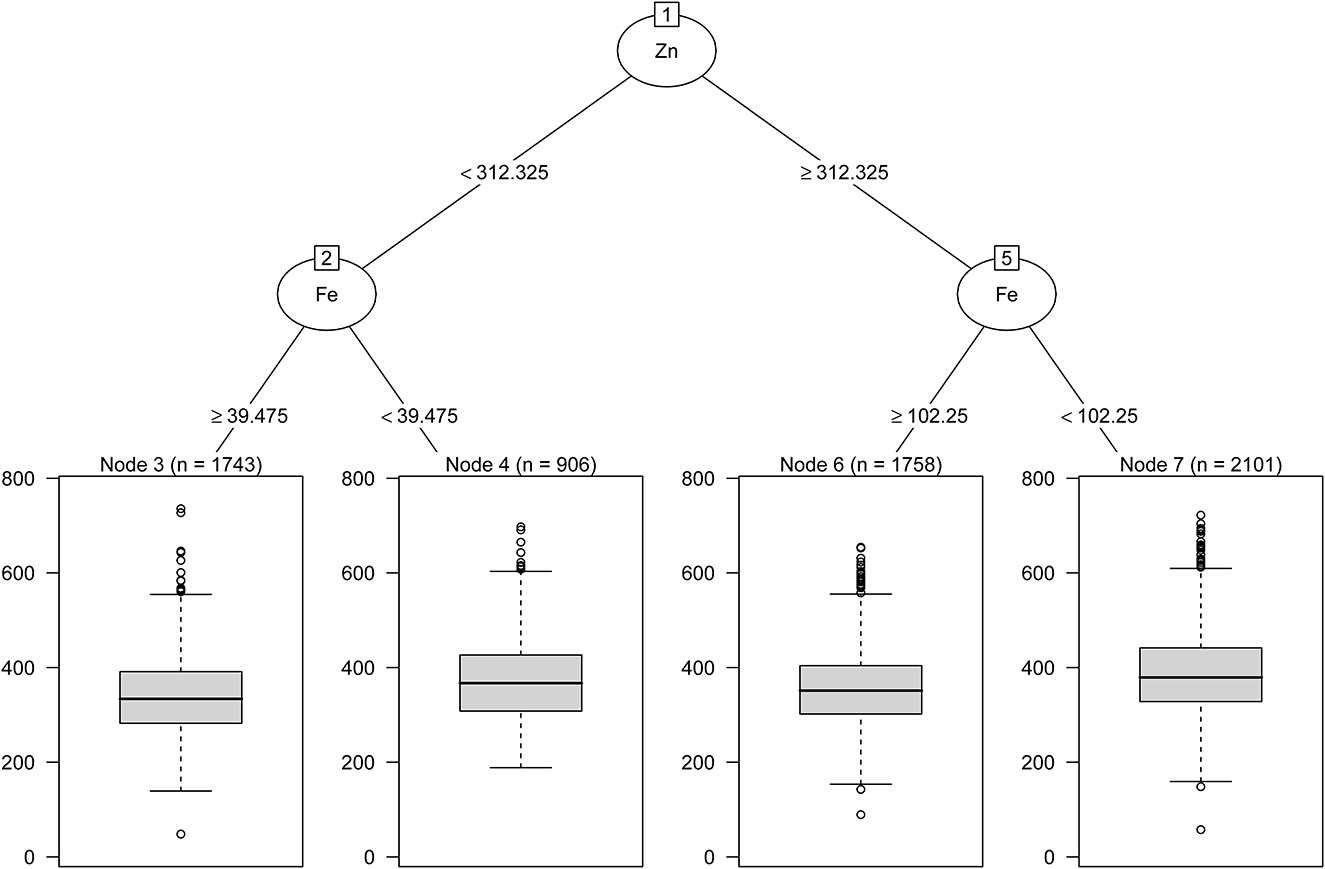
Figure 4. Combined associations between urinary metal levels and SUA concentrations performed with regression tree.
Discussion
We found that higher urinary V, Fe, and Ni levels were linked to a lower risk of HUA in addition to the positive association of urinary Zn and As levels with HUA risk. Moreover, the additive interaction between low-iron (<78.56 μg/L) and high-zinc (≥385.39 μg/L) levels greatly increased the risk of HUA in elderly adults.
We also found that the median urinary level of As was 48.92 μg/L, which was 5.9-fold higher than that of individuals aged >20 years (n = 5,632) from the NHANES 2003–2010 (14) and 3.2-fold higher than that of individuals aged 44.9–56.0 years (n = 1,335) from the Study of Women's Health Across the Nation (32). In addition, median urinary V levels (2.81 μg/L) of the individuals were 1.9-fold higher than that of older adults aged >60 years (n = 3,814) in Anhui province, China (33). In addition, median urinary levels of Fe (78.56 μg/L) or Zn (385.39 μg/L) levels were higher than that (n = 3,272, 54.67 μg/L for Fe, 310.94 μg/L for Zn) of individuals from the Wuhan-Zhuhai cohort (34). The reasons may be related to gender, age, region, environmental exposure, lifestyle, and population size. In the present study, older adults (aged ≥60 years) who have lived in Shenzhen since the early stage of the city's construction tend to have had a longer exposure to metals in the environment and seafood because Shenzhen is a coastal city in South China.
Previous studies revealed consistent results to support the positive association between blood Fe concentrations and HUA risk. For example, a cross-sectional and longitudinal study in the employees of Zhenhai Refining and Chemical Company, Ningbo, China (n = 10,074) (35) indicated that exposure to high serum ferritin (SF) levels was linked to an increased risk of HUA (HR = 1.65, 95%CI: 1.38–1.96) after adjusting for age and gender. Results from the 2009 China Health and Nutrition Study (n = 7,946) (36) revealed that individuals with the highest quartile (the 75th quartile: 237.8 μg/L) of SF levels were at higher risk for HUA (OR = 3.09, 95%CI: 2.45–3.89), as compared with those in the lowest quartile (the 25th quartile: 20.3 μg/L). A recent study conducted in Xiangya Hospital, Central South University, Changsha, China (37) reported a link between serum Fe (OR = 1.56, 95%CI: 1.14– 2.13) or SF (OR = 2.25, 95%CI: 1.54–3.29) concentrations and the prevalence of HUA in adults (n = 2,824, aged 52.2 ± 7.2 years); however, we found a negative association between urinary Fe levels and HUA risk, which may be due to a difference in biological significances between urinary Fe and blood Fe concentrations. Because urinary Fe concentrations generally represent the levels of Fe in the mucosal cells of the urinary tract and the circulating Fe (transfer Fe protein) (38). When blood Fe concentration is too high, oxidative damage to the renal tubules can be induced, resulting in decreased renal tubular reabsorption of transferrin and UA, increased excretions of UA and urinary iron, and decreased SUA levels (39, 40). A recent study on multiple metals (13 blood metals) exposure and HUA risk from Shenzhen city, China (n = 1,406, aged from 31 to 91 years) (15) reported that there was no association between plasma Fe levels and HUA risk (median of plasma Fe level: non-HUA = 1,697.50 μmol/L, HUA = 1,697.48 μmol/L). The reason may be that the interactions of multiple metals may weaken the effect of plasma Fe on HUA. The association between Fe exposure and HUA was related to several factors, including detected concentrations of Fe in different biological samples, regions, and species.
Some controversial results about the relationship between Zn levels (plasma Zn or dietary Zn intake) and HUA risk have been reported in previous studies (15, 41, 42). We found a positive linear dose–response relationship between urinary Zn levels with HUA risk, which is inconsistent with the previous findings that dietary Zn intake was inversely linked to HUA risk (41, 42). In the individuals (n = 24,975, aged ≥ 20 years) from the NHANES 2001–2014, dietary Zn intake was found to be inversely correlated with HUA risk (41), the same finding was found in adults (n = 5,168, aged ≥ 40 years) from the Department of Health Examination Center, Xiangya Hospital, Changsha, China (42). We note the consistent finding of a positive correlation between Zn exposure and HUA risk after comparing the findings in a multiple-metal exposure study (n = 1,406, mean age: 58.89 ± 9.54 years) on plasma Zn (15) and this study; both studies were conducted in older adults in Shenzhen, China. Nevertheless, there were differences in the types of metals (13 metals vs. 21 metals), biological samples (plasma or urinary), and measurement methods for Zn concentrations in the individuals. Lack of zinc will lead to cardiovascular disease, growth restriction, and increased cancer susceptibility (43), while excessive zinc can produce toxic effects (44, 45). We suppose that if there is an appropriate dose of zinc concentrations, deficiency or excess will be caused varying degrees of hazards. The elderly in coastal cities from southern China may have excessive zinc due to environmental exposure and seafood diets. In addition, the interactions of multiple metals may enhance the risk of Zn to HUA. Overall, the relationship between Zn and HUA risk is still inconclusive, and further studies are needed to validate this finding.
Subgroup analysis suggested that individuals with BMI (≥24), hyperlipidemia (yes), and urinary Zn (≥385.39 μg/L) were at higher risk of HUA. The reasons for this may be that Zn transporters are differentially expressed in various tissues of the body, and obesity and other diseases can increase the accumulation of Zn in adipose tissue (one of the most important Zn sources) and can reduce the Zn concentration in blood (46). A recent study at Yaroslavl State University, Yaroslavl, Russia (n = 395, aged from 20 to 60 years) (47) indicated that urine Zn levels in obese individuals (n = 196) were 18% higher than that in lean individuals (n = 199). In obese individuals, the internal balance of plasma Zn and the process of muscle metabolism may be changed, leading to increased excretion of Zn by urine (48).
We revealed the additive interaction between urinary low-Fe (<78.56 μg/L) and high-Zn (≥385.39 μg/L) levels on the risk of HUA, but previous studies on this were very limited. The interaction between Fe and Zn in the human body absorption process has been widely studied, but the results were inconsistent. Previous studies suggested that the absorptions of Fe and Zn exhibit a competitive inhibition (49, 50). Solomons and Jacob performed a study on assessing iron–zinc interaction with the increasing proportion of Fe and Zn in cola beverage (the ratios of Fe:Zn were 1:1, 2:1, and 3:1) (49), and the results showed that plasma Zn concentrations were decreased. A community-based randomized controlled trial in Indonesia explored the interactions between Fe and Zn in infants (50), and they found that the combination of iron–zinc supplements was not as effective as a single supplement. Additional studies have found a positive interaction between Fe and Zn in human absorption (51–53). A 6-month randomized, double-blind trial investigated the effect of Zn supplementation on the biochemical status of Fe in individuals aged 55–75 (n = 188) and 70–85 (n = 199) years old (51), suggesting that 15 or 30 mg/d Zn supplementation significantly increased serum Zn levels and urinary Zn excretion, but had no effect on Fe status. A randomized single-blind placebo-controlled trial of pregnant women in the United Kingdom (52) indicated that dietary Fe supplementation (100 mg Fe/d) had no detectable adverse effect on Zn metabolism and increased Zn absorption efficiency in late pregnancy. A randomized controlled trial in Bangladesh reported that the combination of Fe and Zn had the same effect as single administration on reducing diarrhea, hospitalization, or improving Fe status (53). Animal experiments indicated that the interactions between Fe and Zn may depend on their ratios. For instance, no significant inhibition of Zn absorption was found in the digestion and absorption of Zn sulfate (100 μmol/L) in rats (ranging from 0 to 1,000 μmol Fe/L) in the presence of Fe gluconate when the ratio of Fe to Zn was <2:1, and dose-dependent inhibition of Zn absorption between 2:1 and 5:1 reached a plateau beyond this ratio (54). Based on urinary Zn levels, we have two hypotheses. One is Zn deficiency (55): the absorption of Fe in the body also inhibits the absorption of Zn, and the content of Zn excreted in urine increases. In addition, the study population was over 60 years old, and the reduction of Fe accumulation and Zn absorption due to aging may be associated with HUA risk (56). The other hypothesis is that there was excess Zn (57). The study population is located in the coastal areas, the intake of zinc-rich seafood is higher, and the antagonism of the Fe and Zn interaction is much smaller with the increased Zn intake. However, the current research on the iron–zinc interaction and the risk of HUA is very limited, further mechanistic studies are needed regarding the effect of iron-zinc interaction on HUA risk.
There are several strengths in this study. First, we explored the association between urinary multi-metal levels and HUA risk in a large sample size (n = 6,508) after adjusting for the traditional confounding factors such as gender, age, BMI, hypertension, and diabetes. Second, we used both LASSO regression and logistics regression for metal selection and RCS logistic regression and GLM for assessing the dose–response relationship and interactions between urinary metals and HUA risk. However, there are still some limitations in this study. First, we did not assess the dietary exposure of individuals, whereas dietary intake is an important factor related to metal exposure in the body. Second, we only detected urinary metal concentrations, which is a limitation in assessing metal exposure of the body, because day-to-day variability of urinary metals concentrations and creatinine excretion of the body can result in measurement errors. But, it cannot deny the role of urinary sample, because of the high amount of metal excretion via urine, and non-invasive and convenience in collection of urine sample. Finally, the cross-sectional study is unable to identify the causal relationship between multiple metals exposure levels of the body and HUA. Further prospective studies are needed to validate the findings.
Conclusion
We found a negative association between higher levels of urinary V, Fe, and Ni and HUA risk and a positive association between urinary Zn and As and HUA risk. Additive interaction of low-Fe (<78.56 μg/L) and high-Zn (≥385.39 μg/L) levels are related to a higher risk of HUA. The findings indicated the potential importance of Zn and Fe exposure in the body in the prevention of elevated SUA levels and HUA risk.
Data availability statement
The raw data supporting the conclusions of this article will be made available by the authors, without undue reservation.
Ethics statement
The studies involving human participants were reviewed and approved by the research protocol was approved by the Medical Ethics Research Committee of Shenzhen Center for Disease Control and Prevention (approval numbers: R2017001 and R2018020). The patients/participants provided their written informed consent to participate in this study.
Author contributions
CH and EG: conceptualization and methodology. CH, EG, JL, WL, and YL: formal analysis. XR and QW: data curation. CH, EG, and FX: writing—original draft preparation. CH and JL: writing—review and editing. DW and QS: supervision. XC and KH: project administration. HH and JL: funding acquisition. All authors have read and agreed to the published version of the manuscript.
Funding
This work was supported by Shenzhen Basic Research Key Project (JCYJ20200109143431341), Shenzhen Basic Research Project (JCYJ20190807103401672), Shenzhen Key Medical Discipline Construction Fund (SZXK069), and Sanming Project of Medicine in Shenzhen (SZSM201611090).
Conflict of interest
The authors declare that the research was conducted in the absence of any commercial or financial relationships that could be construed as a potential conflict of interest.
Publisher's note
All claims expressed in this article are solely those of the authors and do not necessarily represent those of their affiliated organizations, or those of the publisher, the editors and the reviewers. Any product that may be evaluated in this article, or claim that may be made by its manufacturer, is not guaranteed or endorsed by the publisher.
Supplementary material
The Supplementary Material for this article can be found online at: https://www.frontiersin.org/articles/10.3389/fpubh.2023.1015202/full#supplementary-material
References
1. Obermayr RP, Temml C, Gutjahr G, Knechtelsdorfer M, Oberbauer R, Klauser-Braun R. Elevated uric acid increases the risk for kidney disease. J Am Soc Nephro. (2008) 19:2407–13. doi: 10.1681/ASN.2008010080
2. Borghi C, Rosei EA, Bardin T, Dawson J, Dominiczak A, Kielstein JT, et al. Serum uric acid and the risk of cardiovascular and renal disease. J Hypertens. (2015) 33:1729–41. doi: 10.1097/HJH.0000000000000701
3. Liu R, Han C, Wu D, Xia X, Gu J, Guan H, et al. Prevalence of hyperuricemia and gout in Mainland China from 2000 to 2014: a systematic review and meta-analysis. Biomed Res Int. (2015) 2015:762820. doi: 10.1155/2015/762820
4. Wang R, Tang Z, Sun F, Diao L. Prevalence of hyperuricemia in the elderly in 7 areas of China. Zhonghua liu xing bing xue za zhi. (2018) 39:286–8. doi: 10.3760/cma.j.issn.0254-6450.2018.03.007
5. Zhang Y, Nie FQ, Huang XB, Tang W, Hu R, Zhang WQ, et al. High prevalence and low awareness of hyperuricemia in hypertensive patients among adults aged 50-79 years in Southwest China. BMC Cardiovasc Disord. (2022) 22:2. doi: 10.1186/s12872-021-02427-2
6. Chen WY, Fu YP, Zhou M. The bidirectional relationship between metabolic syndrome and hyperuricemia in China: a longitudinal study from CHARLS. Endocrine. (2022) 76:62–9. doi: 10.1007/s12020-022-02979-z
7. Li L, Ma Y, Shang XM, Hong Y, Wang JH, Tan Z, et al. Hyperuricemia is associated with short-term outcomes in elderly patients with acute myocardial infarction. Aging Clin Exp Res. (2018) 30:1211–5. doi: 10.1007/s40520-018-0903-3
8. Kim J, Byun M, Yi D, Lee J, Jeon S, Ko K, et al. Serum uric acid, Alzheimer-related brain changes, and cognitive impairment. Front Aging Neurosci. (2020) 12:160. doi: 10.3389/fnagi.2020.00160
9. Degli Esposti L, Desideri G, Saragoni S, Buda S, Pontremoli R, Borghi C. Hyperuricemia is associated with increased hospitalization risk and healthcare costs: evidence from an administrative database in Italy. Nutr Metab Cardiovasc Dis. (2016) 26:951–61. doi: 10.1016/j.numecd.2016.06.008
10. Al Osman M, Yang F, Massey IY. Exposure routes and health effects of heavy metals on children. Biometals. (2019) 32:563–73. doi: 10.1007/s10534-019-00193-5
11. Chowdhury R, Ramond A, O'Keeffe LM, Shahzad S, Kunutsor SK, Muka T, et al. Environmental toxic metal contaminants and risk of cardiovascular disease: systematic review and meta-analysis. BMJ. (2018) 362:k3310. doi: 10.1136/bmj.k3310
12. Wang Z, Yang C. Metal carcinogen exposure induces cancer stem cell-like property through epigenetic reprograming. A novel mechanism of metal carcinogenesis. Semin Cancer Biol. (2019) 57:95–104. doi: 10.1016/j.semcancer.2019.01.002
13. Sanders AP, Mazzella MJ, Malin AJ, Hair GM, Busgang SA, Saland JM, et al. Combined exposure to lead, cadmium, mercury, and arsenic and kidney health in adolescents age 12-19 in NHANES 2009-2014. Environ Int. (2019) 131:104993. doi: 10.1016/j.envint.2019.104993
14. Kuo CC, Weaver V, Fadrowski JJ, Lin YS, Guallar E, Navas-Acien A. Arsenic exposure, hyperuricemia, and gout in US adults. Environ Int. (2015) 76:32–40. doi: 10.1016/j.envint.2014.11.015
15. Wang T, Lv Z, Wen Y, Zou X, Zhou G, Cheng J, et al. Associations of plasma multiple metals with risk of hyperuricemia: a cross-sectional study in a mid-aged and older population of China. Chemosphere. (2021) 287:132305. doi: 10.1016/j.chemosphere.2021.132305
16. Jiang T, Xie D, Wu J, He H, Wang H, Wang N, et al. Association between serum copper levels and prevalence of hyperuricemia: a cross-sectional study. Sci Rep. (2020) 10:8687. doi: 10.1038/s41598-020-65639-0
17. Dai H, Huang Z, Deng Q, Li Y, Xiao T, Ning X, et al. The effects of lead exposure on serum uric acid and hyperuricemia in Chinese adults: a cross-sectional study. Int J Environ Res Public Health. (2015) 12:9672–82. doi: 10.3390/ijerph120809672
18. Xiao L, Zan G, Qin J, Wei X, Lu G, Li X, et al. Combined exposure to multiple metals and cognitive function in older adults. Ecotoxicol Environ Saf. (2021) 222:112465. doi: 10.1016/j.ecoenv.2021.112465
19. Huang S, Zhong D, Lv Z, Cheng J, Zou X, Wang T, et al. Associations of multiple plasma metals with the risk of metabolic syndrome: a cross-sectional study in the mid-aged and older population of China. Ecotoxicol Environ Saf. (2022) 231:113183. doi: 10.1016/j.ecoenv.2022.113183
20. Braun J, Gennings C, Hauser R, Webster T. What can epidemiological studies tell us about the impact of chemical mixtures on human health? Environ Health Perspect. (2016) 124:A6–9. doi: 10.1289/ehp.1510569
21. Wei MH, Cui Y, Zhou HL, Song WJ, Di DS, Zhang RY, et al. Associations of multiple metals with bone mineral density: a population-based study in US adults. Chemosphere. (2021) 282:131150. doi: 10.1016/j.chemosphere.2021.131150
22. Yuan Y, Long P, Liu K, Xiao Y, He S, Li J, et al. Multiple plasma metals, genetic risk and serum C-reactive protein: A metal-metal and gene-metal interaction study. Redox Biol. (2020) 29:101404. doi: 10.1016/j.redox.2019.101404
23. Castiello F, Olmedo P, Gil F, Molina M, Mundo A, Romero RR, et al. Association of urinary metal concentrations with blood pressure and serum hormones in Spanish male adolescents. Environ Res. (2020) 182:108958. doi: 10.1016/j.envres.2019.108958
24. Nordberg GF, Nogawa K, Nordberg M, Friberg LT. CHAPTER 23 - Cadmium. In:GF Nordberg, BA Fowler, M Nordberg, LT Friberg, , eds. Handbook on the Toxicology of Metals (Third Edition). Academic Press, Burlington (2007). doi: 10.1016/B978-012369413-3/50078-1
25. Deng Q, Dai X, Feng W, Huang S, Yuan Y, Xiao Y, et al. Co-exposure to metals and polycyclic aromatic hydrocarbons, microRNA expression, and early health damage in coke oven workers. Environ Int. (2019) 122:369–80. doi: 10.1016/j.envint.2018.11.056
26. Liu L, Liu W, Nie L, Guo Z, Luo Y, Chen W, et al. Study design and baseline characteristics of Shenzhen ageing-related disorder cohort in China. BMJ Open. (2020) 10:e034317. doi: 10.1136/bmjopen-2019-034317
27. Wei C, Li T, Xuan X, Hu H, Xiao X, Li J. Serum albumin predicts hyperuricemia in patients with idiopathic membranous nephropathy. Clin Nephrol. (2021) 96:191–8. doi: 10.5414/CN110524
28. Levey AS, Stevens LA, Schmid CH, Zhang Y, Castro III AF, Feldman HI, et al. A new equation to estimate glomerular filtration rate. Ann Intern Med. (2009) 150:604–12. doi: 10.7326/0003-4819-150-9-200905050-00006
29. Hosmer DW, Lemeshow S. Confidence interval estimation of interaction. Epidemiology. (1992) 3:452–6. doi: 10.1097/00001648-199209000-00012
30. Strobl C, Malley J, Tutz G. An introduction to recursive partitioning: rationale, application, and characteristics of classification and regression trees, bagging, and random forests. Psychol Methods. (2009) 14:323–48. doi: 10.1037/a0016973
31. Desquilbet L, Mariotti F. Dose-response analyses using restricted cubic spline functions in public health research. Stat Med. (2010) 29:1037–57. doi: 10.1002/sim.3841
32. Wang X, Mukherjee B, Batterman S, Harlow SD, Park SK. Urinary metals and metal mixtures in midlife women: the study of Women's Health Across the Nation (SWAN). Int J Hyg Environ Health. (2019) 222:778–89. doi: 10.1016/j.ijheh.2019.05.002
33. Cheng BJ, Wang J, Meng XL, Sun L, Hu B, Li HB, et al. The association between essential trace element mixture and cognitive function in Chinese community-dwelling older adults. Ecotoxicol Environ Saf. (2022) 231:113182. doi: 10.1016/j.ecoenv.2022.113182
34. Ma J, Zhou Y, Wang D, Guo Y, Wang B, Xu Y, et al. Associations between essential metals exposure and metabolic syndrome (MetS): exploring the mediating role of systemic inflammation in a general Chinese population. Environ Int. (2020) 140:105802. doi: 10.1016/j.envint.2020.105802
35. Zhang YN, Xu C, Xu L, Yu C, Miao M, Xie J, et al. High serum ferritin levels increase the risk of hyperuricemia: a cross-sectional and longitudinal study. Ann Nutr Metab. (2014) 64:6–12. doi: 10.1159/000358337
36. Li X, He T, Yu K, Lu Q, Alkasir R, Guo G, et al. Markers of iron status are associated with risk of hyperuricemia among Chinese adults: nationwide population-based study. Nutrient. (2018) 10:191. doi: 10.3390/nu10020191
37. Wang Y, Yang Z, Wu J, Xie D, Yang T, Li H, et al. Associations of serum iron and ferritin with hyperuricemia and serum uric acid. Clin Rheumatol. (2020) 39:3777–85. doi: 10.1007/s10067-020-05164-7
38. van Swelm RPL, Wetzels JFM, Swinkels DW. The multifaceted role of iron in renal health and disease. Nat Rev Nephrol. (2020) 16:77–98. doi: 10.1038/s41581-019-0197-5
39. van Raaij S, Rennings A, Biemond B, Schols S, Wiegerinck E, Roelofs H, et al. Iron handling by the human kidney glomerular filtration and tubular reabsorption both contribute to urinary iron excretion American journal of physiology. Renal Physiol. (2019) 316:F606–14. doi: 10.1152/ajprenal.00425.2018
40. Cabantchik ZI. Labile iron in cells and body fluids: physiology, pathology, and pharmacology. Front Pharmacol. (2014) 5:45. doi: 10.3389/fphar.2014.00045
41. Zhang Y, Liu Y, Qiu H. Association between dietary zinc intake and hyperuricemia among adults in the United States. Nutrients. (2018) 10:568. doi: 10.3390/nu10050568
42. Xie D, Xiong Y, Zeng C, Wei J, Yang T, Li H, et al. Association between low dietary zinc and hyperuricaemia in middle-aged and older males in China: a cross-sectional study. BMJ Open. (2015) 5:e008637. doi: 10.1136/bmjopen-2015-008637
44. Kader M, Lamb D, Wang L, Megharaj M, Naidu R. Zinc-arsenic interactions in soil: Solubility, toxicity and uptake. Chemosphere. (2017) 187:357–67. doi: 10.1016/j.chemosphere.2017.08.093
45. Sargazi M, Shenkin A, Roberts N. Zinc induced damage to kidney proximal tubular cells: studies on chemical speciation leading to a mechanism of damage. J Trace Elements Med Biol. (2013) 27:242–8. doi: 10.1016/j.jtemb.2012.12.004
46. Nasab H, Rajabi S, Eghbalian M, Malakootian M, Hashemi M, Mahmoudi-Moghaddam H. Association of As, Pb, Cr, and Zn urinary heavy metals levels with predictive indicators of cardiovascular disease and obesity in children and adolescents. Chemosphere. (2022) 294:133664. doi: 10.1016/j.chemosphere.2022.133664
47. Tinkov AA, Skalnaya MG, Ajsuvakova OP, Serebryansky EP, Chao JC, Aschner M, et al. Selenium, zinc, chromium, and vanadium levels in serum, hair, and urine samples of obese adults assessed by inductively coupled plasma mass spectrometry. Biol Trace Elem Res. (2021) 199:490–9. doi: 10.1007/s12011-020-02177-w
48. Cominetti C, Garrido A, Cozzolino S. Zinc nutritional status of morbidly obese patients before and after Roux-en-Y gastric bypass: a preliminary report. Obes Surg. (2006) 16:448–53. doi: 10.1381/096089206776327305
49. Solomons N, Jacob R. Studies on the bioavailability of zinc in humans: effects of heme and nonheme iron on the absorption of zinc. Am J Clin Nutr. (1981) 34:475–82. doi: 10.1093/ajcn/34.4.475
50. Lind T, Lönnerdal B, Stenlund H, Gamayanti I, Ismail D, Seswandhana R, et al. A community-based randomized controlled trial of iron and zinc supplementation in Indonesian infants: effects on growth and development. Am J Clin Nutr. (2004) 80:729–36. doi: 10.1093/ajcn/80.3.729
51. Hininger-Favier I, Andriollo-Sanchez M, Arnaud J, Meunier N, Bord S, Graham C, et al. Roussel Age- and sex-dependent effects of long-term zinc supplementation on essential trace element status and lipid metabolism in European subjects: the Zenith Study. Br J Nutr. (2007) 97:569–78. doi: 10.1017/S0007114507432974
52. Harvey L, Dainty J, Hollands W, Bull V, Hoogewerff J, Foxall R, et al. Effect of high-dose iron supplements on fractional zinc absorption and status in pregnant women. Am J Clin Nutr. (2007) 85:131–6. doi: 10.1093/ajcn/85.1.131
53. Chang S, El Arifeen S, Bari S, Wahed MA, Rahman KM, Rahman MT, et al. Supplementing iron and zinc. double blind, randomized evaluation of separate or combined delivery. Eur J Clin Nutr. (2010) 64:153–60. doi: 10.1038/ejcn.2009.127
54. Pérès J, Bureau F, Neuville D, Arhan P, Bouglé D. Inhibition of zinc absorption by iron depends on their ratio. J Trace Elements Med Biol. (2001) 15:237–41. doi: 10.1016/S0946-672X(01)80039-0
55. Yang Z, Li X, Tian L, Song Y, Zhang Y, Chen J, et al. Heavy metals exposure is associated with early liver dysfunction among rural residents aged 40-75 years in southwest China. J Appl Toxicol. (2022) 42, 1044–1056. doi: 10.1002/jat.4276
56. Leggett BA, Brown NN, Bryant SJ, Duplock L, Powell LW, Halliday JW. Factors affecting the concentrations of ferritin in serum in a healthy Australian population. Clin Chem. (1990) 1350–5. doi: 10.1093/clinchem/36.7.1350
Keywords: urinary metal exposure, hyperuricemia, serum uric acid, interactions, dose-response relationship
Citation: Huang C, Gao E, Xiao F, Wu Q, Liu W, Luo Y, Ren X, Chen X, He K, Huang H, Sun Q, Wu D and Liu J (2023) The relative and interactive effects of urinary multiple metals exposure on hyperuricemia among urban elderly in China. Front. Public Health 11:1015202. doi: 10.3389/fpubh.2023.1015202
Received: 09 August 2022; Accepted: 13 January 2023;
Published: 13 February 2023.
Edited by:
Xinming Wang, Guangzhou Institute of Geochemistry (CAS), ChinaCopyright © 2023 Huang, Gao, Xiao, Wu, Liu, Luo, Ren, Chen, He, Huang, Sun, Wu and Liu. This is an open-access article distributed under the terms of the Creative Commons Attribution License (CC BY). The use, distribution or reproduction in other forums is permitted, provided the original author(s) and the copyright owner(s) are credited and that the original publication in this journal is cited, in accordance with accepted academic practice. No use, distribution or reproduction is permitted which does not comply with these terms.
*Correspondence: Jianjun Liu,  anVuaWk4QDEyNi5jb20=
†These authors have contributed equally to this work