 Chonin Cheang
 Saikam Law1†
 Cunchuan Wang
95% of researchers rate our articles as excellent or good
Learn more about the work of our research integrity team to safeguard the quality of each article we publish.
Find out more
ORIGINAL RESEARCH article
Front. Public Health , 26 August 2022
Sec. Family Medicine and Primary Care
Volume 10 - 2022 | https://doi.org/10.3389/fpubh.2022.986954
This article is part of the Research Topic With Obesity Becoming the New Normal, What Should We Do? – Volume II View all 9 articles
Objective: Undoubtedly, the relationship between serum uric acid (SUA) and obesity is less data for Chinese patients with obesity. This study aimed to examine the prevalence of hyperuricemia (HUA) and the association between SUA and patients with obesity.
Methods: All participants were categorized as overweight, obesity I, obesity II, and obesity III. In addition, based on SUA concentration, the participants were stratified into four quartiles. The authors used descriptive analysis, independent t-test, ANOVA, correlation analysis, and multiple linear regression models to verify the SUA level and obesity among Chinese adults.
Results: Overall, the estimated prevalence of HUA was 69.8%. In the BMI categories, the prevalence of HUA was 5.1% in overweight, 15.2% in obesity I, 16.9% in obesity II, and 32.5% in obesity III. Correlation analysis shows that SUA is strongly correlated with BMI, waist circumference (WC), and hip circumference (HC). Multiple linear regression analysis shows that high density–lipoprotein cholesterol (HDL-C) is a protective predictor of serum uric acid levels in patients with obesity. Compared with the overweight, obesity I, obesity II, and obesity III were more likely to have higher levels in the SUA levels.
Conclusion: We mainly showed that the serum uric acid levels in Chinese patients with severe obesity declined slightly as age increased.
Obesity is an increasingly severe clinical and public health problem, with more than 100 million patients with obesity worldwide (1). Obesity has emerged as a major public health concern in China. Based on criteria for the Chinese population, more than half of Chinese adults had either overweight or obese in the most recent national survey. Overweight and obesity incidence was 34.3 and 16.4% (2). Insulin resistance, type 2 diabetes, hypertension, and hyperuricemia (HUA) are among endocrine disorders that can be caused by obesity and metabolic syndrome (3, 4), which places a heavy burden on patients, families, and the public health system.
In addition, Serum uric acid (SUA) is the end-product of purine metabolism in humans (5). Approximately two-thirds of SUA is produced endogenously, and the remaining is due to abundant diet purines (6). One of the key reasons for HUA and gout development is abnormal SUA metabolism and reduced excretion by the kidneys (7, 8). Elevated SUA can lead to gout and is an essential risk factor for obesity, resulting in increased metabolic syndrome (9, 10). Several studies have confirmed that patients with obesity, especially those with abdominal obesity, are independent predictors of HUA development (11, 12). A cross-sectional study showed that body mass index (BMI) significantly increases with elevated SUA among 27,009 middle-aged and elderly Chinese adults (13); another research still supports that (14).
In China, the prevalence of HUA was 13.3%, male and female was 19.4 and 7.9% (8). SUA was positively associated with numerous indices, including BMI, waist circumference, and dyslipidemia, in epidemiological investigations on metabolic syndrome (15, 16). A substantial positive relationship between SUA and obesity in Chinese adult population has been discovered (9, 17), Japan (18), India (15), Pakistan (16), and Bangladeshi (14). Accordingly, the present study was carried out to analyze the prevalence of HUA in Chinese obese/overweight adults and assessed the relationship between SUA and obesity by analyzing the metabolic status and related influencing factors of patients with obesity (even severely obese).
This study was a retrospective cross-sectional design conducted between January 2010 and December 2020. Subjects comprised 821 patients with obesity (304 males and 517 females) admitted to the author's hospital. Our analysis looked retrospectively at a large cohort of patients before being treated. All procedures were performed following ethical standards. This study have been approved by the hospital of the ethics committee. Inclusion criteria were BMI ≥ 25 kg/m2 and Chinese citizen. Exclusion criteria were severe hepatic and renal insufficiency, severe cardiovascular and cerebrovascular diseases, serious psychiatric illness, alcohol or drug abuse, taking Chinese traditional medicine drugs, uric acid–lowering drugs, angiotensin-receptor blockers, or diuretics within 3 months before admission, and high fat and high purine diet within 1 month before admission, and pregnant or breastfeeding.
Trained health technicians used a structured questionnaire form to record the baseline anthropometric measurements. Individual height, weight, waist circumference (WC; measured at the level of the umbilicus), and hip circumference (HC; measured as the horizontal circumference at the most prominent area of the hips), as well as other lifestyle variables, were gathered following the standard approach described elsewhere (19). Every day, the scales were calibrated to a standard. The body mass index (BMI) was determined by dividing the weight (in kg) by the height (in meters; in m2). Repeated measurements in the presence of investigators proved the accuracy of the anthropometric data. Laboratory measurements were obtained to measure SUA, total cholesterol (TC), low density–lipoprotein cholesterol (LDL-C), and high density–lipoprotein cholesterol (HDL-C) following a fast of 8–12 h, and venous blood was collected from each patient. Blood lipids and SUA were measured by immunoturbidimetry.
In present study, SUA concentrations of > 7.0 mg/dL (416.4 mol/L) in men and > 6.0 mg/dL (356.9 mol/L) in women were used to identify HUA (8, 20).These cutoff values were chosen because they are often utilized in clinical laboratories and have been advocated in prior studies for determining HUA (20). SUA levels were categorized into four quartiles to compare the prevalence of obesity and its association with SUA quartiles. Based on diagnostic criteria of obesity for Chinese populations recommended by the WHO, we categorized BMI into four groups: overweight (≥25–29.9 kg/m2), obesity I (30–34.9 kg/m2), obesity II (35–39.9 kg/m2), and obesity III (≥40 kg/m2) (21). WC ≥ 90 cm for men and ≥ 80 cm for women was used to determine abdominal obesity (22). So, the present study used SUA levels categorized into (HUA and non-HUA) to compare the prevalence of each obesity category and the relationship between SUA four quartiles and each obesity category.
IBM SPSS Statistics version 26 (IBM SPSS Statistics, New York, United States) was used to analyze all of the data. The differences between male and female participants for anthropometric and baseline factors were assessed using a two-tailed independent sample t-test. Pearson's correlation coefficient test was used to analyze the interrelationships between anthropometric, baseline factors, and SUA. To determine differences between the groups, a one-way ANOVA was used. The degree of SUA, and the factors that influence obesity were studied using multiple linear logistic regression. Unless otherwise stated, the values in the tables were given as mean and standard deviation (SD). For statistical significance, a level of alpha 0.05 was chosen.
The basic characteristics of the study are summarized in Table 1. Of the 821 subjects, 37.0% were males, and 63.0% were females. The mean age of the participants was 31.9 ± 9.3 years (range 18–71 years). The average BMI for all subjects was 39.0 ± 8.5 kg/m2, with a significant difference between males and females (p < 0.001). The mean value of WC and HC were 120.5 ± 18.0 and 123.8 ± 15.6, with a significant difference between male and female (p < 0.001) subjects. Notably, all participants were abdominal obesity (WC ≥ 90 cm for men and ≥ 80 cm for females). Among them, the male was observed for the mean level of SUA (p < 0.001), and TG (p < 0.01) was significantly higher than the female. In the contract, females' HDL levels are higher than for males (p < 0.001).

Table 1. Baseline characteristics and SUA level of the study cohort.
Based on the diagnostic criteria, 573 participants were identified as HUA individuals. Overall, the estimated prevalence of HUA was 69.8%, with 77.0% in males and 65.6% in female participants (Table 2). In the BMI categories, the prevalence of HUA was 5.1% in overweight, 15.2% in obesity I, 16.9% in obesity II, and 32.5% in obesity III. The mean level of SUA was 313.1 ± 47.2 μmol/L (max 414.9 μmol/L) and 498.5 ± 101.3 μmol/L (max 949.4 μmol/L) in the non-HUA and HUA group, respectively. A significant difference was observed for SUA, age, BMI, WC, and HC between non-HUA and HUA groups (p < 0.001, Table 2).
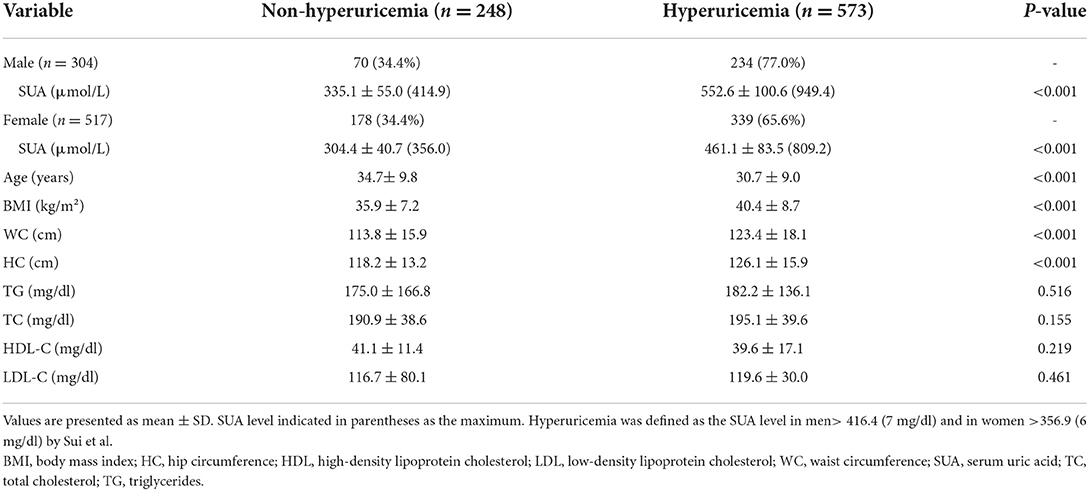
Table 2. Comparison of baseline characteristics between non-hyperuricemia and hyperuricemia subjects.
Table 3 presents the correlation of SUA with all subjects. The correlation analysis demonstrated the strong positive correlation of SUA with BMI (p < 0.001), WC (p < 0.001), and HC (p < 0.001); low negative correlation of SUA with age (p < 0.001). After adjusted age and sex, SUA still demonstrated a strong correlation between BMI, WC, and HC (p < 0.001). When BMI was categorized into overweight, obesity I, obesity II, and obesity III groups, a significant difference in SUA levels were found in obesity I (p < 0.001), obesity II (p < 0.001), and obesity III (p < 0.001) group when compared to overweight group (Figure 1).
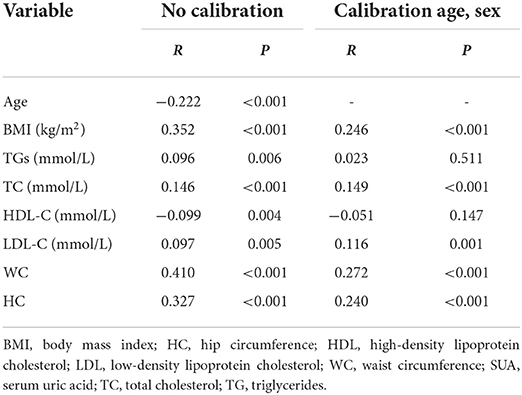
Table 3. Correlation coefficients between SUA and all parameters.
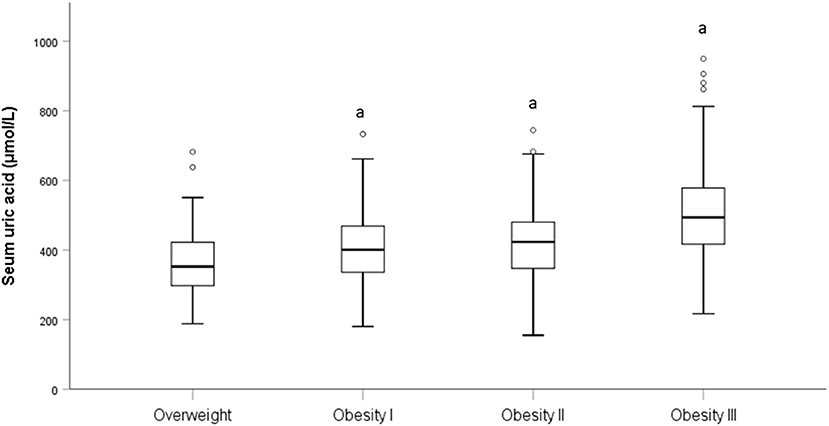
Figure 1. Level of SUA in different BMI category. “a” is represent p < 0.001 when compared to the overweight category.
Table 4 shows the baseline characteristics of the individuals according to SUA quartiles. As expected, the participants with higher SUA quartiles were more likely to be men. Across the SUA quartiles, BMI, WC, HC, SUA, TG, TC, and LDL levels steadily increased, while HDL levels progressively declined (Table 4). The prevalence of overweight was significantly decreased with the increasing SUA quartile (21.8, 12.7, 8.3, and 2.0% for the first, second, third, and fourth quartiles, respectively, p < 0.001 for trend). In contrast, the prevalence of obesity III was significantly increased with the increasing SUA quartile (18.0, 32.2, 39.5, and 65.4% for the first, second, third, and fourth quartiles, respectively, p < 0.001 for trend; Table 5 and Figure 2).
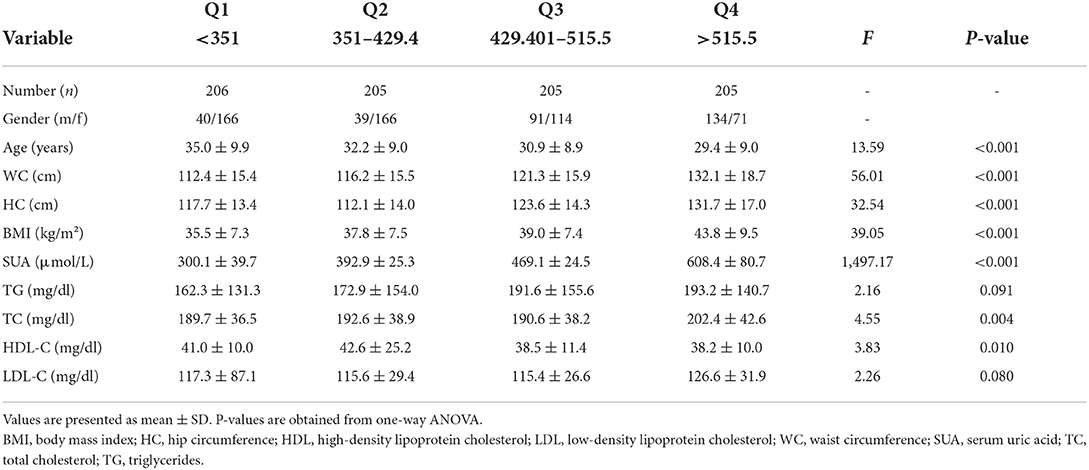
Table 4. Characteristics of the subjects according to SUA (μmol/L) quartiles.
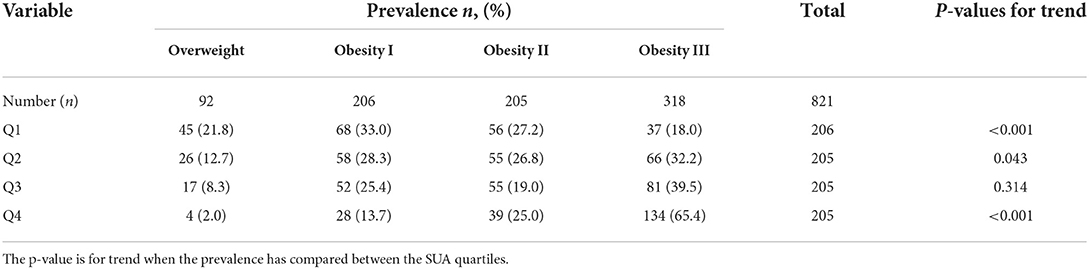
Table 5. Prevalence of overweight, obesity I, obesity II, and obesity III between the SUA quartiles.
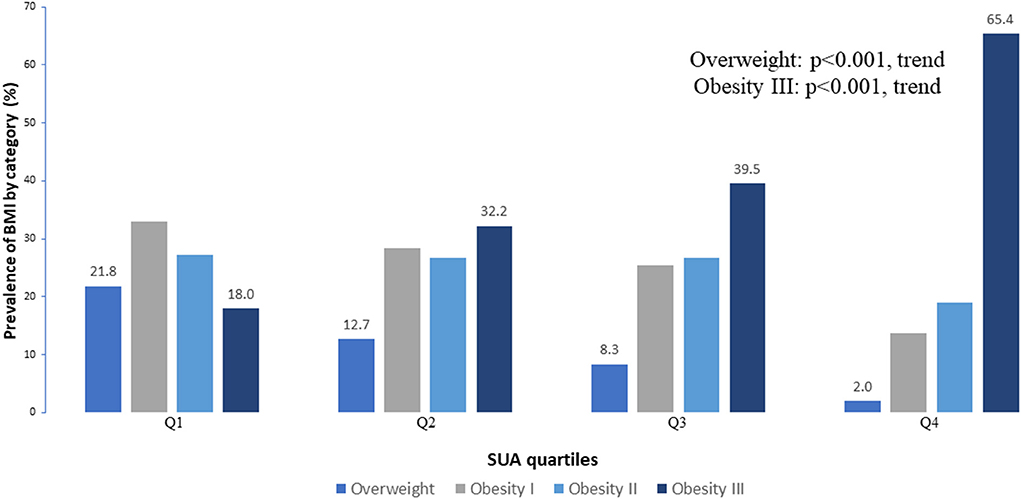
Figure 2. Comparison of obesity category between the SUA quartile groups.
Table 6 shows the relationship between SUA and risk factors of obesity for using multiple linear regression model. Overall, male (β = 69.018, 95% CI: 52.861–85.175, p < 0.001) and high TC level (β = 16.228, 95% CI: 6.855–25.602, p = 0.001) were significantly more likely to have higher levels in the SUA. Compared with the overweight, obesity I (β = 29.978, 95% CI: 4.173 – 55.783, p = 0.023), obesity II (β = 34.854 95% CI: 8.766−60.943, p = 0.009), and obesity III (β = 97.107, 95% CI: 71.810 - 122.403, p < 0.001) were more likely to have higher levels in the SUA levels. On the contrary, older age (β = −2.222, 95% CI:−2.992 to−1.451, p < 0.001) and high HDL level (β = −22.109, 95% CI:−40.652 to−3.566, p = 0.020) were significantly more likely to have lower levels in the SUA levels.
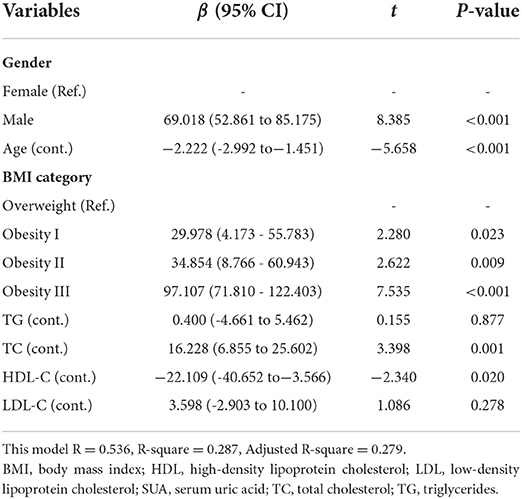
Table 6. Multiple linear regression between SUA and risk factors of obesity in the model.
Obesity has become a health issue in the past decade in China. It has been recognized as a risk factor for various clinical diseases and adverse health outcomes, HUA being one of them (23). However, SUA is not only associated with obesity but also has a significant positive correlation with other clinical diseases such as diabetes, hypertension, and ischemic heart disease. Although these clinical conditions are also associated with obesity, SUA is independently associated with all of these conditions (24). Thus, patients with HUA are more likely to develop diabetes, hypertension, and ischemic heart disease than patients without HUA. Elevated SUA levels also increase morbidity and mortality in these patients (25). The strong correlation between gout, SUA levels, obesity, and metabolic syndrome (26, 27). Notably, most patients with HUA do not have gout. However, elevated SUA levels still increase the risk of gout (28). This study analyzed the prevalence of HUA in obese/overweight adults in China by analyzing the metabolic status and related influencing factors of obese (even severely obese) hospitalized patients and evaluated the relationship between SUA and obesity.
In this present study, the prevalence of HUA was 69.8% (77.0% in men and 65.6% in women), SUA levels are higher in men than in women, and the prevalence of HUA increases with increasing BMI. Similar results were found in previous studies (29, 30). However, the prevalence of the HUA in mainland China was 13.3% (19.4% in men and 7.9% in women), much lower than our results (8). Thus, our findings suggested that the HUA is significantly higher in severely patients with obesity. However, studies have found that HUA is more common in women than men (31). Additionally, in a 10-year follow-up study, BMI increased significantly with SUA levels regardless of race and gender, related to different regions, races, and environmental exposures (32). The protentional factor would be the mechanism that may be related to the effect of estrogen on renal tubular processing of SUA (33). Although gender did not differ significantly in demographic variables, further large-scale epidemiological studies are needed to investigate the effect of gender on HUA.
The correlation analysis shows that SUA is positively correlated with BMI before and after adjusting for age and gender. A positive correlation between BMI and SUA levels was reported in healthy individuals in Jiangsu Province (34), China, in a study consistent with our study. HUA is associated with an increased risk of weight gain, possibly with an accumulation of visceral fat area (35). When subjects were divided into different groups based on BMI levels, SUA levels were elevated in the higher BMI group, especially those with obesity III. In the Q4 high uric acid level group, the number of people increased as obesity increased. It can be seen that the higher the degree of obesity, the higher the uric acid level, and the more likely it is to appear HUA. The degree of obesity is the most important risk factor for HUA. How can this correlation be explained? According to Tsushima reports (36) increased uric acid secretion in adipose tissue in patients with obesity. In patients with obesity, excessive fat accumulation in patients with obesity produces and secretes uric acid, and is associated with HUA of the overproduction type. This may provide a possible mechanism for the relationship between BMI and SUA.
According to a report to Yu Tsushima (36), in patients with obesity, excess fat accumulation in obesity produces and secretes uric acid and is associated with excess production of HUA, which may provide a possible mechanism for the relationship between BMI and SUA. Although a positive correlation between obesity and SUA levels has been reported in previous studies, the mechanism by which uric acid increases in obesity has not been well-elucidated. Many factors can cause HUA, including chronic kidney disease, metabolic syndrome, and dietary habits (37). Interestingly, we found that age was a protective factor against HUA. However, previous studies have shown that HUA increases with age (32). This variability may be due to the small sample size of our study and the differences in diet, ethnicity, lifestyle, and comorbidities in our study population from other studies. We also found that HDL-C is a protective factor against HUA. In previous epidemiological studies, patients with HUA are often associated with dyslipidemia (decreased HDL-c levels and elevated TG levels) (38). The underlying mechanism is that low HDL-c levels increase the risk of kidney damage, possibly leading to decreased uric acid excretion (39). HDL-C and age may be independent predictors of HUA (40). The increased levels of SUA in subjects with obesity may involve two factors: excessive uric acid production and impaired renal excretion. A study in subjects with visceral fat showed that elevated uric acid levels were strongly influenced by hypersecretion of uric acid, with decreased urea excretion and clearance (41). In addition, visceral fat accumulation induces a massive influx of plasma-free fatty acids into living veins and the hepatic portal vein, thereby stimulating triglyceride synthesis, leading to a surge in uric acid production by activating the uric acid synthesis pathway (42).
There are some limitations of our study. First, the cross-sectional nature of the data does not demonstrate a causal relationship between SUA and obesity. Second, the sample size of this study is relatively small, so our findings are not representative of the entire population of China. In addition, our study was in patients above the overweight level and did not enroll in the normal-weight population, which may not apply to other ethnic groups. It has been observed that SUA is a critical determinant of BMI change, and SUA levels can predict subsequent weight gain. However, the underlying mechanism of increased SUA in obese individuals remains to be explored. In the future, more research is needed to determine the mechanisms underlying the association between SUA and obesity in humans.
In conclusion, our study observed significant associations between SUA and obesity in this decade's cross-sectional study. We mainly showed that a higher SUA level was associated with an increased risk of obesity. The prevalence of HUA in Chinese patients with obesity was ~69.8%. In the BMI categories, the prevalence of HUA was 5.1% in overweight, 15.2% in obesity I, 16.9% in obesity II, and 32.5% in obesity III. In addition, age, and HDL-C, were found to be independent predictors of HUA. Additionally, the increased risk of SUA level was more significant for severe obesity males and young, high TC participants. The serum uric acid levels in Chinese patients with severe obesity declined slightly as age increased. However, compared with the patients with overweight, Chinese patients with obesity I, obesity II, and obesity III were more likely to have higher levels of serum uric acid levels. There is no denying that the relationship between severe obesity and SUA needs more evidence from well-designed studies to confirm our findings in Chinese patients with severe obesity.
The raw data supporting the conclusions of this article will be made available by the authors, without undue reservation.
The studies involving human participants were reviewed and approved by the Ethics Research Committee of the First Affiliated Hospital of Jinan University. Written informed consent for participation was not required for this study in accordance with the national legislation and the institutional requirements.
CC and SL: conceptualization and writing-original draft preparation. CC, JR, and WC: methodology, data curation, and formal analysis. CW and ZD: resources, supervision, and project administration. ZD, CC, and SL: writing-review and editing. JR and WC: visualization. All authors contributed to the article and approved the submitted version.
The authors declare that the research was conducted in the absence of any commercial or financial relationships that could be construed as a potential conflict of interest.
All claims expressed in this article are solely those of the authors and do not necessarily represent those of their affiliated organizations, or those of the publisher, the editors and the reviewers. Any product that may be evaluated in this article, or claim that may be made by its manufacturer, is not guaranteed or endorsed by the publisher.
1. Abarca-Gómez L, Abdeen ZA, Hamid ZA, Abu-Rmeileh NM, Acosta-Cazares B, Acuin C, et al. Worldwide trends in body-mass index, underweight, overweight, and obesity from 1975 to 2016: a pooled analysis of 2416 population-based measurement studies in 128.9 million children, adolescents, and adults. Lancet. (2017) 390:2627–42. doi: 10.1016/S0140-6736(17)32129-3
2. The State Council Information Office of the People's Republic of China. Press Briefing for the Report on Chinese Residents' Chronic Diseases and Nutrition. (2020). Available online at: http://www.gov.cn/xinwen/2020-12/24/content_5572983.htm (accessed December 24, 2020).
3. Kuwahara E, Murakami Y, Okamura T, Komatsu H, Nakazawa A, Ushiku H, et al. Increased childhood BMI is associated with young adult serum uric acid levels: a linkage study from Japan. Pediatr Res. (2017) 81:293–8. doi: 10.1038/pr.2016.213
4. Weihrauch-Blüher S, Schwarz P, Klusmann J-H. Childhood obesity: increased risk for cardiometabolic disease and cancer in adulthood. Metabolism. (2019) 92:147–52. doi: 10.1016/j.metabol.2018.12.001
5. Glantzounis GK, Tsimoyiannis EC, Kappas AM, Galaris DA. Uric acid and oxidative stress. Curr Pharm Des. (2005) 11:4145–51. doi: 10.2174/138161205774913255
6. Schlesinger N. Dietary factors and hyperuricaemia. Curr Pharm Des. (2005) 11:4133–8. doi: 10.2174/138161205774913273
7. Terkeltaub RA. Clinical practice. Gout N Engl J Med. (2003) 349:1647–55. doi: 10.1056/NEJMcp030733
8. Liu R, Han C, Wu D, Xia X, Gu J, Guan H, et al. Prevalence of hyperuricemia and gout in mainland China from 2000 to 2014: a systematic review and meta-analysis. Biomed Res Int. (2015) 2015:762820. doi: 10.1155/2015/762820
9. Li F, Chen S, Qiu X, Wu J, Tan M, Wang M. Serum uric acid levels and metabolic indices in an obese population: a cross-sectional study. Diabetes Metab Syndr Obes. (2021) 14:627–35. doi: 10.2147/DMSO.S286299
10. Chang JB, Chen YL, Hung YJ, Hsieh CH, Lee CH, Pei D, et al. The role of uric acid for predicting future metabolic syndrome and type 2 diabetes in older people. J Nutr Health Aging. (2017) 21:329–35. doi: 10.1007/s12603-016-0749-3
11. Rospleszcz S, Dermyshi D, Müller-Peltzer K, Strauch K, Bamberg F, Peters A. Association of serum uric acid with visceral, subcutaneous and hepatic fat quantified by magnetic resonance imaging. Sci Rep. (2020) 10:442. doi: 10.1038/s41598-020-57459-z
12. Ogura T, Matsuura K, Matsumoto Y, Mimura Y, Kishida M, Otsuka F, et al. Recent trends of hyperuricemia and obesity in Japanese male adolescents, 1991 through 2002. Metabolism. (2004) 53:448–53. doi: 10.1016/j.metabol.2003.11.017
13. Dai X, Yuan J, Yao P, Yang B, Gui L, Zhang X, et al. Association between serum uric acid and the metabolic syndrome among a middle- and old-age Chinese population. Eur J Epidemiol. (2013) 28:669–76. doi: 10.1007/s10654-013-9829-4
14. Ali N, Perveen R, Rahman S, Mahmood S, Rahman S, Islam S, et al. Prevalence of hyperuricemia and the relationship between serum uric acid and obesity: a study on Bangladeshi adults. PLoS One. (2018) 13:e0206850. doi: 10.1371/journal.pone.0206850
15. Kanwar G, Kabra R. Serum uric acid level and obesity: an association. Int J Healthcare Sci. (2016) 4:52–5. Available online at: https://www.researchpublish.com/upload/book/Serum%20Uric%20Acid%20Level%20and%20Obesity-3099.pdf
16. Goli P, Riahi R, Daniali SS, Pourmirzaei M, Kelishadi R. Association of serum uric acid concentration with components of pediatric metabolic syndrome: A systematic review and meta-analysis. J Res Med Sci. (2020) 25:43. doi: 10.4103/jrms.JRMS_733_19
17. Yang C, Yang S, Feng C, Zhang C, Xu W, Zhang L, et al. Associations of hyperuricemia and obesity with remission of nonalcoholic fatty liver disease among Chinese men: a retrospective cohort study. PLoS One. (2018) 13:e0192396. doi: 10.1371/journal.pone.0192396
18. Zhu C, Cui R, Gao M, Rampersad S, You H, Sheng C, et al. The associations of serum uric acid with obesity-related acanthosis nigricans and related metabolic indices. Int J Endocrinol. (2017) 2017:5438157. doi: 10.1155/2017/5438157
19. Ali N, Mahmood S, Manirujjaman M, Perveen R, Al Nahid A, Ahmed S, et al. Hypertension prevalence and influence of basal metabolic rate on blood pressure among adult students in Bangladesh. BMC Public Health. (2018) 18:1–9. doi: 10.1186/s12889-017-4617-9
20. Sui X, Church TS, Meriwether RA, Lobelo F, Blair SN. Uric acid and the development of metabolic syndrome in women and men. Metabolism. (2008) 57:845–52. doi: 10.1016/j.metabol.2008.01.030
21. WHO. Obesity: preventing and managing the global epidemic. Report of a WHO consultation. World Health Organ Tech Rep Ser. (2000) 894:1–253. Available online at: https://apps.who.int/iris/handle/10665/42330
22. Alberti KGM, Zimmet P, Shaw J. The metabolic syndrome—a new worldwide definition. Lancet. (2005) 366:1059–62. doi: 10.1016/S0140-6736(05)67402-8
23. Essa SA, Mishari AK, Kadhom QI. Association between serum uric acid and obesity. J Babylon Univ. (2015) 2:899–903. Available online at: https://www.iasj.net/iasj/download/f497c0c80c1579e8
24. Akkasilpa S, Avihingsanon Y, Hanvivadhanakul P, Wonchinsri J. Clinical manifestations of patients with hyperuricemia. J Med Assoc Thai. (2004) 87(Suppl.2):S41–4.
25. Suliman ME, Johnson RJ, García-López E, Qureshi AR, Molinaei H, Carrero JJ, et al. J-shaped mortality relationship for uric acid in CKD. Am J Kidney Dis. (2006) 48:761–71. doi: 10.1053/j.ajkd.2006.08.019
26. Soltani Z, Rasheed K, Kapusta DR, Reisin E. Potential role of uric acid in metabolic syndrome, hypertension, kidney injury, and cardiovascular diseases: is it time for reappraisal? Curr Hypertens Rep. (2013) 15:175–81. doi: 10.1007/s11906-013-0344-5
27. Heinig M, Johnson RJ. Role of uric acid in hypertension, renal disease, and metabolic syndrome. Cleve Clin J Med. (2006) 73:1059–64. doi: 10.3949/ccjm.73.12.1059
28. Shiozawa A, Szabo SM, Bolzani A, Cheung A, Choi HK. Serum uric acid and the risk of incident and recurrent gout: a systematic review. J Rheumatol. (2017) 44:388–96. doi: 10.3899/jrheum.160452
29. Zobbe K, Prieto-Alhambra D, Cordtz R, Højgaard P, Hindrup JS, Kristensen LE, et al. Secular trends in the incidence and prevalence of gout in Denmark from 1995 to 2015: a nationwide register-based study. Rheumatology. (2019) 58:836–9. doi: 10.1093/rheumatology/key390
30. Chen-Xu M, Yokose C, Rai SK, Pillinger MH, Choi HK. Contemporary prevalence of gout and hyperuricemia in the United States and decadal trends: the national health and nutrition examination survey, 2007-2016. Arthritis Rheumatol. (2019) 71:991–9. doi: 10.1002/art.40807
31. McCormick N, Yokose C, Lu N, Joshi AD, Curhan GC, Choi HK. Impact of adiposity on risk of female gout among those genetically predisposed: sex-specific prospective cohort study findings over >32 years. Ann Rheum Dis. (2022) 81:556–63. doi: 10.1136/annrheumdis-2021-221635
32. Kuo C-F, Grainge MJ, Mallen C, Zhang W, Doherty M. Rising burden of gout in the UK but continuing suboptimal management: a nationwide population study. Ann Rheum Dis. (2015) 74:661–7. doi: 10.1136/annrheumdis-2013-204463
33. Cho SK, Winkler CA, Lee SJ, Chang Y, Ryu S. The prevalence of hyperuricemia sharply increases from the late menopausal transition stage in middle-aged women. J Clin Med. (2019) 8:jcm8030296. doi: 10.3390/jcm8030296
34. Wang H, Wang L, Xie R, Dai W, Gao C, Shen P, et al. Association of serum uric acid with body mass index: a cross-sectional study from Jiangsu Province, China. Iran J Public Health. (2014) 43:1503–9.
35. Tamba S, Nishizawa H, Funahashi T, Okauchi Y, Ogawa T, Noguchi M, et al. Relationship between the serum uric acid level, visceral fat accumulation and serum adiponectin concentration in Japanese men. Intern Med. (2008) 47:1175–80. doi: 10.2169/internalmedicine.47.0603
36. Tsushima Y, Nishizawa H, Tochino Y, Nakatsuji H, Sekimoto R, Nagao H, et al. Uric acid secretion from adipose tissue and its increase in obesity. J Biol Chem. (2013) 288:27138–49. doi: 10.1074/jbc.M113.485094
37. Dalbeth N, Gosling AL, Gaffo A, Abhishek A. Gout. Lancet. (2021) 397:1843–55. doi: 10.1016/S0140-6736(21)00569-9
38. Liu XY, Wu QY, Chen ZH, Yan GY, Lu Y, Dai HJ, et al. Elevated triglyceride to high-density lipoprotein cholesterol (TG/HDL-C) ratio increased risk of hyperuricemia: a 4-year cohort study in China. Endocrine. (2020) 68:71–80. doi: 10.1007/s12020-019-02176-5
39. Kawachi K, Kataoka H, Manabe S, Mochizuki T, Nitta K. Low HDL cholesterol as a predictor of chronic kidney disease progression: a cross-classification approach and matched cohort analysis. Heart Vessels. (2019) 34:1440–55. doi: 10.1007/s00380-019-01375-4
40. Qu X, Zheng L, Zu B, Jia B, Lin W. Prevalence and clinical predictors of hyperuricemia in chinese bariatric surgery patients. Obes Surg. (2022) 32:1508–15. doi: 10.1007/s11695-021-05852-6
41. Matsuura F, Yamashita S, Nakamura T, Nishida M, Nozaki S, Funahashi T, et al. Effect of visceral fat accumulation on uric acid metabolism in male obese subjects: visceral fat obesity is linked more closely to overproduction of uric acid than subcutaneous fat obesity. Metabolism. (1998) 47:929–33. doi: 10.1016/S0026-0495(98)90346-8
Keywords: hyperuricemia, obesity, serum uric acid, Chinese, retrospective cross-sectional study
Citation: Cheang C, Law S, Ren J, Chan W, Wang C and Dong Z (2022) Prevalence of hyperuricemia in patients with severe obesity and the relationship between serum uric acid and severe obesity: A decade retrospective cross-section study in Chinese adults. Front. Public Health 10:986954. doi: 10.3389/fpubh.2022.986954
Received: 05 July 2022; Accepted: 12 August 2022;
Published: 26 August 2022.
Edited by:
Konstantinos Tziomalos, Aristotle University of Thessaloniki, GreeceReviewed by:
Sumeet Goel, Central Council for Research in Ayurvedic Science, IndiaCopyright © 2022 Cheang, Law, Ren, Chan, Wang and Dong. This is an open-access article distributed under the terms of the Creative Commons Attribution License (CC BY). The use, distribution or reproduction in other forums is permitted, provided the original author(s) and the copyright owner(s) are credited and that the original publication in this journal is cited, in accordance with accepted academic practice. No use, distribution or reproduction is permitted which does not comply with these terms.
*Correspondence: Zhiyong Dong, ZG9uZ3p5MjAwOEBqbnUuZWR1LmNu
†These authors have contributed equally to this work and share first authorship
Disclaimer: All claims expressed in this article are solely those of the authors and do not necessarily represent those of their affiliated organizations, or those of the publisher, the editors and the reviewers. Any product that may be evaluated in this article or claim that may be made by its manufacturer is not guaranteed or endorsed by the publisher.
Research integrity at Frontiers
Learn more about the work of our research integrity team to safeguard the quality of each article we publish.