
94% of researchers rate our articles as excellent or good
Learn more about the work of our research integrity team to safeguard the quality of each article we publish.
Find out more
ORIGINAL RESEARCH article
Front. Public Health , 09 September 2022
Sec. Environmental Health and Exposome
Volume 10 - 2022 | https://doi.org/10.3389/fpubh.2022.981749
This article is part of the Research Topic Environmental Exposures and Cardiometabolic Disease Volume II View all 3 articles
 Yangchang Zhang1,2,3,4†
 Weiwei Liu1,5,6†
 Wei Zhang5
 Rui Cheng7Andi Tan8
 Shisi Shen9
 Yang Xiong10Limei Zhao11Xun Lei1,2,3,4*
Background: Research on the association between blood lead (Pb) and lipid biomarkers have yielded inconsistent results, and epidemiological studies on blood Pb levels and hyperlipidemia are scarce. The present study aimed to examine the association between blood Pb levels and hyperlipidemia in adults from the National Health and Nutrition Examination Survey (NHANES).
Methods: A total of 43,196 participants in the NHANES from 1999 to 2018 were included in the final analysis. Hyperlipidemia was determined based on the National Cholesterol Education Program guidelines. Blood Pb levels were assessed using inductively-coupled plasma mass spectrometry. Weighted multivariable logistic regression analysis and subgroup analysis were conducted to determine the correlation between blood Pb levels and hyperlipidemia.
Results: In the multivariable logistic regression model, high blood Pb levels were significantly associated with hyperlipidemia after adjusting for confounders (OR 1.41; 95%CI: 1.18–1.67). Furthermore, elevated blood Pb levels were associated with an increased risk of hyperlipidemia across the four quartile (Q) groups (Q1: OR 1.00; Q2: OR 1.16 [95%CI: 1.04–1.29]; Q3: OR 1.39 [95%CI: 1.21–1.59]; and Q4: OR 1.33 [95%CI: 1.15–1.54]; P for trend <0.05). Significant moderating effects were found in the subgroup analysis stratified by age, education, hypertension, and diabetes (P < 0.05). In sensitivity analysis, the ORs for hyperlipidemia across the quartiles of blood Pb levels were 1.00, 1.17 (95%CI: 1.05–1.30), 1.42 (95%CI: 1.24–1.62), and 1.38 (95%CI: 1.19–1.60) for Q1, Q2, Q3, and Q4, respectively (P for trend <0.001) after removing adults with arteriosclerotic cardiovascular disease, and the ORs were 1.00, 1.13 (95%CI: 1.01–1.25), 1.38 (95%CI: 1.21–1.56), and 1.32 (95%CI: 1.16–1.52) for Q1, Q2, Q3, and Q4, respectively (P for trend <0.001) after including pregnant women.
Conclusion: The current study showed a positive association between blood lead levels and hyperlipidemia.
Hyperlipidemia has become an increasingly common concern in Europe and the US, as well as in developing countries. This condition includes various genetic and acquired disorders that are associated with high lipid levels, including cholesterol and triglycerides. From 2015 to 2018, approximately 12% of adults aged ≥20 years reported total cholesterol levels higher than 240 mg/dL, and nearly 17% reported high-density lipoprotein (HDL) cholesterol levels <40 mg/dL in the US (1). In the US, 28 million adults reported total cholesterol levels higher than 240 mg/dL (1). Hyperlipidemia increases the risk of cardiovascular disease and is a leading cause of stroke and death (2).
Lead (Pb) is a neurotoxic heavy metal that exists widely in the environment. The use of Pb has increased globally in the past decades, and the mining, smelting, and refining industries have led to substantial increases in environmental levels. Much of the Pb exposure mixtures come from a variety of industry products around the life space, including paint, ceramic, and piping materials (3). Pb is generally absorbed by the human body through ingestion and inhalation and accumulates in bone (4). It is estimated that adults could absorb 3–10% of water-soluble Pb at oral dose, whereas for children, the estimates may increase to 40–50% (4). Pregnancy was associated with higher absorption of Pb (5). Furthermore, mothers can transfer Pb to the fetus via the blood and to infants via breastfeeding (5). Pb toxicity damages the human central nervous system, and a previous report has shown that, in children, the amount of Pb adsorption is linked to lower intelligence and impaired motor function (4).
The association between Pb exposure and hyperlipidemia is inconsistent, and epidemiological studies on blood Pb levels and hyperlipidemia are rare. Evidence from rat experiments showed that exposure to Pb can cause oxidative stress, which induces alterations in lipid metabolism and gives rise to lipid disorders (6). This result indicates that exposure to Pb is associated with hyperlipidemia. Similarly, a longitudinal study in the US of 426 aging males showed that blood Pb levels were positively correlated with total cholesterol and HDL concentrations. Moreover, a national cross-sectional study in the US among adults found that exposure to Pb for long periods may significantly increase the risk of low-density lipoprotein, C-reactive protein, systolic blood pressure, and diastolic blood pressure (7). Moreover, in pregnant women, Pb exposure was significantly associated with increased non-HDL cholesterol and gamma-glutamyl transferase in the US (7). However, the artisans in Abeokuta, Nigeria were more likely to have high low-density lipoprotein levels than the control group, but there was no significant association with HDL cholesterol or triglycerides (8).
The purpose of this study was to examine the association between blood Pb levels and hyperlipidemia for 10 pooled cycles from the US NHANES to find potential evidence that could shed light on the contradictory association between lipid biomarkers and Pb exposure found in previous studies, and the limitation on hyperlipidemia associated with long-term Pb exposure.
The NHANES is an ongoing nationally representative health examination and nutritional status survey of adults and children in the US. The project consists of a series of cross-sectional waves that began in 1998 and mainly include five data components: demographic, dietary, examination, laboratory, and questionnaire. Interviews were carried out in each participant's home, and examination and laboratory testing were conducted in mobile examination centers. Detailed information regarding the continuous NHANES survey design can be found at http://www.cdc.gov/nchs/nhanes/index.htm. All study protocols were approved by the ethics review board of the National Center for Health Statistics, and written informed consent was obtained from all participants before any data collection.
In the present study, we obtained data from 10 survey cycles (1999–2000, 2001–2002, 2003–2004, 2005–2006, 2007–2008, 2009–2010, 2011–2012, 2013–2014, 2015–2016, 2017–2018). In total, there were 101,316 participants in the pooled cycles. Participants with missing values for blood Pb levels and/or hyperlipidemia, or aged <20 years, or pregnant women, were excluded from the sample pool. The final sample for multiple cross-sectional analyses comprised 43,196 participants. The study flow chart is presented in Figure 1.
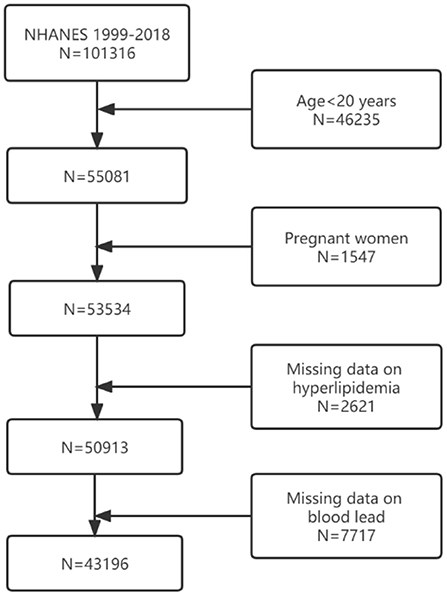
Figure 1. Sample selection process flow chart.
We assessed the hyperlipidemia status based on the National Cholesterol Education Program (NCEP) in adults (Adult Treatment Panel III, ATP 3), which defined hyperlipidemia as triglycerides ≥ 150 mg/dL, total cholesterol ≥ 200 mg/dL, low-density lipoprotein ≥ 130 mg/dL, or HDL ≤ 40 mg/dL in males and ≤ 50 mg/dL in females (9). Alternatively, participants reporting use of cholesterol-lowering medications were also defined as having hyperlipidemia.
Blood Pb levels reflect the systemic Pb load and Pb-exposed dose in the recent period. The method followed to measure blood Pb concentration was a modification of a previous approach. Whole blood samples were extracted, processed (10), stored, and shipped to the National Center for Environmental Health and Centers for Disease Control and Prevention for analysis. In the laboratory, specimens were diluted and then stored in −20°C conditions (11). Inductively-coupled plasma mass spectrometry was used to determine total whole blood Pb concentrations. This technique was based on quadruple ICP-MS technology (12). Blood Pb concentrations under the limit of detection (LOD) were replaced with the LOD divided by the square root of 2 (13). All blood Pb concentrations were determined for log2-transformation to an approximately normal distribution.
Based on previous research papers, potential confounding variables associated with blood Pb levels and hyperlipidemia were included in the final analyses (14, 15), including age, sex, race, marital status, education level, alcohol intake, smoking status, hypertension, ratio of family income to poverty, and diabetes mellitus. The participant age chosen for this study was that at the time of screening. Sex was dichotomized into male and female. Race was classified as Mexican American, non-Hispanic Black, non-Hispanic White, other Hispanic, and other race. Marital status was divided into living alone and married or living with a partner. Education level was defined as less than high school, high school, and above high school. The ratio of family income to poverty was the index used to estimate household socioeconomic status, which was graded as <1.5, 1.5–3.5, or >3.5 (16). Alcohol intake was classified as mild, moderate, and heavy. Heavy alcohol use was defined as ≥3 drinks per day for females or ≥4 drinks per day for males, or binge drinking on five or more days per month (12). Moderate alcohol use was defined as ≥2 drinks per day for females and ≥3 drinks per day for males, or binge drinking ≥2 days per month. Mild alcohol use was regarded as others (17). Smoking status was defined as never, former, and current (18). Never smokers were those who smoked <100 cigarettes in their lifetime; former smokers smoked >100 cigarettes in their lifetime but currently did not smoke at all; and current smokers smoked >100 cigarettes in their lifetime and currently smoked some days or every day. Hypertension was defined as an average blood pressure >140 mmHg systolic and/or 90 mmHg diastolic, report of hypertension diagnosed by a physician, or taking hypertension medicine. Physical activity level was calculated using the metabolic equivalent (MET, Per week) (19). The body mass index (BMI) was classified as underweight (<20 kg/m2), normal (≥20 to <25 kg/m2), overweight (≥25 to <30 kg/m2), and obese (≥30 kg/m2) (20). Diabetes mellitus was defined as reporting a diabetes diagnosis, glycohemoglobin HbA1c (%) > 6.5, or fasting glucose (mmol/L) ≥ 7.0, random blood glucose (mmol/L) ≥ 11.1, 2 h OGTT blood glucose (mmol/L) ≥ 11.1, or use of diabetes medication or insulin (21).
Blood Pb concentrations were grouped into quartiles from lowest (first quartile, Q1) to highest (fourth quartile, Q4). The sample population was summarized by means and standard deviations for continuous variables and numbers and proportions for categorical variables. The difference among quartiles in blood Pb levels and sample characteristics was determined using one-way ANOVA analysis for normally distributed data and Chi-square test for categorical data. A 10-cycle sample weight (1999–2018) was utilized to account for over-sampling and non-responses. The primary sample unit and strata were defined to account for complex multistage probability sampling based on tutorials on the NHANES website. Three logistic regression models were conducted to estimate the associations of blood Pb concentration quartiles and hyperlipidemia. Crude model was no covariate; Model 1 was adjusted for age and sex; Model 2 was adjusted for age, sex, race, marital status, ratio of family income to poverty, educational level, alcohol intake, smoking status, BMI, hypertension, and diabetes mellitus. The effective strength of the associations was assessed by the odds ratio (OR) and 95% confidence intervals (CI).
Alternatively, some additional analyses were conducted. First, blood Pb concentrations were included in three logistic models as continuous variables, not quartiles. Second, interactive analyses were performed, stratified by other covariates. The P for interaction below 0.05 reveled significant interactive effects. Third, we examined the association between blood Pb concentrations and hyperlipidemia after excluding participants with arteriosclerotic cardiovascular disease (ASCVD is defined as having one or multiple cardiovascular disease, including coronary heart disease, angina, heart attack, and stroke). Fourth, we would keep pregnant group in the corresponding regression analysis. All statistical analyses were conducted using STATA software (Version 16.1, Stata Corporation) and R studio (Version 4.1.2). The significant threshold was defined as two-tailed P < 0.05.
There were 43,196 participants included in the final analysis across the quartiles of blood Pb levels, as shown in Table 1. Participants in the Q4 group tended to be older, female, high school education or above, non-Hispanic White, mild alcohol users, never smokers, overweight, with total MET >1,200 min/week, ratio of family income to poverty <1.5, no diabetes, and hypertension. There was a significant difference among the blood Pb quartiles in terms of age, sex, education, races, alcohol intake, smoking status, BMI, MET, ratio of family income to poverty, diabetes, hypertension and hyperlipidemia (P < 0.001).
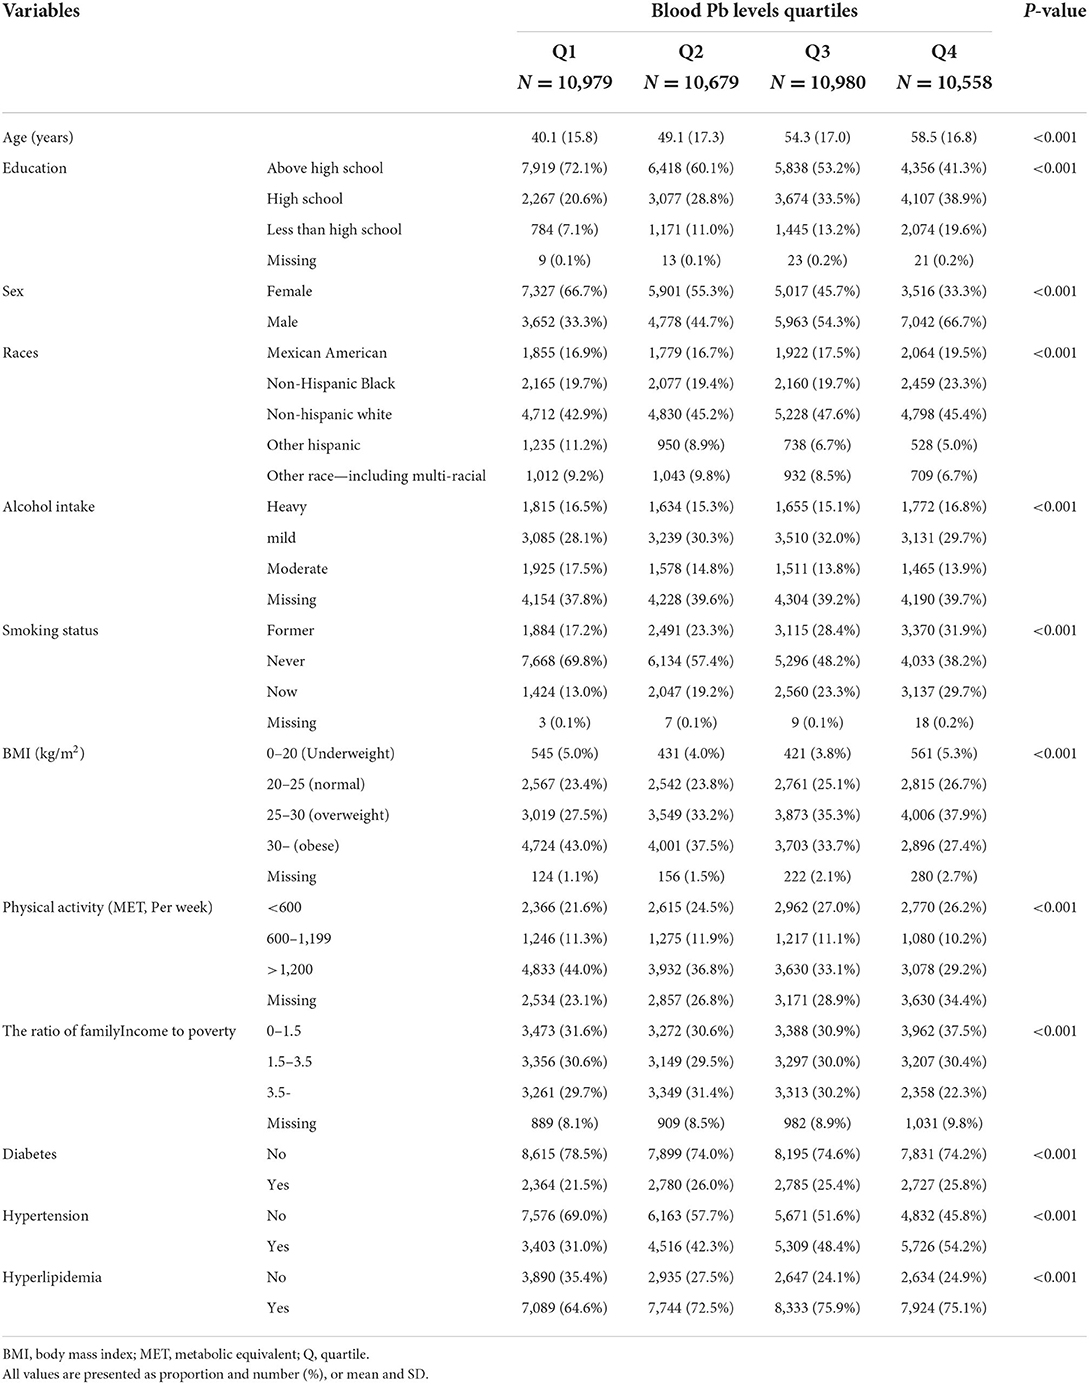
Table 1. Characteristics of NHANES samples (1999–2018).
High blood Pb levels were positively associated with hyperlipidemia in the null model, and the OR for hyperlipidemia across the quartiles of blood Pb levels was 1.00, 1.44 (95%CI: 1.34–1.54), 1.79 (95%CI: 1.65–1.95), and 1.85 (95%CI: 1.69–2.03) for Q1, Q2, Q3, and Q4, respectively. After adjusting for sex and age, the association was not significantly changed, and the OR of the blood Pb level quartiles was 1.00, 1.12 (95%CI: 1.04–1.20), 1.18 (95%CI: 1.08–1.29), and 1.08 (95%CI: 0.97–1.19) for Q1, Q2, Q3, and Q4, respectively. In the full mode, after further adjusting for race, education level, alcohol intake, smoking status, ratio of family income to poverty, diabetes, BMI, hypertension, and MET, the OR for hyperlipidemia across the blood Pb level quartiles was 1.00, 1.16 (95%CI: 1.04–1.29), 1.39 (95%CI: 1.21–1.59), and 1.33 (95%CI: 1.15–1.54) for Q1, Q2, Q3, and Q4, respectively (Table 2).
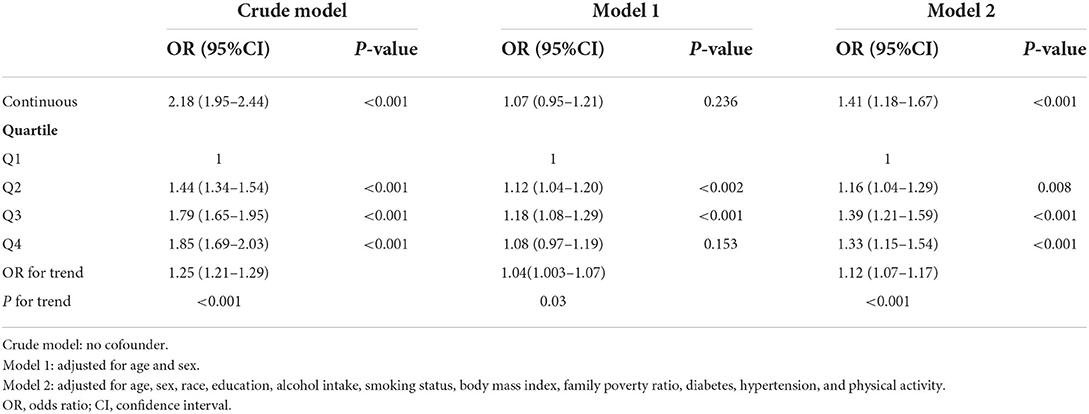
Table 2. Association between blood Pb and hyperlipidemia among US adults in NHANES 1999–2018.
In the full model, the log-blood Pb concentrations were associated with a higher risk of hyperlipidemia (OR 1.41, 95%CI: 1.18–1.67). A significant linear association was found between the quartiles of blood Pb levels and hyperlipidemia (P for trend <0.001 and <0.05) (Table 2). No interaction of blood Pb levels and hyperlipidemia with the sex and BMI subgroups was identified (Table 3). Significant moderating effects were found in the subgroup analysis stratified by age, education, hypertension, and diabetes (P < 0.05), and it appeared stronger among participants aged below 60 years (OR 2.42, 95%CI: 2.03–2.89), among those with high school education or above (OR 2.57, 95%CI: 2.12–3.11), among those without diabetes (OR 2.59, 95%CI: 2.16–3.11) and hypertension (OR 2.35, 95%CI: 1.96–2.82) (Table 3).
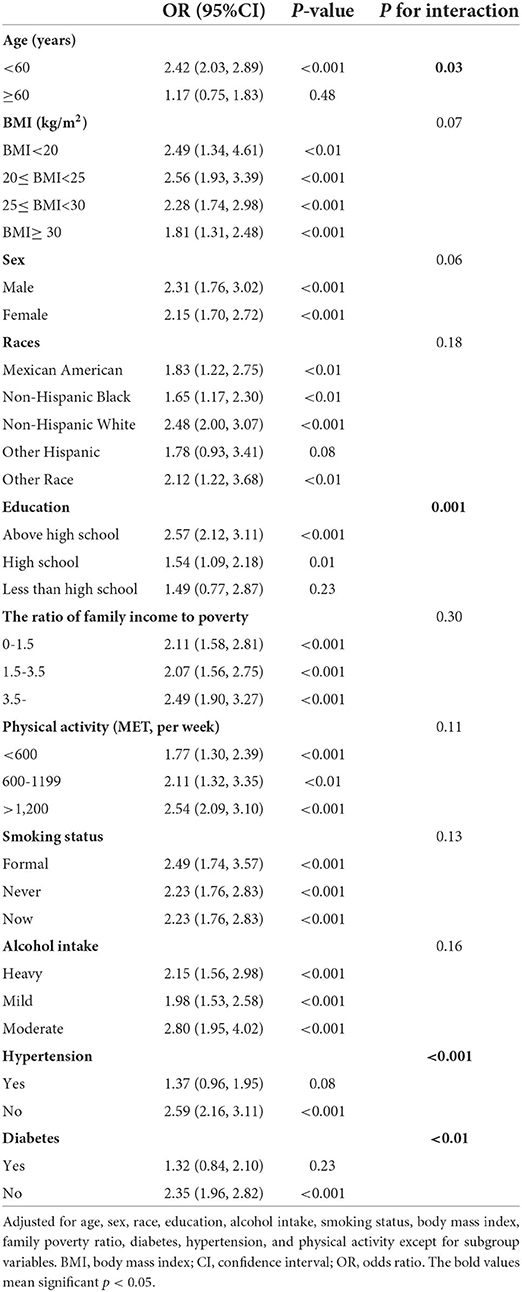
Table 3. Subgroup analysis of association between blood Pb and hyperlipidemia among US adults in NHANES 1999–2018.
An additional sensitively analysis was conducted in this study for which participants with arteriosclerotic cardiovascular disease were removed. In the full adjusted model, the OR for hyperlipidemia across the quartiles of blood Pb levels was 1.00, 1.17 (95%CI: 1.05–1.30), 1.42 (95%CI: 1.24–1.62), and 1.38 (95%CI: 1.19–1.60) for Q1, Q2, Q3, and Q4, respectively (P for trend <0.001) (Table 4). In the full analysis of including pregnant women, the OR for hyperlipidemia across the quartiles of blood Pb levels was 1.00, 1.13 (95%CI: 1.01–1.25), 1.38 (95%CI: 1.21–1.56), and 1.32 (95%CI: 1.16–1.52) for Q1, Q2, Q3, and Q4, respectively (P for trend <0.001) (Table 5).
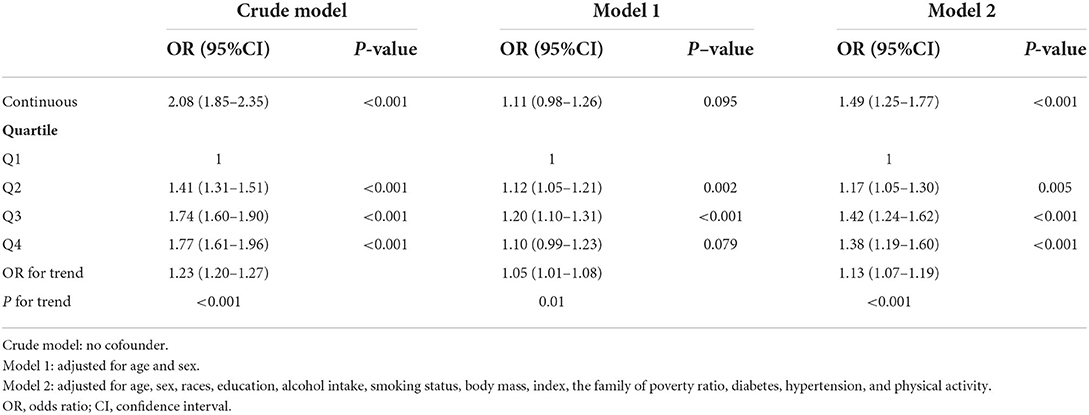
Table 4. Association between blood Pb and hyperlipidemia excluding arteriosclerotic cardiovascular disease among US adults in NHANES 1999–2018.
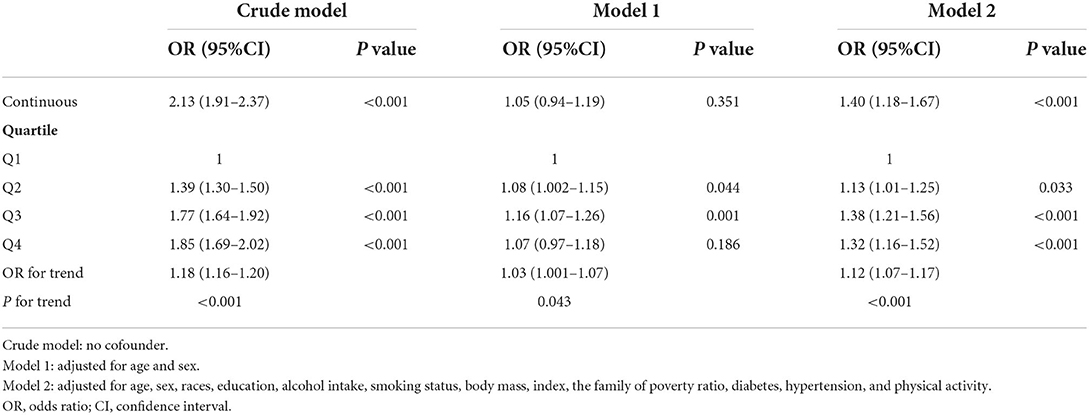
Table 5. Association between blood Pb and hyperlipidemia including pregnant women among US adults in NHANES 1999–2018.
The independent association between blood Pb levels and hyperlipidemia was determined in this study. Our results show an increasingly significant association between blood Pb levels and hyperlipidemia examined after full adjustment. Additionally, subgroup analyses showed significant moderating effects for age, hypertension, and diabetes.
A linear association between blood Pb levels and hyperlipidemia was highlighted in this study. A positive association between blood Pb levels and cholesterol has been observed in previous studies. For example, a national cross-sectional study in the US showed that persistent occupational exposure to Pb could significantly increase the cholesterol levels of workers (7). Another large national cross-sectional study conducted in the US for 7 years found that Pb exposure could exacerbate oxidative stress in pregnant women and elevate cholesterol concentrations (22). The Korean National Environmental Health Survey, including 2,591 Korean adults, reported that blood Pb, blood mercury (Hg), and urine Hg levels were significantly correlated with dyslipidemia (23). The association between Framingham risk scores (FRS) and blood Pb levels was supported in the Korean cross-sectional study involving 1,929 participants, which showed that blood Pb levels were correlated with high systolic blood pressure, FRS, and total cholesterol (24) and with low HDL levels. Therefore, our findings support the previous evidence that blood Pb levels could increase the risk of hyperlipidemia.
The underlying mechanism of blood Pb on hyperlipidemia could be related to oxidative stress (25, 26). The levels of 8-epi-PGF2alpha, a biomarker of oxidative stress, were positively associated with hypercholesterolemia (26). Pb can lead to oxidative stress by binding the sulfhydryl protein group and depleting glutathione, then releasing active oxygen species (26). Oxidative stress can lead to the onset of hyperlipidemia by inducing an inflammatory reaction (27). This reaction was involved in the pancreatic β-cells' apoptotic process associated with insulin generation, which modified glycemic homeostasis, leading to insulin resistance (28). This process can result in endothelial dysfunction due to a decrease in vasodilator generation and increase in vasoconstrictor production (29). Experimental studies have also found that chronic exposure to Pb could impair glucose metabolism and disrupt glucose homeostasis via pancreatic β-cell damage (6, 30).
In the subgroup analysis stratified by age, participants aged <60 years showed a stronger association between blood Pb levels and hyperlipidemia than those aged ≥60 years. Our study design was based on a cross-sectional study that cannot determine the influence of Pb exposure on individual children and adults. Therefore, the effect of blood Pb levels on chronic disease stratified by age could be underestimated. Furthermore, the onset of hyperlipidemia is more common in the aging population due to alterations of body function, but the hyperlipidemia group among adults <60 years old might indicate a worse environment or unhealthy diet habits and lifestyles (31, 32). Meanwhile, the hyperlipidemia status of young adults moderated the risk of subsequent coronary heart disease with aging (33). Hence, age stratification magnified the direct effect of blood Pb on hyperlipidemia. No other research has completely revealed the underlying association between Pb blood levels and potential mediating biological processes in the development of coronary vascular disease and time-varying effects, such as age.
In terms of education stratification, participants above high school had a stronger association between blood Pb levels and hyperlipidemia than other people. The causal evidence using mendelian randomization had demonstrated that high education attainment was associated with lower cardiovascular disease and ischemic stroke (34). Low education was always linked with unhealthier life choices (such as irregular diet, high frequency of smoking, and alcoholism), thereby increasing the risk of getting cardiovascular disease (35–37). Additionally, Pb exposure was associated with poverty, older housing, African and Hispanic dominated communities (38). In our subgroup model, people would experience the adverse effects of Pb exposure to hyperlipidemia at all education stages. However, participants with high education had a stronger risk for hyperlipidemia while exposure to high Pb environment. This result indicated that the hazard of Pb exposure on hyperlipidemia may be further enlarged in the group without long-term experience of Pb exposure.
In the subgroup analysis stratified by diabetes and hypertension, participants with no diabetes or hypertension had a stronger association between blood Pb levels and hyperlipidemia. “Survival-Selection” mechanism demonstrated that frail aging people might be premature death due to multiple disease and worse medical service, and the leaving aging people had some stronger characteristics, such as genetic and behavior (39). Additionally, participants with chronic disease may pay more attention on medical knowledge, thus decreasing injury of the hazardous substances to human body. Meanwhile, the cross-section involving Chinese and American participants across all age-stage population demonstrated that the obesity-diabetes association significantly decreased with aging, indicating that the modification of diabetes might be closer in adults than older people (40). In a previous study, the positive association between Pb and blood pressure, not hypertension, was determined (41). Therefore, the group with continuous blood pressure increase was a potentially sensitive subpopulation in this relationship chain.
The current study has several strengths. First, a 10-cycle national cross-sectional sample was used in the analysis, which improves the statistical power. Thus, the weighted results could be interpreted as a national representative sample for American adults. Second, sensitivity analysis decreases the risk of false positives. In this study, we removed the participants with arteriosclerotic cardiovascular disease, because this group might always have hypercholesterolemia. Third, the blood Pb levels were divided into quartiles, which increases between-group heterogeneity and increases interpretability.
This study has several limitations. First, a causal association between blood Pb levels and hyperlipidemia cannot be verified due to the limitation of the cross-sectional NHANES data. Second, the adverse effect of chronic Pb exposure on the body cannot be completely explained in our study. Some participants could have had contact with environmental Pb for a long time prior to the surveys; therefore, the research of life courses can be reliable for estimating the long-term causal effects. Third, we only investigated the independent relationship between Pb blood levels and hyperlipidemia. However, the relationship between heavy metal exposure and disease is interactive. The complex network of multiple heavy metals, such as lead, mercury, and cadmium, could be further examined.
The large-scale national US survey was analyzed in this study. Our findings highlight the significant association between high blood Pb levels and hyperlipidemia after adjusting for confounders. However, the results cannot establish a causal association, and further studies are needed.
Publicly available datasets were analyzed in this study. This data can be obtained at: https://www.cdc.gov/nchs/nhanes/index.htm.
The studies involving human participants were reviewed and approved by the studies involving human participants were reviewed and approved by the National Center for Health Statistics Institutional Ethics Review Board, and all participants agreed on the survey and provided their written informed consent to participate in this study.
YZ, WL, and XL contributed to the conception, analysis, interpretation of data, drafted the manuscript, and managed the final version for submission. WZ, RC, AT, SS, YX, and LZ contributed to analyzing and interpreting the data, commented on the report, and revised the manuscript. All authors have read and agreed on the published version of the manuscript. All authors contributed to the article and approved the submitted version.
This work was supported by the National Natural Science Foundation of China (No. 72174033) and the Science and Technology Research Project of Chongqing Education Commission (No. KJQN202100432).
We acknowledge the National Center for Health Statistics at the CDC, which was responsible for designing, collecting, and administering the NHANES data and making the data available for public use.
The authors declare that the research was conducted in the absence of any commercial or financial relationships that could be construed as a potential conflict of interest.
All claims expressed in this article are solely those of the authors and do not necessarily represent those of their affiliated organizations, or those of the publisher, the editors and the reviewers. Any product that may be evaluated in this article, or claim that may be made by its manufacturer, is not guaranteed or endorsed by the publisher.
NHANES, National Health and Nutrition Examination Survey; Pb, lead; BMI, body mass index; OR, odds ratio; CI, confidence interval; MET, metabolic equivalent; ASCVD, arteriosclerotic cardiovascular disease.
1. CDC. High Cholesterol in the United States. (2021). Available online at: https://www.cdc.gov/cholesterol/facts.htm (Accessed June 12, 2022).
2. Mozaffarian D, Benjamin EJ, Go AS, Arnett DK, Blaha MJ, Cushman M, et al. Heart disease and stroke statistics-2015 update: a report from the american heart association. Circulation. (2015) 131:e29–322.
3. EPA U. Prevent Choildhood Lead Poisoning. (2022). Available online at: https://www.epa.gov/lead/learn-about-lead (Accessed June 12, 2022).
4. Kabata-Pendias A, Szteke B. Trace elements in abiotic and biotic environments: CRC press (2015). 465 p. doi: 10.1201/b18198
5. Concha G, Eneroth H, Hallström H, Sand S. Contaminants and Minerals in Foods for Infants and Young Children. Uppsala: National Food Agency (2013).
6. Tyrrell JB, Hafida S, Stemmer P, Adhami A, Leff T. Lead (Pb) Exposure promotes diabetes in obese rodents. J Trace Elem Med Biol. (2017) 39:221–6. doi: 10.1016/j.jtemb.2016.10.007
7. Obeng-Gyasi E, Armijos RX, Weigel MM, Filippelli GM, Sayegh MA. Cardiovascular-related outcomes in US adults exposed to lead. Int J Environ Res Public Health. (2018) 15: 759. doi: 10.3390/ijerph15040759
8. Ademuyiwa O, Ugbaja RN, Idumebor F, Adebawo O. Plasma lipid profiles and risk of cardiovascular disease in occupational lead exposure in Abeokuta, Nigeria. Lipids Health Dis. (2005) 4:19. doi: 10.1186/1476-511x-4-19
9. Third Report of the National Cholesterol Education Program (Ncep) Expert panel on detection evaluation evaluation and treatment of high blood cholesterol in adults (Adult Treatment Panel Iii) final report. Circulation. (2002) 106:3143–421.
10. CDC. National Health and Nutrition Examination Survey. (2013). Available online at: https://wwwn.cdc.gov/Nchs/Nhanes/2007-2008/UPHOPM_E.htm#URX24D (Accessed June 11, 2022).
11. (CDC) CfDCaP. Nhanes 2017-2018 Laboratory Methods. (2020). Available online at: https://wwwn.cdc.gov/nchs/nhanes/continuousnhanes/labmethods.aspx?Cycle=2017-2018 (Accessed May 21, 2022).
12. (CDC) CfDCaP. Nhanes 2019-2020 Laboratory Methods. (2021). Available online at: https://wwwn.cdc.gov/nchs/nhanes/continuousnhanes/manuals.aspx?BeginYear=2019 (Accessed May 21, 2022).
13. (CDC) CfDCaP. National Health Nutrition Examination Survey 2015–2016 Data Documentation Codebook Frequencies Lead Cadmium Total Mercury Selenium & Manganese—Blood (Pbcd_I) Centers for Disease Control Prevention (CDC). (2018). Available online at: https://wwwn.cdc.gov/Nchs/Nhanes/2015-2016/PBCD_I.htm (Accessed May 21, 2022).
14. Cook MK, Zhang J, Wei Y. Blood lead levels and risk of deaths from cardiovascular disease. Am J Cardiol. (2022) 173:132–8. doi: 10.1016/j.amjcard.2022.03.002
15. Zhu K, Zhang Y, Lu Q, Geng T, Li R, Wan Z, et al. Associations of exposure to lead and cadmium with risk of all-cause and cardiovascular disease mortality among patients with Type 2 diabetes. Environ Sci Pollut Res Int. (2022) 1–11. doi: 10.1007/s11356-022-21273-z
16. Rahman HH, Niemann D, Munson-McGee SH. Association of albumin to creatinine ratio with urinary arsenic and metal exposure: evidence from nhanes 2015–2016. Int Urol Nephrol. (2022) 54:1343–53. doi: 10.1007/s11255-021-03018-y
17. Phillips JA. Dietary guidelines for Americans, 2020–2025. Workplace Health Saf. (2021) 69:395. doi: 10.1177/21650799211026980
18. Naimi TS, Brewer RD, Mokdad A, Denny C, Serdula MK, Marks JS. Binge drinking among Us adults. Jama. (2003) 289:70–5. doi: 10.1001/jama.289.1.70
19. Ainsworth BE, Haskell WL, Leon AS, Jacobs DR. Jr., Montoye HJ, Sallis JF, et al. Compendium of physical activities: classification of energy costs of human physical activities. Med Sci Sports Exerc. (1993) 25:71–80. doi: 10.1249/00005768-199301000-00011
20. Seidell JC, Deurenberg P, Hautvast JG. Obesity and fat distribution in relation to health—current insights and recommendations. World Rev Nutr Diet. (1987) 50:57–91. doi: 10.1159/000414170
21. Association AD. Understanding A1c Diagnosis. (2022). Available online at: https://www.diabetes.org/diabetes/a1c/diagnosis (Accessed May 31, 2022).
22. Obeng-Gyasi E. Cholesterol and oxidative stress in US pregnant women exposed to lead. Med Sci. (2019) 7:42. doi: 10.3390/medsci7030042
23. Kim DW, Ock J, Moon KW, Park CH. Association between heavy metal exposure and dyslipidemia among korean adults: from the Korean national environmental health survey, 2015–2017. Int J Environ Res Public Health. (2022) 19:3181. doi: 10.3390/ijerph19063181
24. Park Y, Han J. Blood lead levels and cardiovascular disease risk: results from the Korean national health and nutrition examination survey. Int J Environ Res Public Health. (2021) 18:10315. doi: 10.3390/ijerph181910315
25. Sleiti AK. Dataset for measured viscosity of polyalpha-olefin- boron nitride nanofluids. Data Brief. (2021) 35:106881. doi: 10.1016/j.dib.2021.106881
26. Oguogho A, Ferlitsch A, Sinzinger H. Ldl-apheresis decreases plasma levels and urinary excretion of 8-epi-Pgf2alpha. Prostaglandins Leukot Essent Fatty Acids. (2000) 62:209–16. doi: 10.1054/plef.2000.0145
27. Soujanya KV, Jayadeep AP. Obesity-associated biochemical markers of inflammation and the role of grain phytochemicals. J Food Biochem. (2022) e14257. doi: 10.1111/jfbc.14257
28. Jones JG. Hepatic glucose and lipid metabolism. Diabetologia. (2016) 59:1098–103. doi: 10.1007/s00125-016-3940-5
29. Rask-Madsen C, King GL. Mechanisms of disease: endothelial dysfunction in insulin resistance and diabetes. Nat Clin Pract Endocrinol Metab. (2007) 3:46–56. doi: 10.1038/ncpendmet0366
30. Mostafalou S, Baeeri M, Bahadar H, Soltany-Rezaee-Rad M, Gholami M, Abdollahi M. Molecular mechanisms involved in lead induced disruption of hepatic and pancreatic glucose metabolism. Environ Toxicol Pharmacol. (2015) 39:16–26. doi: 10.1016/j.etap.2014.11.001
31. Umer A, Kelley GA, Cottrell LE, Giacobbi P. Jr., Innes KE, Lilly CL. Childhood obesity and adult cardiovascular disease risk factors: a systematic review with meta-analysis. BMC Public Health. (2017) 17:683. doi: 10.1186/s12889-017-4691-z
32. Skinner AC, Perrin EM, Moss LA, Skelton JA. Cardiometabolic risks and severity of obesity in children and young adults. N Engl J Med. (2015) 373:1307–17. doi: 10.1056/NEJMoa1502821
33. Navar-Boggan AM, Peterson ED, D'Agostino RB. Sr., Neely B, Sniderman AD, Pencina MJ. Hyperlipidemia in early adulthood increases long-term risk of coronary heart disease. Circulation. (2015) 131:451–8. doi: 10.1161/circulationaha.114.012477
34. Jia Y, Wang R, Guo D, Sun L, Shi M, Zhang K, et al. Contribution of metabolic risk factors and lifestyle behaviors to cardiovascular disease: a mendelian randomization study. Nutr Metab Cardiovasc Dis. (2022) 32:1972–81. doi: 10.1016/j.numecd.2022.04.019
35. Liao LZ, Chen ZC Li WD, Zhuang XD, Liao XX. Causal effect of education on type 2 diabetes: a network mendelian randomization study. World J Diabetes. (2021) 12:261–77. doi: 10.4239/wjd.v12.i3.261
36. Tillmann T, Vaucher J, Okbay A, Pikhart H, Peasey A, Kubinova R, et al. Education and coronary heart disease: mendelian randomisation study. Bmj. (2017) 358:j3542. doi: 10.1136/bmj.j3542
37. Shi X, Yuan W, Cao Q, Cui W. Education plays a crucial role in the pathway from poverty to smoking: a mendelian randomization study. Addiction. (2022) 1–12. doi: 10.1111/add.16019
38. Hauptman M, Niles JK, Gudin J, Kaufman HW. Individual- and community-level factors associated with detectable and elevated blood lead levels in us children: results from a national clinical laboratory. JAMA Pediatr. (2021) 175:1252–60. doi: 10.1001/jamapediatrics.2021.3518
39. Glymour MM, Weuve J, Chen JT. Methodological challenges in causal research on racial and ethnic patterns of cognitive trajectories: measurement, selection, and bias. Neuropsychol Rev. (2008) 18:194–213. doi: 10.1007/s11065-008-9066-x
40. Zhou Q, Sun J, Wu Z, Wu W, Zhang X, Pan Q, et al. The older, the less potential benefit for type 2 diabetes from weight control. BMC Geriatr. (2022) 22:346. doi: 10.1186/s12877-022-02979-8
Keywords: blood, lead, hyperlipidemia, NHANES, environment pollution, adults
Citation: Zhang Y, Liu W, Zhang W, Cheng R, Tan A, Shen S, Xiong Y, Zhao L and Lei X (2022) Association between blood lead levels and hyperlipidemiais: Results from the NHANES (1999–2018). Front. Public Health 10:981749. doi: 10.3389/fpubh.2022.981749
Received: 29 June 2022; Accepted: 22 August 2022;
Published: 09 September 2022.
Edited by:
Guang Hao, Jinan University, ChinaReviewed by:
Hui Zeng, Peking Union Medical College (CAS), ChinaCopyright © 2022 Zhang, Liu, Zhang, Cheng, Tan, Shen, Xiong, Zhao and Lei. This is an open-access article distributed under the terms of the Creative Commons Attribution License (CC BY). The use, distribution or reproduction in other forums is permitted, provided the original author(s) and the copyright owner(s) are credited and that the original publication in this journal is cited, in accordance with accepted academic practice. No use, distribution or reproduction is permitted which does not comply with these terms.
*Correspondence: Xun Lei, bGVpeHVuNTIxQGNxbXUuZWR1LmNu
†These authors have contributed equally to this work
Disclaimer: All claims expressed in this article are solely those of the authors and do not necessarily represent those of their affiliated organizations, or those of the publisher, the editors and the reviewers. Any product that may be evaluated in this article or claim that may be made by its manufacturer is not guaranteed or endorsed by the publisher.
Research integrity at Frontiers
Learn more about the work of our research integrity team to safeguard the quality of each article we publish.