 Yu-Jun Fan1
 Pei-Xi Wang
- 1School of Nursing and Health, Institute of Chronic Disease Risks Assessment, Henan University, Kaifeng, China
- 2General Practice Center, The Seventh Affiliated Hospital, Southern Medical University, Foshan, China
- 3School of Medical, Huanghe Science and Technology University, Zhengzhou, China
Background: This study was designed to analyze the relationship of waist circumference (WC), body mass index (BMI), waist-to-hip ratio (WHR), waist-to-height ratio (WHtR), relative fat mass (RFM), lipid accumulation product (LAP) and health-related quality of life (HRQoL) in the community-dwelling population of southern China and to explore the independent contribution of socio-demographic characteristics, number of chronic diseases and anthropometric indicators to HRQoL in that population.
Methods: This community-based cross-sectional survey studied 2,663 adults aged 18 years and older. HRQoL was assessed by the 3-level EuroQol 5-dimensional scale (EQ-5D-3L), and HRQoL were calculated using the Chinese EQ-5D-3L value set. The outcome variable was the EQ-5D-3L score (HRQoL). Cluster regression was used to analyse the independent contribution of each obesity indicator to HRQoL.
Results: A total of 2,663 people participated in this study, and their mean EQ-5D-3L score was 0.938 ± 0.072. In this study, according to the results of the one-way ANOVA, HRQoL was significantly different between the groups of WHtR, WHR, RFM and LAP, respectively. The independent contributions of socio-demographic factors, number of chronic diseases and anthropometric measures to HRQoL in the whole population accounted for 76.2, 7.9, and 15.9% of the total effect, respectively.
Conclusion: RFM and LAP were found to have a previously unreported negative impact on HRQoL in a community-dwelling population. In future studies, RFM and LAP could be used as new indicators of obesity to predict quality of life in humans.
Introduction
With the development of society, people's eating behaviors and lifestyles have changed significantly, causing a significant increase in overweight and obesity, and the prevalence of these conditions is rapidly increasing not only in developed countries but also in developing countries, becoming a serious public health problem on a global scale (1). As of 2020, more than half of adult residents in China were overweight or obese, and the prevalence of overweight and obesity was 19% in young people aged 6–17 years and 10.4% in children under 6 years old (2). With the increasing number of obese people, obesity has been recognized as a public health problem in the Report on the Status of Nutrition and Chronic Diseases in China (2020) (3). Obesity is a risk factor for many chronic diseases, and numerous studies have shown that overweight and obesity increase the risk of diabetes, hypertension, coronary heart disease, and many other diseases (4, 5). It has also been shown that obesity and its comorbidities also come with a significant psychosocial burden, impacting numerous areas of psychosocial functioning (6, 7).
In addition, evidence from the Framingham Heart Study suggests that an increased risk of disease can lead to a large reduction in life expectancy (8). Many medical conditions associated with obesity not only increase the risk of death but also potentially affect the individual's health-related quality of life (HRQoL) (9). HRQoL is currently receiving increasing attention as a good, accurate indicator of health status. This variable provides a comprehensive assessment of a subject's physical activity functioning, mental health and social adjustment as well as the subject's self-perception of life and health (10, 11). A growing number of studies suggest that obesity is a risk factor for reduced HRQoL (12–14). Sach's study showed, after controlling for confounding factors, that obese people tended to have lower HRQoL than to people of normal weight (15). Jia (16) also showed that HRQoL decreased as the severity of obesity increased. Compared with normal-weight respondents, persons with severe obesity had significantly reduced scores on the 12-Item Short Form Survey Physical Component Summary (PCS-12) and Mental Component Summary (MCS-12), EuroQol 5-dimensional scale (EQ-5D), and EuroQol visual analog scale (EQ VAS). Persons who were overweight or moderately obese also had significantly poorer HRQoL than people of normal weight.
Currently, body mass index (BMI), waist circumference (WC), waist-to-height ratio (WHtR) and waist-to-hip ratio (WHR) are the most commonly used criteria for obesity. However, these traditional obesity indices reflect only the degree of overweight and abdominal obesity and do not distinguish between subcutaneous and visceral fat (17). Furthermore, unlike abdominal obesity (indicated by WC and WHtR) and general obesity (indicated by BMI), peripheral adiposity and larger hip circumference may offer protection from T2DM, cerebrovascular disease, and premature death (18). Among the population, the mechanism of the obesity paradox is largely due to better nutritional status and higher muscle retention (19). Considering the opposing effects of central obesity and peripheral adiposity, an indicator that assesses both masses simultaneously may better evaluate the risk of obesity on HRQoL than indicators that separately estimate either central obesity or peripheral adiposity; for example, waist–hip ratio (WHR). However, WHR may mask central obesity if both hip circumference and WC increase. Recent studies have used the relative fat mass (RFM) and the lipid accumulation product (LAP) index to assess the percentage of total body fat and the degree of obesity. Those studies have shown that RFM and LAP correlate significantly with cardiovascular disease and are better cardiovascular risk indicators than BMI or WC (20–22). Therefore, the obesity paradox in populations may be related to the use of BMI and WC, which are prone to measurement accuracies and mixed nutritional factors and are, thus, not suitable for evaluating obesity in populations, especially in the elders. However, no scholar has yet studied the relationship among RFM, LAP and HRQoL. Furthermore, research on the relationship between obesity and HRQoL in the community is very limited. The present study assumed that BMI, WC, WHR, WHtR, RFM, and LAP were negatively correlated with HRQoL.
Therefore, considering the increasing prevalence of obesity and the lack of detailed studies on the relationship between novel anthropometric indicators and HRQoL, we conducted a cross-sectional analysis of adults aged ≥18 years in southern China. Therefore, this study aimed to use a population-based survey to examine the association between HRQoL and different anthropometric indicators and to explore the different influences and independent effects of these indicators on the HRQoL of community residents. The findings may complement current research on the relationship between obesity and HRQoL and may also provide supporting information for healthcare professionals and policymakers to provide services and develop programs to improve the HRQoL of the Chinese population.
Materials and methods
Study design and sample
A cross-sectional community-based health survey was conducted in Foshan City, Guangdong Province, southern China. Participants were recruited in March 2017. The detailed sampling strategy for this survey has been described in a published study by our research team (21). Given our focus on adult demographics, we only analyzed respondents aged 18 years and older. Participants were excluded from the study if they had physical dysfunctions that may potentially affect the measurements and those who had not completed the questionnaires or had not completed the physical fitness tests. There were 3760 eligible subjects, among which 341 subjects were excluded for the lack of complete data on demographic characteristics and 756 subjects were excluded for the missing or invalid data on anthropometric tests and laboratory examinations related indexes. After excluding, a total of 2,663 adult respondents were included in this study (Figure 1).
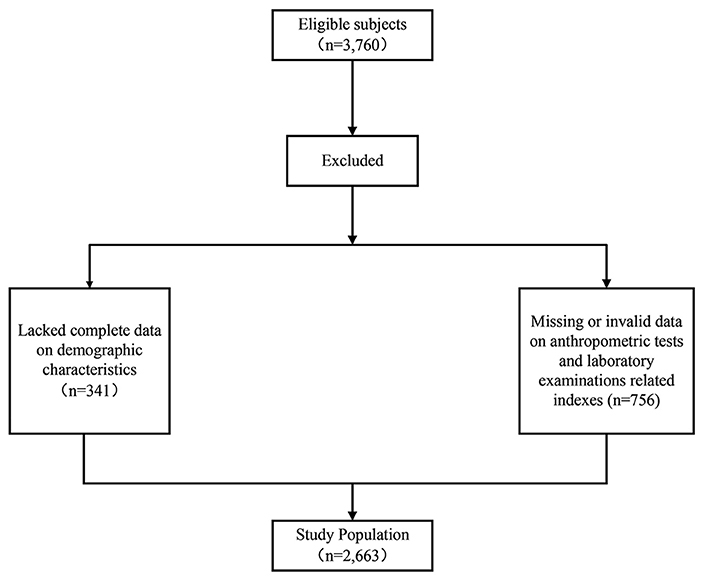
Figure 1. Flowchart in the selection of study population.
Data collection
With the assistance of well-trained investigators, standardized questionnaires were used to collect information about demographic characteristics (gender, age, marital status, education level, and mean monthly income), number of chronic diseases (e.g., hypertension, diabetes), and anthropometric indicators (WC, BMI, WHR, WHtR, RFM, and LAP).
General study questionnaire
Information on participants was gathered through a standard questionnaire including gender, age, marital status, educational level, monthly income, and chronic conditions. The chronic diseases considered in the survey included hypertension, dyslipidaemia, diabetes, stroke, cardiopathy, chronic gastroenteritis, cancer, osteoporosis, and bronchial asthma; subjects self-reported whether they suffered from each of these conditions. Marital status was classified as “unmarried,” “married,” or “other;” “divorced/widowed” was regarded as “other.” Educational level was categorized as “primary school or lower,” “junior high school” and “senior high school or above.” In this study, the definition of “unemployed' included all subjects who were out of work, regardless of whether they were looking for work or not (23).
HRQoL assessment tool
HRQoL was measured by the 3-level version of the EQ-5D (the EQ-5D-3L), which included both a health description system (EQ-5D index) and Visual Analog Scale (VAS). The EQ-5D-3L is a generic HRQoL measure which can compare HRQoL in populations (11, 24). This instrument has been widely demonstrated to have good reliability and validity in different populations. The first section records self-assessed health status based on five dimensions: mobility, self-care, daily activities, pain/discomfort, and anxiety/depression. Each dimension consists of three levels: no problems, some problems, and extreme problems (25). A total of 243 health state can be expressed by combining the different level from each dimension. This is then transformed into a weighted health state index score (EQ-5D index) by the Chinese time trade-off value, which is a conversion weight from health utility measurements designed based on the HRQoL preferences of Chinese populations. The Chinese form of the EQ-5D indicator has a value range of – 0.149 to 1 (26). The second component is used to assess the level of self-perceived health, ranging from 0 to 100. On this scale, 0 represents the worst conceivable state of health, and 100 represents the best conceivable state of health. The VAS can be invoked as a quantitative measure of a participant's self-judged health outcomes.
In this study, the EQ-5D health utility score was used to assess health-related quality of life. The health status was converted into a score using a utility value conversion table based on the respondents' choice of 3 levels of the 5 dimensions, with scores ranging from – 0.149 to 1 (26).
Anthropometric tests and laboratory examinations
Participants wore light clothing, took off their shoes, and had their weight and height measured by staff. WC (cm) was recorded at a level 1 cm above the navel. Hip circumference (cm) was measured at the level of the rearmost part of the hips, with the participant standing naturally. All the above measurements were performed twice, and the average value of the two measurements was the final measurement value. Subjects were fasted (fasted for at least 8 h) in the early morning, and blood samples were harvested from the median cubital vein by a medical professional to assess their fasting glucose, total cholesterol, and triglyceride levels. Blood collection was carried out by clinical staff and nurses following standard procedures (21).
BMI was calculated as weight in kilograms divided by the square of height in meters. The waist-to-height ratio (WHtR) was calculated as [WC (cm)/height (cm)]. The WHR was defined as the participant's WC (cm) divided by the participant's hip circumference (cm). RFM was calculated as [64 – (20× (height/WC)) + (12× sex)]. In the formula, height and WC are expressed in meters, and sex = 0 for males and 1 for females (20). LAP was calculated as (WC−60.6) × (TG [mmol/L]) in males and (WC−54.1) × (TG [mmol/L]) in females based on actual data from the population of South China (21). The cut-off points for BMI, WC, WHR, RFM, WHtR and LAP quartiles are shown in Table 2.
Statistical analysis
The SPSS 24.0 were used for data analysis (Chicago, IL, USA). The association among socio-demographic, chronic diseases, anthropometric indices, and HRQoL was assessed using univariate and multivariate analyses. Univariate analyses included one-way ANOVA, and multivariate analysis was performed by entering variables in a clustered multiple linear regression analysis, in which HRQoL was used as a dependent variable, and the variables in the three clusters were used as independent variables. A two-sided statistical significance level of 0.05 was applied for all analyses.
Specifically, clustered multiple linear regression analysis was used to explore the effects of socio-demographic variables, number of chronic diseases, and anthropometric indicators (3 clusters based on the nature of the study variables) on the HRQoL of community residents and to estimate their independent contributions to HRQoL. The model considered the possibility of a multidirectional association between the 3 clusters of the independent and dependent variables, as shown in Figure 2. In other words, socio-demographic variables (Cluster 1) may influence the number of chronic diseases (Cluster 2), with anthropometric indicators (Cluster 3), and the dependent variable (HRQoL). Similarly, Cluster 2 may affect Cluster 3 and the dependent variable. Cluster 3 may affect only the dependent variable. Therefore, variables in the former cluster may affect variables in the latter cluster, but not vice versa. We determined the final regression model in 3 steps, which were described in a previous study (27, 28): (1) an entry regression for HRQoL for the Cluster 1 variable; (2) the equation derived in step 1 was used as a fixed part of the new regression model for the Cluster 2 variable; and (3) the equation derived in step 2 was used as a fixed part of the new regression model for the Cluster 3 variable. The inclusion and exclusion criteria for entering variables into the regression model were P values of 0.05 and 0.10, respectively.
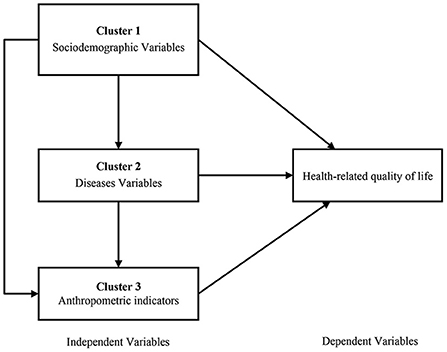
Figure 2. The clustered multiple linear regression model and multidirectional associations (the direction of the impact is indicated by the direction of the arrows).
The independent effect of each cluster on the dependent variable was established by calculating the corresponding R2 value. Then, the independent contribution of each cluster was calculated by (individual R2 change/total R2 change) × 100% (29).
Results
Participant characteristics
In our analyses, a total of 2,663 participants aged 18 and above were enrolled, including 1356 males (50.9%) and 1307 females (49.1%). For males, 62.09% of respondents had received only a junior high school education or less. A total of 79.13% of men are working, and more than half of the respondents are under a monthly income of less than 3,000 RMB. Only 33.21% of women had received a senior high school education or higher. Regarding marital status, 13.08% of females were unmarried, 80.87% were married, and 6.04% were divorced or widowed. Table 1 displays the demographic characteristics of the subjects.
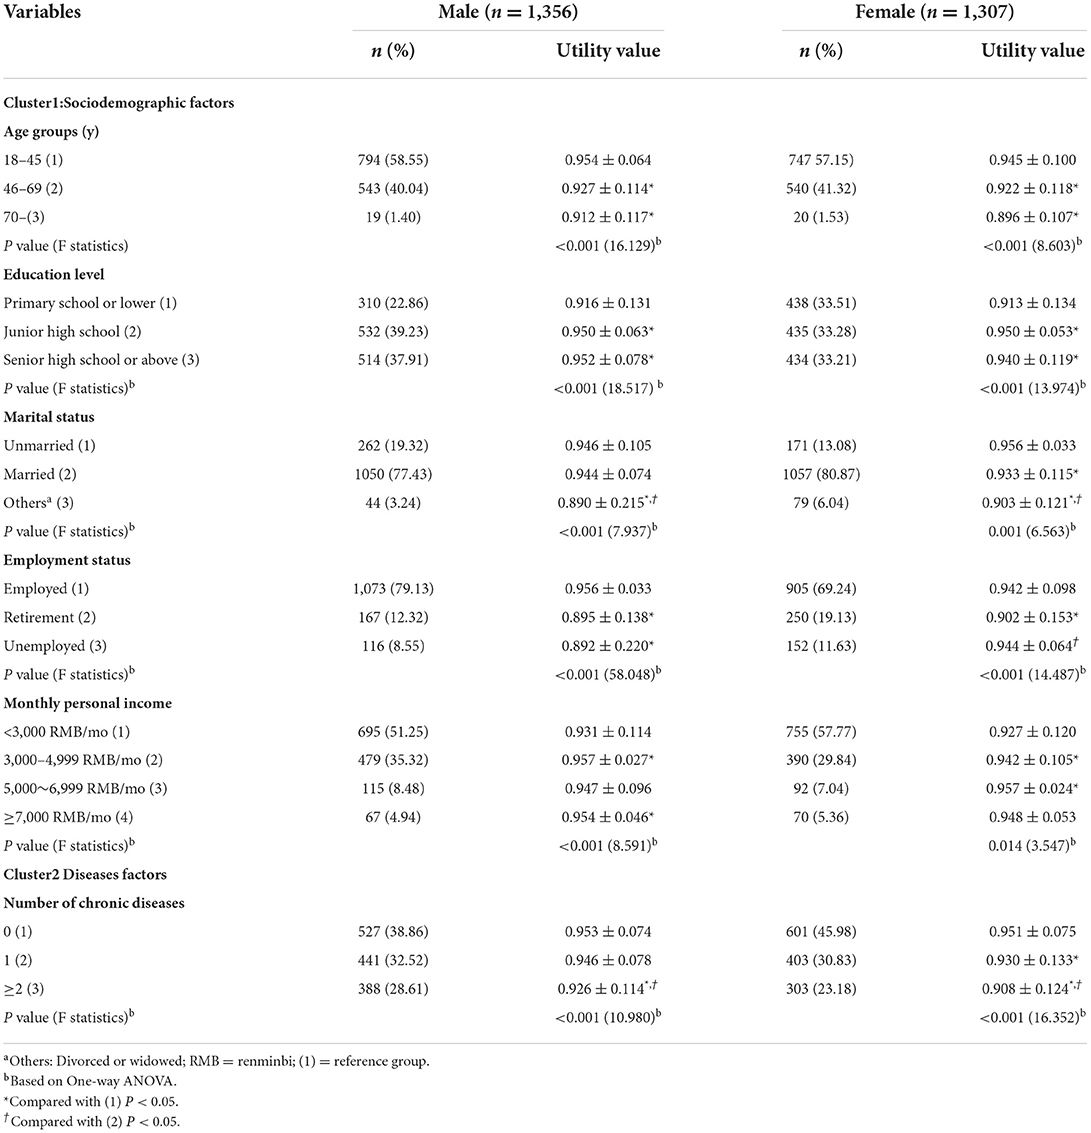
Table 1. Comparison of HRQoL of community residents with different demographic characteristics by gender (n = 2,663).
The score of EQ-5D-3L is shown in Table 1. The results obtained from univariate analyses indicated that HRQoL for males were between-group differences in age, education, marital status, employment status, monthly personal income, and chronic disease. And the differences were statistically significant (all P < 0.05). However, the HRQoL for females were between-group differences in age, education level, marital status, employment status, monthly personal income, and chronic diseases. And the differences were statistically significant (all P < 0.05).
Association of HRQoL with different anthropometric indicators
Table 2 presents the HRQoL at different anthropometric indicators (BMI, WC, WHtR, WHR, RFM, and LAP) for males and females. From the results of statistical analysis, it can be observed that HRQoL decrease with increasing quartiles of anthropometric indicators (BMI, WC, WHtR, WHR, RFM, and LAP). Among the male population, the HRQoL was significantly different among quartiles of WHtR, WHR and RFM. For females, there were significant differences in HRQoL among quartiles of WC, WHtR, WHR, RFM, and LAP (all P < 0.05).
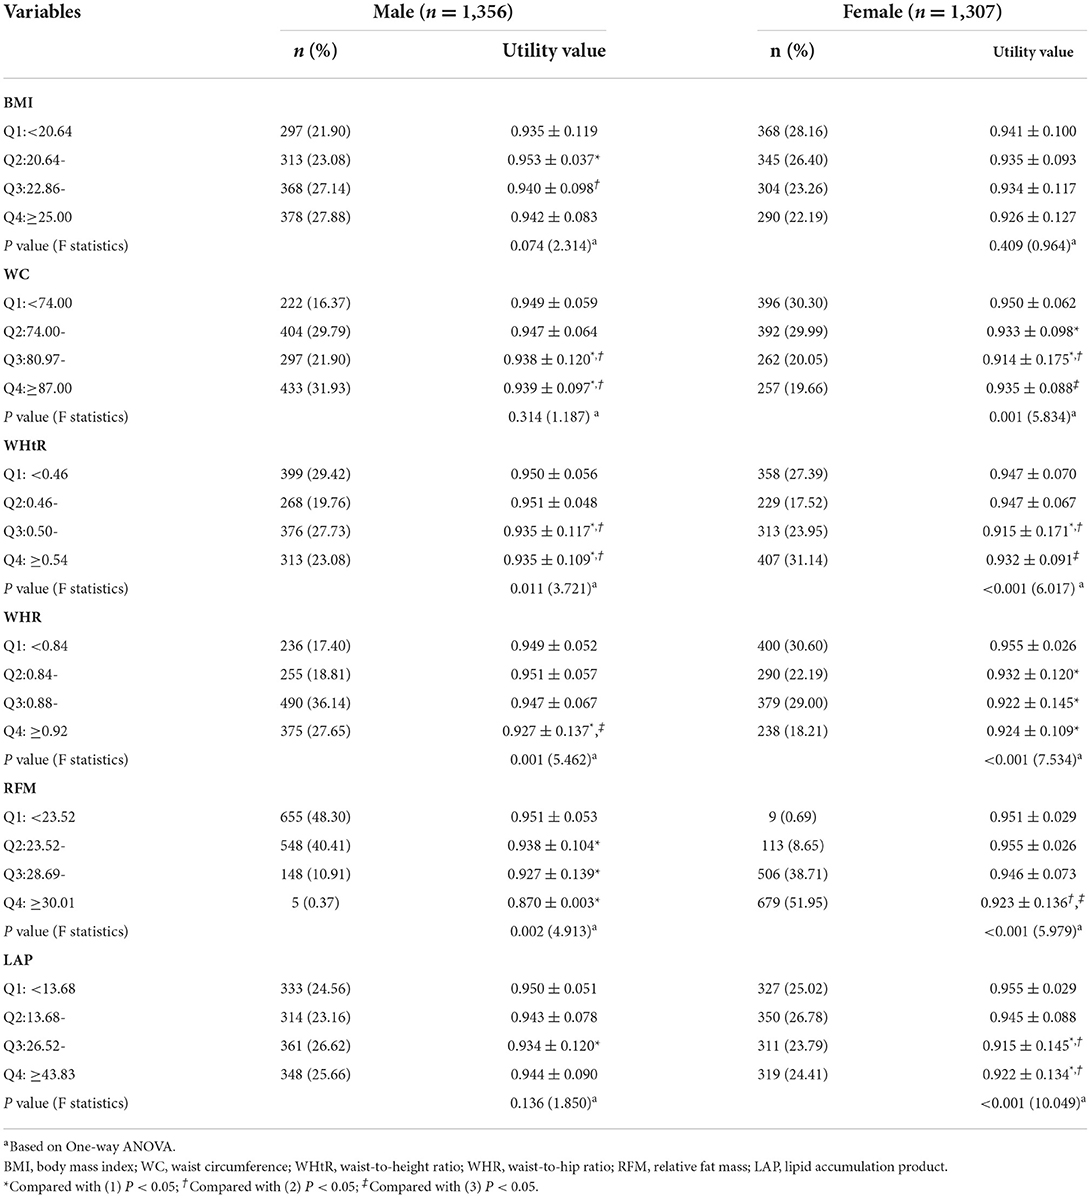
Table 2. Comparison of HRQoL of community residents with different levels of anthropometric indicators by gender (n = 2,663).
Clustered multiple linear regression analysis
After adjustment for variables, our results showed that socio-demographics and anthropometric indicators were demonstrated to be significant predictors of the HRQoL. In the total population, the independent contributions of sociodemographic variables and anthropometric indicators to HRQoL were 76.2 and 15.9%, respectively. In the male population, the independent contribution of sociodemographic variables and anthropometric indicators to HRQoL was 86.9 and 10.3%, respectively. In the female population, the independent contributions of sociodemographic variables and anthropometric indicators to HRQoL were 55.2 and 31.0%, respectively (as shown in Tables 3, 4). On these subscales, in the overall population and in males specifically, residents with high BMI had worse HRQoL than those with low BMI. Among women, residents with greater WC had worse HRQoL than those with smaller WC.
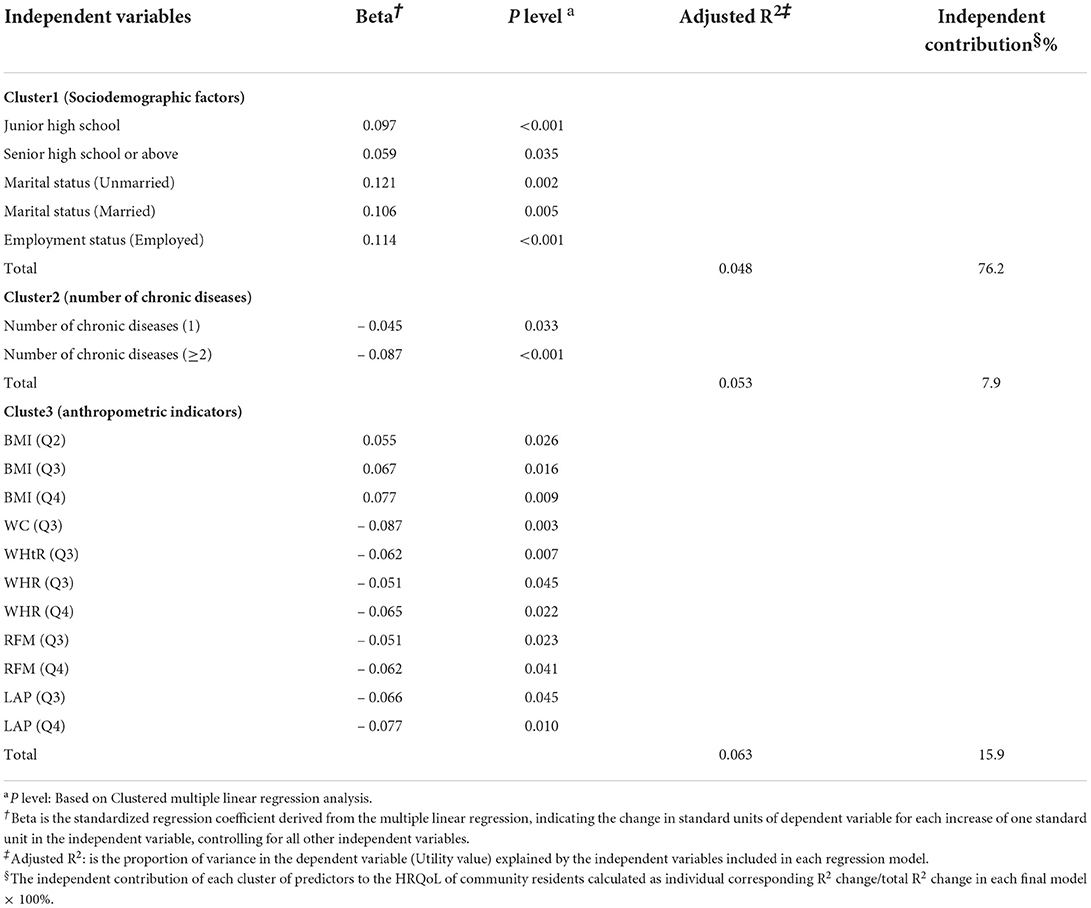
Table 3. Clustered multiple linear regression analysis of the HRQoL of community residents (n = 2,663).
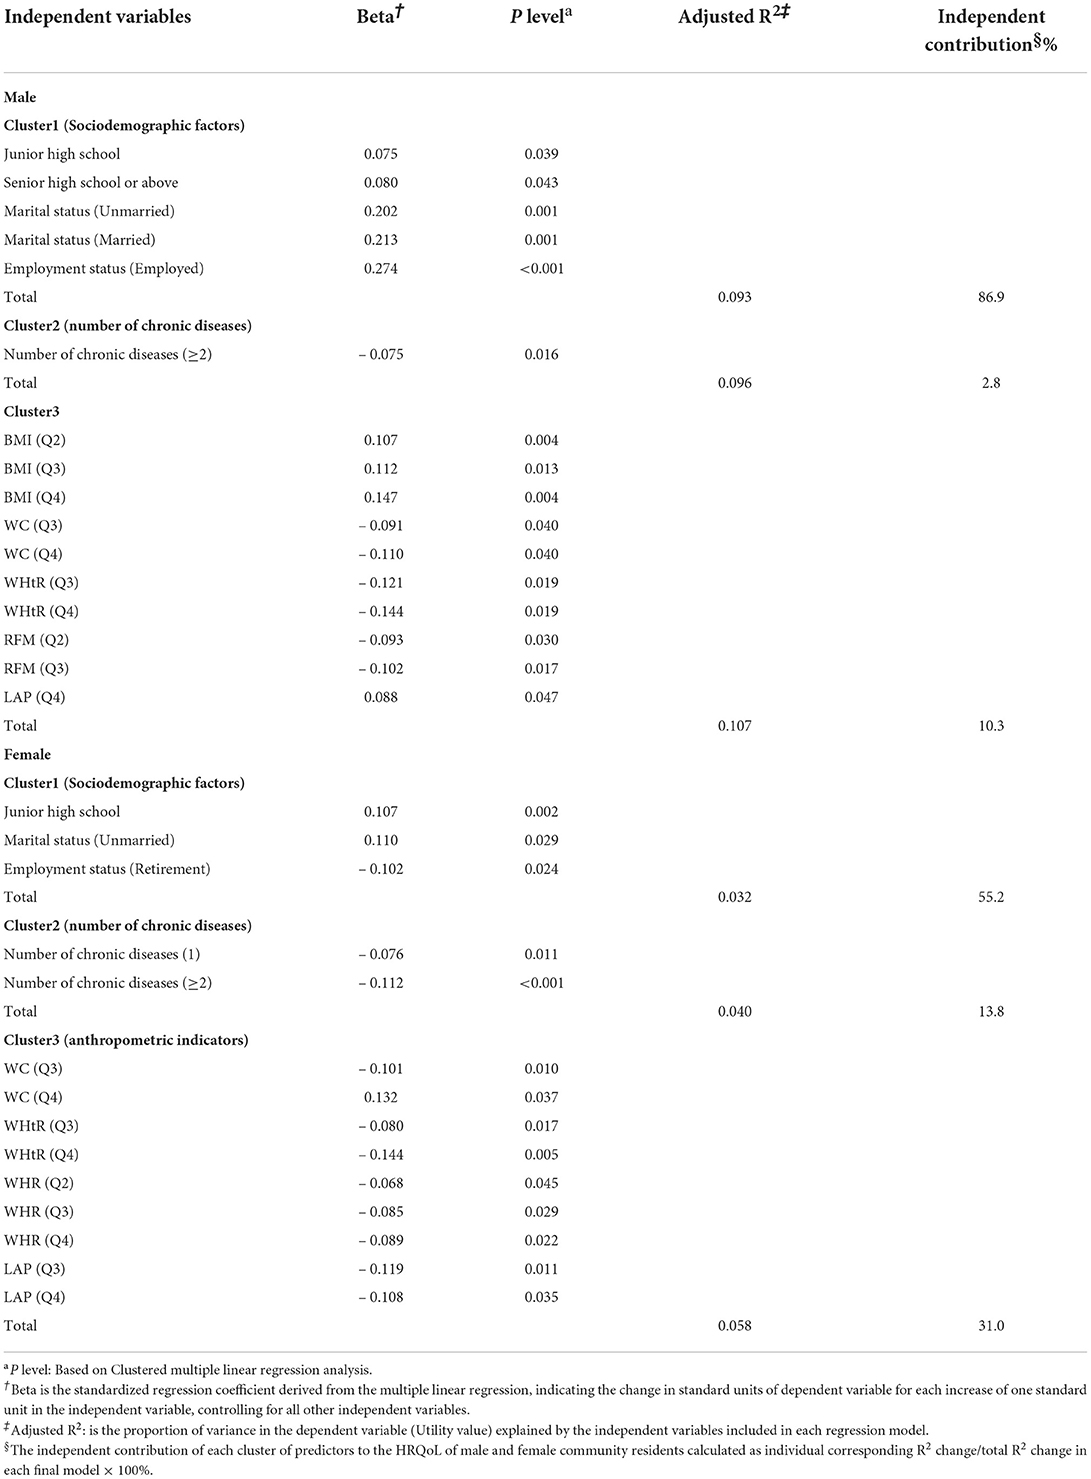
Table 4. Clustered multiple linear regression analysis of the HRQoL of male and female community residents (n = 2,663).
The independent contributions of the 3 abovementioned clusters to HRQoL in the overall population, in males specifically, and in females specifically are illustrated in Figure 3.
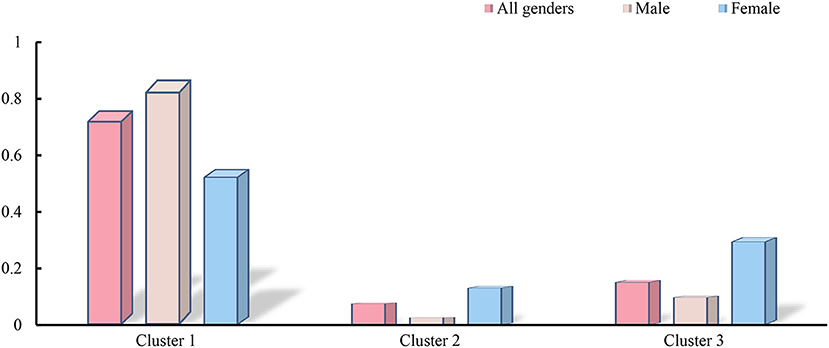
Figure 3. The panel shows the independent contributions of the 3 clusters to the health utility values. Cluster1 include Sociodemographic factors, Cluster2 include Diseases factors and Cluster3 include Anthropometric indicators.
Discussion
This study investigated the relationship between anthropometric indicators and HRQoL in community residents in southern China. In this study, six anthropometric indicators, BMI, WC, WHtR, WHR, RFM, and LAP, were used to compare and assess the associations with HRQoL. It was observed in this study that WHtR, WHR, RFM, and LAP were negatively associated with HRQoL. This may be related to the fact that the RFM and LAP in the community resident groups reflect the nutritional status and functional maintenance status of the body (20). This study is the first to record the association between RFM, LAP and HRQoL.
The EQ-5D score in this sample was 0.938 ± 0.072, slightly higher than the value reported in the fifth Health Service Survey of Shanxi Province in 2013 (30). The reason for this difference may be due to the time of the survey and the different distribution areas of the sample. First, compared with 2013, the level of medical care (31), social welfare (32), and people's living standards have significantly improved. And some studies have shown that social welfare engagement can significantly improve people's quality of life (33), so the quality of life of the participants in this study will be better than the survey population in 2013. Secondly, the survey population in this study is from the south, which is more economically prosperous than the north and has a more developed health insurance system. Since residents in the southern region have better medical benefits (34). And some studies have shown that participants with better economic status have better health-related quality of life (35), so standard of living and HRQoL in this study might be higher. We found that the differences in age, sex, education, employment and marital status of HRQoL in this study were consistent with the published literature (36–38). As people age, they can develop a range of health problems that can affect their HRQoL (39). At the same time, older participants tended to have more physical and cognitive functioning problems than younger participants (40), possibly leading to a decrease in HRQoL with age. In addition, the results of this study showed that the decline in quality of life may be influenced by the state of work. Retired and unemployed people have worse HRQoL than those who are employed. This may be due to the unstable mental state of the unemployed person Some studies have shown that the unemployed—the long-term unemployed in particular—exhibit higher levels of distress, psychiatric symptoms, and self-harm than the employed (23, 41, 42). Those who have just retired are not yet comfortable with the change in role and may also be affected by aspects of their physical condition (43, 44). This is consistent with a Korean study on the quality of life after retirement for different age groups (45). The most significant factors affecting quality of life for adults in midlife were financial status and mental health, while for those in their 50s, mental health and family relationships were the primary factors, followed by physical states (46). The HRQoL observed in our study was generally higher in males than in females, consistent with previous findings (47–49). However, inconsistent with another study on the EQ-5D-5L criteria for the Chinese urban population, their findings showed that women had greater HRQoL than men, possibly due to the different composition of the two study samples and the fact that women were in a higher socio-economic group in their study (50).
There is limited research on the effect of obesity on HRQoL in community populations, with most studies focusing on the relationship between BMI and HRQoL. Studies of this effect in Spanish adults have shown that HRQoL decreases with decreasing BMI (51). Most studies in adults have assessed HRQoL using the 36-Item Short Form Survey (SF-36) or the EQ-5D, confirming a significant negative correlation between BMI and HRQoL (7, 13, 14). In contrast, the obesity paradox in the elderly population shows that obese elderly and obese patients have higher HRQoL, better prognosis, lower disability and lower mortality than normal weight elderly and chronically ill patients (19, 52, 53). Nonetheless, no statistically significant association was found between BMI and HRQoL in this study. However, the criteria used to assess obesity in these studies may make it difficult to accurately measure height in older adults due to the natural progression of aging. Second, it is difficult to exclude the effects of nutrition and muscle retention from WC measurements; therefore, the conclusion that obesity facilitates the maintenance of a better HRQoL is biased. Furthermore, WHR is often used to balance the relationship between fat distribution and nutrition or muscle retention; however, this measurement may mask central obesity if both hip circumference and WC increase (54, 55). In our study, we found that women's HRQoL was more sensitive to WC than men's HRQoL. This may be because women may be more vulnerable to weight and body image than men (56). Excessive dieting to keep fit may lead to reduced HRQoL in women. This can also be explained by cultural beliefs about one's weight and the increased discrimination against overweight women in work-related life and social roles (57). In this study, we introduced new obesity assessment criteria, such as RFM and LAP, and the analysis found that increases in WHtR, WHR, RFM, and LAP all led to a decrease in HRQoL. This may be because LAP, a new obesity index based on WC and triglycerides (TGs), is a useful indicator of visceral fat (58). RFM, which is based on the ratio of height to WC, is a more accurate estimate of body fat percentage than BMI. Furthermore, some studies have shown that RFM and LAP are significantly associated with cardiovascular disease. As RFM and LAP increase, the probability of people developing cardiovascular disease also increases (20–22, 59–61). Therefore, this may lead to a reduction in people's HRQoL.
Our study found that the independent contribution of the first cluster (socio-demographic characteristics) to HRQoL was much greater than that of the other two clusters, not only in the whole population but also in males and females separately. This may be because the EQ-5D-3L appears to be more sensitive in distinguishing between socio-demographic subgroups based on age, gender, marriage, education, employment and monthly income (36). We also found that in these populations, the independent contribution of the anthropometric indicators to HRQoL was even greater than the chronic disease prevalence. This may be partly because in most of these chronic disease categories, obesity is likely to be the cause of the disease (62).
Limitations
This study has several limitations that should be noted. First, the data on socio-demographic variables and chronic diseases in our research were obtained from self-reports, which might lead to biases or inaccuracies. This study did not consider the severity of chronic disease, which may have an effect on HRQoL. Second, some possible risk factors were not collected, including exercise, smoking, and drinking. Future studies will need to provide more detailed information. In addition, this study may have overestimated some parameters due to the ceiling effect of EQ-5D-3L. Third, this study used cross-sectional survey data to analyse the independent contribution of these three clusters to HRQoL, so the observed results cannot be supposed to be causal. Further in-depth studies of longitudinal follow-up data are needed to explore the causal relationship between them.
Conclusion
Despite its limitations, this study analyzed the correlation between obesity-related indicators of obesity (specifically RFM and LAP) and HRQoL in a community-based population. In this study, HRQoL decreased as BMI, WC, WHtR, WHR, RFM and LAP increased, and these results suggest that the accumulation of fat has a negative impact on HRQoL. In future measurements, RFM and LAP could be used as measures of nutrition and obesity. Additionally, our findings suggest that HRQoL is mainly influenced by marital status, education level and work status. When developing future interventions, the relevant authorities should pay increased attention to people with low educational attainment as well as people who are unmarried, divorced, widowed, unemployed, or retired.
Data availability statement
The datasets supporting the findings of this article cannot be shared publicly due to privacy reasons. Requests to access the data can be directed to the corresponding author(s).
Ethics statement
The studies involving human participants were reviewed and approved by Ethics Committee of Guangzhou Medical University. The patients/participants provided their written informed consent to participate in this study. Written informed consent was obtained from the individual(s) for the publication of any potentially identifiable images or data included in this article.
Author contributions
Y-JFan and P-XW designed the study, analyzed the data and wrote the draft manuscript. Y-JFeng performed data analysis and wrote the draft manuscript. YM and Z-ZS collected the data and performed data analysis and edited the manuscript. P-XW finalized the manuscript with inputs from all authors. All authors contributed to the development of the study framework, interpretation of the results, revisions of successive drafts of the manuscript and approved the version submitted for publication.
Acknowledgments
The authors wish to thank the study participants for their contribution to the study. We are also grateful to all community health workers who participated in our research. We gratefully acknowledged Y-JFeng, YM, and Z-ZS for their excellent work in study coordination, data collection and management. P-XW and Y-JFan is the guarantor of this work and, as such, had full access to all the data in the study and take responsibility for the integrity of the data and the accuracy of the data analysis.
Conflict of interest
The authors declare that the research was conducted in the absence of any commercial or financial relationships that could be construed as a potential conflict of interest.
Publisher's note
All claims expressed in this article are solely those of the authors and do not necessarily represent those of their affiliated organizations, or those of the publisher, the editors and the reviewers. Any product that may be evaluated in this article, or claim that may be made by its manufacturer, is not guaranteed or endorsed by the publisher.
Abbreviations
HRQoL, Health-related quality of life; VAS, Visual Analog Scale; BMI, Body mass index; WC, Waist circumference; WHtR, Waist-to-height ratio; WHR, Waist-to-hip ratio; RFM, Relative fat mass; LAP, lipid accumulation product; PCS-12, 12-Item Short Form Survey Physical Component Summary; MCS-12, 12-Item Short Form Survey Mental Component Summary.
References
1. James SL, Abate D, Abate KH, Abay SM, Abbafati C, Abbasi N, et al. Global, regional, and national incidence, prevalence, and years lived with disability for 354 diseases and injuries for 195 countries and territories, 1990–2017: a systematic analysis for the global burden of disease study 2017. Lancet. (2018) 392:1789–858.
2. Yang H, Wang Y, Negishi K, Nolan M, Marwick TH. Pathophysiological effects of different risk factors for heart failure. Open Heart. (2016) 3:e000339. doi: 10.1136/openhrt-2015-000339
3. Ku E, Kopple JD, Johansen KL, McCulloch CE, Go AS, Xie D, et al. Longitudinal weight change during Ckd progression and its association with subsequent mortality. Am J Kidney Dis Official J Natl Kidney Foundation. (2018) 71:657–65. doi: 10.1053/j.ajkd.2017.09.015
4. Berrigan D, Troiano RP, Graubard BI. BMI and mortality: the limits of epidemiological evidence. Lancet. (2016) 388:734–6. doi: 10.1016/S0140-6736(16)30949-7
5. Bray GA, Kim KK, Wilding JPH, World Obesity Federation. Obesity: a chronic relapsing progressive disease process a position statement of the world obesity federation. Obesity Rev. (2017) 18:715–23. doi: 10.1111/obr.12551
6. Sarwer DB, Polonsky HM. The psychosocial burden of obesity. Endocrinol Metab Clin North Am. (2016) 45:677–88. doi: 10.1016/j.ecl.2016.04.016
7. Vaidya V. Psychosocial aspects of obesity. Adv Psychosom Med. (2006) 27:73–85. doi: 10.1159/000090965
8. Peeters A, Barendregt JJ, Willekens F, Mackenbach JP, Al Mamun A, Bonneux L, et al. Obesity in adulthood and its consequences for life expectancy: a life-table analysis. Ann Intern Med. (2003) 138:24–32. doi: 10.7326/0003-4819-138-1-200301070-00008
9. Lin VW, Wong ES, Wright A, Flum DR, Garrison LP, Alfonso-Cristancho R, et al. Association between health-related quality of life and body mass after adjustable gastric banding: a nonlinear approach value health. Value Health. (2013) 16:823–9. doi: 10.1016/j.jval.2013.05.001
10. The Whoqol Group. The world health organization quality of life assessment (Whoqol): position paper from the world health organization. Social Sci Med 1982. (1995) 41:1403–9. doi: 10.1016/0277-9536(95)00112-K
11. EuroQol Group. Euroqol—a new facility for the measurement of health-related quality of life. Health Policy. (1990) 16:199–208. doi: 10.1016/0168-8510(90)90421-9
12. Xu Y, Zhou Z, Li Y, Yang J, Guo X, Gao J, et al. Exploring the nonlinear relationship between body mass index and health-related quality of life among adults: a cross-sectional study in Shaanxi Province, China. Health Qual Life Outcomes. (2015) 13:153. doi: 10.1186/s12955-015-0347-9
13. You H, Li XL, Jing KZ Li ZG, Cao HM, Wang J, et al. Association between body mass index and health-related quality of life among chinese elderly-evidence from a community-based study. BMC Public Health. (2018) 18:1174. doi: 10.1186/s12889-018-6086-1
14. Kearns B, Ara R, Young T, Relton C. Association between body mass index and health-related quality of life, and the impact of self-reported long-term conditions - cross-sectional study from the South Yorkshire Cohort Dataset. BMC Public Health. (2013) 13:1009. doi: 10.1186/1471-2458-13-1009
15. Sach TH, Barton GR, Doherty M, Muir KR, Jenkinson C, Avery AJ. The relationship between body mass index and health-related quality of life: comparing the Eq-5d, Euroqol Vas and Sf-6d. Int J Obesity 2005. (2007) 31:189–96. doi: 10.1038/sj.ijo.0803365
16. Jia H, Lubetkin EI. The impact of obesity on health-related quality-of-life in the general adult us population. J Public Health. (2005) 27:156–64. doi: 10.1093/pubmed/fdi025
17. Ibrahim MM. Subcutaneous and visceral adipose tissue: structural and functional differences. Obes Rev. (2010) 11:11–8. doi: 10.1111/j.1467-789X.2009.00623.x
18. Heitmann BL, Frederiksen P. Thigh circumference and risk of heart disease and premature death: prospective cohort study. BMJ. (2009) 339:b3292. doi: 10.1136/bmj.b3292
19. Lavie CJ, De Schutter A, Parto P, Jahangir E, Kokkinos P, Ortega FB, et al. Obesity and prevalence of cardiovascular diseases and prognosis-the obesity paradox updated. Prog Cardiovasc Dis. (2016) 58:537–47. doi: 10.1016/j.pcad.2016.01.008
20. Woolcott OO, Bergman RN. Relative fat mass (Rfm) as a new estimator of whole-body fat percentage horizontal line a cross-sectional study in American adult individuals. Sci Rep. (2018) 8:10980. doi: 10.1038/s41598-018-29362-1
21. Huang J, Bao X, Xie Y, Zhang X, Peng X, Liu Y, et al. Interaction of lipid accumulation product and family history of hypertension on hypertension risk: a cross-sectional study in the Southern Chinese population. BMJ Open. (2019) 9:e029253. doi: 10.1136/bmjopen-2019-029253
22. Kyrou I, Panagiotakos DB, Kouli GM, Georgousopoulou E, Chrysohoou C, Tsigos C, et al. Lipid accumulation product in relation to 10-year cardiovascular disease incidence in caucasian adults: the attica study. Atherosclerosis. (2018) 279:10–6. doi: 10.1016/j.atherosclerosis.2018.10.015
23. Yoo K-B, Park E-C, Jang S-Y, Kwon JA, Kim SJ, Cho K-h, et al. Association between employment status change and depression in Korean adults. BMJ Open. (2016) 6:e008570. doi: 10.1136/bmjopen-2015-008570
24. Rabin R, de Charro F. Eq-5d: a measure of health status from the Euroqol Group. Ann Med. (2001) 33:337–43. doi: 10.3109/07853890109002087
26. Liu GG, Wu H, Li M, Gao C, Luo N. Chinese time trade-off values for Eq-5d health states. Value Health. (2014) 17:597–604. doi: 10.1016/j.jval.2014.05.007
27. Cohen YC, Rubin HR, Freedman L, Mozes B. Use of a clustered model to identify factors affecting hospital length of stay. J Clin Epidemiol. (1999) 52:1031–6. doi: 10.1016/S0895-4356(99)00079-7
28. Wang XX, Chen ZB, Chen XJ, Huang LL, Song XY, Wu X, et al. Functional status and annual hospitalization in multimorbid and non-multimorbid older adults: a cross-sectional study in Southern China. Health Qual Life Outcomes. (2018) 16:33. doi: 10.1186/s12955-018-0864-4
29. Chen T, Li L. Influence of health-related quality of life on health service utilization in addition to socio-demographic and morbidity variables among primary care patients in China. Int J Public Health. (2009) 54:325–32. doi: 10.1007/s00038-009-0057-3
30. Zhou ZY, Zhou ZL, Gao JM, Lai S, Chen G. Urban-rural difference in the associations between living arrangements and the health-related quality of life (HRQOL) of the elderly in China-Evidence from Shaanxi province. PLoS One. (2018) 13:e0204118. doi: 10.1371/journal.pone.0204118
31. Sun SY. 40 years of reform and opening up:innovation and development of China's medical security system. Gansu Social Sci. (2018) 5:21–8.
32. Liu L, Sun R, Gu Y, Ho KC. The effect of China's health insurance on the labor supply of middle-aged and elderly farmers. Int J Environ Res Public Health. (2020) 17:6689. doi: 10.3390/ijerph17186689
33. Han H, Gao Q. Does welfare participation improve life satisfaction? Evidence from panel data in rural China. J Happiness Stud. (2020) 21:1795–822. doi: 10.1007/s10902-019-00157-z
34. Fang W, Li Y, Mo R, Wang J, Qiu L, Ou C, et al. Hospital and healthcare insurance system record-based epidemiological study of myasthenia gravis in southern and Northern China. Neurol Sci. (2020) 41:1211–23. doi: 10.1007/s10072-019-04146-1
35. Ma X, McGhee SM. A cross-sectional study on socioeconomic status and health-related quality of life among elderly Chinese. BMJ Open. (2013) 3:e002418. doi: 10.1136/bmjopen-2012-002418
36. Zhao L, Liu X, Liu D, He Y, Liu Z, Li N. Comparison of the psychometric properties of the Eq-5d-3l and Sf-6d in the general population of Chengdu City in China. Medicine. (2019) 98:e14719. doi: 10.1097/MD.0000000000014719
37. Deng X, Dong P, Zhang L, Tian D, Zhang L, Zhang W, et al. Health-related quality of life in residents aged 18 years and older with and without disease: findings from the first provincial health services survey of Hunan, China. BMJ Open. (2017) 7:e015880. doi: 10.1136/bmjopen-2017-015880
38. Zhou T, Guan H, Yao J, Xiong X, Ma A. The quality of life in chinese population with chronic non-communicable diseases according to Eq-5d-3l: a systematic review. Quality Life Res Int J Quality Life Aspects Treatment Care Rehabilitat. (2018) 27:2799–814. doi: 10.1007/s11136-018-1928-y
39. Wang HM, Patrick DL, Edwards TC, Skalicky AM, Zeng HY, Gu WW. Validation of the Eq-5d in a general population sample in Urban China. Quality Life Res Int J Quality Life Aspects Treatment Care Rehabilitat. (2012) 21:155–60. doi: 10.1007/s11136-011-9915-6
40. Mao Z, Ahmed S, Graham C, Kind P. Exploring subjective constructions of health in China: a q-methodological investigation. Health Qual Life Outcomes. (2020) 18:165. doi: 10.1186/s12955-020-01414-z
41. Drydakis N. The effect of unemployment on self-reported health and mental health in Greece from 2008 to 2013: a longitudinal study before and during the financial crisis. Soc Sci Med. (2015) 128:43–51. doi: 10.1016/j.socscimed.2014.12.025
42. Junna L, Moustgaard H, Martikainen P. Current unemployment, unemployment history, and mental health: a fixed-effects model approach. Am J Epidemiol. (2022) 191:1459–69. doi: 10.1093/aje/kwac077
43. Kornadt AE, Rothermund K. Preparation for old age in different life domains: dimensions and age differences. Int J Behav Dev. (2013) 38:228–38. doi: 10.1177/0165025413512065
44. Cwirlej-Sozanska A, Widelak M, Wiernasz M, Wawrzykowska I, Turkosz N. An assessment of the work ability, disability and quality of life of working people of pre-retirement and retirement age in poland—a cross-sectional pilot study. Int J Occup Med Environ Health. (2021) 34:69–85. doi: 10.13075/ijomeh.1896.01591
45. Woo J, Choi H, Engel R. Economic stress and life satisfaction in retirement among Korean older adults: the roles of different types of social support. J Gerontol Soc Work. (2022) 65:97–111. doi: 10.1080/01634372.2021.1937430
46. Kim M-L, Lee Y-H, Hong S-Y. Examining the factors that affect the preparation of life after retirement and quality of life of South Korean adults across different age groups. Sustainability. (2021) 13:5351. doi: 10.3390/su13105351
47. Kangwanrattanakul K, Parmontree P. Psychometric properties comparison between Eq-5d-5l and Eq-5d-3l in the general thai population. Quality Life Res Int J Quality Life Aspects Treatment Care Rehabilitat. (2020) 29:3407–17. doi: 10.1007/s11136-020-02595-2
48. Yao Q, Liu C, Zhang Y, Xu L. Changes in health-related quality of life of Chinese populations measured by the Eq-5d-3 L: a comparison of the 2008 and 2013 national health services surveys. Health Qual Life Outcomes. (2019) 17:43. doi: 10.1186/s12955-019-1109-x
49. Sun S, Chen J, Johannesson M, Kind P, Xu L, Zhang Y, et al. Regional differences in health status in China: population health-related quality of life results from the national health services survey 2008. Health Place. (2011) 17:671–80. doi: 10.1016/j.healthplace.2011.01.007
50. Yang Z, Busschbach J, Liu G, Luo N. Eq-5d-5l norms for the urban Chinese population in China. Health Qual Life Outcomes. (2018) 16:210. doi: 10.1186/s12955-018-1036-2
51. Arrospide A, Machon M, Ramos-Goni JM, Ibarrondo O, Mar J. Inequalities in health-related quality of life according to age, gender, educational level, social class, body mass index and chronic diseases using the spanish value set for euroquol 5d-5l questionnaire. Health Qual Life Outcomes. (2019) 17:69. doi: 10.1186/s12955-019-1134-9
52. Neeland IJ, Das SR, Simon DN, Diercks DB, Alexander KP, Wang TY, et al. The obesity paradox, extreme obesity, and long-term outcomes in older adults with st-segment elevation myocardial infarction: results from the Ncdr. Eur Heart J Qual Care Clin Outcomes. (2017) 3:183–91. doi: 10.1093/ehjqcco/qcx010
53. Lavie CJ, De Schutter A, Milani RV. Healthy obese vs. unhealthy lean: the obesity paradox. Nat Rev Endocrinol. (2015) 11:55–62. doi: 10.1038/nrendo.2014.165
54. Despres JP, Lemieux I. Prud'homme D. Treatment of Obesity: Need to Focus on High Risk Abdominally. Obese Patients BMJ. (2001) 322:716–20. doi: 10.1136/bmj.322.7288.716
55. Little P, Byrne CD. Abdominal obesity and the “Hypertriglyceridaemic Waist” phenotype. BMJ. (2001) 322:687–9. doi: 10.1136/bmj.322.7288.687
56. Joshi R, Herman CP, Polivy J. Self-enhancing effects of exposure to thin-body images. Int J Eat Disord. (2004) 35:333–41. doi: 10.1002/eat.10253
57. Paquette MC, Raine K. Sociocultural context of women's body image. Social Sci Med 1982. (2004) 59:1047–58. doi: 10.1016/j.socscimed.2003.12.016
58. Nurdiantami Y, Watanabe K, Tanaka E, Pradono J, Anme T. Association of general and central obesity with hypertension. Clin Nutr. (2018) 37:1259–63. doi: 10.1016/j.clnu.2017.05.012
59. Ioachimescu AG, Brennan DM, Hoar BM, Hoogwerf BJ. The lipid accumulation product and all-cause mortality in patients at high cardiovascular risk: a precis database study. Obesity (Silver Spring). (2010) 18:1836–44. doi: 10.1038/oby.2009.453
60. Commodore-Mensah Y, Agyemang C, Aboagye JA, Echouffo-Tcheugui JB, Beune E, Smeeth L, et al. Obesity and cardiovascular disease risk among africans residing in Europe and Africa: the rodam study. Obes Res Clin Pract. (2020) 14:151–7. doi: 10.1016/j.orcp.2020.01.007
61. Yu P, Huang T, Hu S, Yu X. Predictive value of relative fat mass algorithm for incident hypertension: a 6-year prospective study in Chinese population. BMJ Open. (2020) 10:e038420. doi: 10.1136/bmjopen-2020-038420
Keywords: health-related quality of life, obesity, anthropometric indicators, EQ-5D, community-based population
Citation: Fan Y-J, Feng Y-J, Meng Y, Su Z-Z and Wang P-X (2022) The relationship between anthropometric indicators and health-related quality of life in a community-based adult population: A cross-sectional study in Southern China. Front. Public Health 10:955615. doi: 10.3389/fpubh.2022.955615
Received: 29 May 2022; Accepted: 29 August 2022;
Published: 28 September 2022.
Edited by:
Xuan Li, University of Mississippi Medical Center, United StatesReviewed by:
Guoxiang Liu, Harbin Medical University, ChinaFederico Amianto, University of Turin, Italy
Copyright © 2022 Fan, Feng, Meng, Su and Wang. This is an open-access article distributed under the terms of the Creative Commons Attribution License (CC BY). The use, distribution or reproduction in other forums is permitted, provided the original author(s) and the copyright owner(s) are credited and that the original publication in this journal is cited, in accordance with accepted academic practice. No use, distribution or reproduction is permitted which does not comply with these terms.
*Correspondence: Pei-Xi Wang, cGVpeGkwMDFAMTYzLmNvbQ==