 Xiaodan Bai1†
 Xiyu Zhang2†
 Hongping Shi3†
 Guihong Geng1
 Bing Wu2
 Yongqiang Lai2
 Wenjing Xiang1
 Yanjie Wang1
 Yu Cao1
 Baoguo Shi1*
 Ye Li2*
- 1Department of Economics, School of Economics, Minzu University of China, Beijing, China
- 2Research Center of Health Policy and Management, School of Health Management, Harbin Medical University, Harbin, China
- 3Department of Oncology, Heze Municipal Hospital, Heze, China
Background: Currently, breast cancer (BC) is ranked among the top malignant tumors in the world, and has attracted widespread attention. Compared with the traditional analysis on biological determinants of BC, this study focused on macro factors, including light at night (LAN), PM2.5, per capita consumption expenditure, economic density, population density, and number of medical beds, to provide targets for the government to implement BC interventions.
Methods: A total of 182 prefecture-level cities in China from 2013 to 2016 were selected as the sample of the study. The geographically and temporally weighted regression (GTWR) model was adopted to describe the spatiotemporal correlation between the scale of BC and macro factors.
Results: The results showed that the GTWR model can better reveal the spatiotemporal variation. In the temporal dimension, the fluctuations of the regression coefficients of each variable were significant. In the spatial dimension, the positive impacts of LAN, per capita consumption expenditure, population density and number of medical beds gradually increased from west to east, and the positive coefficient of PM2.5 gradually increased from north to south. The negative impact of economic density gradually increased from west to east.
Conclusion: The fact that the degree of effect of each variable fluctuates over time reminds the government to pay continuous attention to BC prevention. The spatial heterogeneity features also urge the government to focus on different macro indicators in eastern and western China or southern and northern China. In other words, our research helps drive the government to center on key regions and take targeted measures to curb the rapid growth of BC.
Introduction
Cancer is the killer of human life (1). With the rapid development of medical technology, human beings are still unable to eliminate the pain of cancer and loss of life (2, 3). In all patterns of cancer, breast cancer (BC) incidence and mortality both lie on top of malignant tumors (4, 5). According to the International Agency for Cancer Research (IARC) of the World Health Organization (WHO), BC morbidity (11.7%) ranked first and mortality (6.9%) ranked fifth among all cancers in 2020 (6); BC has been a heavy burden on the global population (7). Additionally, the metastasis of BC cells will lead to the pathology of other organs (8, 9). Patients suffer from both physical pain and mental depression (10); thus the demand for health and longevity cannot be satisfied (11, 12). The exact carcinogenic factors of BC are not yet clear (13), so reducing the disease risk also faces difficulties. Today, the whole world is focusing on “converging attacks” from the two aspects of prevention and treatment of BC (14, 15) to break through the “BC dilemma.” In this study, an in-depth exploration and multidimensional analysis of the potential macro influences on BC provides a theoretical evidence-based basis for BC intervention.
Based on the theory of social determinants of health, the occurrence of disease is the result of multidimensional factors. Currently, the analyses of carcinogenic factors of BC focus on the following three aspects: congenital inheritance (5, 15–18), lifestyle and psychological pressure (15, 19–22), and physical environment (natural environment and social environment, etc.) (15, 23–26). In addition, the mechanism by which light at night (LAN) blocks melatonin formation and triggers BC has attracted much attention (27–33). Xiao et al. used the Cox proportional hazards models to estimate the hazard ratio of BC and found that different tumor stages and ethnic differences would cause different results in the effect of LAN on BC. In black women, the relationship between LAN and increased BC risk was observed for localized BC only, whereas in white women, the relationship was observed for regional/distant stages (32). Al-Naggar et al. applied a linear regression method to demonstrate a significant association between artificial light at night and diseases such as BC in protected areas (27). Lamphar et al. studied 25,025 breast cancer cases and found that cumulative light pollution was positively associated with BC and persisted after age standardization (31). These studies fully demonstrate the important role of remote sensing light in BC.
With the continuous innovation of research methods, the research analyzing the spatial characteristics of cancers has become more and more abundant. This is the key to taking targeted preventive measures in different regions based on the differential distribution of diseases in space, and is also the basis for efficient promotion of human health. Amin et al. used SaTScan software to identify significant BC spatial clusters in the United States and propose high emphasis on areas of spatial clustering of BC (34). Using the geographically weighted regression (GWR) method, in the study by Pes et al., a hotspot of gastric cancer mortality was detected in the central mountainous area of Sardinia among males, positively associated with goiter, and the practice of sheep-rearing, whereas there was a negative association with the diet score (35). Imounga et al. examined spatial trends in cervical cancer in French Guiana, reminding policymakers to focus on remote areas (36).
There is an increasing number of studies on the determinants of BC, but there are still some limitations. First, the research scale is mostly focused on the national scope, while the spatial distribution characteristics of BC are not described more precisely and are not conducive to targeted intervention. Second, although these studies have considered light impacts on BC, they pay more attention to the behavioral habits and physiological characteristics at the individual level. The study of the impacts of LAN on BC under the economic level, medical condition, and air quality lacks attention. However, macro factors play significant roles. For example, people in developed countries tend to have a high intensity of LAN, leading to a higher incidence of BC. The BC incidence in developed countries (71.7/100 thousand) is higher than that in less developed countries (29.3/100 thousand) (4). Additionally, a comprehensive early examination schedule, reasonable medical service supply and appropriate late treatment plan can effectively reduce the morbidity and mortality of BC (37). Furthermore, air pollution from a high level of fine particulate matter will increase breast density and raise the risk of BC. The emission density of PM2.5 in downtown Atlanta is 4.6 times higher than that in rural Georgia, and the average incidence of BC is 16.62% higher than that in rural Georgia (38). Third, most articles use statistical methods to process panel data and lack attention to spatial heterogeneity and time span. This may reduce the estimation efficiency, biased results, and lack of continuous changes in the data, which is too different from the real situation of BC.
In such a context, our study has some outstanding innovations. Considering the importance of the scale effect on spatial research, avoiding the roughness of large scale research at the global-level and unobservable small scale studies at the county-level, this study adopted an intermediate scale in prefecture-level cities and focused on the impacts of macroeconomic indicators on BC from a sustainable development perspective. In addition, to emphasize a spatiotemporal perspective, this study applied the geographically and temporally weighted regression (GTWR) model (39). By constructing a spatiotemporal dependent stereo model, we can obtain more accurate results (40) and consequently display different factors attributed to BC from various regions, for further targeted intervention measures. This will provide a theoretical reference for the prevention of BC in countries or regions with high incidence and has great significance for promoting human health.
Materials and methods
Variable selection and data source
This study considered China's prefecture-level cities or municipalities directly under the central government as the research objects. After sorting out the data fully, 182 research units were retained. The specific sampling method can be described in three steps. First, among all prefecture-level cities in China, 216 cities with established cancer surveillance centers were screened. Second, to ensure the spatial continuity of the panel data, we took 2013 as the base year and deleted the surveillance centers added later. Therefore, 182 prefecture-level cities were retained. Third, we collected data for each explanatory variable, matched them with the above 182 prefecture-level cities, and thus finalized the 182 prefecture-level cities.
Additionally, we also verified the sample size to ensure rigor. The minimum sample size was calculated by applying G*power 3.1.9.7 developed by Heinrich Heine University Düsseldorf. We chose the two-sided t-test and the difference between two independent means (two groups) as the test type and measured variable. The significance level is 5%, and the test power is 95%. Table 1 shows that the minimum sample size is 105. It is much smaller than the 182 in this study. So, the sample size in this paper meets the requirements for research reliability.
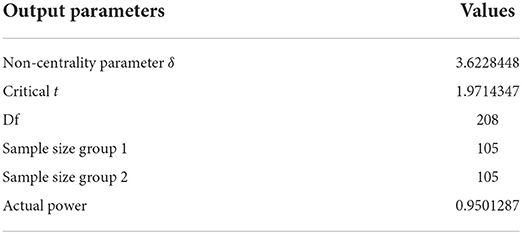
Table 1. The test of sample size.
In the process of building the model, we selected the number of BC cases (the BC scale) as the explained variable. These data were from the China Cancer Registry Annual Report (2013–2016), published in 2017–2020. In addition, considering the significant geographic differences in disease morbidity and mortality (41–44), it is only through appropriate spatial methods that the spatial heterogeneity of disease can be displayed thoroughly, and targeted policies can be made accordingly. Ignoring spatial heterogeneity can lead to many problems, such as loss of estimation efficiency, biased estimation, and saliency of errors. Therefore, we analyzed the factors related to the spatial distribution pattern of BC as follows:
(1) Light at night. The light data is obtained through spatial technology, so it is easy to match the regional geographic location (31). Light changes alter our circadian rhythm, especially the normal cycle of melatonin. This leads to early menarche and elevated circulating estrogen and prolactin, sex hormones that increase the risk of BC (28, 30, 32, 45). We include the LAN data in the explanatory variables. It uses Visible Infrared Imaging Radiometer Suite Day/Night Band (VIIRS/DNB) image data, which is one of the ways to collect light images at night and it has higher spatial resolution and a wider radiation detection range. The data was obtained from the Chinese Research Data Services Platform (CNRDS).
(2) Environmental pollution. Aromatic hydrocarbon receptors in polluted environments mediate the effects of many endocrine disruptors and have implications for BC in young or premenopausal women (46–48). There is little literature on the effects of environmental pollution on BC from a spatial perspective. Under the constraints of data availability, we finally chose “PM2.5” as a proxy variable for environmental pollution. PM2.5 can potentially affect breast density by interfering with the growth of breast cells and increasing the relative amount of fibrous tissue (48, 49), thereby greatly enhancing the risk of BC. The data was obtained from the atmospheric composition analysis group of Dalhousie University.
(3) Economic development and wealth level. From a spatial perspective, economic development and wealth level vary by geographic location (50). Considering the availability of data and the quality of variables, “economic density” and “per capita consumption expenditure” are chosen as proxies for economic development and wealth levels. In general, the higher the level of economic development or the higher the economic and social status of people, the greater attention they pay to BC prevention and screening (51, 52). Additionally, BC prevention and treatment are at a high level in terms of supply and demand. This came from the China City Statistical Yearbook (2014–2017) or the Economic and Social Development Statistical Bulletin (2013–2016).
(4) Population. To integrate the characteristics of population and area, we chose “population density” as the proxy variable. The occurrence of BC ultimately manifests in the individual. When the population base is large, the possibility of BC increases (53). The data were obtained from the China City Statistical Yearbook (2014–2017) or the Economic and Social Development Statistical Bulletin (2013–2016).
(5) Medical resources and medical service level. Based on the availability of data, “number of medical beds” was used as a proxy variable. If a region has abundant medical resources and a high level of medical services, the screened BC cases are very close to the actual number of patients, and a relatively high BC scale would be detected (54). The data was obtained from the China City Statistical Yearbook (2014–2017).
(6) Education level. We chose “average years of education” and “number of students in higher education” for each region as proxy variables. Higher education groups are more likely to accept the relevant knowledge and treatment process of disease prevention (55). Therefore, the prevention and treatment of BC are more effective among them.
(7) Political background. Each region has experienced unique changes thus far, and these political changes will also have a certain impact on BC (56).
We attempted to find relevant data on “education level,” but unfortunately, they are too scarce due to covering 182 prefecture-level cities from 2013 to 2016. So, in the end, we have to exclude this factor. In addition, political factors have little impact on BC in China from 2013 to 2016, and are not easy to quantify. The “political background” was also excluded.
Stata, GeoDa, and ArcGis10.2 are adopted to process the data. Table 2 shows a specific description of these variables.
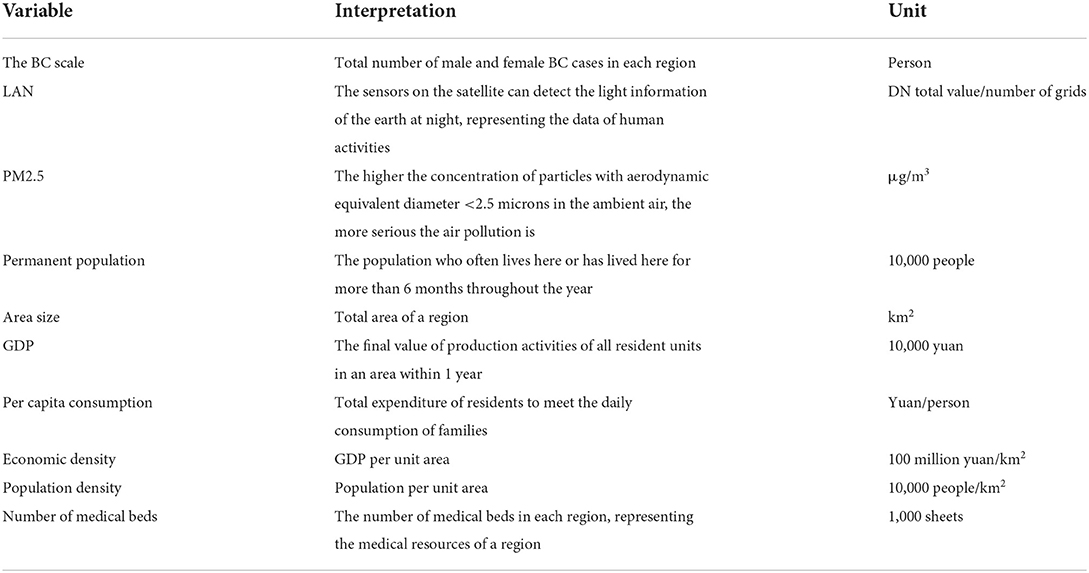
Table 2. Description of various variables.
Research methods
Ordinary least squares (OLS)
The OLS model needs to select a set of linearly independent functions in advance, and obtain the closest result to the real situation by setting the undetermined coefficients and solving them. The condition of OLS is to use the least square method to obtain the unknown data and minimize the square sum of the error, that is, to minimize the square sum of the distance from all observations on the scatter diagram to the regression line. Its calculation formula is as follows:
In the formula, i is the prefecture level city number, yi represents the BC scale in city i, xik represents the k-th explanatory variable of the i-th city, and β0 indicates the expected value of BC cases in different regions when all explanatory variables do not work. βk is the k-th regression parameter of the control variable which indicates that the BC scale fluctuates with the change in explanatory variables. εi is a random error term.
Geographically weighted regression (GWR)
This method extends the traditional OLS from a global to a local framework by incorporating the spatial location into the parameters and using a locally weighted least squares method for point-by-point parameter estimation. The estimated parameters will change depending on geospatial location, thus visualizing the spatial heterogeneity of the study object. Its calculation formula is as follows (57):
(ui, vi) represents the centroid coordinates of city i. Unlike the spatial “fixed” coefficient estimates in the global model, this model allows the parameter estimates βk(ui, vi) to vary with space, so it can capture local effects. It is critical to select an appropriate weight matrix for estimating the parameters of GWR. The spatial weights can be estimated by a spatial kernel function, also called a distance-decay function. According to whether the bandwidth is varied, the 2 basic types of spatial kernels are fixed and adaptive kernels, which use fixed bandwidth and a fixed number of nearest neighbors within an adaptive bandwidth, respectively. Further, this method was chosen because quadratic kernel function had the best (smallest) AICc for fitting the GWR model to the data. So, this study selected the adaptive bandwidth quadratic kernel function commonly used in academia as the distance weight function. Its formula is:
Where wij is the weight of the impact of city i on city j, dijis the distance between city i and city j, and bi is the bandwidth specific to location i.
Geographically and temporally weighted regression (GTWR) and temporally weighted regression (TWR)
GTWR is an extended model of GWR. It not only considers the spatial non-stationarity of geographic data but also adds the time effect in the model to improve the goodness of fit of the model (58). Its formula is:
Where i(ui, vi, ti) represents the spatiotemporal coordinates of city i, ui, vi represents the projected spatial coordinates, and ti is the projected temporal coordinates. Unlike the global regression model with “fixed” coefficients, GTWR allows parameter estimation βk(ui, vi, ti) to vary across space and time. Therefore, this method can capture spatiotemporal changes at the same time. The estimated value of its parameters βk(ui, vi, ti) can be expressed as:
where W(ui, vi, ti) is the space-time weight matrix, and its diagonal elements are the weight values of city i and its adjacent city j, GTWR defines wij as a weight matrix constructed by the adaptive Gaussian distance attenuation function. This makes the weight of data points closer to observation point i higher than that of data points farther from observation point i in a spatiotemporal coordinate system. In addition, in the GTWR model, the used in the weight matrix—the spatiotemporal distance between city i and city j—is defined as a linear combination of spatial and temporal distances:
Where λ and μ are the scale parameters of equilibrium space and time, respectively. In particular, when λ = 0, the spatiotemporal distance degenerates into the distance in the TWR model; when μ = 0, the spatiotemporal distance degenerates into the distance in the GWR model (59).
Results
Spatial variation characteristics of the BC scale from 2013 to 2016
The scale of BC in 182 prefectural-level units in China from 2013 to 2016 is shown in Figure 1. From a spatial perspective, the Liaodong Peninsula, Shandong Peninsula, and Beijing-Tianjin-Hebei area are located in the Bohai Rim and some cities in the Yangtze River Delta are areas with a high scale of BC. They also have a higher degree of BC clustering. Overall, there are eight prefecture-level cities with an average annual scale of BC exceeding 1,000. They are Beijing (2,597), followed by Tianjin (2,544), Shanghai (2,243), Hangzhou (1,550), Nantong (1,461), Shenyang (1,385), Guangzhou (1,223), and Wuhan (1,113). From the time perspective, compared with the former 2 years, the scale of BC in 2015 and 2016 is much lower, and 92.86% of prefecture-level cities have a lower scale of BC than the previous 2 years. In addition, the scale of BC in 2015 was lowest, so to reflect the continuous changes in the scale of BC more effectively, it was necessary to study both the spatial effects and time effects of the scale of BC.
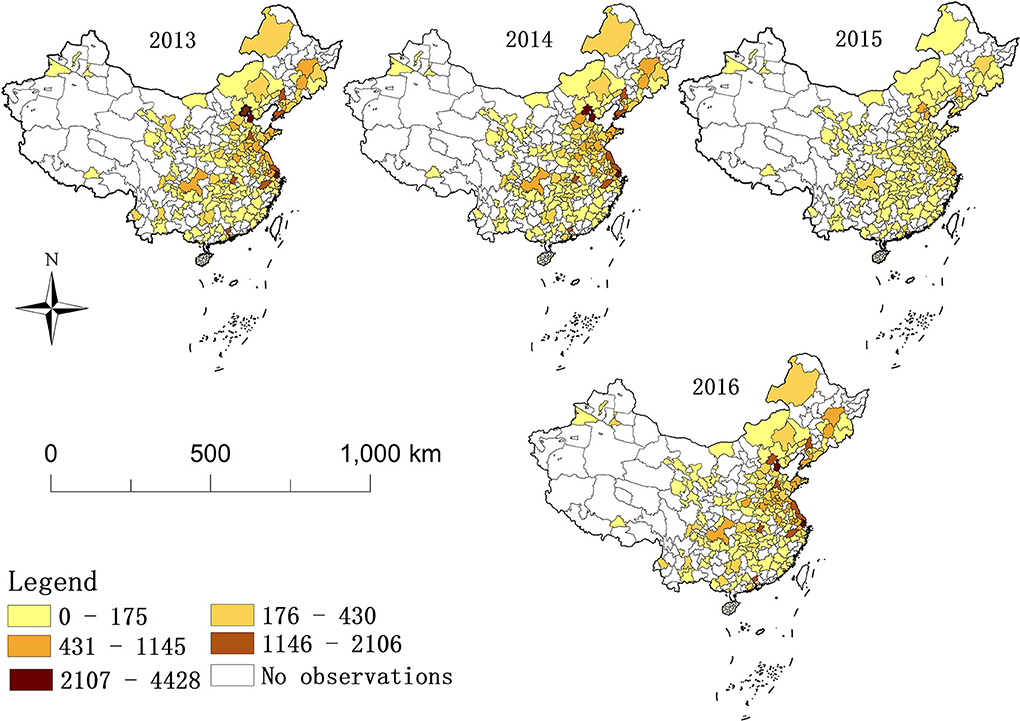
Figure 1. The scale of breast cancer in 182 Chinese prefectural-level units during 2013–2016.
Results from OLS model
OLS regression is first used to explore the relationship of the scale of BC and LAN, PM2.5, per capita consumption expenditure, economic density, population density, and number of medical beds. This model can be used as a benchmark for comparison with local regression model results. Table 3 shows the estimated results of OLS. The R2 was 0.581, which indicated that OLS can explain at least 58.1% of the total variation in the scale of BC and has statistical significance. Additionally, the variance inflation factor (VIF) values were lower than 3, verifying that the choice of explanatory variables can avoid the problem of collinearity. According to the results in Table 3, the scale of BC had a strongly positive correlation with LAN, PM2.5, per capita consumption expenditure and number of medical beds (p-value < 0.1) and a negative correlation with population density (p-value < 0.05).
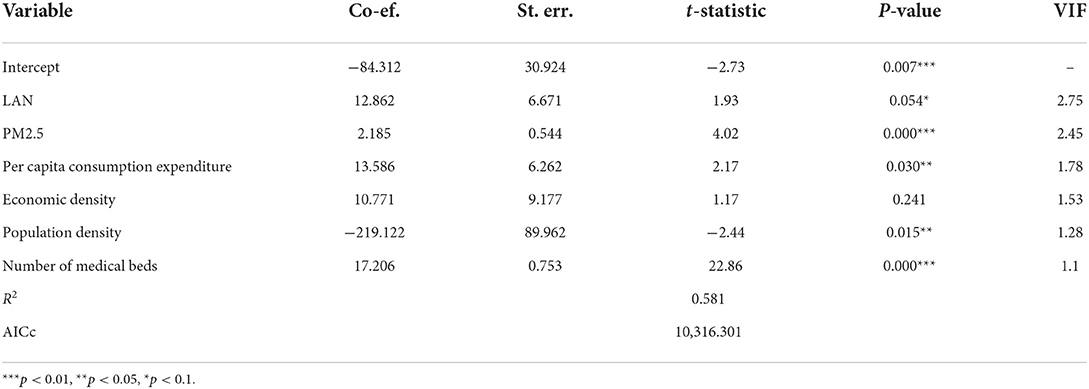
Table 3. Parameter estimate summaries of OLS on the entire data set.
Results from GTWR model
Furthermore, the GTWR model was also adopted to verify the relationship between the scale of BC and the above explanatory variables. Compared with OLS, the fitting results of GTWR are significantly improved in terms of the R2 and AICc values. Table 4 shows five statistics, including each estimated parameter's minimum (Min), lower quartile (LQ), mean, upper quartile (UQ) and maximum (Max). For variable LAN, the Min and Max values of the coefficients are −6.161 and 44.114 respectively, indicating that the correlation between the scale of BC and LAN has obvious spatial-temporal variation. With LQ = 4.994 > 0, negative relationships exist for some spatial units or time frames, and positive relationships are dominant overall. Similarly, the coefficients of other variables also show apparent space-time variation; the differences between the maximum and minimum PM2.5, per capita consumption expenditure, economic density, population density, and number of medical beds are 4.489, 81.325, 236.969, 1,491.394, and 22.225, respectively.
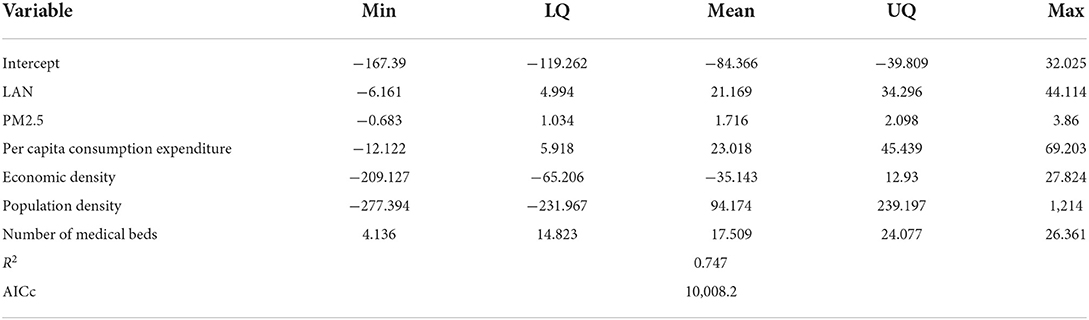
Table 4. Parameter estimate summaries of GTWR on the entire data set.
Performance comparison of different models
To illustrate the applicability of GTWR to this study, GWR and TWR are also tested on the same dataset, and Table 5 presents the fitting results of these models. The TWR model performs better than the GWR model, indicating that the fluctuation during 2013–2016 was greater than its spatial discrepancy. Namely, the time non-stationarity was greater than the spatial non-stationarity. GTWR exhibited the best performance, including the highest R2, lowest RSS and lowest AICc. It is worth mentioning that the comparison has two contributions to the whole thesis. It can prove that the GTWR model is more suitable for BC scale local effects. Also, our research content needs to eliminate one-by-one traditional methods (OLS, GWR, and TWR) and methodological upgrades. The research topic of this study was the temporal and spatial differences of the BC scale in 182 prefecture-level cities in China from 2013 to 2016 and the macro factors driving its changes, capturing both temporal and spatial local effects. Undoubtedly, this is something that a global model such as OLS cannot achieve. Therefore, this article selects the GTWR model to further describe the correlation between various influencing factors and the scale of BC.
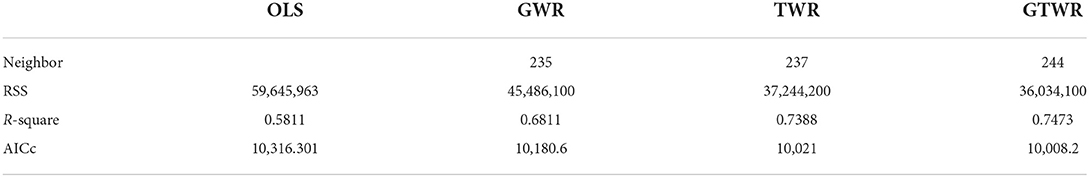
Table 5. Performance comparison of four models on the entire data set.
Temporal variation of estimated coefficients
Figure 2 illustrates the variation in selected variable coefficients during 2013–2016 in Beijing, Guangzhou, Hangzhou, Nantong, Shanghai, Shenyang, Tianjin, and Wuhan (the scale of BC in the selected cities exceeds 1,000). In the Figures 2A–F denote LAN, PM2.5, per capita consumption expenditure, economic density, population density, and number of medical beds, respectively. In summary, the estimated coefficients of each variable in the selected cities have the same trends over time, which can be divided into two categories. One is the three-stage fluctuation mode, namely, the trend of coefficients in each city from 2014 to 2015 is opposite to that in the previous and subsequent periods, and (A), (B), (C) and (D) all show this characteristic. Taking LAN as an example, its fluctuation feature over 4 years is “rise-fall-rise,” and the positive impact fluctuates repeatedly. It is worth mentioning that the economic density has an opposite impact on the scale of BC. In 2013–2014 its increase effectively reduced the scale of BC, but in the next 2 years, it showed the promotion to the scale of BC. The other is the two-stage fluctuation mode. The change in the coefficient of population density and the number of medical beds over time is consistent with this model. The former showed a rise followed by a fall, while the latter showed the opposite. The trend of population density changes from a strengthening promoting effect to a strengthening inhibiting effect. In contrast, the impact of the number of medical beds is always positive and decreases year by year until 2015, only to pick up in 2016. In conclusion, the inclusion of time effects can reflect the influencing trend of various factors and be beneficial to clarify the direction and focus of BC prevention.
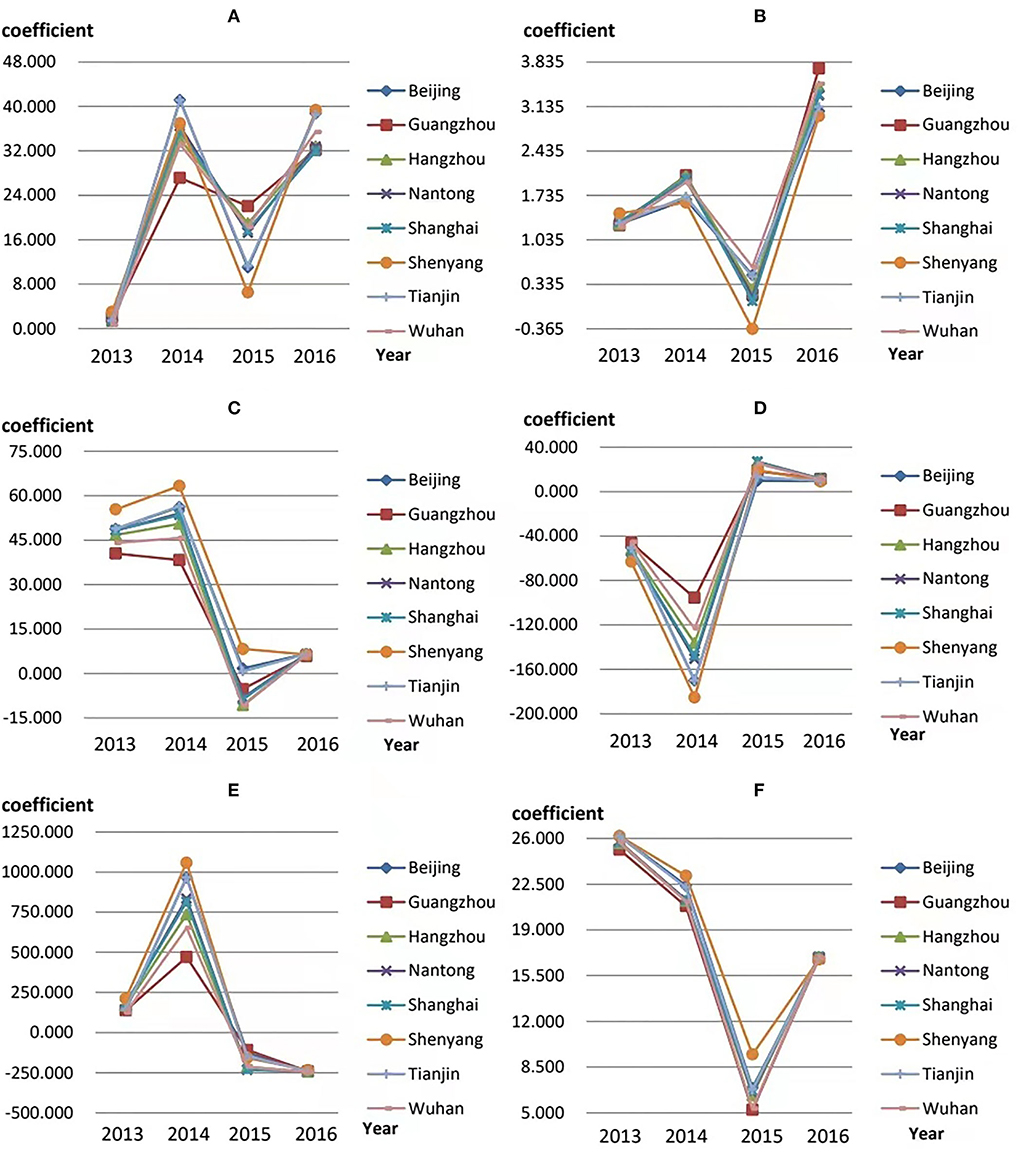
Figure 2. Temporal variation in the estimated coefficients. (A–F) represent the coefficient variations of LAN, PM2.5, per capita consumption expenditure, economic density, population density, and number of medical beds, respectively.
Spatial variation of estimated coefficients
To show the effect of each factor on the spatial distribution of the BC scale more clearly, we will describe them through the spatial distribution characteristics map.
As shown in Figure 3, the average coefficient for LAN displays a pattern in which “the positive correlation increases from west to east.” In other words, the positive impact of LAN on the BC scale is strengthening in eastern China but weaker in western China, which shows consistency with our hypothesis.
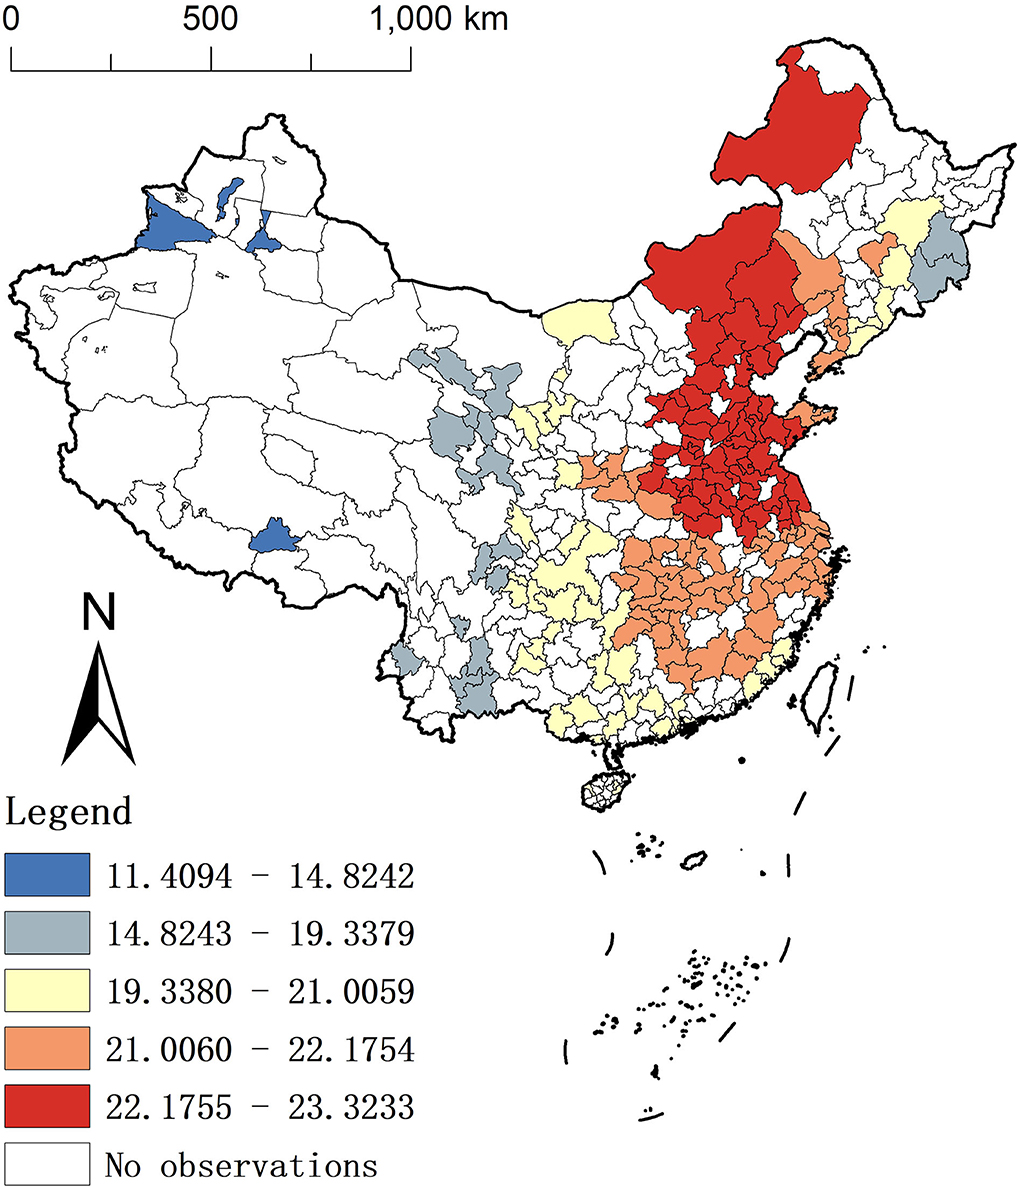
Figure 3. Spatial distribution of the average coefficients for LAN.
In Figures 4A–E represent the spatial distribution of the average coefficients of the GTWR model for the five explanatory variables, PM2.5, per capita consumption expenditure, economic density, population density, and the number of medical beds, respectively, during 2013–2016. According to the spatial patterns, we can summarize them into three forms: (1) Patterns in the north-south direction. The contribution of PM2.5 to the BC scale increases from north to south. In most southern cities, the BC scale was more positively influenced by PM2.5 concentrations, with regression coefficients ranging from 1.79 to 1.84 in the highest rank. (2) The degree of the positive impact shows an increasing pattern from west to east. The variables of per capita consumption expenditure, population density, and number of medical beds all fall into this category. In other words, the BC scale increases less with increasing per capita consumer spending, population density, and number of medical beds in western cities relative to those in the east. (3) The degree of the negative impact also shows an increasing pattern from west to east. The coefficient of economic density is consistent with this pattern. Concretely, a one-unit increase in economic density reduces the BC scale more in eastern cities than in western cities. In addition, the results of population density and economic density in the GTWR model are contrary to the previous OLS, which illustrates the necessity to consider the spatial perspective.
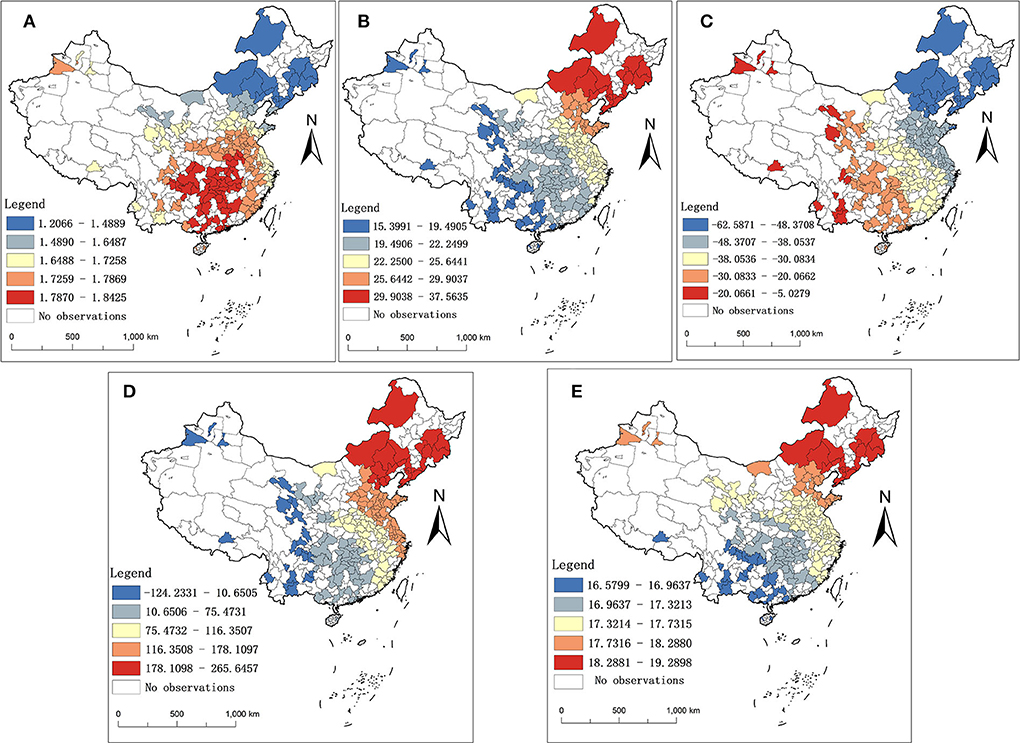
Figure 4. Spatial distribution of the average coefficients for other explanatory variables. (A–E) represent the spatial distribution of the average coefficients of PM2.5, per capita consumption expenditure, economic density, population density, and number of medical beds, respectively.
Discussion
Our study has important implications. First, China is the largest developing country and is representative of the vast regional disparities in economic development and the clustering status of the BC scale. The corresponding policy recommendations can provide lessons for other regions with high BC pathogenesis. Second, compared with the classical regression models (e.g., OLS, GWR, and TWR), the GTWR model, shows the best performance in studying the problem of this study. This result proves the validity of the GTWR model in modeling the spatiotemporal heterogeneity at the BC scale. It also precisely portrays the spatiotemporal leap trajectory of the impact of each explanatory variable on the BC scale, mainly LAN (60). Third, this study focused on the macro factors of the BC scale. It is an innovative exploration compared with previous studies that investigated only from the biogenetic perspective. This study captured the characteristics of macro elements based on their influence on the BC scale. Additionally, it provides an evidence-based foundation for the differentiated implementation of regional health policies. At the same time, it strengthens the government's initiatives in the two dimensions of time and space.
How can governments break the stalemate over the timing of the rise in the BC scale?
The gradual upward trend of the BC scale has intensified over time. From the perspective of governments, to curb or mitigate this trend, they should first focus on the macro factors that affect the BC scale. Governments should not only continue to promote the development of protective factors but also try to curb the deterioration and recurrence of risk factors over time.
First, LAN and PM2.5 always appear to be risk factors for BC. The coefficients for both show an overall increasing time trend (except in 2015), indicating that they have a growing degree of influence on the scale of BC. Therefore, the government needs to take initiatives to reduce overall LAN and PM2.5 in the city, minimize large-scale forms of nighttime operations and continue to impose strict regulations on factory exhaust and vehicle emissions. Second, per capita consumption expenditure and economic density have changed from risk factors to protective factors over time. Spending power and economic density increases indicate that the population is wealthier, and disease prevention is more effective among them (61), which can explain its suppressive impact on BC. Third, the positive impact of the number of medical beds and population density played a more prominent role in increasing the BC scale in 2015–2016. Specifically, the dangerous degree of the number of medical beds first decreased and then rebounded in 2016. Due to the progress of society, abundant medical resources have led to a significant increase in cancer detection rates. In addition, the improvement of medical testing and the enhancement of people's health awareness have played a vital role in slowing down the occurrence of diseases. However, the situation may be worse (62, 63) if we do not consistently reinforce the level of medical care and health awareness. Population density manifested as a transition from protective factors to risk factors. The increasing life expectancy of the elderly and the liberalization of the two-child policy in 2016 have brought a new round of increase in population density. The increase in the population base leads to an increase in population density, which in turn expands the BC scale. If the government can continue to optimize the “birth policy” and “pension policy,” the development of a healthy population structure in China is just around the corner, and the problem of population density will be solved.
How can governments respond to the spatial heterogeneity of the BC scale?
In epidemiological studies, in addition to people and time, location is also a vital dimension (64). The reasons for the heterogeneity in the spatial distribution of the BC scale are diverse (34, 65). Therefore, the government also needs to change the spatial heterogeneity pattern of the BC scale based on multiple macro perspectives and different regions; otherwise, it will be challenging to achieve a breakthrough in “restraining the rapid growth of the BC scale” in the short term.
(1) Considering that lights can directly reflect the local industrialization level, urbanization level, and population concentration (66), its distribution pattern is consistent with China's economic development gradient from west to east, which is relatively reasonable. There is no doubt that LAN extends our leisure, entertainment, office, and study time and makes great contributions to improving our quality of life. However, this is also a hazard. It limits the brightening effect of the stars at night. Additionally, it artificially increases energy consumption, breaks the balance of the natural environment, increases the BC scale, and even seriously damages human life and health. How can we, with government's help, both enjoy the fun of LAN and reduce its health hazards? The eastern region, where the coefficient of LAN is higher, should pay more attention to the management of LAN. The government should focus on setting the lighting source control and lighting limit technical requirements in some developed eastern cities. For example, mitigation can be achieved by investigating the actual needs to provide the minimum lighting level required for walking, driving, and by setting street lights to avoid targeting residential areas. In addition, local governments should implement zoning management for residential, commercial, traffic road, industrial, and landscape areas according to their development (67) and reduce lighting in public spaces to the lowest acceptable level. Furthermore, it is necessary to improve the transparency of information. In the current situation where people lack knowledge about the hazards of light pollution, the government should monitor health warnings and other content on the sales packaging of lighting objects to protect consumers' right to know. Finally, it is worth mentioning that although light pollution control methods emerge in an endless stream, the control process also requires the government to comprehensively consider the local population size, economic development, characteristics of human health development, and the carrying capacity of the medical and health system.
(2) High regression coefficients of PM2.5 were largely concentrated in southern cities of China. Many developed enterprises will emit waste gas because of the pursuit of rapid development. In recent years, although China has strictly monitored the goals of “energy saving, emission reduction, and emission standards,” there are still “fish that slip through the net.” Moreover, low rainfall and wind speed in winter, exogenous imported pollution from northern cities, and high motor vehicle exhaust (68, 69) all contribute to the concentrations of PM2.5 and further lead to higher human breast density and consequently a larger BC scale. Therefore, the southern regions' governments should speed up air pollution management. In the face of air pollution caused by enterprises, it is necessary to carefully approve the site selection of the enterprise, especially the location upwind of the city, and to increase the cost of exhaust emissions through environmental protection tax, etc., and encourage enterprises to eliminate outdated processes and equipment and use more clean energy such as wind energy and solar energy. It is also crucial for the government to continuously strengthen green management in construction as well as vehicle transport management (70, 71). In addition, the government should call on people to prepare necessary protective equipment outdoors, such as masks, to reduce the harm of some inhalable particles.
(3) The regression coefficients of per capita consumption expenditure, population density, number of medical beds, and economic density all have significant regularity in the east-west direction. The specific performance is that the promotion effect of the first three is gradually increasing from west to east, and the latter is the opposite. This reflects, for one thing, the drawbacks of excessive economic development in developed regions, such as people's anxiety due to more significant life stress (72), leading to a greater degree of influence of various risk factors. In addition, it reflects the imbalance of economic resources, population size, and medical resources between the eastern and western regions of China. Therefore, local governments cannot simply pursue economic benefits at the expense of regional population health. The development process of China's eastern and western regions is relatively complex, and the two are at different stages of economic development. The western region is limited by harsh climate and terrain conditions, and the development of various fields lags. However, the eastern region has entered a new stage of focusing on individual characteristics by mapping high technology in the medical field and gathering medical talent. Therefore, the developed eastern region should pay more attention to mental health, while the western region needs to invest in medical resources to alleviate the rapid increase in the BC scale. The government can make significant progress in BC prevention by eliminating the “one size fits all” policy approach across the country.
Limitations
This study also had some limitations. The spatial units involved in this study include only 182 prefecture-level cities, which may lead to insufficient spatial non-stationarity. In larger spatial regions, spatial heterogeneity features are usually more significant. In addition, based on the availability of data, the BC scale was used as the dependent variable instead of using BC morbidity. Although we added population density as an explanatory variable to the model later, there are still limitations in describing the morbidity status of BC. Last, due to the constraints of data and spatial research methods, our explanatory variables do not include micro-level influencing factors such as lifestyle and genetic inheritance, nor do we have macro-level variables covering all fields to achieve a perfect fit with reality. In the future, we will still pay further attention to the shortcomings of these aspects, with the aim of providing a more detailed and realistic description of the effects, the scope of influence, and the degree of influence on BC.
Conclusion
This study evaluated the spatial and temporal associations between the scale of BC and macroscopic factors in 182 prefectural Chinese cities by using the GTWR model. Regardless of the time dimension or the space dimension, the macro factors show obvious differences. If the government cannot take differentiated and targeted measures based on multiple perspectives and different regions, this will seriously restrict the integration of health into all policies. Additionally, it will also make people in different regions lack equity in BC prevention, further exacerbating the unequal development of the region.
We put forward some targeted policy recommendations. First, the control of LAN should focus on the developed cities in the east, especially to set the lighting source control and lighting limit technical requirements and to warn consumers of light hazards. Second, the control of environmental pollutants such as PM2.5 should be led by southern cities. Not only must strict requirements be placed on the source of pollutant emissions, such as restrictions on exhaust emissions from enterprises and automobiles but also the concentration of pollutants must be reduced by increasing the green area. The eastern region in the mature stage of economic development should focus on individual situations, such as immense psychological pressure. The western region, which is relatively lagging in economic development, should focus on economic development and be ready to undertake the transfer of developed medical technology from the eastern region. Last but not least, policies formulated by the government on strengthening economic development and consumption capacity or weakening LAN, PM2.5, etc., must ensure the continuity of time, and continue to progress in the process of “implementation-optimization.”
Data availability statement
The original contributions presented in the study are included in the article/supplementary material, further inquiries can be directed to the corresponding authors.
Author contributions
XB is responsible for writing original draft and revision. XZ is responsible for visualization. HS, YLi, and YC are responsible for writing review and editing. GG, BW, YLa, WX, and YW are responsible for data collection and literature retrieval. BS is responsible for framework design and supervision. YLi is responsible for supervision. All authors contributed to the article and approved the submitted version.
Funding
This work was supported by the Humanities and Social Sciences Foundation of the Ministry of Education of China (Grant No. 19YJCGAT004), National Social Science Foundation of China (Grant No. 20BGJ026), the project “Culture, Port Culture and the Land Port Areas in Consolidating the Sense of Community for the Chinese Nation” by Minzu University of China (MUC) (Grant No. 2021MDZL15), National Ethnic Affairs Commission of the People's Republic of China 2022 Project - A study on the Differentiation of modernization policies in Ethnic Minority areas, and National Natural Science Foundation (72174047 and 71874045).
Acknowledgments
We thank all participants enrolled in this study for their collaboration.
Conflict of interest
The authors declare that the research was conducted in the absence of any commercial or financial relationships that could be construed as a potential conflict of interest.
Publisher's note
All claims expressed in this article are solely those of the authors and do not necessarily represent those of their affiliated organizations, or those of the publisher, the editors and the reviewers. Any product that may be evaluated in this article, or claim that may be made by its manufacturer, is not guaranteed or endorsed by the publisher.
Abbreviations
BC, Breast Cancer; LAN, Light at Night; GTWR, Geographic and Time Weighted Regression; IARC, International Agency for Cancer Research; VIIRS/DNB, Visible Infrared Imaging Radiometer Suite Day/Night Band; CNRDS, Chinese Research Data Services Platform; OLS, Ordinary Least Squares; GWR, Geographically Weighted Regression; TWR, Time Weighted Regression.
References
1. Kou K, Cameron J, Aitken JF, Youl P, Turrell G, Chambers S, et al. Factors associated with being diagnosed with high severity of breast cancer: a population-based study in Queensland, Australia. Breast Cancer Res Treat. (2020) 184:937–50. doi: 10.1007/s10549-020-05905-x
2. Bahari F, Ebadi P, Javaherian M, Hajian P, Mirzaei H. The effectiveness of rational - behavioral - emotional therapeutic approach accretion hope for breast cancer patients. Adv Biores. (2016) 7:32–36. doi: 10.15515/abr.0976-4585.7.5.3236
3. Mayer DK, Nasso SF, Earp JA. Defining cancer survivors, their needs, and perspectives on survivorship health care in the USA. Lancet Oncol. (2017) 18:e11–e8. doi: 10.1016/S1470-2045(16)30573-3
4. Ginsburg O, Bray F, Coleman MP, Vanderpuye V, Eniu A, Kotha SR, et al. The global burden of women's cancers: a grand challenge in global health. Lancet. (2017) 389:847–60. doi: 10.1016/S0140-6736(16)31392-7
5. Tao Z, Shi A, Lu C, Song T, Zhang Z, Zhao J. Breast cancer: epidemiology and etiology. Cell Biochem Biophys. (2015) 72:333–8. doi: 10.1007/s12013-014-0459-6
6. World Health Organization. Latest Global Cancer Data: Cancer Burden Rises to 19.3 Million New Cases and 10.0 Million Cancer Deaths in 2020. (2020). Available online at: https://www.iarc.fr/faq/latest-global-cancer-data-2020-qa/ (accessed December 21, 2021).
7. Azubuike SO, Muirhead C, Hayes L, McNally R. Rising global burden of breast cancer: the case of sub-saharan Africa (with emphasis on Nigeria) and implications for regional development: a review. World J Surg Oncol. (2018) 16:63. doi: 10.1186/s12957-018-1345-2
8. Zhang L, Ridgway LD, Wetzel MD, Ngo J, Yin W, Kumar D, et al. The identification and characterization of breast cancer ctcs competent for brain metastasis. Sci Transl Med. (2013) 5:180ra48. doi: 10.1126/scitranslmed.3005109
9. Goodwin TJ, Zhou Y, Musetti SN, Liu R, Huang L. Local and transient gene expression primes the liver to resist cancer metastasis. Sci Transl Med. (2016) 8:364ra153. doi: 10.1126/scitranslmed.aag2306
10. Voiß P, Höxtermann MD, Dobos G, Cramer H. Mind-body medicine use by women diagnosed with breast cancer: results of a Nationally Representative Survey. Support Care Cancer. (2020) 28:1077–82. doi: 10.1007/s00520-019-04914-x
11. Zhu Z, Xia W, Cui Y, Zeng F, Li Y, Yang Z, et al. Klotho gene polymorphisms are associated with healthy aging and longevity: evidence from a meta-analysis. Mech Ageing Dev. (2019) 178:33–40. doi: 10.1016/j.mad.2018.12.003
12. Saini G, Ogden A, McCullough LE, Torres M, Rida P, Aneja R. Disadvantaged neighborhoods and racial disparity in breast cancer outcomes: the biological link. Cancer Causes & Control. (2019) 30:677–86. doi: 10.1007/s10552-019-01180-4
13. Youngblood VM, Nyirenda R, Nyasosela R, Zuze T, Yang Y, Kudowa E, et al. Outcomes and prognostic factors for women with breast cancer in Malawi. Cancer Causes Control. (2020) 31:393–402. doi: 10.1007/s10552-020-01282-4
14. Fiorica J. Prevention and treatment of breast cancer. Obstet Gynecol Clin North Am. (2001) 28:711–26. doi: 10.1016/S0889-8545(05)70231-X
15. Islam T, Dahlui M, Majid HA, Nahar AM, Mohd Taib NA, Su TT, et al. Factors associated with return to work of breast cancer survivors: a systematic review. BMC Public Health. (2014) 14:S8. doi: 10.1186/1471-2458-14-S3-S8
16. Monticciolo DL, Newell MS, Moy L, Niell B, Monsees B, Sickles EA. Breast cancer screening in women at higher-than-average risk: recommendations from the ACR. J Am Coll Radiol. (2018) 15:408–14. doi: 10.1016/j.jacr.2017.11.034
17. Torre LA, Islami F, Siegel RL, Ward EM, Jemal A. Global cancer in women: burden and trends. Cancer Epidemiol Biomarkers Prev. (2017) 26:444–57. doi: 10.1158/1055-9965.EPI-16-0858
18. Gupta K, Gregory G, Meiser B, Kaur R, Scheepers M, McInerny S, et al. Communicating polygenic risk scores in the familial breast cancer clinic. Patient Educ Counsel. (2021) 104:46. doi: 10.1016/j.pec.2021.02.046
19. Kim YJ, Lee E, Lee HS, Kim M, Park MS. High prevalence of breast cancer in light polluted areas in urban and rural regions of South Korea: an ecologic study on the treatment prevalence of female cancers based on national health insurance data. Chronobiol Int. (2015) 32:657–67. doi: 10.3109/07420528.2015.1032413
20. Bauer SE, Wagner SE, Burch J, Bayakly R, Vena JE. A case-referent study: light at night and breast cancer risk in Georgia. Int J Health Geogr. (2013) 12:23. doi: 10.1186/1476-072X-12-23
21. Keshet-Sitton A, Or-Chen K, Yitzhak S, Tzabary I, Haim A. Can avoiding light at night reduce the risk of breast cancer? Integr Cancer Ther. (2016) 15:145–52. doi: 10.1177/1534735415618787
22. Moghadam F, Namvar H. The roles of lifestyle and psychological disturbance in functional disability of patients with breast cancer. Assess Res Counsel Psychol. (2020) 2:19–34. doi: 10.52547/jarcp.2.1.19
23. White AJ, O'Brien KM, Niehoff NM, Carroll R, Sandler DP. Metallic air pollutants and breast cancer risk in a nationwide cohort study. Epidemiology. (2019) 30:20–8. doi: 10.1097/EDE.0000000000000917
24. Kesson EM, Allardice GM, George WD, Burns HJ, Morrison DS. Effects of multidisciplinary team working on breast cancer survival: retrospective, comparative, interventional cohort study of 13,722 women. Br Med J. (2012) 344:e2718. doi: 10.1136/bmj.e2718
25. Wegrzyn LR, Tamimi RM, Brown SB, Stevens RG, Eliassen AH, Laden F, et al. Rotating night-shift work and the risk of breast cancer in the nurses' health studies. Am J Epidemiol. (2017) 73(Suppl.1):A27.1. doi: 10.1093/aje/kwx140
26. Plascak J, Llanos A, Qin B, Chavali L, Lin Y, Pawlish K, et al. Visual cues of the built environment and perceived stress among a cohort of black breast cancer survivors. Health Place. (2021) 67:102498. doi: 10.1016/j.healthplace.2020.102498
27. Al-Naggar RA, Shirin A. Artificial light at night and cancer: global study. Asian Pacific J Cancer Prev. (2016) 17:4661–4. doi: 10.22034/APJCP.2016.17.10.4661
28. Marlena Z, Warchoł K, Monika B, Agnieszka B. Association between artificial light at night exposure and breast and prostate cancer risk - the review. J Educ Health Sport. (2021) 11:148–60. doi: 10.12775/JEHS.2021.11.08.015
29. Lai KYY, Sarkar C, Ni M, Cheung L, Gallacher J, Webster C. Exposure to light at night (Lan) and risk of breast cancer: a systematic review and meta-analysis. Sci Tot Environ. (2020) 143159:1–11. doi: 10.1016/j.scitotenv.2020.143159
30. Walker WH, Bumgarner JR, Walton JC, Liu JA, Nelson RJ, Devries AC. Light Pollution and Cancer. Boston, MA: Springer (2020). doi: 10.3390/ijms21249360
31. Lamphar H, Kocifaj M, Limón-Romero J, Paredes-Tavares J, Chakameh SD, Mego M, et al. Light pollution as a factor in breast and prostate cancer. Sci Tot Environ. (2022) 806:150918. doi: 10.1016/j.scitotenv.2021.150918
32. Xiao Q, Gierach G, Bauer C, Blot W, James P, Jones R. The association between outdoor artificial light at night and breast cancer risk in black and white women in the southern community cohort study. Environ Health Perspect. (2021) 129:87701. doi: 10.1289/EHP9381
33. James P, Bertrand K, Hart J, Schernhammer E, Tamimi R, Laden F. Outdoor light at night and breast cancer incidence in the nurses' health study II. Environ Health Perspect. (2017) 125:EHP935. doi: 10.1289/EHP935
34. Amin RW, Fritsch BA, Retzloff JE. Spatial clusters of breast cancer mortality and incidence in the contiguous USA: 2000–2014. J Gen Intern Med. (2019) 34:412–9. doi: 10.1007/s11606-018-4824-9
35. Pes G, Fanciulli G, Delitala A, Piana A, Dore M. Spatial association between gastric cancer mortality and Goiter in Sardinia. Asian Pacific J Cancer Prev. (2021) 22:105–10. doi: 10.31557/APJCP.2021.22.1.105
36. Imounga L, Plenet J, Belliardo S, Chine E, Adenis A, Gaillet M, et al. Incidence and mortality of cervical cancer in French Guiana: temporal and spatial trends. Public Health Practice. (2021) 2:100138. doi: 10.1016/j.puhip.2021.100138
37. Luo C, Li N, Lu B, Cai J, Lu M, Zhang Y, et al. Global and regional trends in incidence and mortality of female breast cancer and associated factors at national level in 2000 to 2019. Chinese Med J. (2021) 135:42–51. doi: 10.1097/CM9.0000000000001814
38. Parikh PV, Wei Y. Pahs and Pm25 emissions and female breast cancer incidence in metro Atlanta and rural Georgia. Int J Environ Health Res. (2016) 26:458–66. doi: 10.1080/09603123.2016.1161178
39. Huang B, Wu B, Barry M. Geographically and temporally weighted regression for modeling spatio-temporal variation in house prices. Int J Geogr Inform Sci. (2010) 24:383–401. doi: 10.1080/13658810802672469
40. Xuan H, Zhang A, Lin Q, Chen J. Affecting factors research of chinese provincial economic development-based on Gtwr model. J Indus Technolog Econ. (2016) 2:21. doi: 10.3969/j.issn.1004-910X.2016.02.021
41. Changfa X, Wanqing C. Spatial and temporal analysis of nasopharyngeal carcinoma mortality in China, 1973-2005. Ann Glob Health. (2017) 83:74. doi: 10.1016/j.aogh.2017.03.163
42. Liao Y, Li C, Xia C, Zheng R, Bing X, Zeng H, et al. Spatial distribution of esophageal cancer mortality in China: a machine learning approach. Int Health. (2020) 13:ihaa022. doi: 10.1093/inthealth/ihaa022
43. Fotheringham AS, Charlton ME, Brunsdon C. Geographically weighted regression: a natural evolution of the expansion method for spatial data analysis. Environ Plan. (1998) 30:1905–27. doi: 10.1068/a301905
44. Xia C, Chen W, Chao D, Zheng R, Zhang S, Zeng H, et al. Trends in geographical disparities for cervical cancer mortality in China from 1973 to 2013: a subnational spatio-temporal study. Chin J Cancer Res. (2017) 29:487–95. doi: 10.21147/j.issn.1000-9604.2017.06.03
45. Stevens R, Anderson L. Role of Light in Breast Cancer. Boston, MA: Springer (1999). p. 351–7. doi: 10.1007/978-1-4615-5051-8_57
46. Bidgoli SA, Ahmadi R, Zavarhei M. Role of hormonal and environmental factors on early incidence of breast cancer in Iran. Sci Tot Environ. (2010) 408:4056–61. doi: 10.1016/j.scitotenv.2010.05.018
47. White A, Keller J, Zhao S, Carroll R, Kaufman J, Sandler D. Air pollution, clustering of particulate matter components, and breast cancer in the sister study: a US-wide cohort. Environ Health Perspect. (2019) 127:107002. doi: 10.1289/EHP5131
48. Kenneth WR. Effect of Air Pollution on Athlete Health and Performance. Br J Sports Med. (2012) 46:407–12. doi: 10.1136/bjsports-2011-090823
49. Yaghjyan L, Arao R, Brokamp C, O'Meara ES, Sprague BL, Ghita G, et al. Association between air pollution and mammographic breast density in the breast cancer surveilance consortium. Breast Cancer Res. (2017) 19:36. doi: 10.1186/s13058-017-0828-3
50. Latzko DA. The geographic concentration of economic activity across the Eastern United States, 1820–2010. J Hist Geogr. (2013) 41:68–81. doi: 10.1016/j.jhg.2013.03.003
51. Chagpar AB, Coccia M. Breast cancer and socio-economic factors. Work Pap Public Health. (2012) 7:2012. doi: 10.2139/ssrn.2579208
52. Booth CM Li G, Zhang-Salomons J, Mackillop WJ. The impact of socioeconomic status on stage of cancer at diagnosis and survival: a population-based study in Ontario, Canada. Cancer. (2010) 116:4160–7. doi: 10.1002/cncr.25427
53. Meijer M, Bloomfield K, Engholm G. Neighbourhoods matter too: the association between neighbourhood socioeconomic position, population density and breast, prostate and lung cancer incidence in Denmark between 2004 and 2008. J Epidemiol Community Health. (2013) 67:6–13. doi: 10.1136/jech-2011-200192
54. Akinyemiju TF, Soliman AS, Johnson NJ, Altekruse SF, Welch K, Banerjee M, et al. Individual and neighborhood socioeconomic status and healthcare resources in relation to black-white breast cancer survival disparities. J Cancer Epidemiol. (2013) 2013:490472. doi: 10.1155/2013/490472
55. Bahk J, Jang S. Increased breast cancer mortality only in the lower education group: age-period-cohort effect in breast cancer mortality by educational level in South Korea, 1983–2012. Int J Equity Health. (2017) 16:56. doi: 10.1186/s12939-017-0554-6
56. Tumas N, Niclis C, Osella A, Díaz MdP, Carbonetti A. Trends in Mortality from Breast Cancer in Córdoba, Argentina, 1986-2011: some socio-historical interpretations. Revista Panamericana de Salud Pública. (2015) 37:330–6.
57. Fotheringham A, Brunsdon C, Charlton M. Quantitative Geography: Perspectives on Spatial Data Analysis. London: Sage Publications (2000).
58. Wei Q, Zhang L, Duan W, Zhen Z. Global and geographically and temporally weighted regression models for modeling Pm2.5 in Heilongjiang, China from 2015 to 2018. Int J Environ Res Public Health. (2019) 16:5107. doi: 10.3390/ijerph16245107
59. Chen Y, Chen M, Huang B, Wu C, Shi W. Modeling the spatiotemporal association between covid-19 transmission and population mobility using geographically and temporally weighted regression. GeoHealth. (2021) 5:402. doi: 10.1029/2021GH000402
60. Haim A, Portnov B. Light Pollution as a New Risk Factor for Human Breast and Prostate Cancers. (2013). p. 1–168. doi: 10.1007/978-94-007-6220-6_1
61. Peretti-Watel P. Does primary prevention contribute to increase social inequalities in health?. Rev Epidemiol Sante Publique. (2013) 61(Suppl.3):S158–62. doi: 10.1016/j.respe.2013.05.019
62. Shi L, Tsai J, Kao S. Public health, social determinants of health, and public policy. J Med Sci. (2009) 29:43–59. doi: 10.6136/JMS.2009.29(2).043
63. Hubbard G, Macmillan I, Canny A, Forbat L, Neal RD, O'Carroll RE, et al. Cancer symptom awareness and barriers to medical help seeking in Scottish adolescents: a cross-sectional study. BMC Public Health. (2014) 14:1117. doi: 10.1186/1471-2458-14-1117
64. Sun F, Matthews SA, Yang T-C, Hu M-H. A spatial analysis of the covid-19 period prevalence in U.S. Counties through June 28, 2020: where geography matters? Ann Epidemiol. (2020) 52:54–9.e1. doi: 10.1016/j.annepidem.2020.07.014
65. Liao Y, Li D, Zhang N, Xia C, Zheng R, Zeng H, et al. Application of sandwich spatial estimation method in cancer mapping: a case study for breast cancer mortality in the Chinese Mainland, 2005. Stat Methods Med Res. (2018) 28:096228021881134. doi: 10.1177/0962280218811344
66. Liu H. Regional disparities of China's economic development during 1992-2013-based on Dmsp/Ols nighttime lights data of cities. China Economist. (2017) 6:44–58. doi: 10.19602/j.chinaeconomist.2017.06.04
67. Kim K-T, Oh M-S, Kim H-S. A study on the control standards and an environmental lighting zone-setting method for making light pollution management. J Kor Inst Illuminat Electr Instal Eng. (2011) 25:27. doi: 10.5207/JIEIE.2011.25.12.027
68. Hsu C-H, Cheng F-Y. Classification of weather patterns to study the influence of meteorological characteristics on Pm25 concentrations in Yunlin County, Taiwan. Atmos Environ. (2016) 144:397–408. doi: 10.1016/j.atmosenv.2016.09.001
69. Liu J, Man R, Ma S, Li J, Wu Q, Peng J. Atmospheric levels and health risk of polycyclic aromatic hydrocarbons (Pahs) bound to Pm25 in Guangzhou, China. Mar Poll Bullet. (2015) 100:134–43. doi: 10.1016/j.marpolbul.2015.09.014
70. Mo Y, Booker D, Zhao S, Tang J, Jiang H, Shen J, et al. The application of land use regression model to investigate spatiotemporal variations of Pm25 in Guangzhou, China: implications for the public health benefits of Pm25 reduction. Sci Tot Environ. (2021) 778:146305. doi: 10.1016/j.scitotenv.2021.146305
71. Jeanjean APR, Monks PS, Leigh RJ. Modelling the effectiveness of urban trees and grass on Pm25 reduction via dispersion and deposition at a city scale. Atmos Environ. (2016) 147:1–10. doi: 10.1016/j.atmosenv.2016.09.033
Keywords: breast cancer scale, light at night, macro factors, geographically and temporally weighted regression model, temporal and spatial heterogeneity
Citation: Bai X, Zhang X, Shi H, Geng G, Wu B, Lai Y, Xiang W, Wang Y, Cao Y, Shi B and Li Y (2022) Government drivers of breast cancer prevention: A spatiotemporal analysis based on the association between breast cancer and macro factors. Front. Public Health 10:954247. doi: 10.3389/fpubh.2022.954247
Received: 27 May 2022; Accepted: 12 September 2022;
Published: 04 October 2022.
Edited by:
Xin Li, Nanjing Medical University, ChinaReviewed by:
Mingsheng Chen, Nanjing Medical University, ChinaYanhong Hou, China Pharmaceutical University, China
Redhwan Ahmed Al-Naggar, National University of Malaysia, Malaysia
Copyright © 2022 Bai, Zhang, Shi, Geng, Wu, Lai, Xiang, Wang, Cao, Shi and Li. This is an open-access article distributed under the terms of the Creative Commons Attribution License (CC BY). The use, distribution or reproduction in other forums is permitted, provided the original author(s) and the copyright owner(s) are credited and that the original publication in this journal is cited, in accordance with accepted academic practice. No use, distribution or reproduction is permitted which does not comply with these terms.
*Correspondence: Baoguo Shi, YmdzaGkyMDA4QGhvdG1haWwuY29t; Ye Li, bGl5ZTg0NTlAMTYzLmNvbQ==
†These authors have contributed equally to this work and share first authorship