
95% of researchers rate our articles as excellent or good
Learn more about the work of our research integrity team to safeguard the quality of each article we publish.
Find out more
ORIGINAL RESEARCH article
Front. Public Health , 26 July 2022
Sec. Health Economics
Volume 10 - 2022 | https://doi.org/10.3389/fpubh.2022.949482
This article is part of the Research Topic Asian Pharmaceutical and Medical Device Industry Innovation - Perspectives up to 2050 View all 11 articles
 Feng Hu1†
 Liping Qiu1†
 Wei Xia2†Chi-Fang Liu3Xun Xi4†
 Shuang Zhao5†Jiaao Yu6†
 Shaobin Wei7†Xiao Hu8Ning Su9Tianyu Hu10†Haiyan Zhou11*Zhuang Jin12*
Since the outbreak of Coronavirus Disease 2019 (COVID-19), the Chinese government has taken a number of measures to effectively control the pandemic. By the end of 2021, China achieved a full vaccination rate higher than 85%. The Chinese Plan provides an important model for the global fight against COVID-19. Internet search reflects the public's attention toward and potential demand for a particular thing. Research on the spatiotemporal characteristics of online attention to vaccines can determine the spatiotemporal distribution of vaccine demand in China and provides a basis for global public health policy making. This study analyzes the spatiotemporal characteristics of online attention to vaccines and their influencing factors in 31 provinces/municipalities in mainland China with Baidu Index as the data source by using geographic concentration index, coefficient of variation, GeoDetector, and other methods. The following findings are presented. First, online attention to vaccines showed an overall upward trend in China since 2011, especially after 2016. Significant seasonal differences and an unbalanced monthly distribution were observed. Second, there was an obvious geographical imbalance in online attention to vaccines among the provinces/municipalities, generally exhibiting a spatial pattern of “high in the east and low in the west.” Low aggregation and obvious spatial dispersion among the provinces/municipalities were also observed. The geographic distribution of hot and cold spots of online attention to vaccines has clear boundaries. The hot spots are mainly distributed in the central-eastern provinces and the cold spots are in the western provinces. Third, the spatiotemporal differences in online attention to vaccines are the combined result of socioeconomic level, socio-demographic characteristics, and disease control level.
In the long history of human beings, vaccines have been a powerful weapon to fight against infectious diseases. Many infectious diseases have been controlled or eliminated by vaccination. Vaccination is one of the most effective and cost-effective measures to prevent infectious diseases in humans at present. Through widespread vaccination, smallpox was eradicated globally in 1979, as declared by World Health Organization (WHO). The incidences of polio, plague, measles, rabies, pertussis, tetanus, viral hepatitis B, etc. have also been dramatically reduced by vaccination. Since the outbreak of Coronavirus Disease 2019 (COVID-19), the Chinese government has taken a number of measures to effectively control the pandemic (1, 2). By the end of 2021, China achieved a full vaccination rate of higher than 85%. The Chinese Plan provides an important model for the global fight against COVID-19. Dr. Bruce Aylward, team leader of the WHO-China joint mission on COVID-19, stated that China was taking a rigorous and innovative approach to standard public health measures (3). By using a large-scale science-driven flexible mechanism, China has prevented the spread of COVID-19 and changed its course. Dr. Aylward also suggested China was the only country to have the most experience and achievements in the fight against COVID-19, and that other countries should learn from China's rapid response mechanism (4).
With the rapid development of mobile networks, Internet search data are widely used in epidemiological research with the ultimate goal of informing public health and policy (5, 6). Internet search data not only enable Internet users to obtain the required disease prevention information in a short period of time but also assist the government and medical institutions in market forecasting. The general public has formed the habit of searching the Internet for information about the COVID-19 pandemic, prevention methods, drug purchases, and the effect of vaccines (7–9). Accordingly, there has been an increasing public search for and interest in vaccines, from routine ones, such as HPV (10–18), HIV (19–22), and polio (23–28), to those that are promoted during pandemics, such as SARS (29–32), H1N1 (33–40), and COVID-19 (41–52). How to determine public concerns about vaccines is becoming the focus of research in government and medical system decision-making. A literature review revealed that research on online attention to vaccines (OAV) mainly investigated different vaccine types (10–52), correlation with vaccination rates (10, 23), impact on vaccination (44, 53), and vaccination demand prediction and trend analysis (54–57) based on internet search data in terms of different disciplines and perspectives. The concept of the online attention has been widely used in the research of public health events, such as vaccines, but it is mostly based on a single platform and English cultural background.
However, the above studies are mostly based on Google search data, which are primarily relevant to English-speaking countries. Additional research is required to determine whether their conclusions are applicable to other cultures, backgrounds, and search engines. Due to the inaccessibility of Google Search, Baidu is the primary search engine used in China. In 2019, Baidu ranked first in China with a penetration rate of 90.9% (58). Hence, Baidu search data better reflect the public need for vaccines in China than other search engines. Baidu Index shows the changes in the search volume of a particular keyword over time, and directly and objectively reflects the interests and needs of Chinese internet users. Baidu has become one of the most important online platforms for statistical analysis in China (59). As of March 2021, Baidu ranked first in the three major search engine markets (all-platform, PC, and mobile) in China (it had a 70.18% share of the Chinese search engine market in March 2021). Therefore, Baidu Index is reliable. Infodemiology studies based on the Baidu Index platform mainly involve the application in COVID-19 prediction and monitoring (60, 61) but have not investigated OAV. In terms of research content, few studies have analyzed the spatial characteristics of OAV and their causes. Therefore, exploring the spatial characteristics of OAV, the influencing factors, and their effects using Baidu Index data will enable the identification of problems from a new perspective and help to understand and manage public health behaviors in the long term. Internet searches using keywords like vaccines reveal the attention of internet users to vaccines, reflect local awareness and needs for vaccines, and provide a basis for global public health policy making.
Accordingly, this study aims to analyze OAV in 31 provinces/municipalities in China (excluding Hong Kong, Macau, and Taiwan) with Baidu Index as the data source and using measures, such as geographic concentration index and coefficient of variation. Moreover, factors affecting OAV in each province/municipality in 2011, 2017, and 2020 were investigated using indicators, such as GDP per capita and urbanization rate.
Just like Google Trends, Baidu Index follows certain rules for calculation and retrieval (62). Data collected from Baidu Index is standardized. It allows researchers to select data from different geographic regions, across gender and other characteristics, during a defined sampling time frame.
To examine the Chinese people's attention to vaccines, data for this study are from Baidu Index (https://index.baidu.com/). Searches using the keyword “vaccine” on https://www.aizhan.com/ and https://www.chinaz.com/ revealed that search terms with the highest search volumes were “vaccine,” “COVID-19 vaccine,” “HPV vaccine,” “9-valent vaccine,” and “vaccination.” At the same time, we took into account that Baidu Index included mobile data in its calculation in 2011, therefore, using these terms as the keywords, the internet search index for the vaccine from January 1, 2011 to December 31, 2021 was calculated to reflect the degree of online attention of interested people/potentially interested people and its changes.
However, keyword data are time sensitive. For example, data on “The COVID-19 vaccine” were not available until February 24, 2020. Therefore, the data sampling period for the empirical part of this study is between February 24, 2020 and December 31, 2021. The same approach was adopted for the data sampling period of the remaining vaccine keywords.
The Baidu Index data revealed a significant trend: Chinese people were more concerned about vaccination status in China. Global vaccination status had no significant impact on searches in China. For example, Baidu Index did not increase significantly on September 21, 2020, when the WHO announced the global COVID-19 vaccine program, COVAX. At that time, vaccination had achieved great success in China, which was significantly different from the situation in other countries.
In terms of research data on influencing factors, GDP size, GDP per capita, urbanization rate, age structure, education, year-end permanent population, sex ratio, infectious disease incidence, and infectious disease mortality were selected as the influencing factors. Data on infectious disease incidence, infectious disease mortality, and sex ratio were from the China Health Statistical Yearbook; data on sex ratio were from 2010, 2016, and 2020 census; and data on the remaining influencing factors were from the China Statistical Yearbook.
The spatiotemporal differences in OAV in China since 2011 were assessed using five measures, including coefficient of variation (CV), Herfindahl index (H), primacy index (P), geographic concentration index (G), and seasonal concentration index (S). Influencing factors were analyzed using GeoDetector.
Coefficient of variation (CV) is the ratio of the standard deviation to the mean and shows the degree of variability among the sample measures.
where CV is the degree of variability in OAV among regions. The larger the CV, the more significant the spatial variability in OAV.
Herfindahl index (H) is a comprehensive measure of concentration, reflecting the degree of agglomeration of the regional economic scale. Its value ranges from 0 to 1. The closer it is to 0, the lower the degree of regional economic agglomeration.
where Pi is the ratio of the index of a particular location to the total number. The closer H is to 1, the higher the regional agglomeration of OAV.
Primacy index (P) is a relevant measure in economies of scale and agglomeration and is measured by the ratio of the economic scale of the first-ranked region to that of the second-ranked region, reflecting the degree of agglomeration of regional economies.
where P1 and P2 are the OAV in the regions with the first and second largest scales, respectively. It aims to analyze the concentration of OAV. The larger the P, the more concentrated and uneven the OAV is.
The geographic concentration index (G) is a measure of the geographical concentration of economic activity. It reflects the regional concentration or dispersion of OAV. The closer the G is to 100, the more concentrated the OAV is in a particular region; otherwise, the more dispersed it is.
where Pj is the OAV in region j, and P is the total OAV.
Seasonal concentration index (S) reflects the temporal concentration of OAV.
where xi is the ratio of the monthly to annual total OAV. The larger the S, the more uneven the distribution throughout the year, and the greater the temporal variability in OAV, and vice versa.
Global spatial autocorrelation (Moran's I) is used to test the spatial distribution of OAV among provinces/municipalities in China. It is calculated as follows:
where , xi is the attribute value at i, x is the arithmetic mean of xi, and Wij is the spatial weight matrix.
For hot and cold spot analysis (Getis-Ord Gi), according to Getis and Ord (63), the Gi statistic for each area unit i is:
where wij is the spatial weight value (the spatial weight matrix using the same determination method and specific form as above in Moran's I), and xj is the observed value of unit j.
GeoDetector is a spatial analysis model used to assess the relationship between a geographical attribute and its explanatory factors (64). It is widely used to investigate the influencing factors of natural and socioeconomic phenomena. GeoDetector requires only a few preconditions and has obvious advantages when dealing with mixed-type data. The factor detector in GeoDetector was used to assess the explanatory power of each influencing factor and its changes in the evolution of OAV. The factor detector is expressed as follows:
where q is the detection capability of an influencing factor for OAV; h = 1... L is the classification of each factor of the variable; L is the number of secondary provinces/municipalities; σ2 is the variance of OAV in primary provinces/municipalities; is the variance of OAV in secondary provinces/municipalities; N is the number of primary provinces/municipalities, and Nh is the number of secondary provinces/municipalities. The value range of q is [0, 1]. The larger the q, the greater the influence of this factor on OAV in each province/municipality.
As shown in Figure 1, the total OAV in China increased dramatically from only 890,000 in 2011 to 38,487,600 in 2021, exhibiting a general upward trend. Since 2013, a series of vaccine scandals, such as illegal vaccines in Shandong, and falsification of rabies vaccine production records, had drawn public attention to vaccines. Such attention began to increase significantly in 2016 when the HPV vaccine for cervical cancer prevention was approved in China. There had been a dramatic increase in OAV since 2019 due to the COVID-19 pandemic. Moreover, OAV in the eastern region increased from 379,700 in 2011 to 18,317,000 in 2021, always higher than the national level and those in the central and western regions. OAV in the central region was slightly higher than that in the western region. It generally exhibited a decreasing trend from the eastern to central to western regions.
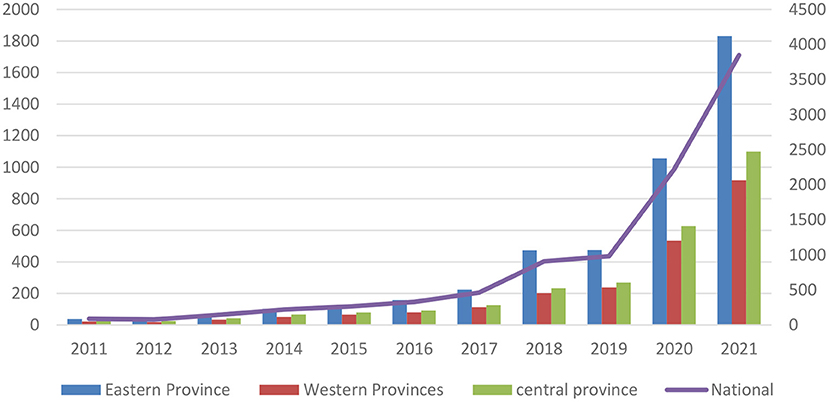
Figure 1. Changes in OAV from 2011 to 2019 (unit: 10,000).
The ratios of OAV of each month to the monthly average were calculated in Table 1. Except for a few years, the ratios for March, May, July, August, and December were all >1. In particular, the ratio for July was 1.20, and that for August was 1.15. These 5 months can be considered the peak season for vaccine searches. The ratios for January and February were between 0.7 and 0.9, and these 2 months are thus defined as the off-season for vaccine searches. The ratios for April, June, September, October, and November were between 0.9 and 1, and these 5 months are regarded as the shoulder season for vaccine searches. The seasonal concentration index of OAV was >4 from 2011 to 2021, with an average of 5.73, indicating uneven monthly distribution and obvious seasonal differences in OAV in China. The monthly data were aggregated into quarterly data according to the conventional definition of seasons to analyze the quarterly distribution of OAV. In the 2011–2021 period, the indices of OAV in spring, summer, autumn, and winter were 1966.06, 2706.84, 2664.12, and 2339.34, respectively. Summer and autumn are the seasons with higher OAV. Between 2015 and 2019, the average Herfindahl index of national OAV was <0.1, which once again demonstrates the uneven monthly distribution and significant seasonal differences in OAV. In addition, it is worth noting that the month-on-month growth rates in 2020 are larger than those in 2019 due to the COVID-19 pandemic.
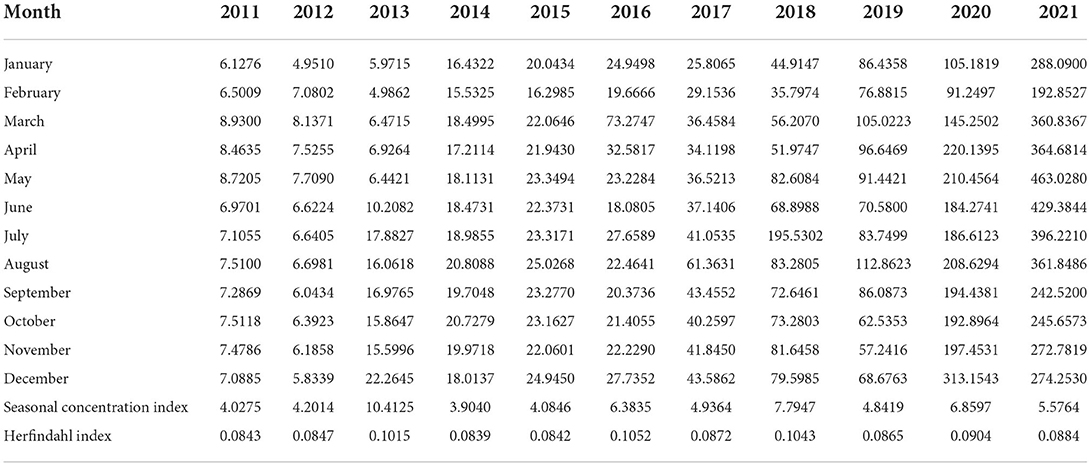
Table 1. OAV in each month in China between 2011 and 2019 (unit: 10,000).
As shown in Table 2, there were obvious geographical imbalances in OAV in China. The highest OAV was measured in Guangdong, Jiangsu, Zhejiang, Beijing, Shandong, and Shanghai in the eastern region, and Henan in the central region. In 2011, the top 10 provinces/municipalities in terms of OAV were Beijing, Shandong, Guangdong, Zhejiang, Henan, Shanghai, Jiangsu, Hebei, Hubei, and Shaanxi, accounting for 47.33% of the national total. In 2016, the top 10 provinces/municipalities were Guangdong, Beijing, Zhejiang, Jiangsu, Shanghai, Sichuan, Shandong, Henan, Hubei, and Fujian, accounting for 53.74% of the national total. In 2021, the top 10 provinces/municipalities were Guangdong, Jiangsu, Shandong, Zhejiang, Beijing, Henan, Sichuan, Hebei, Shanghai, and Anhui, accounting for 54.21% of the national total. The proportion of the top 10 provinces/municipalities in 2021 was greater than those in 2011 and 2016, indicating increasing regional differences in OAV in China.
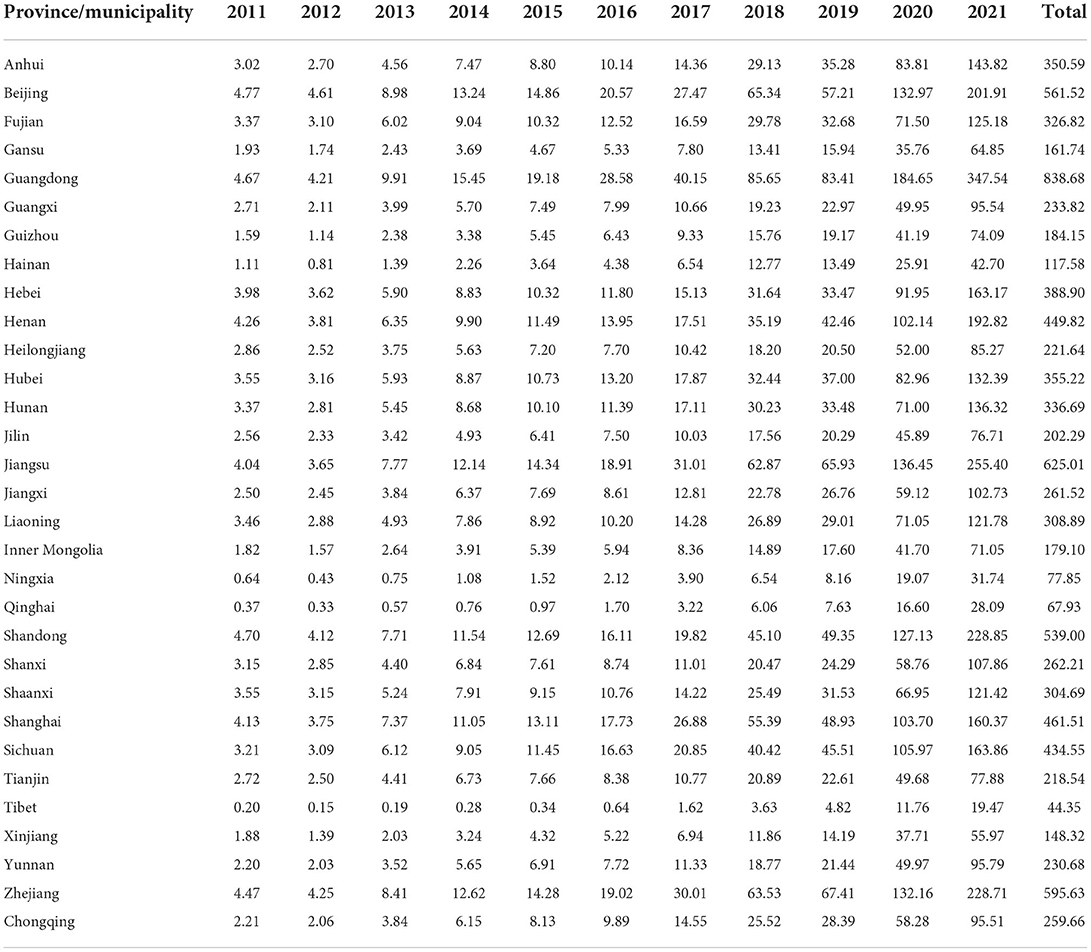
Table 2. OAV in each province/municipality between 2011 and 2021 (unit: 10,000).
To describe the regional differences in OAV among the 31 provinces/municipalities in mainland China, a comprehensive analysis was conducted using the coefficient of variation, Herfindahl index, geographic concentration index, and primacy index (Table 3).
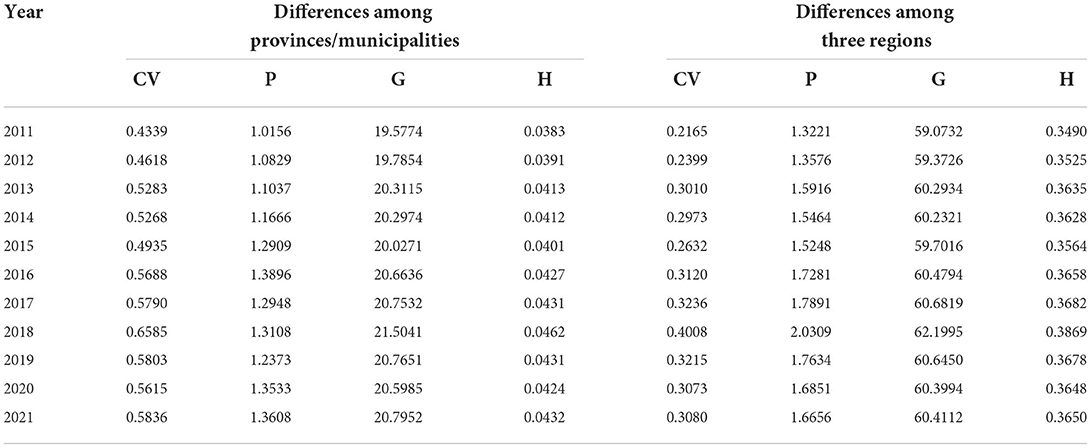
Table 3. Differences in OAV among provinces/municipalities and among the three regions in China from 2011 to 2021.
Large spatial differences with unstable fluctuations were found in OAV in the 2011–2021 period. The coefficient of variation in the 10-year period was approximately 0.54 on average and increased ear by year. The Herfindahl index was close to 0 and showed small fluctuations, indicating low agglomeration and obvious spatial dispersion of OAV among the various provinces/municipalities. The primacy index remained <2 and fluctuated slowly, and the geographic concentration index was also small, indicating moderate agglomeration and normal spatial structure of OAV among the various provinces/municipalities.
Moreover, there were spatial differences in OAV among the eastern, central, and western regions in the 2011–2021 period. The coefficient of variation maintained a fluctuating growth year by year, with the lowest degree of difference among the three regions in 2011. The Herfindahl index was approximately 0.36 and generally increased year by year, indicating a spatial concentration trend of OAV. The primacy index remained <2 and increased year by year, indicating that there was an increasing difference in OAV between the first and second-ranked regions. The average geographical concentration index was 60.37, and the gap was widening. It suggests that OAV was increasingly concentrated in a particular region from 2011 to 2021.
Furthermore, Table 4 was prepared to measure OAV within the eastern, central, and western regions in mainland China. The comparison revealed obvious spatial differences in OAV within eastern, central, and western China in the 2011–2021 period. The coefficient of variation generally showed a decreasing trend from the western to eastern to central regions. It indicates that the spatial difference in OAV was relatively large in the western region and relatively small in the central region and that internet users in all provinces/municipalities in the eastern region generally paid close attention to vaccines. From 2011 to 2021, the Herfindahl index in all three regions was >0.1 and fluctuated only slightly. It suggests that OAV was dispersed within each region, without excessive aggregation in one or a few provinces/municipalities. Geographic concentration indices in the three regions fluctuated slightly between 32 and 34 in the 2011–2021 period, indicating a low agglomeration and spatial dispersion of OAV in each region. In the 10-year period, the primacy indices of OAV in all three regions were >1 and remained stable. It suggests that there were small differences between the first and second-ranked provinces/municipalities, indicating a low agglomeration and balanced spatial structure of OAV within each region.
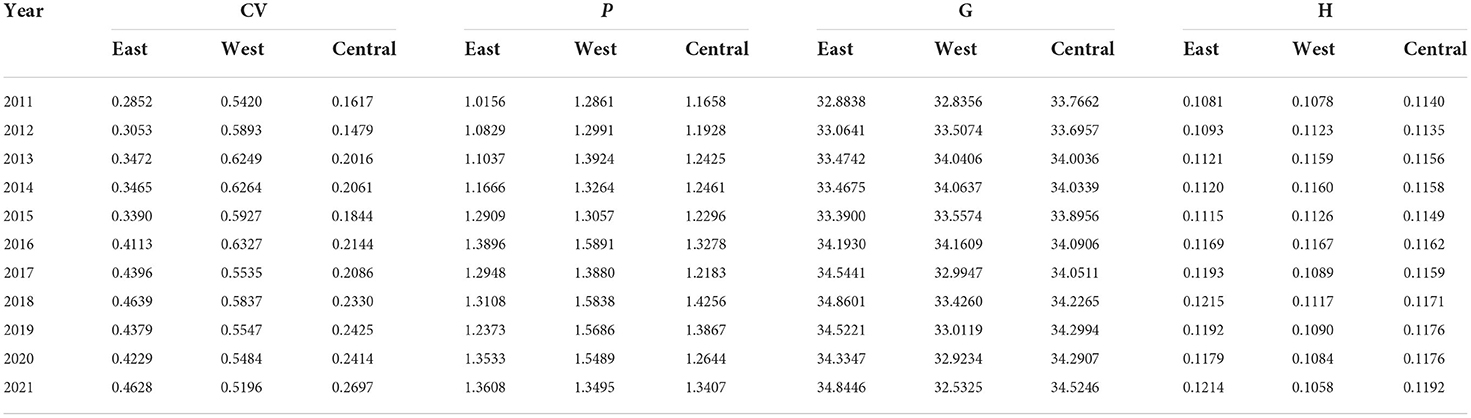
Table 4. Intra-regional differences in OAV from 2011 to 2021.
Global Moran's I was used to preliminarily examine the spatial agglomeration characteristics of OAV, and very significant results (Moran's I = 0.119711, Z-score = 2.858161, p = 0.004261) were obtained, indicating a strong spatial autocorrelation for OAV. It fully demonstrates the spatial characteristics of high and low-value agglomeration of OAV in China.
The distribution of hot and cold spots of OAV in China was determined by using the Gi statistic to detect local hot spots. The Gi statistic was divided into four levels from high to low by Jenks's natural breaks (Figure 2). The results show that hot and cold spots are distributed in east and west China, respectively, and have clear boundaries. The hotspots are mainly distributed in the central-eastern coastal provinces, of which the Yangtze River Delta provinces are the core hot spot area. The remaining central-eastern region is the sub-hot spot area. The average OAV was 3,060,700 in this region. The eastern coastal region is developed in the traditional sense, where China's three major urban agglomerations are located. On the one hand, this region has a large number of permanent residents and a dense population, and on the other hand, it has a high level of education, thus resulting in high demand and awareness of vaccines. The cold spots are distributed in the western region, including Xinjiang, Tibet, and Qinghai. The average OAV was 868,700. Specifically, Tibet and Qinghai are the core cold spot area, and Xinjiang is the sub-cold spot area. The western region, especially the northwest region, is relatively insensitive to vaccines due to its deep inland location and low population density. On the whole, the spatial distribution of OAV can be preliminarily attributed to the socioeconomic conditions and population size based on the differences in the distribution of hot and cold spots between east and west China. In other words, socioeconomic conditions and population size promote OAV to a certain extent.
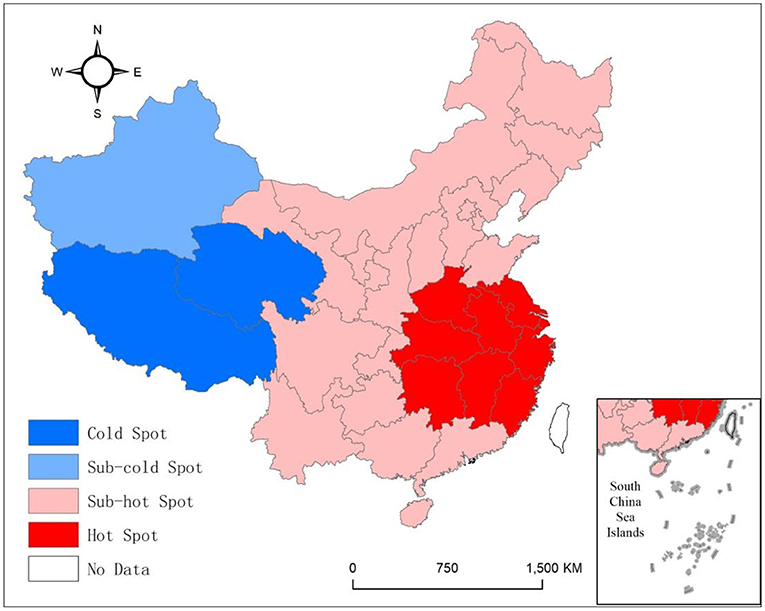
Figure 2. Distribution of hot and cold spots of OAV in China.
Considering comprehensiveness and data availability, and due to the fact that the influencing factor indicators in 2021 have not yet been published, provincial/municipal OAV in 2011, 2017, and 2020 was used as the explained variable. In particular, 2017 was also selected to detect the changes in influencing factors after the approval of the HPV vaccine for cervical cancer prevention. The correlation coefficients between OAV and its influencing factors were calculated using 13 explanatory variables, such as GDP, per capita GDP, urbanization rate, and infectious disease incidence. Before employing the GeoDetector, the independent variables were stratified by natural breaks using ArcGIS. Each influencing factor was divided into five classes. Consistent classification criteria were applied at different stages. Finally, the GeoDetector was used to measure the influence of each influencing factor on OAV. The results are shown in Table 5.

Table 5. Correlation coefficient between OAV and its influencing factors.
The GeoDetector results show that only 6–7 of the 13 factors have an influence on the spatial distribution of OAV, indicating that the distribution of OAV is affected by various factors, such as the economic strength and level of disease control of the provinces/municipalities. The explanatory power of each influencing factor is between 40 and 90%. They can be divided into primary and secondary influencing factors according to the explanatory power. The primary influencing factors include infectious disease incidence and GDP size. Secondary influencing factors include the number of people aged 15–64, the number of people aged 65 and above, the number of people in junior college or higher education, and the year-end population.
The incidence of infectious diseases has the most significant influence on the spatial distribution of OAV. q values were at least as high as 0.86, indicating that the incidence of infectious diseases has a great influence on OAV in each province/municipality. Infectious diseases pose a great threat to public health. Vaccination is the most cost-effective and effective public health intervention for the prevention and control of infectious diseases. For families, it is also an effective means to reduce the incidence of diseases and consequent medical expenses. The incidence of infectious diseases (1/100,000) in China decreased from 2139.69 in 1955 to 190.36 in 2020 as a result of vaccination. The mortality (1/100,000) also decreased from 18.43 in 1955 to 1.87 in 2020. The influence of infectious disease incidence on OAV in 2017 (0.8634) decreased compared with 2011 but increased again in 2020, which might be due to the outbreak of COVID-19.
The influence of GDP size on OAV is self-evident. The greater the GDP size, the more developed the urban infrastructure and services, and the higher the level of informatization. The regression results revealed that except for 2017, the q-values were all >0.8. The more developed a region is, the better the public understanding of vaccines, and the better the health services and facilities, leading to higher public attention to vaccines. The influence of GDP size on OAV increased significantly in 2020 as compared to 2011 to 2017, which may be related to the fact that most COVID-19 cases occurred in relatively developed regions. GDP per capita reflects the local per capita income level to a certain extent. This influencing factor was only significant in regression analysis for 2017, which may be related to the approval of the HPV vaccine for cervical cancer prevention. The total HPV vaccination costs ranged from more than one thousand yuan to even tens of thousands of yuan which included extra costs incurred due to its scarcity. This is a high cost and thus people with higher incomes are more likely to consider vaccination. In recent years, many provinces/municipalities have provided free vaccination for females of the appropriate age, thus making this influencing factor insignificant. The influence of the urbanization rate was not significant in regression analysis, and the q-value decreased year by year. This result is closely related to the improvement of rural infrastructure and the popularization of the Internet in the process of rural revitalization in China in recent years. According to the 48th Statistical Report on the Development of Internet in China, as of June 2021, the Internet penetration rate in China's urban and rural areas was 78.3 and 59.2%, respectively, and the gap in Internet penetration between urban and rural areas is narrowing year by year.
In terms of age structure, the influence of children aged 0–14 was not significant. This may be related to China's childhood immunization program, which implements free and mandatory vaccination for children at this age stage. The influences on people aged 15–64 and those aged 65 and above were not significant. One possible reason is that these groups already have some understanding of vaccines. Another possible reason is that according to the 48th Statistical Report on the Development of Internet in China, more than 80% of Chinese internet users are over the age of 20. Hence, these groups also constitute the main body of internet users. A significant influence was observed for people with the junior college or higher education, indicating that OAV in each province/municipality in China was indeed affected by local education levels. The regression results from GeoDetector for the year-end population were also significant, indicating that the population size of provinces/municipalities also influenced OAV and that this influence increased year by year.
This study investigated the characteristics and spatial evolution of OAV in 31 provinces/municipalities in China since 2011 by spatial data analysis and analyzed the influencing factors by GeoDetector. The following conclusions are drawn:
First, the overall OAV in China showed a rising trend from 2011 to 2021, especially after 2016 due to the HPV vaccines for cervical cancer prevention and the COVID-19 vaccines. The peak season for OAV is May, December, March, August, and July. The monthly distribution of OAV in China was uneven, with obvious seasonal differences.
Second, in the 2011–2021 period, there were significant differences in OAV among provinces/municipalities in China, exhibiting a spatial pattern of “high in the east and low in the west.” The highest OAV was measured in Guangdong, Jiangsu, Zhejiang, Beijing, Shandong, and Shanghai in the eastern region, and Henan in the central region. There were large spatial differences with unstable fluctuations, low agglomeration, and obvious dispersion of OAV among provinces/municipalities in the 2011–2021 period. There was an increasing spatial concentration trend of OAV among the eastern, central, and western regions, and an increasing difference between the first and second-ranked regions in the 2011–2021 period.
Third, there were differences in OAV within the eastern, central, and western regions. From the perspective of inter-regional differences, the coefficient of variation generally showed a decreasing trend from the western to eastern to central regions. The Herfindahl index in all three regions was >0.1 and fluctuated only slightly, suggesting that there was no excessive aggregation of OAV in one or a few provinces/municipalities. The primacy indices of OAV in all three regions were >1 and remained stable. The geographic concentration index fluctuated between 32 and 34. It suggests that there were small differences between the first and second-ranked provinces/municipalities, indicating a dispersion, low agglomeration, and balanced spatial structure of OAV within each region.
Fourth, OAV in China showed the spatial characteristics of high and low-value agglomeration. The hotspots are mainly distributed in the central-eastern coastal provinces, of which the Yangtze River Delta provinces are the core hot spot area. The remaining central-eastern region is the sub-hot spot area. The cold spots are distributed in the western region. The spatial distribution of OAV can be preliminarily attributed to the socioeconomic conditions and population size. In other words, socioeconomic conditions and population size promote OAV to a certain extent.
Fifth and lastly, the GeoDetector analysis shows that socioeconomic level, socio-demographic characteristics, and disease control level are the main factors influencing the spatiotemporal differences in OAV. Specifically, the primary influencing factors include infectious disease incidence and GDP size. Secondary influencing factors include the number of people aged 15–64, the number of people aged 65 and above, the number of people in junior college or higher education, and the year-end population.
The results of this study provide some implications for policy-makers.
First, vaccine awareness is generally low in remote areas, such as western China. Local governments need to improve the public's knowledge of infectious diseases and the benefits of vaccination to increase the vaccination rate in appropriate age groups. In particular, given that the COVID-19 pandemic has not ended, much still remains to be done to promote COVID-19 vaccination. Although remote areas are sparsely populated, there is still a great risk of COVID-19 exposure from other areas. Vaccination is the most effective measure to control the COVID-19 pandemic at present. There is an urgent need to raise public awareness on vaccination for the prevention of COVID-19.
Second, some vaccines, such as HPV vaccines, may have high costs. Wherever possible, local governments should try their best to offer convenient medical insurance at a low price, and reduce the cost of vaccination by measures such as medical insurance funds or partner assistance to reduce the incidence of infectious diseases.
Third and last, there are differences between young and middle-aged people and the elderly in the ways and convenience of receiving information. Hence, different measures should be implemented for different age groups for publicity of vaccines and infectious diseases. For example, offline publicity can be given to the elderly through senior activity centers.
Despite its contribution, this study has some limitations. On the one hand, the Baidu engine is not the only search tool used by Chinese internet users. In recent years, with the rise of large online platforms, such as 360 and Sogou, other search engines have also been used. Therefore, the data used for this study are not comprehensive enough. On the other hand, the influencing factors included in this study are still limited. There may be other influencing factors that need to be addressed. Further research is also required to better understand the mechanism of the influencing factors.
The original contributions presented in the study are included in the article/supplementary material, further inquiries can be directed to the corresponding author/s.
All authors undertook research, writing, and review tasks throughout this study. All authors have read and agreed to the published version of the manuscript.
This work was supported by the Major Program of the National Social Science Foundation of China [grant number 20&ZD124], the National Natural Science Foundation of China [grant numbers 72103129, 72173014, 71973129, 72072162, and 71773115], the National Social Science Foundation of China [grant number 21CJY024], the Philosophy and Social Science Program of Zhejiang [grant number 22NDQN290YB], and the Humanity and Social Science Foundation of Ministry of Education of China [grant numbers 21YJA790043, 21YJA630037, 19YJA790107, 18YJA790088, and 21YJCZH213].
The authors declare that the research was conducted in the absence of any commercial or financial relationships that could be construed as a potential conflict of interest.
All claims expressed in this article are solely those of the authors and do not necessarily represent those of their affiliated organizations, or those of the publisher, the editors and the reviewers. Any product that may be evaluated in this article, or claim that may be made by its manufacturer, is not guaranteed or endorsed by the publisher.
1. Hu F, Qiu L, Xi X, Zhou H, Hu T, Su N, et al. Has COVID-19 Changed China's digital trade?-implications for health economics. Front Publ Health. (2022) 10:831549. doi: 10.3389/fpubh.2022.831549
2. Hu F, Shi X, Wang H, Nan N, Wang K, Wei S, et al. Is health contagious?-Based on empirical evidence from China family panel studies' data. Front Publ Health. (2021) 9:691746. doi: 10.3389/fpubh.2021.691746
3. Cohen KK. China's aggressive measures have slowed the coronavirus. They may not work in other countries. Science. (2020) 367:727. doi: 10.1126/science.abb5426
4. Aylward B, Liang W. Report of the WHO-China joint mission on coronavirus disease 2019 (COVID-19). Geneva: WHO, (2020).
5. Eysenbach I. Tracking flu-related searches on the web for syndromic surveillance. In: AMIA Annu Symp Proc. (2006) p. 244–8.
6. Infodemiology EG. infoveillance: framework for an emerging set of public health informatics methods to analyze search, communication and publication behavior on the Internet. J Med Internet Res. (2009) 11:e11. doi: 10.2196/jmir.1157
7. Xi X, Wei S, Lin K-L, Zhou H, Wang K, Zhou H, et al. Digital technology, knowledge level, and food safety governance: implications for national healthcare system. Front Publ Health. (2021) 9:753950. doi: 10.3389/fpubh.2021.753950
8. Hu F, Xi X, Zhang Y. Influencing mechanism of reverse knowledge spillover on investment enterprises' technological progress: an empirical examination of Chinese firms. Technol Forecast Soc Change. (2021) 169:120797. doi: 10.1016/j.techfore.2021.120797
9. Hu F, Qiu L, Zhou H. Medical device product innovation choices in Asia: an empirical analysis based on product space. Front Publ Health. (2022) 10:871575. doi: 10.3389/fpubh.2022.871575
10. Kalichman SC and Kegler C. Vaccine-related internet search activity predicts H1N1 and HPV vaccine coverage: implications for vaccine acceptance. J Health Commun. (2015) 20:259–65. doi: 10.1080/10810730.2013.852274
11. Simonart T, Hoai X-LL, De Maertelaer V. Impact of human papillomavirus vaccine in reducing genital warts: a Google trends analysis. J Am Acad Dermatol. (2022) 86:956–8. doi: 10.1016/j.jaad.2021.03.091
12. Gollust SE, LoRusso SM, Nagler RH, Fowler EF. Understanding the role of the news media in HPV vaccine uptake in the United States: synthesis and commentary. Hum Vaccines Immunother. (2016) 12:1430–4. doi: 10.1080/21645515.2015.1109169
13. Fu LY, Zook K, Spoehr-Labutta Z, Hu P, Joseph JG. Search engine ranking, quality, and content of web pages that are critical versus noncritical of human papillomavirus vaccine. J Adolesc Health. (2016) 58:33–9. doi: 10.1016/j.jadohealth.2015.09.016
14. McRee A-L, Reiter PL, Brewer NT. Parents' Internet use for information about HPV vaccine. Vaccine. (2012) 30:3757–62. doi: 10.1016/j.vaccine.2011.11.113
15. Nan X, Madden K. HPV vaccine information in the blogosphere: how positive and negative blogs influence vaccine-related risk perceptions, attitudes, and behavioral intentions. Health Commun. (2012) 27:829–36. doi: 10.1080/10410236.2012.661348
16. Unger Z, Maitra A, Kohn J, Devaskar S, Stern L, Patel A. Knowledge of HPV and HPV vaccine among women ages 19 to 26. Women's Health Issues. (2015) 25:458–62. doi: 10.1016/j.whi.2015.06.003
17. Bynum SA Malo TL Lee J-H Guiliano AR and Vadaparampil ST. HPV vaccine information-seeking behaviors among US physicians: government, media, or colleagues?. Vaccine. (2011) 29:5090–3. doi: 10.1016/j.vaccine.2011.04.134
18. Dib F, Mayaud P, Longfier L, Chauvin P, Launay O. Effect of Internet use for searching information on vaccination on the uptake of human papillomavirus vaccine in France: a path-analysis approach. Prevent Med. (2021) 149:106615. doi: 10.1016/j.ypmed.2021.106615
19. Mavragani A, Ochoa G. Forecasting AIDS prevalence in the United States using online search traffic data. J Big Data. (2018) 5:1–21. doi: 10.1186/s40537-018-0126-7
20. Ling R, Lee J. Disease monitoring and health campaign evaluation using Google search activities for HIV and AIDS, stroke, colorectal cancer, and marijuana use in Canada: a retrospective observational study. JMIR Publ Health Surveill. (2016) 2:e6504. doi: 10.2196/publichealth.6504
21. Jena AB, Karaca-Mandic P, Weaver L, Seabury SA. Predicting new diagnoses of HIV infection using internet search engine data. Clin Infect Dis. (2013) 56:1352–3. doi: 10.1093/cid/cit022
22. Mahroum N, Bragazzi NL, Brigo F, Waknin R, Sharif K, Mahagna H, et al. Capturing public interest toward new tools for controlling human immunodeficiency virus (HIV) infection exploiting data from Google Trends. Health Inform J. (2019) 25:1383–97. doi: 10.1177/1460458218766573
23. Layug EJV, Espiritu AI, Calotes-Castillo LV, Jamora RDG. The association of online search interest with polio cases and vaccine coverage: an infodemiological and ecological study. Eur J Pediatr. (2021) 180:2435–41. doi: 10.1007/s00431-021-04049-4
24. Orr D, Baram-Tsabari A, Landsman K. Social media as a platform for health-related public debates and discussions: the Polio vaccine on Facebook. Israel J Health Policy Res. (2016) 5:1–11. doi: 10.1186/s13584-016-0093-4
25. Tur-Sinai A, Gur-Arie R, Davidovitch N, Kopel E, Glazer Y, Anis E, et al. Socioeconomic status, health inequalities, and solidarity trends in a mass vaccination campaign. Eur J Publ Health. (2019) 29(Suppl. 4):ckz185.404. doi: 10.1093/eurpub/ckz185.404
26. Sagy I, Novack V, Gdalevich M, Greenberg D. Mass media effect on vaccines uptake during silent polio outbreak. Vaccine. (2018) 36:1556–60. doi: 10.1016/j.vaccine.2018.02.035
27. Orr D and Baram-Tsabari A. Science and politics in the polio vaccination debate on Facebook: a mixed-methods approach to public engagement in a science-based dialogue. J Microbiol Biol Educ. (2018) 19:19.1.80. doi: 10.1128/jmbe.v19i1.1500
28. Elkin LE Pullon SR and Stubbe MH. 'Should I vaccinate my child?'Comparing the displayed stances of vaccine information retrieved from Google, Facebook and YouTube. Vaccine. (2020) 38:2771–8. doi: 10.1016/j.vaccine.2020.02.041
29. Montalti M, Rallo F, Guaraldi F, Bartoli L, Po G, Stillo M, et al. Would parents get their children vaccinated against SARS-CoV-2? Rate and predictors of vaccine hesitancy according to a survey over 5000 families from Bologna, Italy. Vaccines. (2021) 9:366. doi: 10.3390/vaccines9040366
30. Mayo-Yáñez M, González-Torres L, Calvo-Henríquez C, Chiesa-Estomba C. Estudio de la búsqueda de información sobre la pandemia SARS-CoV-2 en Galicia. Galicia Clin. (2021) 82:13–6. doi: 10.22546/60/2305
31. Henry BM, de Oliveira MHS, de Oliveira TB, Notarte KI, Lippi G. Symptomatology associated with the diffusion of the SARS-CoV-2 Lambda variant in Peru: an infodemiologic analysis. medRxiv Preprint: 21262245. (2021). doi: 10.1101/2021.08.24.21262245
32. Santangelo OE, Provenzano S, Gianfredi V. Infodemiology of flu: Google trends-based analysis of Italians' digital behavior and a focus on SARS-CoV-2, Italy. J Prev Med Hyg. (2021) 62:E586–91. doi: 10.15167/2421-4248/jpmh2021.62.3.1704
33. Malik MT, Gumel A, Thompson LH, Strome T, Mahmud SM. “Google flu trends” and emergency department triage data predicted the 2009 pandemic H1N1 waves in Manitoba. Can J Publ Health. (2011) 102:294–7. doi: 10.1007/BF03404053
34. Li S, Zhou X. Research of the correlation between the H1N1 morbidity data and Google Trends in Egypt. arXiv preprint arXiv:151105300 (2015). doi: 10.48550/arXiv.1511.05300
35. Cervellin G, Comelli I, Lippi G. Is Google Trends a reliable tool for digital epidemiology? Insights from different clinical settings. J Epidemiol Glob Health. (2017) 7:185–9. doi: 10.1016/j.jegh.2017.06.001
36. Hill S, Mao J, Ungar L, Hennessy S, Leonard CE, Holmes J. Natural supplements for H1N1 influenza: retrospective observational infodemiology study of information and search activity on the Internet. J Med Intern Res. (2011) 13:e1722. doi: 10.2196/jmir.1722
37. Zhou X, Li Q, Zhao H, Li S, Yu L, Tang F, et al. Assessing Google correlate queries for influenza H1N1 surveillance in Asian developing countries. arXiv preprint arXiv:151203132. (2015). doi: 10.48550/arXiv.1512.03132
38. Chanel O, Luchini S, Massoni S, Vergnaud J-C. Impact of information on intentions to vaccinate in a potential epidemic: swine-origin Influenza A (H1N1). Soc Sci Med. (2011) 72:142–8. doi: 10.1016/j.socscimed.2010.11.018
39. Nawa N, Kogaki S, Takahashi K, Ishida H, Baden H, Katsuragi S, et al. Analysis of public concerns about influenza vaccinations by mining a massive online question dataset in Japan. Vaccine. (2016) 34:3207–13. doi: 10.1016/j.vaccine.2016.01.008
40. Cook S, Conrad C, Fowlkes AL, Mohebbi MH. Assessing Google flu trends performance in the United States during the 2009 influenza virus A (H1N1) pandemic. PLoS ONE. (2011) 6:e23610. doi: 10.1371/journal.pone.0023610
41. Pullan S, Dey M. Vaccine hesitancy and anti-vaccination in the time of COVID-19: a Google Trends analysis. Vaccine. (2021) 39:1877–81. doi: 10.1016/j.vaccine.2021.03.019
42. Maugeri A, Barchitta M, Agodi A. Using Google trends to predict Covid-19 vaccinations and monitor search behaviours about vaccines: a retrospective analysis of Italian data. Vaccines. (2022) 10:119. doi: 10.3390/vaccines10010119
43. Khakimova A, Abdollahi L, Zolotarev O, Rahim F. Global interest in vaccines during the COVID-19 pandemic: evidence from Google Trends. Vaccine. (2022) 10:100152. doi: 10.1016/j.jvacx.2022.100152
44. Diaz P, Reddy P, Ramasahayam R, Kuchakulla M, Ramasamy R. COVID-19 vaccine hesitancy linked to increased internet search queries for side effects on fertility potential in the initial rollout phase following Emergency Use Authorization. Andrologia. (2021) 53:e14156. doi: 10.1111/and.14156
45. Sycinska-Dziarnowska M, Paradowska-Stankiewicz I, Wozniak K. The global interest in vaccines and its prediction and perspectives in the era of COVID-19. Real-time surveillance using Google Trends. Int J Environ Res Publ Health. (2021) 18:7841. doi: 10.3390/ijerph18157841
46. Griffith J, Marani H, Monkman H. COVID-19 vaccine hesitancy in Canada: content analysis of tweets using the theoretical domains framework. J Med Intern Res. (2021) 23:e26874. doi: 10.2196/26874
47. Islam MS, Kamal A-HM, Kabir A, Southern DL, Khan SH, Hasan SM, et al. COVID-19 vaccine rumors and conspiracy theories: the need for cognitive inoculation against misinformation to improve vaccine adherence. PLoS ONE. (2021) 16:e0251605. doi: 10.1371/journal.pone.0251605
48. An L, Russell DM, Mihalcea R, Bacon E, Huffman S, Resnicow K. Online search behavior related to COVID-19 vaccines: infodemiology study. JMIR Infodemiol. (2021) 1:e32127. doi: 10.2196/32127
49. Awijen H, Zaied YB, Nguyen DK. Covid-19 vaccination, fear and anxiety: evidence from Google search trends. Soc Sci Med. (2022) 297:114820. doi: 10.1016/j.socscimed.2022.114820
50. Badell-Grau RA, Cuff JP, Kelly BP, Waller-Evans H, Lloyd-Evans E. Investigating the prevalence of reactive online searching in the COVID-19 pandemic: infoveillance study. J Med Intern Res. (2020) 22:e19791. doi: 10.2196/19791
51. Du H, Yang J, King RB, Yang L, Chi P. COVID-19 increases online searches for emotional and health-related terms. Appl Psychol. (2020) 12:1039–3. doi: 10.1111/aphw.12237
52. Pascual-Ferrá P, Alperstein N, Barnett DJ. A multi-platform approach to monitoring negative dominance for COVID-19 vaccine-related information online. Disast Med Publ Health Preparedn. (2021) 1–9. doi: 10.1017/dmp.2021.136
53. Rovetta A. Google Trends as a predictive tool for COVID-19 vaccinations in Italy: retrospective infodemiological analysis. JMIRx Med. (2022) 3:e35356. doi: 10.2196/35356
54. Milinovich GJ, Avril SM, Clements AC, Brownstein JS, Tong S, Hu W. Using internet search queries for infectious disease surveillance: screening diseases for suitability. BMC Infect Dis. (2014) 14:690. doi: 10.1186/s12879-014-0690-1
55. Shah MP, Lopman BA, Tate JE, Harris J, Esparza-Aguilar M, Sanchez-Uribe E, et al. Use of internet search data to monitor rotavirus vaccine impact in the United States, United Kingdom, and Mexico. J Pediatr Infect Dis Soc. (2018) 7:56–63. doi: 10.1093/jpids/pix004
56. Rampally V, Mondal H, Mondal S. Global search trends on common vaccine-related information in English on the Internet. J Fam Med Primary Care. (2020) 9:698. doi: 10.4103/jfmpc.jfmpc_1001_19
57. Index B,. (2020). Available online at: https://index.baidu.com/v2/index.html#/ (accessed March 28, 2020).
58. Puri N, Coomes EA, Haghbayan H, Gunaratne K. Social media and vaccine hesitancy: new updates for the era of COVID-19 and globalized infectious diseases. Hum Vaccines Immunother. (2020) 16:2586–93. doi: 10.1080/21645515.2020.1780846
59. Mondal S, Mondal H, Samantaray R. Information-seeking behavior on Coronavirus Disease-19 Vaccine on the internet: a global and Indian search trend analysis. J Sci Soc. (2021) 48:93. doi: 10.4103/jss.jss_18_21
60. Fang J, Zhang X, Tong Y, Xia Y, Liu H, Wu K. Baidu index and COVID-19 epidemic forecast: evidence from China. Front Publ Health. (2021) 9:685141. doi: 10.3389/fpubh.2021.685141
61. Gong X, Hou M, Han Y, Liang H, Guo R. Application of the internet platform in monitoring Chinese public attention to the outbreak of COVID-19. Front Publ health. (2021) 9:755530. doi: 10.3389/fpubh.2021.755530
62. Mavragani A, Ochoa G. Google Trends in infodemiology and infoveillance: methodology framework. JMIR Publ Health Surveill. (2019) 5:e13439. doi: 10.2196/13439
63. Getis A, Ord K. The analysis of spatial association by use of distance statistics. Geograph Anal. (1992) 24:189–206. doi: 10.1111/j.1538-4632.1992.tb00261.x
Keywords: vaccine, public health, online attention, spatiotemporal characteristics, GeoDetector
Citation: Hu F, Qiu L, Xia W, Liu C-F, Xi X, Zhao S, Yu J, Wei S, Hu X, Su N, Hu T, Zhou H and Jin Z (2022) Spatiotemporal evolution of online attention to vaccines since 2011: An empirical study in China. Front. Public Health 10:949482. doi: 10.3389/fpubh.2022.949482
Received: 24 May 2022; Accepted: 28 June 2022;
Published: 26 July 2022.
Edited by:
Wenqing Wu, Tianjin University, ChinaReviewed by:
Junxiang Li, University of Shanghai for Science and Technology, ChinaCopyright © 2022 Hu, Qiu, Xia, Liu, Xi, Zhao, Yu, Wei, Hu, Su, Hu, Zhou and Jin. This is an open-access article distributed under the terms of the Creative Commons Attribution License (CC BY). The use, distribution or reproduction in other forums is permitted, provided the original author(s) and the copyright owner(s) are credited and that the original publication in this journal is cited, in accordance with accepted academic practice. No use, distribution or reproduction is permitted which does not comply with these terms.
*Correspondence: Haiyan Zhou, emhvdWhhaXlhbnNoQGhvdG1haWwuY29t; Zhuang Jin, anpAYnR0Yy5lZHUuY24=
†These authors have contributed equally to this work and share first authorship
Disclaimer: All claims expressed in this article are solely those of the authors and do not necessarily represent those of their affiliated organizations, or those of the publisher, the editors and the reviewers. Any product that may be evaluated in this article or claim that may be made by its manufacturer is not guaranteed or endorsed by the publisher.
Research integrity at Frontiers
Learn more about the work of our research integrity team to safeguard the quality of each article we publish.