- School of Public Health, Jilin University, Changchun, China
Objective: This cross-sectional research aims to develop reliable predictive short-term prediction models to predict the number of RTIs in Northeast China through comparative studies.
Methodology: Seasonal auto-regressive integrated moving average (SARIMA), Long Short-Term Memory (LSTM), and Facebook Prophet (Prophet) models were used for time series prediction of the number of RTIs inpatients. The three models were trained using data from 2015 to 2019, and their prediction accuracy was compared using data from 2020 as a test set. The parameters of the SARIMA model were determined using the autocorrelation function (ACF) and the partial autocorrelation function (PACF). The LSTM uses linear as the activation function, the mean square error (MSE) as the loss function and the Adam optimizer to construct the model, while the Prophet model is built on the Python platform. The root mean squared error (RMSE), mean absolute error (MAE) and Mean Absolute Percentage Error (MAPE) are used to measure the predictive performance of the model.
Findings: In this research, the LSTM model had the highest prediction accuracy, followed by the Prophet model, and the SARIMA model had the lowest prediction accuracy. The trend in medical expenditure of RTIs inpatients overlapped highly with the number of RTIs inpatients.
Conclusion: By adjusting the activation function and optimizer, the LSTM predicts the number of RTIs inpatients more accurately and robustly than other models. Compared with other models, LSTM models still show excellent prediction performance in the face of data with seasonal and drastic changes. The LSTM can provide a better basis for planning and management in healthcare administration.
Implication: The results of this research show that it is feasible to accurately forecast the demand for healthcare resources with seasonal distribution using a suitable forecasting model. The prediction of specific medical service volumes will be an important basis for medical management to allocate medical and health resources.
Introduction
Background
Deaths and injuries from road traffic accidents (RTAs) are a serious global public health problem. According to the World Health Organization, more than 1.35 million people died from road traffic injuries (RTIs) worldwide in 2018. Notably, RTAs fatalities in developing countries are more than three times higher than in developed countries (1). Reducing RTAs and fatalities in developing countries has become a major common concern in the field of road traffic safety and public health worldwide (2).
As the world's most populous developing country, China has experienced a rapid expansion of its road network and the number of private cars in the last decade (2). At the same time, the incidence of RTAs is increasing yearly (3, 4). In 2003, the National Road Traffic Safety Law was introduced and implemented by the Chinese government to effectively manage transport and kerb the rise in RTAs (5). The enactment of this law has improved the traffic situation in China to a large extent, but a large number of RTIs still occur each year. According to data released by the National Bureau of Statistics, there were 247,646 RTAs nationwide in 2019, with 62,763 fatalities and 256,101 injuries, resulting in direct property damage of RMB 134 million (6).
Motivation and objectives of the research
It is clear that China is facing a huge challenge posed by the RTAs. This challenge comes from two main sources. Firstly, there is the challenge of transport security, where the large number of RTAs is seriously undermining China's transport efficiency (7, 8). On the other hand, the drain on healthcare funding from RTIs is testing the ability of China's healthcare administration to allocate healthcare resources (9). Improving the statistical accuracy and predictive accuracy of the number of RTIs is an important task in addressing these issues (10). Therefore, policymakers urgently need a reliable predicting methodology that provides decision makers with early estimates of future RTIs and resulting healthcare expenditure based on historical time series data so that they can assess the potential risks (11).
Road safety policies and interventions should be based on an accurate assessment of the RTIs burden and projections of future trends, which are often influenced by the quality of the data, the correct estimation of parameters and the correct modeling approach (12). To this end, we propose using comparative research to develop an optimal prediction model for the number of RTIs in Northeast China to provide a basis for the allocation of health care resources by the health care sector.
Research methodology
In previous studies, various conventional methods have been applied to estimate and predict RTAs-induced mortality in China. Researchers have often used the seasonal autoregressive integrated moving average (SARIMA) to predict the time series of RTIs mortality in China (13–16). The advantage of this model is that it is simple to model and requires few data (16). It is therefore widely used in the predicting of various time series. Other researchers have used linear models, gray models, and other methods to predict deaths due to RTIs (4, 14). The results obtained from this type of research are not very accurate and can reflect limited information. In recent years, with the widespread use of machine learning techniques, more researchers have used machine learning models to research the prediction of road traffic injuries in China (17). The use of models such as extreme gradient boosting (XGBoost) (18), Elman recurrent neural network (ERNN) (12, 19), and long and short-term memory networks (LSTM) (16, 20–23) have all led to significant improvements in RTIs prediction. The introduction of machine learning techniques provides more options for predictive research in RTIs. The relatively complex modeling approach of machine learning models, however, makes it necessary to model different problems individually. Facebook Prophet (Prophet) (24, 25) is a model that has performed very brightly in many time series prediction studies in recent years and has achieved good results in the field of disease prediction. There is no research related to the application of this model to the prediction of RTIs.
Novelty of research
The limitations of each of these studies make them of limited value as a reference for healthcare administration. Firstly, previous studies have focused on the number of deaths and mortality rates. Healthcare administration has focused more on the number of RTIs inpatients and the cost of care. Secondly, the scope of previous studies was usually defined as the whole of China, whereas the specific trends and conditions of RTIs in different regions of China vary greatly and have little practical application to different regions. This research is more informative to policy makers from a health care resource perspective than traditional studies that focus only on deaths in RTIs.
In addition, there is a lack of studies related to regions in China that are relatively economically backwards and severely aging, especially in Northeast China. In order to fill this gap in these regions, this research takes the number of RTIs inpatients in Jilin province in Northeast China as the research object and uses three time series models, SARIMA, LSTM, and Prophet, for comparative analysis to obtain the model with the most accurate prediction effect of RTIs inpatients in Jilin province. Jilin province is the most representative region in Northeast China, and using this region as the research sample is well-representative. It provides a more reliable theoretical basis for later research.
Thesis structure
In this research, the data were first divided into training and test sets. SARIMA, Prophet, and LSTM prediction models were built using the training set data and the prediction results were obtained separately. This research compares the prediction results of the three prediction models by comparing the difference between the prediction results of the three prediction models and the test set data, and discusses the practical usefulness of the prediction models in actual healthcare resource allocation.
Methods
RTIs inpatients data collection
The data used in this research were obtained from inpatient data of general hospitals in Jilin Province aggregated by the Jilin Provincial Health and Wellness Commission. The data include the time of admission, the reason for admission and the healthcare expenditure of the inpatients. Patients were selected for the research by screening those whose reason for admission to the hospital was a RTAs. Data was obtained on the number of patients admitted to the hospital as a result of RTAs between 2015 and 2020 and their spending during their treatment. Data on a total of 24,885 patients admitted to hospital for RTIs were included in this research (Supplementary Material).
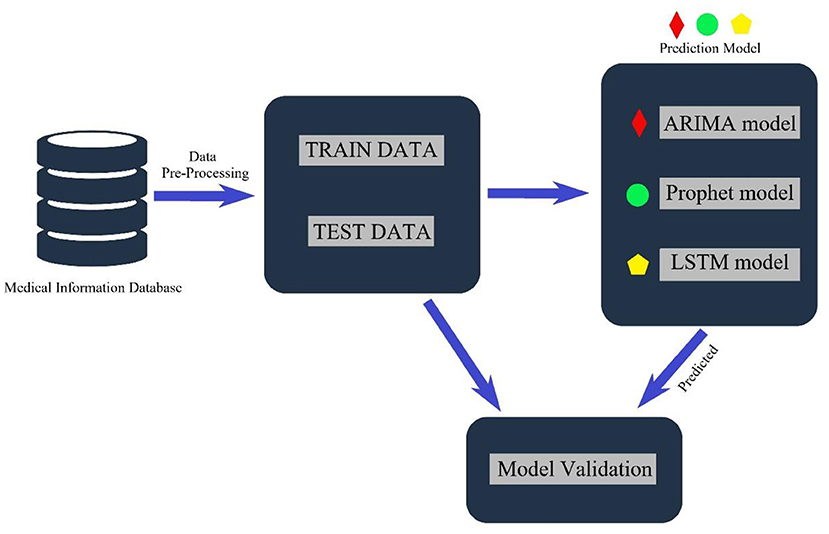
This research uses three leading models—seasonal autoregressive integrated moving average (SARIMA), Long Short-Term Memory (LSTM) and Facebook Prophet (Prophet) models—to analyze the number of RTIs inpatients. Data from 2015 to 2019 were used as the training set to train the model, and data from 2020 were used as the test set to test the model's predictive effectiveness. Figure 1 shows the typical architecture of the proposed model to predict the future count of RTIs inpatients.
SARIMA model
ARIMA model is an Autoregressive (AR) model, moving average (MA) model and ARMA model are commonly used models in the processing of time series, and these three models are suitable for the analysis of stationary time series, but it is difficult to analyze the time series studied when there is an upwards or downwards trend. The ARIMA model, also known as Box-Jenkins model (26), is an extension of AR, MA, and ARMA models. The formula of the ARIMA model is as follows:
B denotes the backwards operator, and εt denotes the error term at time t. The model contains three parameters namely p, d, and q, p means autoregressive, d means degree of non-seasonal difference and q means order of moving average. When time series show no strong seasonal trend, the ARIMA model can predict accurately, but when time series have strong seasonal effect, the seasonal ARIMA model (SARIMA) is required (16). The formula of the SARIMA model is as follows:
Where, xt denote the time series, ∇ denote the difference operation, B denote the backwards shift operator, s is the period length, and εt is the white noise sequence. The three parameters p, d, and q have the same meaning as the parameters in the ARIMA model, parameters P, D, Q, and s represent seasonal autoregressive, seasonal degree of difference, seasonal order of moving average and seasonal period length, respectively. We first observe the stationarity and seasonal periodicity of the time series, and then eliminate and stabilize the seasonal period of the time series by differential processing. After that, autocorrelation function (ACF) and partial autocorrelation function (PACF) pictures of the difference sequence are drawn to determine the parameters p and q of the model. We chose the model with the smallest Akaike Information Criterion (AIC) as the final model, then evaluated the fitting effect of the model by detecting the white noise of the residues.
Facebook Prophet model
The Prophet model is an additive model for time series predicting that was open sourced by Facebook Inc. in 2017 (27). According to Google's official presentation, it works best with time series that have strong seasonal effects and several seasons of historical data (24). Prophet is robust to missing data and shifts in the trend and typically handles outliers well (28). The model quickly became a hot time series model upon its release. The model splits the time series into three main components: the seasonal term St, the trend term Tt and the residual term Rt:
Additionally, the Prophet model incorporates the effect of holiday h(t) to meet the needs of the actual scenario:
The model is robust to missing data and outliers and fits a wide range of data relatively well, making it a popular time series predicting model among data analysts.
LSTM model
The LSTM model is a neural network model based on an improved RNN neural network. RNN are widely used for time series prediction, but they are hardly competent for long-term data-dependent problems (22). Hochreiter and Schmidhuber proposed the LSTM model in 1997 to improve the RNN model with memory units to overcome its limitations in long-term data dependence (29). The memory unit is self-linking, stores the network time state and is controlled by three gates: input gate, output gate and forget gate. Input gates and output gates work to control the flow of inputs and outputs from the memory unit to the rest of the network. In addition, forgetting gates are added to the memory unit, which passes output information with high weights from the previous neurone to the next neurone. LSTM neurons have memories within their pipeline that can store previous information, update the information, and pass it to the next layer or cell without losing information (Figure 2).
1. Forgetting gate: The function of the forgetting gate is to determine the information that needs to be retained or discarded in the middle and previous layers. The forgetting gate function can be expressed as follows:
2. Input gate: The input gate is followed by the forgetting gate, which updates the data and collates it into the storage unit by means of an activation function. The specific formula is as follows:
3. Output gate: The output gate determines the output of the model with the weight of the control state Ct to the current LSTM implicit layer. The initial output is obtained by the activation function and then the output values are normalized by the tanh function. The expression is as follows:
4. Memory Cell: The memory cell uses the candidate values generated by the activation function and then updates the memory state in combination with the input information from the input gate and the current state information. The calculation formula is as follows:
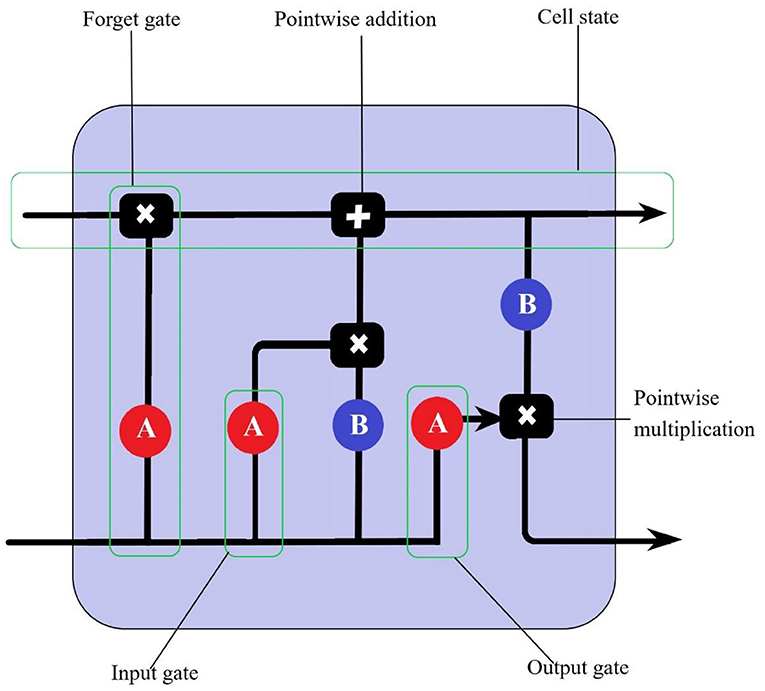
Figure 2. The LSTM cell consists of an input gate, an output gate and an oblivion gate. A and B are activation functions.
In the above formulas, σ presents activation function. Wf, Wi, Wc, Wo denote the weight values of the forgetting gate, the input gate output gate and the memory unit. bf, bi, bc, bo denote the deviation of each component. They are all generated by random initialization function.
A loss function is a way for a computer machine to learn the difference between the predicted and true values of a model. As machine learning models are prone to over-fitting during training, and over-fitting of the model to the input set data leads to a reduction in the generalization ability of the model. Looking at the input set and output set loss functions is the main means of determining whether a model is over-fitted (30). The input set loss function is generally considered to be larger than the output set loss function. In this research, Mean Squared Error (MSE) is used as the loss function (31) with the following equation.
Xi is the actual value, is the fitting values or predicted value, i = 1…n and n is the number of observation.
Model evaluation
Two indexes measure the prediction performance of the models: Root Mean Squared Error (RMSE), Mean Absolute Percentage Error (MAPE) and Mean Absolute Error (MAE). RMSE tends to be dominated by larger values, the MAE and MAPE give a good indication of the error between the predicted and true values (32–34).
Xi is the actual value, is the predicted value, i = 1…n and n is the number of observation.
Data and analysis
Data from January 2015 to December 2019 were used as the training set for the construction of the SARIMA model and the Prophet model. Data from January 2015 to December 2018 were used as the input set January to December 2019 as the output and to train the LSTM model. MSE was used to define the loss function. The loss function of the model in the input set output set is plotted to determine if the model is over-fitted. Finally, RTIs predictions for 2020 were made using the three completed training models and compared with the true value of the number of RTIs inpatients in 2020. The accuracy of the model predictions was judged by comparing the RMSE and MAE of the three models.
Excel 2016 was used to build the monthly database of RTIs inpatients in Jilin Province, and Python 3.8.8 software was used to build the SARIMA model, LSTM model and Prophet model.
Results
Statistical results
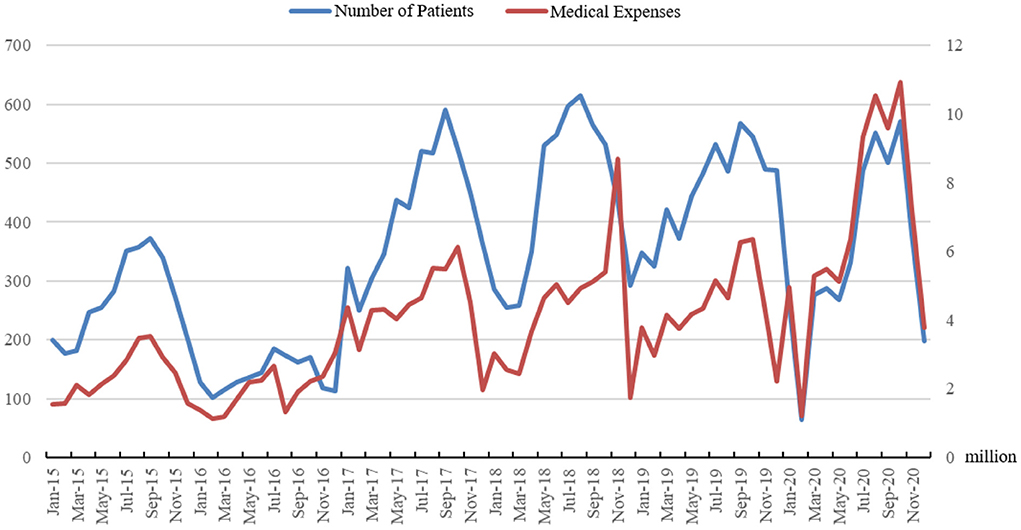
As shown in Figure 3, the number of RTIs inpatients is represented by the blue line, and the red line represents the total monthly healthcare expenditure caused by RTIs inpatients. It is clear from Figure 3 that the trend in total healthcare expenditure is highly consistent with the number of inpatients. The statistics show a gradual decrease in average healthcare expenditure for RTIs inpatients between 2016 and 2019, but an increase in healthcare expenditure in 2020 due to COVID-19. The statistics show that the average healthcare expenditure of RTIs inpatients saw a large increase between 2015 and 2016. The average healthcare expenditure for RTIs inpatients gradually decreases between 2016 and 2019, before once again showing a significant rise in 2020. The medical expenditure of patients hospitalized with RTIs is reported in Table 1. The medical expenditures of patients hospitalized with RTIs vary considerably due to the degree of injury. In contrast, the mean and median medical expenditure for inpatients with RTIs did not vary significantly each year.
SARIMA model
A dataset of RTIs inpatients in Jilin Province in Python, using 2015 to 2019 data as the training set and 2020 data as the test set, the SARIMA model was tested for predictive effectiveness.
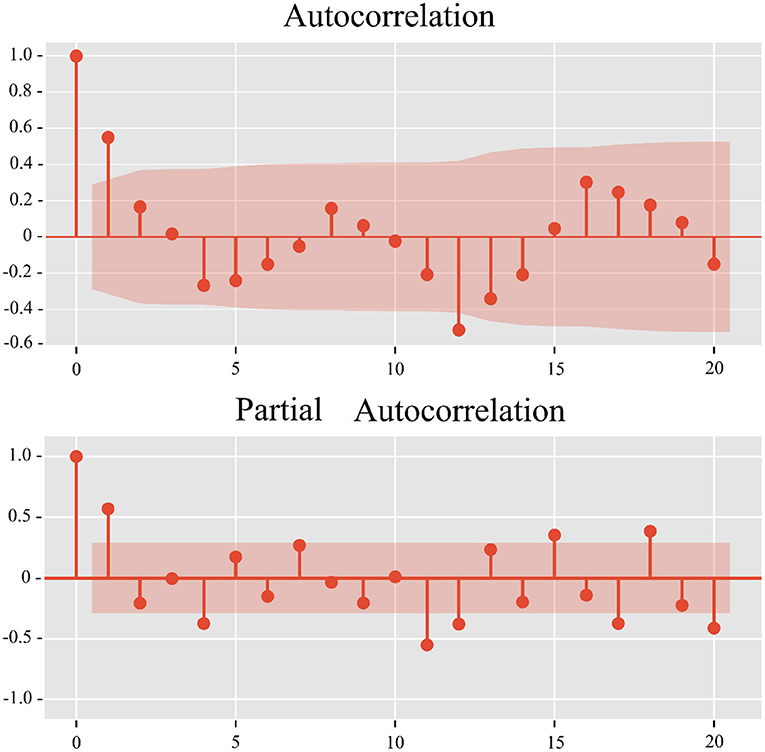
The Dickey-Fuller test was used to demonstrate that the data were non-stationary (p = 0.136). After first-order differencing and seasonal differencing, the SARIMA model determines the three parameters of p, d, and q from ACF and PACF images (Figure 4). The parameters of the final model are then determined by means of a minimum AIC (AIC = 101.79). The final model for the final number of road accident admissions was determined to be SARIMA (1,1,0), (2,1,3)12.
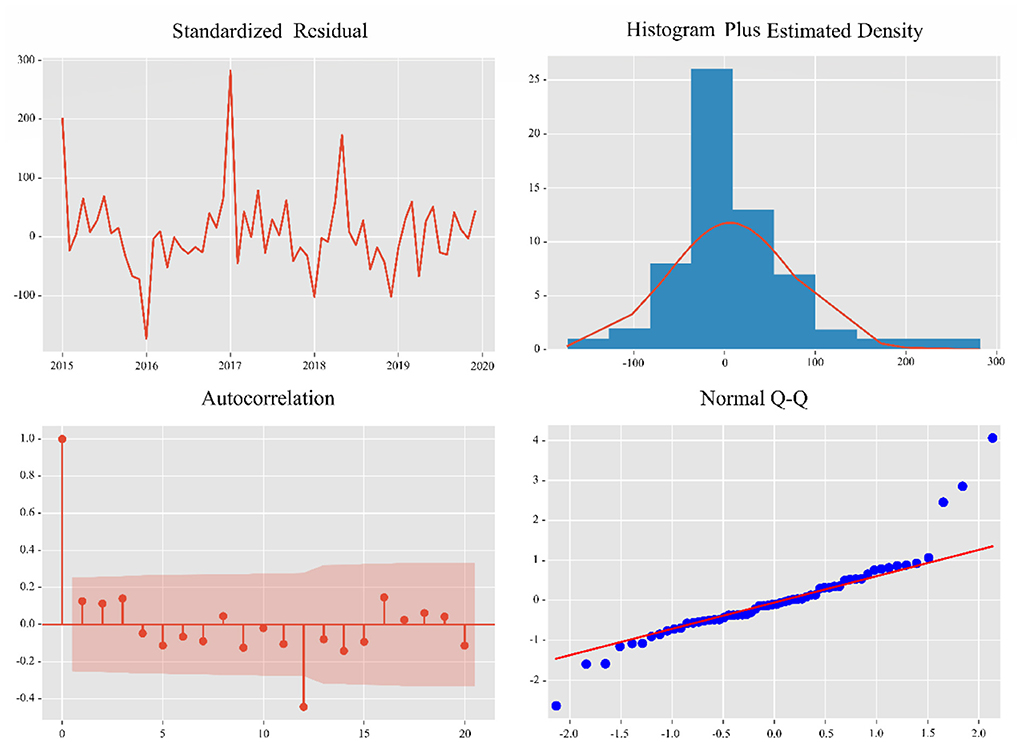
The Ljung-Box test was used to test whether the residuals of the model conformed to a normal distribution, with a p-value of 0.32. Therefore, the original hypothesis cannot be rejected (H0: residuals are normally distributed). The residuals were analyzed by plotting ACF plots of the residuals, Q-Q plots of the residuals and histograms of the residuals (Figure 5). The residuals of the model SARIMA (1,1,0), (2,1,3)12 models are normally distributed, which indicates that all the information in the data is extracted by the SARIMA model.
Prophet model
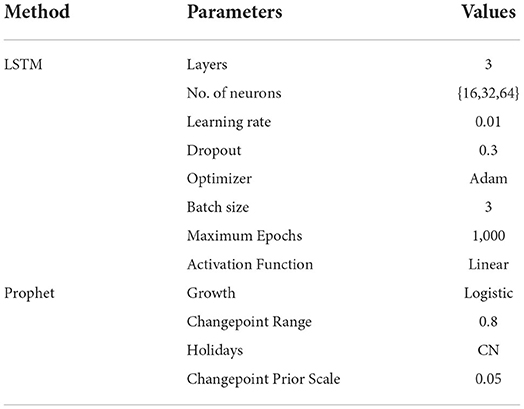
This research uses the training data to build the Prophet model in Python 3.7. We implemented the trend model with a saturating growth, and the carrying capacity of the logistic growth model was set as 8.5. The change-points were automatically selected and the number of change-points was set as 25. We set the interval width as 0.8. The parameters of the Prophet model are shown in Table 2.
LSTM model
The LSTM neural network was modeled using Python 3.7. To improve the training efficiency of the model, we first normalized the data before feeding it into the LSTM model. The main parameters in the LSTM model are the activation function, dropout, batch size, epoch, neurones in the hidden layer and the optimizer. The maximum number of iterations of the model is 1,000, and the model stops training when the loss function is <0.075. The parameters of the LSTM model are shown in Table 2.
Figure 6 shows the performance of the loss functions for the training and test sets, with the red line being the training set loss function and the blue line being the test set loss function. The loss values of the training and test sets decreased at the same time. In most cases, the loss value of the training set was smaller than that of the training set. The results show that the LSTM model is well-trained and does not show any over-fitting.
Comparison of models
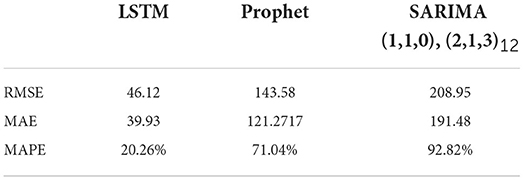
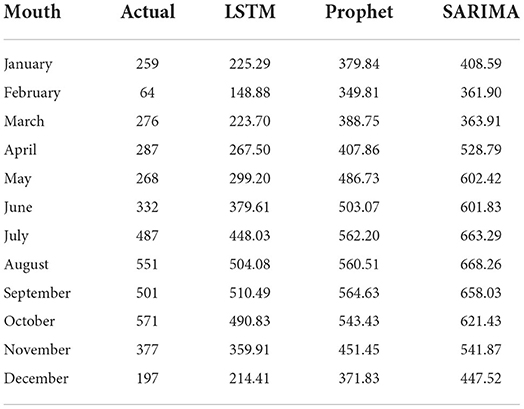
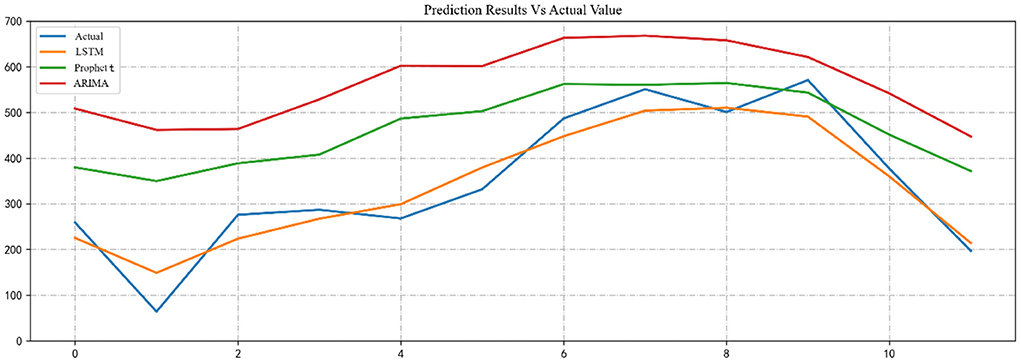
We used the trained SARIMA, Prophet, and LSTM models to predict the number of RTIs inpatients in 2020 and compared them to the test dataset. The predictive performance of the model was evaluated by calculating the RMSE, MAE and MAPE between the three predicted and actual values. Table 3 reports the evaluation results for the SARIMA, Prophet, and LSTM models. Table 4 shows the actual values vs. the predicted values from the three models. Figure 7 visualizes the predicted and actual values of the SARIMA, Prophet, and LSTM models.
From these results, it can be seen that the LSTM model performs the best, the Prophet model the second best and the SARIMA model the worst.
Discussion
Monthly trends in the number of RTIs inpatients in Jilin Province from 2015 to 2020 show a clear seasonal pattern. The number of RTIs reported from other regions in China also showed a clear seasonal pattern, but the high incidence season was different (35–38). The reasons for this difference may be the result of a combination of factors such as the length of daylight, alcohol consumption, recreational driving, and possible inclement weather (39).
Statistical analysis of health expenditure data shows that the average expenditure of RTIs inpatients changed significantly between 2015 and 2016, with the cost of treatment decreasing each year for the next 3 years. The main reason for this change is the abolition of the drug mark-up reform system that came into effect in 2016 (40, 41). The results from 2016 show that this system has succeeded in curbing the rapid increase in treatment costs. The increase in costs in 2020 is mainly due to the overall increase in healthcare expenditure as a result of the COVID-19 epidemic (42). In addition, the trend in total healthcare expenditure is highly consistent with the trend in the number of RTIs inpatients. This suggests that accurate predicting of RTIs inpatient can be a useful tool for healthcare resource planning. At the same time, the prediction of the number of patients is more in line with the needs of DRG reform in China.
This research observed a very significant decrease in the number of RTIs inpatients in Jilin Province in the first 3 months of 2020 compared to previous years. This is due to the severe travel control measures implemented in Jilin Province during this period. In the second half of 2020, as travel controls were lifted, the number of RTIs admissions gradually returned to the average for the same period in previous years. This phenomenon has been replicated in other parts of China, and management policies can have a very significant impact on RTIs incidence (43–45). The government can achieve the goal of reducing the number of RTIs occurrences by imposing reasonable regulatory measures (46, 47).
Theoretical of predictive model
In principle, the SARIMA model has shown its effectiveness and advantages in capturing linear trends in seasonal series compared to auto-regressive integrated moving average and exponential smoothing models, and can be easily developed by many data analysis software. SARIMA is one of the most effective linear models for forecasting seasonal time series (13). However, the drawbacks of SARIMA models are also apparent. When generating a smooth time series, it is usually necessary to pre-process a large amount of longitudinal data and use appropriate transformation techniques, such as differencing and transformation, to stabilize the variables before modeling (48). Although the SARIMA model can capture linear trends in seasonal time series, it may not accurately predict RTIs because of the non-linearity of the data and the various influences associated with traffic fatalities. In contrast, the LSTM model is one of the RNN models that can approximate the ideal accuracy for complex non-linear functions of real-world data.
In this research, the advantage of the LSTM in the comparison of the three models is very clear, and the reason for this phenomenon may have a lot to do with the characteristics of the data (49–51). In previous studies using additive models such as SARIMA models and Prophet, one is often dealing with more stable data. SARIMA and Prophet models have a strong advantage in dealing with time series data with significant seasonality. However, some researchers have pointed out that these models are less resistant to disturbances (16, 52), and in this research, there was a very large drop in the data for the first 3 months of 2020, which led to a relatively large deviation of these two models. LSTM models can be adapted to more application scenarios by calling different activation functions, which also makes them more resistant to disturbances than traditional additive models, and when external factors (16). This also makes the LSTM model more resistant to disturbances than the traditional additive model, so that when external factors change significantly, the LSTM model can still make reliable predicts (21). In this research, the difference between the prediction accuracy of the LSTM model and the traditional model becomes more significant due to the large change in the number of RTIs inpatients in 2020. It is worth mentioning that the predicted values given by the three models for the second half of 2020 are closer to the true values. This provides some evidence that the SARIMA and Prophet models are able to obtain satisfactory prediction results in a stable seasonal time series.
Advantages and limitations
Admittedly, there are some limitations to this research. Firstly, the data for this research was sourced from the healthcare finance system of the Jilin Provincial Health and Wellness Commission. The data from this system is derived from hospital reporting and there may be selection or omission bias, which may affect the accuracy of the predictions. Secondly, our research focuses on the north-eastern Chinese city of Jilin, and the results obtained in this research are of considerable referable value in areas with similar natural, social and environmental factors. However, the reference value is limited for regions where natural, social and environmental factors differ significantly. Finally, although the LSTM model has obvious advantages in terms of prediction accuracy, the training time and modeling complexity of this model are much greater than those of the other two models.
Policy recommendations
Based on this, we propose the following policy recommendations: (1) Introducing effective traffic control policies or optimizing the urban traffic layout by the relevant authorities can achieve efficient traffic flow. (2) Improving the infrastructure of urban traffic and improving the possibility of roads can effectively reduce RTAs. (3) Establishing green channels can improve the speed of handling RTIs inpatients. The timely treatment of people injured in an accident not only improves the effectiveness of treatment but also reduces the corresponding healthcare expenditure. (4) Analyzing the high incidence of RTAs in cities through the use of big data tools and carrying out targeted transformation and diversion of these areas can reduce the number of RTAs. This research demonstrated that the LSTM model can accurately predict the number of RTIs inpatients in Jilin Province. This suggests that we can use this model to effectively predict the demand for services in different subgroups of the DRG in Jilin Province in the future so that during the process of DRG reform, a more scientific and effective budget allocation can be made.
Conclusion
By adjusting the activation function and optimizer, LSTM predicts the number of inpatient RTIs more accurately and more robustly than other models. Compared with other models, LSTM models still show excellent prediction performance in the face of data with seasonal and drastic changes. Proper use of LSTM model can provide a better basis for planning and management by healthcare administrations. As China is the largest developing country in the world, the present research results are of strong value to developing countries in similar situations.
Data availability statement
The original contributions presented in the study are included in the article/supplementary material, further inquiries can be directed to the corresponding author.
Author contributions
TF and ZZ design research and draft article. Data collection and analysis were done by JX and MLiu. MLi and HJ revised the article and put forward suggestions. All authors commented on previous versions of the manuscript and read and approved the final manuscript.
Conflict of interest
The authors declare that the research was conducted in the absence of any commercial or financial relationships that could be construed as a potential conflict of interest.
Publisher's note
All claims expressed in this article are solely those of the authors and do not necessarily represent those of their affiliated organizations, or those of the publisher, the editors and the reviewers. Any product that may be evaluated in this article, or claim that may be made by its manufacturer, is not guaranteed or endorsed by the publisher.
Supplementary material
The Supplementary Material for this article can be found online at: https://www.frontiersin.org/articles/10.3389/fpubh.2022.946563/full#supplementary-material
References
1. World Health Organization. Global Status Report on Road Safety 2018: Summary (No. WHO/NMH/NVI/18.20). Geneva: World Health Organization (2018).
2. World Health Organization. Dept. of Violence, Injury Prevention, World Health Organization. Violence, Injury Prevention, and World Health Organization. Global Status Report on Road Safety: Time for Action. World Health Organization (2009).
3. Zhou J, Li Y, Wang QK, Pollak AN, Slobogean GP. Status of road safety and injury burden: China. J Orthop Trauma. (2014) 28:S41–2. doi: 10.1097/BOT.0000000000000111
4. Wang L, Yu C, Zhang Y, Luo L, Zhang G. An analysis of the characteristics of road traffic injuries and a prediction of fatalities in China from 1996 to 2015. Traffic Inj Prev. (2018) 19:749–54. doi: 10.1080/15389588.2018.1487061
5. Chi GB, Wang SY. Pattern of road traffic injuries in China. Zhonghua liu xing bing xue za zhi= Zhonghua liuxingbingxue zazhi. (2004) 25:598–601.
6. Liu G, Chen S, Zeng Z, Cui H, Fang Y, Gu D, et al. Risk factors for extremely serious road accidents: results from national Road Accident Statistical Annual Report of China. PLoS ONE. (2018) 13:e0201587. doi: 10.1371/journal.pone.0201587
7. Wang Z. The imbalance in regional economic development in China and its reasons. In: Private Sector Development and Urbanization in China. New York, NY: Palgrave Macmillan (2015). p. 53–75. doi: 10.1007/978-1-137-47327-1_4
8. Abubakar II, Tillmann T, Banerjee A. Global, regional, and national age-sex specific all-cause and cause-specific mortality for 240 causes of death, 1990-2013: a systematic analysis for the Global Burden of Disease Research 2013. Lancet. (2015) 385:117–71. doi: 10.1016/S0140-6736(14)61682-2
9. Afukaar FK. Speed control in developing countries: issues, challenges and opportunities in reducing road traffic injuries. Inj Control Saf Promot. (2003) 10:77–81. doi: 10.1076/icsp.10.1.77.14113
10. Heterskedasticity SAC. Safe mobility: challenges, methodology and solutions. Age. (2018) 388:389f. doi: 10.1108/s2044-994120180000011016
11. Wang X, Fan G. Analysis on the regional disparity in China and the influential factors. Econ Res J. (2004) 1:33–44.
12. Qian Y, Zhang X, Fei G, Sun Q, Li X, Stallones L, et al. Forecasting deaths of road traffic injuries in China using an artificial neural network. Traffic Inj Prev. (2020) 21:407–12. doi: 10.1080/15389588.2020.1770238
13. Zhang X, Pang Y, Cui M, Stallones L, Xiang H. Forecasting mortality of road traffic injuries in China using seasonal autoregressive integrated moving average model. Ann Epidemiol. (2015) 25:101–6. doi: 10.1016/j.annepidem.2014.10.015
14. Tan A, Tian D, Huang Y, Gao L, Deng X, Li L, et al. Forecast the trend of burden from fatal road traffic injuries between 2015 and 2030 in China. Zhonghua liu Xing Bing xue za zhi= Zhonghua Liuxingbingxue Zazhi. (2014) 35:547–51.
15. Pang YY, Zhang XJ, Tu ZB, Cui MJ, Gu Y. Autoregressive integrated moving average model in predicting road traffic injury in China. Zhonghua liu xing bing xue za zhi= Zhonghua liuxingbingxue zazhi. (2013) 34:736–9.
16. Siami-Namini S, Tavakoli N, Namin AS. A comparison of ARIMA and LSTM in forecasting time series. In: 2018 17th IEEE international conference on machine learning and applications (ICMLA). Piscataway, NJ: IEEE. (2018). p. 1394–401. doi: 10.1109/ICMLA.2018.00227
17. FaizanTahir M. Optimal load shedding using an ensemble of artificial neural networks. Int J Electr Comput Eng Syst. (2016) 7:39–46.
18. Luo J, Zhang Z, Fu Y, Rao F. Time series prediction of COVID-19 transmission in America using LSTM and XGBoost algorithms. Results Phys. (2021) 27:104462. doi: 10.1016/j.rinp.2021.104462
19. Mehmood K, Hassan HTU, Raza A, Altalbe A, Farooq H. Optimal power generation in energy-deficient scenarios using bagging ensembles. IEEE Access. (2019) 7:155917–29. doi: 10.1109/ACCESS.2019.2946640
20. Fan C, Matković K, Hauser H. Sketch-based fast and accurate querying of time series using parameter-sharing LSTM networks. IEEE Trans Vis Comput Graph. (2020) 27:4495–506. doi: 10.1109/TVCG.2020.3002950
21. Qiao M, Yan S, Tang X, Xu C. Deep convolutional and LSTM recurrent neural networks for rolling bearing fault diagnosis under strong noises and variable loads. Ieee Access. (2020) 8:66257–69. doi: 10.1109/ACCESS.2020.2985617
22. Yu R, Gao J, Yu M, Lu W, Xu T, Zhao M, et al. LSTM-EFG for wind power forecasting based on sequential correlation features. Fut Generation Comput Syst. (2019) 93:33–42. doi: 10.1016/j.future.2018.09.054
23. Tahir MF, Haoyong C, Mehmood K, Larik NA, Khan A, Javed MS. Short term load forecasting using bootstrap aggregating based ensemble artificial neural network. Recent Adv Electr Electronic Eng. (2020) 13:980–92. doi: 10.2174/2213111607666191111095329
24. Xie C, Wen H, Yang W, Cai J, Zhang P, Wu R, et al. Trend analysis and forecast of daily reported incidence of hand, foot and mouth disease in Hubei, China by Prophet model. Sci Rep. (2021) 11:1–8. doi: 10.1038/s41598-021-81100-2
25. Dash S, Chakraborty C, Giri SK, Pani SK. Intelligent computing on time-series data analysis and prediction of COVID-19 pandemics. Pattern Recognit Lett. (2021) 151:69–75. doi: 10.1016/j.patrec.2021.07.027
26. Brockwell PJ, Brockwell PJ, Davis RA. Introduction to Time Series and Forecasting. Berlin: Springer (2016). doi: 10.1007/978-3-319-29854-2
27. Taylor SJ, Letham B. Forecasting at scale. Am Statistician. (2018) 72:37–45. doi: 10.1080/00031305.2017.1380080
28. Rostami-Tabar B, Rendon-Sanchez JF. Forecasting COVID-19 daily cases using phone call data. Appl Soft Comput. (2021) 100:106932. doi: 10.1016/j.asoc.2020.106932
29. Hochreiter S, Schmidhuber J. Long short-term memory. Neural Comput. (1997) 9:1735–80. doi: 10.1162/neco.1997.9.8.1735
30. Cai L, Lei M, Zhang S, Yu Y, Zhou T, Qin J. A noise-immune LSTM network for short-term traffic flow forecasting. Chaos. (2020) 30:23135. doi: 10.1063/1.5120502
31. Lu C, Tang J, Lin M, Lin L, Yan S, Lin Z. Correntropy induced l2 graph for robust subspace clustering. In: Proceedings of the IEEE International Conference on Computer Vision (2013). p. 1801–8. doi: 10.1109/ICCV.2013.226
32. Guo Y, Feng Y, Qu F, Zhang L, Yan B, Lv J. Prediction of hepatitis E using machine learning models. PLoS ONE. (2020) 15:e237750. doi: 10.1371/journal.pone.0237750
33. Xu P, Aamir M, Shabri A, Ishaq M, Aslam A, Li L. A new approach for reconstruction of imfs of decomposition and ensemble model for forecasting crude oil prices. Math Probl Eng. (2020) 2020:1325071. doi: 10.1155/2020/1325071
34. Gao W, Aamir M, Shabri AB, Dewan R, Aslam A. Forecasting crude oil price using Kalman filter based on the reconstruction of modes of decomposition ensemble model. IEEE Access. (2019) 7:149908–25. doi: 10.1109/ACCESS.2019.2946992
35. Delavary FM, Mohammadzadeh MA, Fakoor V. Impact of law enforcement and increased traffic fines policy on road traffic fatality, injuries and offenses in Iran: Interrupted time series analysis. PLoS ONE. (2020) 15:e231182. doi: 10.1371/journal.pone.0231182
36. Pawłowski W, Goniewicz K, Schwebel DC, Shen J, Goniewicz M. Road traffic injuries in Poland: magnitude and risk factors. Eur J Trauma Emerg Surg. (2019) 45:815–20. doi: 10.1007/s00068-019-01093-6
37. Algahtany MA. Secular trend, seasonal variation, epidemiological pattern, and outcome of traumatic head injuries due to road traffic accidents in Aseer, Saudi Arabia. Int J Environ Res Public Health. (2021) 18:126623. doi: 10.3390/ijerph18126623
38. Ramírez AF, Valencia C. Spatiotemporal correlation research of traffic accidents with fatalities and injuries in Bogota (Colombia). Accid Anal Prev. (2021) 149:105848. doi: 10.1016/j.aap.2020.105848
39. Sivak M. During which month is it riskiest to drive in the United States? Traffic Inj Prev. (2009) 10:348–49. doi: 10.1080/15389580902975820
40. Cheng H, Zhang Y, Sun J, Liu Y. Impact of zero-mark-up medicines policy on hospital revenue structure: a panel data analysis of 136 public tertiary hospitals in China, 2012-2020. BMJ Glob Health. (2021) 6:7089. doi: 10.1136/bmjgh-2021-007089
41. Wang J, Li P, Wen J. Impacts of the zero mark-up drug policy on hospitalization expenses of COPD inpatients in Sichuan province, western China: an interrupted time series analysis. BMC Health Serv Res. (2020) 20:519. doi: 10.1186/s12913-020-05378-0
42. Chi J, Chen F, Zhang J, Niu X, Tao H, Ruan H, et al. Impacts of frailty on health care costs among community-dwelling older adults: a meta-analysis of cohort studies. Arch Gerontol Geriatr. (2021) 94:104344. doi: 10.1016/j.archger.2021.104344
43. Qureshi AI, Huang W, Khan S, Lobanova I, Siddiq F, Gomez CR, et al. Mandated societal lockdown and road traffic accidents. Accid Anal Prev. (2020) 146:105747. doi: 10.1016/j.aap.2020.105747
44. Shafiq S, Dahal S, Siddiquee N, Dhimal M, Jha AK. Existing laws to combat road traffic injury in Nepal and Bangladesh: a review on cross country perspective. J Nepal Health Res Counc. (2020) 17:416–23. doi: 10.33314/jnhrc.v17i4.2363
45. Yasin YJ, Grivna M, Abu-Zidan FM. Global impact of COVID-19 pandemic on road traffic collisions. World J Emerg Surg. (2021) 16:51. doi: 10.1186/s13017-021-00395-8
46. Hoffeld K, Pflüger P, Pförringer D, Hofmeister M, Studby F. Decline in work and commuting injuries during the first lockdown in the SARS-CoV-2 pandemic: comparison to the time period 2015-2019. Unfallchirurg. (2021) 2021:1–6. doi: 10.1007/s00113-021-01023-5
47. Valent F. Road traffic accidents in Italy during COVID-19. Traffic Inj Prev. (2022) 23:193–7. doi: 10.1080/15389588.2022.2047956
48. FaizanTahir M. Optimal load shedding using an ensemble of artificial neural networks. Int J Electr Comput Eng Syst. (2016) 7:39–46.
49. Parvareh M, Karimi A, Rezaei S, Woldemichel A, Nili S, Nouri B, et al. Assessment and prediction of road accident injuries trend using time-series models in Kurdistan. Burns Trauma. (2018) 6:9. doi: 10.1186/s41038-018-0111-6
50. Razzaghi A, Bahrampour A, Baneshi MR, Zolala F. Assessment of trend and seasonality in road accident data: an Iranian case research. Int J Health Policy Manag. (2013) 1:51–5. doi: 10.15171/ijhpm.2013.08
51. Nunes H, Murta-Nascimento C, Lima M. Impact of the Dry Law on road traffic mortality in Brazilian states: an interrupted time series analysis. Rev Bras Epidemiol. (2021) 24:e210045. doi: 10.1590/1980-549720210045
Keywords: road traffic injuries, time series analysis, machine learning, predictive models, comparative study
Citation: Feng T, Zheng Z, Xu J, Liu M, Li M, Jia H and Yu X (2022) The comparative analysis of SARIMA, Facebook Prophet, and LSTM for road traffic injury prediction in Northeast China. Front. Public Health 10:946563. doi: 10.3389/fpubh.2022.946563
Received: 17 May 2022; Accepted: 01 July 2022;
Published: 22 July 2022.
Edited by:
Muhammad Faizan Tahir, South China University of Technology, ChinaReviewed by:
Kashif Mehmood, University of Lahore, PakistanMuhammad Aamir, Abdul Wali Khan University Mardan, Pakistan
Rizwan Raheem Ahmed, Indus University, Pakistan
Copyright © 2022 Feng, Zheng, Xu, Liu, Li, Jia and Yu. This is an open-access article distributed under the terms of the Creative Commons Attribution License (CC BY). The use, distribution or reproduction in other forums is permitted, provided the original author(s) and the copyright owner(s) are credited and that the original publication in this journal is cited, in accordance with accepted academic practice. No use, distribution or reproduction is permitted which does not comply with these terms.
*Correspondence: Xihe Yu, eGh5dUBqbHUuZWR1LmNu
†These authors have contributed equally to this work
 Tianyu Feng
 Zhou Zheng†
 Xihe Yu