 Tania Ramírez-del Real1,2
 Mireya Martínez-García3
 Manlio F. Márquez3
 Laura López-Trejo4
 Guadalupe Gutiérrez-Esparza1,3*
 Enrique Hernández-Lemus5,6*
- 1Cátedras Conacyt, National Council on Science and Technology, Mexico City, Mexico
- 2Center for Research in Geospatial Information Sciences, Mexico City, Mexico
- 3Clinical Research Division, National Institute of Cardiology “Ignacio Chávez”, Mexico City, Mexico
- 4Institute for Security and Social Services of State Workers, Mexico City, Mexico
- 5Computational Genomics Division, National Institute of Genomic Medicine, Mexico City, Mexico
- 6Center for Complexity Sciences, Universidad Nacional Autónoma de México, Mexico City, Mexico
The fast, exponential increase of COVID-19 infections and their catastrophic effects on patients' health have required the development of tools that support health systems in the quick and efficient diagnosis and prognosis of this disease. In this context, the present study aims to identify the potential factors associated with COVID-19 infections, applying machine learning techniques, particularly random forest, chi-squared, xgboost, and rpart for feature selection; ROSE and SMOTE were used as resampling methods due to the existence of class imbalance. Similarly, machine and deep learning algorithms such as support vector machines, C4.5, random forest, rpart, and deep neural networks were explored during the train/test phase to select the best prediction model. The dataset used in this study contains clinical data, anthropometric measurements, and other health parameters related to smoking habits, alcohol consumption, quality of sleep, physical activity, and health status during confinement due to the pandemic associated with COVID-19. The results showed that the XGBoost model got the best features associated with COVID-19 infection, and random forest approximated the best predictive model with a balanced accuracy of 90.41% using SMOTE as a resampling technique. The model with the best performance provides a tool to help prevent contracting SARS-CoV-2 since the variables with the highest risk factor are detected, and some of them are, to a certain extent controllable.
1. Introduction
The exponential growth of infections by COVID-19, a disease associated with the SARS-CoV-2 virus leads to a global death burden, impelling the World Health Organization (WHO) to declare it a global pandemic (1). The virus can spread from an infected COVID-19 person to a healthy person through physical contact, mucous contact, or airborne transmission (2). It can be transmitted before starting showing symptoms or without ever developing symptoms at all. The COVID-19 pandemic has wreaked havoc globally, causing an economic crisis, a sanitary emergency, and confinement periods that affected people's lifestyles, habits, and daily activities (3).
Despite scientific advances in medicine, particularly the development of vaccines and Reverse Transcription Polymerase Chain Reaction (RT-PCR) tests to detect COVID-19, the pandemic has not been adequately controlled yet (3, 4). A timely and effective diagnosis remains crucial to save lives and prevent the spread of infections. Machine learning, an integral part of artificial intelligence, has been widely applied to predict or diagnose diseases, improve treatment accuracy, detect anomalies, and provide solutions to other aspects derived from the healthcare domain (5).
Concerning COVID-19, machine learning models have been developed to predict the risk of contracting the virus, indicating the severity, the risk of death, and other predictive tasks with great potential (6, 7). The timely and effective detection of COVID-19 has become an essential task for healthcare organizations since it may help decrease the deadly effect of the virus and support the planning of care (8–10). In these cases, machine learning models have been developed to assess the prognosis or mortality risk in patients with COVID-19 (11), for instance, used a Random Forest (RF) model to predict the forecasts of patients with COVID-19; similarly, the Gini index was used to identify the most critical variables (features) to assess risk and indicate the prognoses of patients.
The study by Pourhomayoun and Shakibi (12) included a dataset of 32 items related to demographic, physiological, and laboratory data and developed a predictive model to determine the health risk and also forecast the risk of mortality for patients with COVID-19. The techniques used there were: Support Vector Machines (SVM), Artificial Neural Networks (ANN), RF, Decision Tree (DTs), Logistic Regression, and K-Nearest Neighbor clustering (KNN). The ANN demonstrated the best performance with an accuracy of 93.75%.
Further research (13) has made use of computational intelligence methods to predict the daily total COVID-19 infections and deaths as observed during three lockdown schemas (partial, herd, complete). The techniques used were RF, K-NN, SVM, DTs, polynomial regression, Holt winter, ARIMA, and SARIMA. Finally, the authors concluded that herd lockdown is the best policy to control COVID-19.
In García-Ordás et al. (14), the authors studied the impact between the nutrition of the different countries and the number of deaths caused by COVID-19. They made clusters with K-means by country according to the distribution of fat, energy, and protein in 23 different types of food and the ingested in kilograms. They found a relationship between high-fat consumption and the highest death rates.
The study by Kenneth and So (15) presents the application of an extreme gradient boosting algorithm (XGboost) to predict mortality (AUC of 81.4%) and severity (72.3%) among infected individuals. The authors used 97 clinical features, specifically: demographic variables, comorbidities, blood measurements, anthropometric measures, and other risk factors (e.g., smoking/drinking habits).
The analysis by Sun et al. (16) also used XGboost to predict COVID-19 severities achieving a mean micro-average AUROC (area under the receiver operating characteristic curve) of 97%. Moreover, a mean micro-average AUPR (area under the precision-recall curve) of 94%, using 60 features (consisting of 19 proteins, 11 metabolites, seven lipids, and 23 mRNAs) was also achieved.
In García-Ordás et al. (14), the authors studied the association between the feed habits of the diverse nations and the number of deaths caused by the illness. The authors used demographic, clinical, physiological, and biochemical tests. The authors proposed an application to detect critical features and faculties of self-care in individuals with COVID-19 disease, and infectious and internal medicine specialists selected the elements to consider in self-monitoring. They concluded that interventions encouraging healthy conduct are essential conditions of COVID surveillance (17).
However, other known risk factors for illness and death from COVID-19, associated with sleep disturbances, physical activity, alcohol, metabolic syndrome, and poor diet were not included in their analysis (18–22). In this stdy, we used a dataset related to clinical and anthropometric parameters, biochemical screening, sleep disturbances, physical activity, alcohol, diet, habits, and health status during the confinement due to the COVID-19 pandemic (refer to Table 1). The primary purpose is to identify the main features of the participants who contracted COVID-19, based on their health history as registered and stored in the Tlalpan 2020 project (23), and considering the follow-up questionnaire to determine the most importable risk factors for infection.
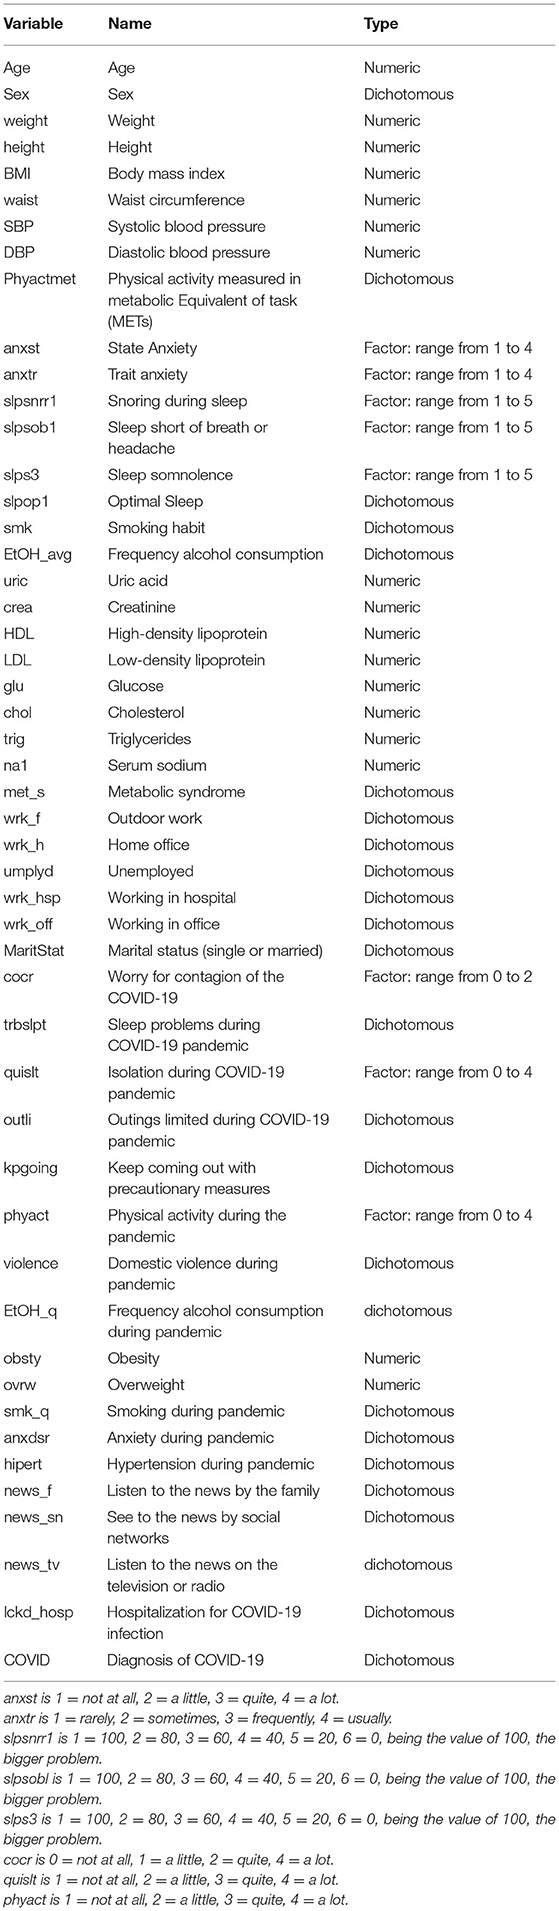
Table 1. Dataset variables.
Identifying potentially modifiable lifestyle and risk factors increasing the odds of infection during a novel pandemic (such as COVID-19) is highly relevant since it will provide the health policy authorities with further information to broaden the spectrum of non-pharmacological interventions (NPI), perhaps to include data-driven strategies to lower population risks (24–27). NPIs are still relevant to preventing infections, despite the advancement of population-level vaccination (and in the absence of widespread targeted therapies to treat people already infected); in particular, in the context of the surge of new SARS-CoV2 variants, some of which may potentially escape the effects of current vaccines.
Indeed, the use of computational intelligence and data analytics approaches for the vigilance and early survey of SARS-CoV2 infection has been an extremely relevant topic during the COVID-19 pandemic. Shabbir and collaborators (28) have implemented a strategy based on exploratory data analytics from diverse sources, coupled with telemonitoring and the use of internet of things (29–31) to detect COVID-19 severity in the context of smart hospitals (32–34). Also relevant is the use of concepts from computational social science (ambient intelligence, in particular) and again data from wearables (in this case, smartwatches) to develop early warning alerts (35–37). Several additional approaches to use machine learning to prevent or warn in advance for COVID-19 are discussed in the monographic review by Saeed et al. (38). The authors present a survey of recent literature regarding invasive non-invasive or non-contact technologies to detect, diagnose, and monitor human activities (39–41), particularly those inducing risks for COVID-19 infection or reflecting individuals with related symptoms, such as irregular respiration, in an automated fashion. Additional advances along these lines can be found in the studies by Kallel et al. (42), Conroy et al. (43), Pandey et al. (44), and Khoa et al. (45), to name but a few remarkable studies.
Despite all these timely and worthy contributions, much of these require special efforts, measurement devices, and infrastructure that may not be available at a large scale in under-developed or in-development economies. Even in medium-to-high income countries such as Mexico and even in the context of a large metropolis such as Mexico City there are large disparities in health services that prevent such (somehow sophisticated) strategies to be applied massively. In this regard, the contributions of this study will be centered on providing a machine learning approach to analyze relatively accessible clinical and sociodemographic data available in most medium-to-large hospitals (i.e., those that can treat most COVID-19 hospitalized cases), in order to provide clues for health officials to monitor for risk factors in large populations. The conditions needed for our analyses are thus of more broad applicability, in particular in places with disparities in access to healthcare services and appliances.
This article is organized as follows: In Section 2, the materials and methods are introduced. In Section 3, computational experiments' performance is shown and results are presented. A discussion (Section 4) and some concluding remarks are given (Section 5), also some ideas on the implications for future studies are outlined.
2. Materials and Methods
2.1. Data
The dataset comprised in this research was acquired from the Tlalpan 2020 study (23), a cohort at the National Institute of Cardiology in Mexico (Instituto Nacional de Cardiología-Ignacio Chávez, INC-ICh) [IRB approval code 13-802]. Data was collected from the baseline of 714 healthy adult residents of Mexico City between 20 and 50 years old. Also, a follow-up survey to know participants' habits and health status during confinement due to the COVID-19 pandemic; a total of 218 participants confirmed having contracted the COVID-19 infection. It is essential to mention that all participants gave written informed consent.
This dataset includes health variables that are related to anthropometric measurements and clinical parameters, biomedical tests, other factors such as smoking habit, alcohol consumption, physical activity, psychological stress level, sleep disorders, dietary as well as habits, and health status during the confinement due to pandemic associated with COVID-19 (refer to Table 1). Also, it is essential to mention that the dataset is imbalanced; this scenario is expected in medical diagnoses for detecting illnesses (46).
2.1.1. Anthropometric Measurements and Clinical Parameters
The International Society for the Advancement of Kinanthropometry (ISAK) policies (47) declare necessary measurements with the patient fasting, particularly the weight, height, and waist circumference. The ratio between weight and height to the square is the BMI, and the ratio of waist and height is the WHtR in cm. Another registration is the blood pressure, specifically systolic (SBP) and diastolic (DBP); therefore, the record consists of the average of three measures with a 3-min gap. The JNC7 standard procedure defines the hypertension status when SBP ≥ 140 mm Hg, a DBP ≥ 90 mm Hg, or both (48).
2.1.2. Biochemical Tests
The records for the screen test consist of measuring fasting plasma glucose (FPG), triglycerides (TGs), and high-density lipoprotein-cholesterol (HDL-C) in blood after 12 h of overnight fasting at the Central Laboratory of INC-ICh.
2.1.3. Additional Risk Factors
(1) The classification for the smoking practice is as a never, retired or present smoker.
(2) In the case of alcohol consumption, the category is a present drinker or not; the number of drinks (cups or beers) and frequency is another registration.
(3) The extended version of the International Physical Activity Questionnaire, IPAQ (49) measures the physical conditioning, through the activity in METs (metabolic equivalents)-minutes/week, and the categories are low, moderate, and high, via questions concerning four occupations: work, home, transportation, and leisure time.
(4) Psychological stress level was determined by the State-Trait Anxiety Inventory (STAI) categorized into five categories high-level anxiety (>65), moderate-high anxiety (56–65), medium anxiety (46–55), minor anxiety (36–45), and low-level anxiety (<35) (50, 51).
In the case of (5) sleep disorders, the Medical Outcomes Study-Sleep scale of 12 items was measured (52, 53).
2.1.4. Habits and Health Status During the Confinement Due to the COVID-19 Pandemic
The following habits and health status during confinement due to the COVID-19 pandemic were collected.
(1) Workplace during pandemic (wrk_f, wrk_h), (2) Degree of concern about COVID-19 (cocr), (3) Isolation level during the pandemic (quislt, outli, kpgoing), (4) Diseases and comorbidities, (5) Situations of family violence during the pandemic (violence), (6) Media consulted for news about the pandemic (news_f, news_sn, and news_tv), (7) Diagnosis of COVID-19 (COVID), (8) Recovery place COVID-19 (lckd_hosp), (9) Cigarettes consumed per day (smk_q), and (10) Diagnosis of hypertension (hipert) and (11) physical activity during the pandemic (phyact), which was defined by exercising at least three times per week for at least 30 min per session according to the minimum guidelines by American College of Sports Medicine (54).
2.2. Methods
Figure 1 illustrates a general representation of the prediction model and describes the methodology applied, where we used the data that the participants have provided to the Tlalpan 2020 project (physical activity, dietary, sleep disorders, smoking habit, alcohol consumption, psychological stress, biochemical test, and anthropometric) in visits and follow-ups, as well as the data from the follow-up questionnaire carried out during the COVID-19 lockdown.
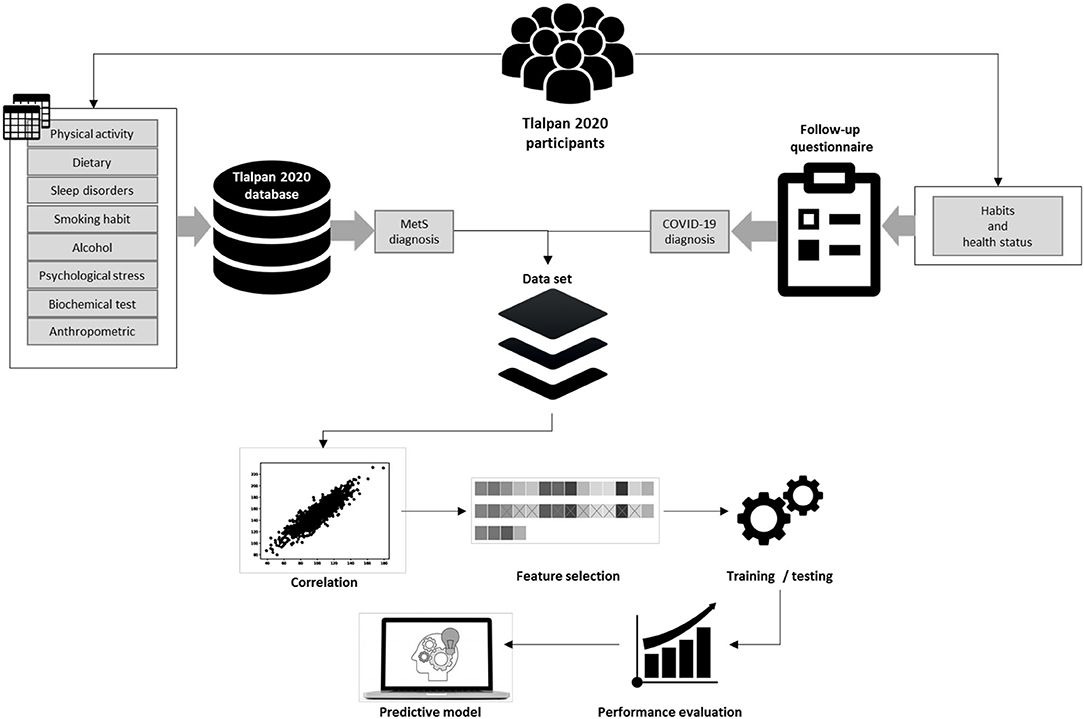
Figure 1. Prediction model.
Moreover, we used the National Cholesterol Education Program Adult Treatment Panel III criteria to classify participants with metabolic syndrome (MetS). From the follow-up questionnaire, it was possible to extract the habits and health status and positive COVID-19 infections from the same participants.
Once the dataset was conformed, we applied feature selection methods (Chi-squared, random forest, rpart, and Xgboost) to obtain the essential variables. Subsequently, we performed a correlation coefficient analysis to determine irrelevant and redundant features to create a new subset of features that contains the best features obtained by each method. The dataset was divided into two-thirds for the training and one-third for testing. Consequently, we applied data balancing methods such as over-sampling, under-sampling, and synthetic minority oversampling technique (SMOTE) to change the class distribution in the training dataset.
In this study, we applied four machine learning models: random forest, CART, C4.5, XGBoost, as well as deep neural networks, based on their high performance to diagnose COVID-19 (11, 55–57). To evaluate each model we made 30 executions with different seeds. Subsequently, we evaluated the models based on the following performance measures: sensitivity (SENS), specificity (SPC), accuracy (ACC), balanced accuracy (B.ACC), and the geometric mean (G-means); these last two metrics have been used for imbalanced data learning assessment (58). Finally, an optimized predictive model was obtained.
2.2.1. Data-Balancing Methods
The data-balancing methods improve the performance of machine learning models when the class distribution in a dataset is not equal. Models have a better performance in the majority class and a higher misclassification rate in the minority class (59). For this reason, we used two-hybrid methods, the function Random Over-Sampling Examples (ROSE) from the ROSE package (60) and SMOTE from performanceEstimation package (61), to change the class distribution in the training dataset.
Datasets related to COVID-19 have imbalanced data (62); some studies declare the improvement of machine learning methods applying SMOTE technique (63–66) and a novel variant of SMOTE (67), also ROSE is used (68).
2.2.2. Correlation Coefficient Analysis
The correlation coefficient analysis allows the feature selection procedure to measure the relationship between the dataset variables. The range of correlation values is between -1 and 1, indicating the relationship's dependency on the variables. To make this process, we used Pearson correlation, with a correlation coefficient threshold of 0.5, as defined by Equation 1 (69):
where ru, i and are the contribution scores, and also and are the average assortments.
2.2.3. Chi-Square
Chi-square is a statistical test –based on the eponymous statistic and distribution– commonly used in machine learning to rank variables and support the feature selection process (70). Given a feature f and the class c (, as complements), the chi-squared could be computed as follows:
where k is the number of classes, xi is the frequency of occurrence in class i, and the mi is the expected frequency for the same class.
2.2.4. ANOVA
Another method used to rank the importance of continuous variables was the analysis of variance (ANOVA), which is a family of statistic tests applied to compare if the means of two or more samples are significantly different. ANOVA tests can be implemented for feature selection (71), in this study, we used ANOVA f-tests to estimate the ranks of features.
2.2.5. Random Forest
Random forest developed by Breiman (72), is an ensemble machine learning algorithm consisting of multiple randomized decision trees. This algorithm is able to derive the importance score for each variable via statistical permutation tests, both methods correlate adequately (73). Hence, in this study, we calculated the variable importance through the second method using the Gini Index, computed by the equation:
where ntree is the number of trees.
2.2.6. Classification and Regression Trees
Classification and regression trees (CART) is the name of a family of Decision Tree inference methods that are algorithmically based on either classification or regression. The actual nature of the inference task (classification, regression, clustering-based, or a combination) depends on the type of data available. CART has grown up to be a robust suite of methods, able to deal with mixed data types for which optimized data pre-processing schemes (discretization, normalization, etc.) are available thus expanding the original scope of decision tree inference methods. This algorithm is implemented in the rpart package (74) and uses the Gini Index (as defined by Equation 3) to split each node and allow for optimized feature selection.
2.2.7. C4.5
The machine learning algorithm C4.5 developed by Quinlan (75), builds a decision tree using recursive partitions. Similarly, it applies the gain ratio to select the attribute to split the tree. The gain ratio can be calculated by the following equations:
where S is a set of the data samples distributed on m distinct classes, pi is the probability of samples that belongs to the class.
2.2.8. Extreme Gradient Boosting
The extreme gradient boosting (XGBoost) proposed by Chen and Guestrin (76) is an ensemble machine learning method based on the tree boosting algorithm that can obtain a predictive model with high accuracy and calculates feature importance.
2.2.9. Support Vector Machines
Support vector machines introduced by Bose et al. (77) is a supervised machine learning algorithm. SVM uses mathematical functions (kernels) to take training data as the input space and transform it into an upper dimensional space (feature space), where it aims to obtain a maximum margin hyperplane that divides the data between classes. In this research, we used the linear kernel SVM approach.
2.2.10. Performance Measures
Each model was evaluated using B.ACC, SENS, SPC (78), and G-means performance evaluation metric to determine their predictive performance, customarily defined as follows:
Where P = Positive, N = Negative, TP = True Positive, FN = False Negative, TN = True Negative, and FP = False Positive, respectively.
2.2.11. Deep Learning
The basis for improving deep learning is ANN, which works within the association among multiple hidden layers to train and obtain features for the final model (79). The implementation used here is carried out by the library Keras (80) in Python, particularly applying the sequential model; it implies that the ANN is designed by layer.
The input for the network conforms to the number of the established characteristics; then, a convolutional layer is connected with a dimension of 16, after a flattening process is made; the second layer is dense in eight dimensions; finally, a dense network of a single output is obtained; and the activation function is a sigmoid. For the training process, the essential parameters are Adam's optimizer, 2,500 epochs, and a batch size of 100. The selected parameters and architecture are according to proof of better achievement.
3. Experimental Setup
The machine learning algorithms were executed using R platform 3.6.1 with RStudio and the following packages: FSelector (81), caret (82), randomForest (83), rpart (84), ROSE (60), performanceEstimation (61), xgboost (85), and Matrix (86). In the case of deep learning, we used the Python programming language.
The computer equipment used was a Workstation Dell, Core Intel(R) Xeon(R) with 32 GB of RAM and 3.50 GHz processor speed, and Windows as an operating system. The computational resources in studies using machine learning applied to help manipulate data about COVID-19 are various and similar to those presented here. Rasheed et al. (87) used 32 GB in RAM with a processor of 3.40 GHz, even when they employed chest images; other works needed a GPU (graphic processor unit) (88). Also, specific studies operate a quantum computer (89), and others utilized fewer resources in processor (2.8 to 3.2 GHz) and RAM (8 or 12 GB) (90–92).
4. Results
The first step was to obtain the essential variables of the dataset by applying RF, chi-squared, xgboost, and rpart. Table 2 shows a list of these features sorted in descending order. Similarly, a correlation coefficient analysis was carried out to determine how strong the relationship between the features is.
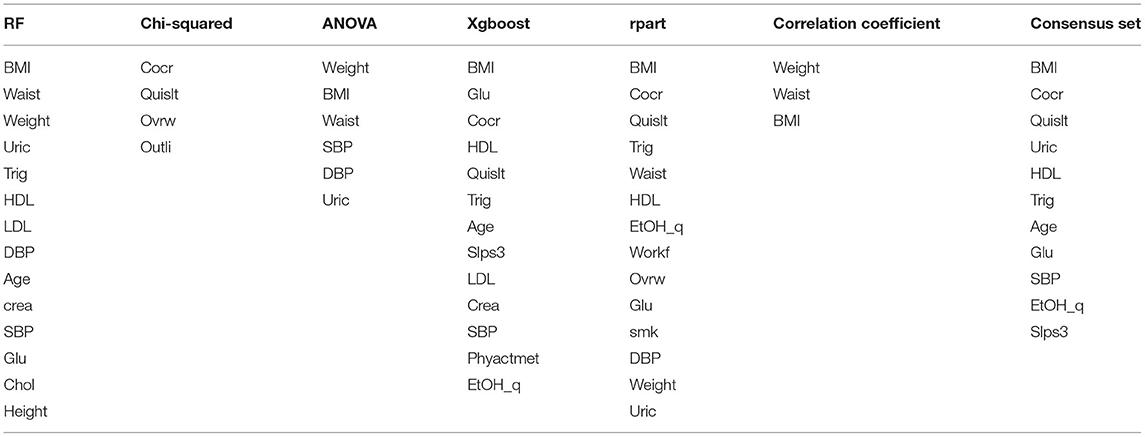
Table 2. Results of the feature selection process.
Figure 2 displays the graphic correlation coefficient of features, where it was possible to identify the statistical dependency structures. The results of this process indicated that weight, waist, BMI, and height were strongly correlated as expected. A fifth subset (consensus set) was created by summarizing the effects of the essential variables, comprising the best features obtained by each method; nevertheless, highly correlated variables were eliminated to avoid colinearity.
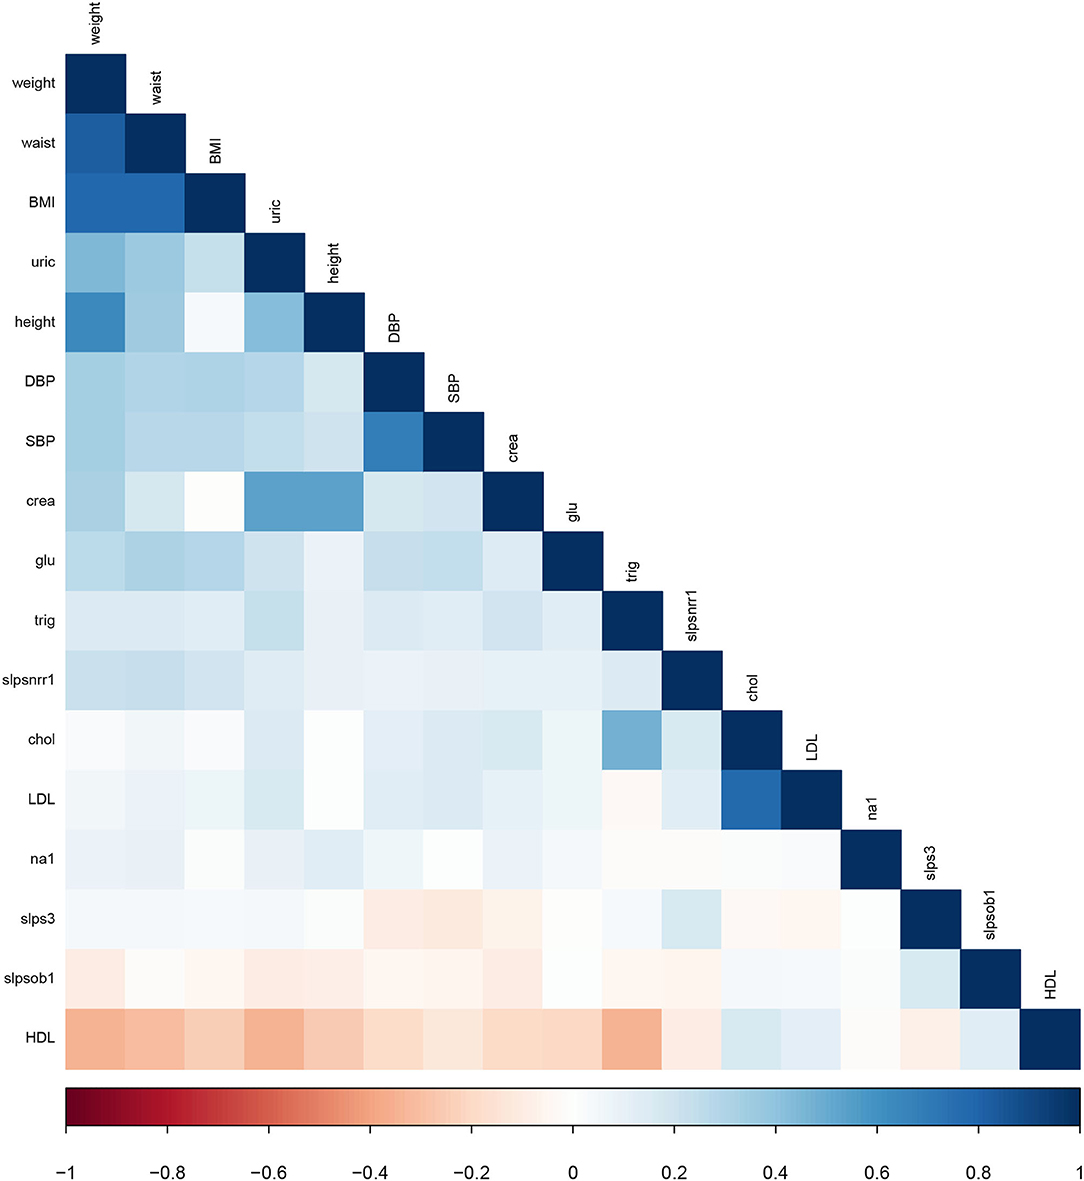
Figure 2. The correlation coefficient of the continuous variables of the dataset.
As shown in Table 2, only the BMI feature remains in the consensus set unlike weight, waist, and uric, which appear in the previous subsets. Each subset of features was tested to find which subset gives the best performance.
In order to choose the best subset of features, we made 30 independent executions using each machine learning algorithm (rpart, C4.5, RF, and SVM) with different seeds, considering the metrics presented in the performance measures section B.ACC is the primary metric to consider. Similarly, it was needed to use balancing methods (SMOTE and ROSE) with each algorithm since a class imbalance in the dataset affected the performance of the algorithms.
In the case of rpart, RF, and SVM, it was necessary to perform a pre-execution for parameter tuning. For tuning RF, the value of the ntree parameter varied between 100 and 1,000, and the mtry was varied between 1 and 10. In all cases, the grid search method introduced by Hsu et al. (93) was applied. Similarly, we used 10-fold cross-validation with ten replays in the training process and ensured the different proofs of the diversity partition of data.
Table 3 displays each classifier's results filtered by applying SMOTE as a balancing method, the average of the 30 executions, and the standard deviation (SD). The highest average result of each classifier in B.ACC is highlighted in bold.
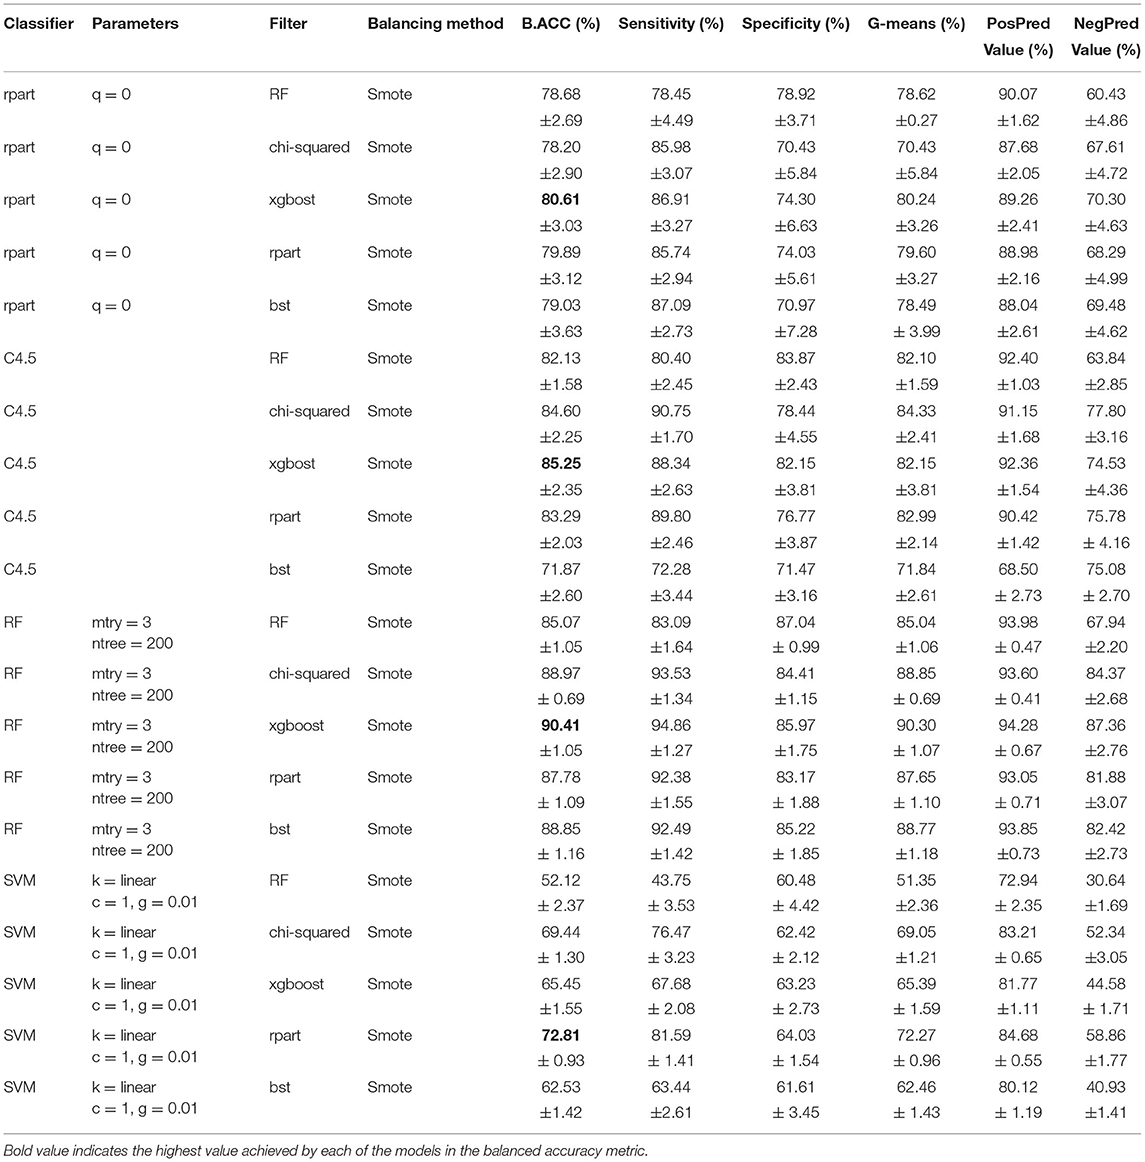
Table 3. Feature selection results (SMOTE).
As shown in Table 3 three classifiers got the best performance using the subset generated by Xgboost. Then, RF has the more remarkable achievement in balanced accuracy (B.ACC) of 90.41% and SD of 1.05. Followed by 80.61% in B.ACC and 3.03 in SD using rpart. The third place is the C4.5 model (B.ACC = 85.25% and SD = 2.35). The model obtained by SVM shows a better result through the rpart subset obtained; however, the performance is not the highest; the metrics are B.ACC = 72.81% and SD = 0.93.
Table 4 shows the results using ROSE as a balancing method, where the SVM with the subset of features obtained by rpart achieved the best performance, reaching a B.ACC of 73.11% and SD of 0.0140. Nevertheless, the results obtained with ROSE do not improve in comparison with the results obtained with SMOTE.
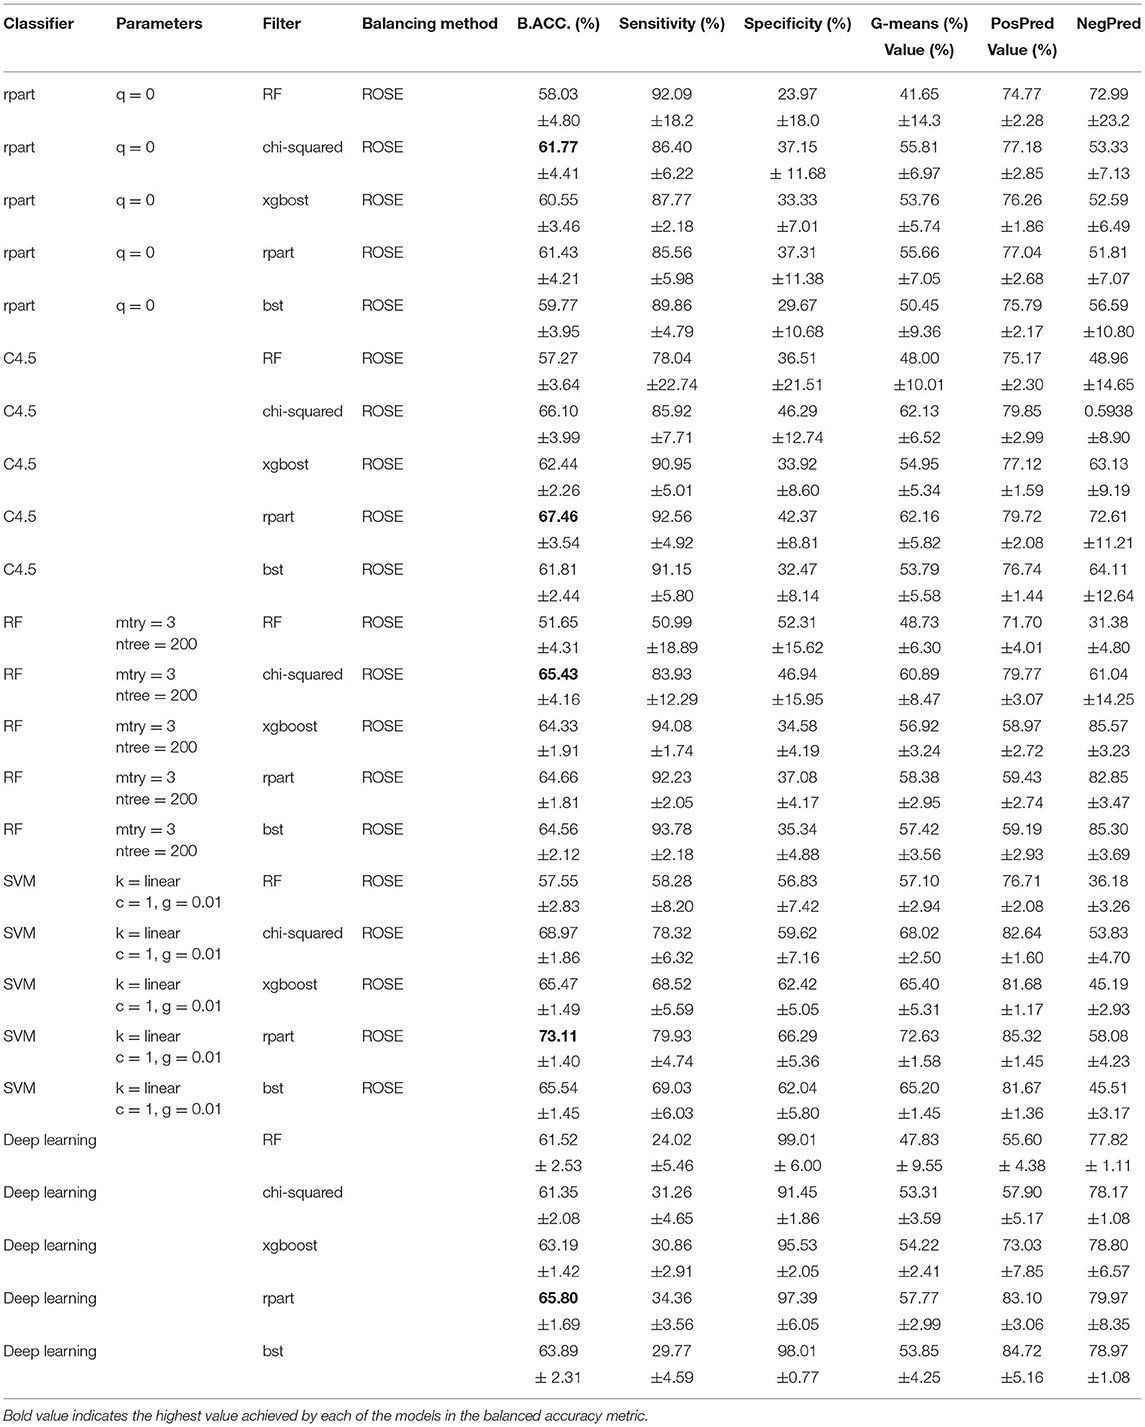
Table 4. Feature selection results (ROSE).
The worst performance was obtained by the deep learning model since the sensitivity is low (refer to Table 4), which may be due to the number of existing patient records since the capacity of neural networks with a more significant amount of data has been demonstrated. Therefore, according to the metrics results obtained by the machine learning classifiers, it was feasible to determine the most suitable model and the main characteristics of participants who contracted COVID-19.
The finest model was RF with a ntree of 200 and a mtry of 3, and the subsequent attributes obtained by Xgboost: BMI, glu, cocr, HDL, quislt, trig, age, slps3, LDL, crea, SBP, phyactmet, EtOH_q, and weight. These relevant features are firmly related to COVID-19 infections, such as the consumption of alcoholic drinks (94–96), sleep disorders (97), BMI (98–100), age (101, 102), and physical activity (103).
5. Discussion
It is interesting to notice that even though computational intelligence and machine learning approaches at the level presented here are not able to provide any mechanistic nor semi-mechanistic explanation of the underlying phenomena behind their predictions; since this is not the goal for which they were designed.
These tools can be used however to perform timely predictions based on the data. These predictive models can thus be used by decision makers and public health authorities for the design and implementation of policy and actionable measures that are especially needed in critical times such as the ones presented by the global COVID-19 pandemic.
Hence, even though it is quite likely that the selected features are indeed proxies for the actual (unknown and likely unmeasured) determinants of infection; they present an important opportunity since many of them are actionable (either controllable or measurable).
Take for instance the selected features in the Consensus set. As presented in Table 2, the set consists of 11 features: body mass index (measurable and to some extent controllable), worry for COVID-19 contagion (measurable, or more properly, surveyable and to a certain extent controllable), isolation during the COVID-19 pandemic (measurable and controllable), uric acid levels (measurable and to some extent controllable), HDL levels (measurable and to some extent controllable), triglycerides levels (measurable and to some extent controllable), age (measurable), glucose levels (measurable and to some extent controllable), Systolic Blood Pressure (measurable and to some extent controllable), frequency of alcohol consumption during the pandemic (surveyable and controllable), and sleep somnolence (surveyable). Similar remarks can be made about most other features selected by the diverse approaches used in this study.
Several of these features have been of course analyzed in the context of disease severity, once the individuals are already infected, but the role they may be playing or their potential associations with the infection itself, have been less discussed in the literature with some remarkable exceptions regarding BMI (104, 105), HDL (106, 107), age (108), alcohol consumption (109), and somnolence (110), among others.
In a nutshell, even if the actual risk factors are not the features selected by our machine learning algorithm, these are likely either a combination of those features selected or a statistically dependent set of these. In either case, it is likely that by controlling/modifying these issues, COVID-19 infections may become intervened. Hence, knowing these variables, that in the end predicted with very high sensitivity and specificity COVID-19 infections in an urban population of a large metropolitan area such as Mexico City, may provide some opportunities for interventional policy.
A number of these featured variables for instance are related to metabolism, food consumption, exercise habits, and lifestyle. Though these issues are not easily modifiable in the short run, public health interventions can be made to address them in a medium to a long time.
However, since these indicators are measurable or surveyable, this opens the possibility to implement policy measures to protect high risk individuals (HRIs). For instance, HRIs can be prioritized to work from home or they can be tested more often, etc. Indeed, the data-driven design of non-pharmaceutical interventions to alleviate the burden caused by COVID-19 infections has been discussed recently in diverse contexts including social contact structure, human mobility, and environmental constraints (24–27).
In fact, in recent times, it has been consistently discussed how machine learning approaches may be extremely valuable tools for the design of public health policy (111, 112). This is particularly true for the management of infectious diseases, both in the clinical decision and primary care (113, 114), epidemiological surveillance (115), social perception (116), and policy making levels (117–119).
In particular, feature selection approaches to risk assessment of infectious diseases have been successfully applied in the case of tuberculosis (120), zika (121), dengue (122), clostridium difficile (123), HIV (124), and even COVID-19 (125, 126). These previous efforts have shown the advantages of these approaches as reliable tools for epidemic outbreak prevention and containment.
In the particular case of the present study, we can highlight the fact that the features selected are not only measurable/surveyable but are actually relatively easy to measure. Indeed, measurements and surveys are low cost, easily manageable, and highly scalable. These characteristics are relevant in the context of the actual implementation of the predictive models here presented to design policy and implement actions to tackle a challenging situation such as the COVID-19 pandemic.
6. Conclusion
Machine learning algorithms have played a critical role in the diagnostics and containment of the COVID-19 pandemic since, through multivariate methods, these tools may provide an overview of the association between various factors and their relationship regarding potential risk factors for infection, unveiling hidden patterns that may result essential for the proper implementation of public health policy.
In the approach followed in this study, we have implemented and bench-marked several state of the art feature selection methods on a dataset obtained in real time over a well-studied cohort consisting of adults of both sexes living in the metropolitan area of Mexico City. We believe that some of our results, aside from being useful in our socio-geographical context, maybe somehow generalizable to other similar urban populations.
We are confident that embracing data-driven policy designs may further contribute to faster, targeted interventions to cope with current and future challenges to public health, such as the case of the COVID-19 pandemic.
Data Availability Statement
Due to personal privacy issues, raw data cannot be provided unless proper inter-institutional ethico-legal agreements are signed. Anonymized data is available upon request. For data related enquiries please contact Dr. Mireya Martinez-Garcia, bWlyZXlhLm1hcnRpbmV6QGNhcmRpb2xvZ2lhLm9yZy5teA==.
Author Contributions
TR-d implemented computing code and algorithmics and contributed to drafting the manuscript. MM-G performed clinical, sociomedical, and health policy research and contributed to drafting the manuscript. MF-M performed the clinical assessment. LL-T contributed to clinical assessment. GG-E designed computational strategy, implemented computing code and algorithmics, evaluated performance measures, co-supervised the project, and drafted the manuscript. EH-L devised the strategy, co-supervised the project, performed the technical assessment, and revised and edited the manuscript. All authors read and approved the submitted version of the manuscript.
Funding
This research was supported by the National Council of Science and Technology (CONACYT, México), Cátedras CONACYT 1591.
Conflict of Interest
The authors declare that the research was conducted in the absence of any commercial or financial relationships that could be construed as a potential conflict of interest.
Publisher's Note
All claims expressed in this article are solely those of the authors and do not necessarily represent those of their affiliated organizations, or those of the publisher, the editors and the reviewers. Any product that may be evaluated in this article, or claim that may be made by its manufacturer, is not guaranteed or endorsed by the publisher.
Acknowledgments
The authors are grateful to the Tlalpan 2020 project Advisory Group.
References
2. Morawska L, Cao J. Airborne transmission of SARS-CoV-2: The world should face the reality. Environ Int. (2020) 139:105730. doi: 10.1016/j.envint.2020.105730
3. Mansour NA, Saleh AI, Badawy M, Ali HA. Accurate detection of Covid-19 patients based on Feature Correlated Naïve Bayes (FCNB) classification strategy. J Ambient Intell Humaniz Comput. (2021) 13:1–33. doi: 10.1007/s12652-020-02883-2
4. Zu ZY, Jiang MD, Xu PP, Chen W, Ni QQ, Lu GM, et al. Coronavirus disease 2019 (COVID-19): a perspective from China. Radiology. (2020) 296:E15-E25. doi: 10.1148/radiol.2020200490
5. Shailaja K, Seetharamulu B, Jabbar M. Machine learning in healthcare: a review. In: 2018 Second International Conference on Electronics, Communication and Aerospace Technology (ICECA). Coimbatore: IEEE (2018). p. 910–4.
6. van der Schaar M, Alaa AM, Floto A, Gimson A, Scholtes S, Wood A, et al. How artificial intelligence and machine learning can help healthcare systems respond to COVID-19. Mach Learn. (2021) 110:1–14. doi: 10.1007/s10994-020-05928-x
7. Islam M, Poly TN, Alsinglawi B, Lin MC, Hsu MH, Li YCJ, et al. A state-of-the-art survey on artificial intelligence to fight COVID-19. J Clin Med. (2021) 10:1961. doi: 10.3390/jcm10091961
8. Shinde GR, Kalamkar AB, Mahalle PN, Dey N, Chaki J, Hassanien AE. Forecasting models for coronavirus disease (COVID-19): a survey of the state-of-the-art. SN Comput Sci. (2020) 1:1–15. doi: 10.1007/s42979-020-00209-9
9. Hébert-Dufresne L, Althouse BM, Scarpino SV, Allard A. Beyond R 0: heterogeneity in secondary infections and probabilistic epidemic forecasting. J R Soc Interface. (2020) 17:20200393. doi: 10.1098/rsif.2020.0393
10. Poletto C, Scarpino SV, Volz EM. Applications of predictive modelling early in the COVID-19 epidemic. Lancet Digit Health. (2020) 2:e498-e499. doi: 10.1016/S2589-7500(20)30196-5
11. Wang J, Yu H, Hua Q, Jing S, Liu Z, Peng X, et al. A descriptive study of random forest algorithm for predicting COVID-19 patients outcome. PeerJ. (2020) 8:e9945. doi: 10.7717/peerj.9945
12. Pourhomayoun M, Shakibi M. Predicting mortality risk in patients with COVID-19 using machine learning to help medical decision-making. Smart Health. (2021) 20:100178. doi: 10.1016/j.smhl.2020.100178
13. Saba T, Abunadi I, Shahzad MN, Khan AR. Machine learning techniques to detect and forecast the daily total COVID-19 infected and deaths cases under different lockdown types. Microsc Res Tech. (2021) 84:1462–74. doi: 10.1002/jemt.23702
14. García-Ordás MT, Arias N, Benavides C, García-Olalla O, Benítez-Andrades JA. Evaluation of country dietary habits using machine learning techniques in relation to deaths from COVID-19. Healthcare. (2020) 8:371. doi: 10.3390/healthcare8040371
15. Kenneth C, So HC. Uncovering clinical risk factors and prediction of severe COVID-19: a machine learning approach based on UK Biobank data. medRxiv. (2020). doi: 10.1101/2020.09.18.20197319
16. Sun C, Bai Y, Chen D, He L, Zhu J, Ding X, et al. Accurate classification of COVID-19 patients with different severity via machine learning. Clin Transl Med. (2021) 11:323. doi: 10.1002/ctm2.323
17. Mohammad H, Elham M, Mehraeen E, Aghamohammadi V, Seyedalinaghi S, Kalantari S, et al. Identifying data elements and key features of a mobile-based self-care application for patients with COVID-19 in Iran. Health Inform J. (2021) 27:14604582211065703. doi: 10.1177/14604582211065703
18. Demasi M. COVID-19 and metabolic syndrome: could diet be the key?. R Soc Med. (2021) 26:1–2. doi: 10.1136/bmjebm-2020-111451
19. Saengow U, Assanangkornchai S, Casswell S. Alcohol: a probable risk factor of COVID-19 severity. Addiction. (2020) 116:204–05. doi: 10.1111/add.15194
20. Sher L. COVID-19, anxiety, sleep disturbances and suicide. Sleep Med. (2020) 70:124–124. doi: 10.1016/j.sleep.2020.04.019
21. Belanger MJ, Hill MA, Angelidi AM, Dalamaga M, Sowers JR, Mantzoros CS. Covid-19 and disparities in nutrition and obesity. N Engl J Med. (2020) 383:e69. doi: 10.1056/NEJMp2021264
22. Ingram J, Maciejewski G, Hand CJ. Changes in diet, sleep, and physical activity are associated with differences in negative mood during COVID-19 lockdown. Front Psychol. (2020) 11:2328. doi: 10.3389/fpsyg.2020.588604
23. Colín-Ramírez E, Rivera-Mancía S, Infante-Vázquez O, Cartas-Rosado R, Vargas-Barrón J, Madero M, et al. Protocol for a prospective longitudinal study of risk factors for hypertension incidence in a Mexico City population: the Tlalpan 2020 cohort. BMJ Open. (2017) 7:e016773. doi: 10.1136/bmjopen-2017-016773
24. de Anda-Jáuregui G, Hernández-Lemus E. Modular reactivation of Mexico city after COVID-19 lockdown. BMC Public Health. (2020) 22:961. doi: 10.1186/s12889-022-13183-z
25. Kraemer MU, Yang CH, Gutierrez B, Wu CH, Klein B, Pigott DM, et al. The effect of human mobility and control measures on the COVID-19 epidemic in China. Science. (2020) 368:493–7. doi: 10.1126/science.abb4218
26. Bedson J, Skrip LA, Pedi D, Abramowitz S, Carter S, Jalloh MF, et al. A review and agenda for integrated disease models including social and behavioural factors. Nat Hum Behav. (2021) 5:834–46. doi: 10.1038/s41562-021-01136-2
27. Eliassi-Rad T, Chawla N, Colizza V, Gardner L, Salathé M, Scarpino S, et al. Fighting a pandemic: convergence of expertise, data science and policy. In: Proceedings of the 26th ACM SIGKDD International Conference on Knowledge Discovery & Data Mining. Boston, MA. (2020). p. 3493–4.
28. Shabbir A, Shabbir M, Javed AR, Rizwan M, Iwendi C, Chakraborty C. Exploratory data analysis, classification, comparative analysis, case severity detection, and internet of things in COVID-19 telemonitoring for smart hospitals. J Exp Theor Artif Intell. (2022) 1–28. doi: 10.1080/0952813X.2021.1960634
29. Lavric A, Petrariu AI, Mutescu PM, Coca E, Popa V. Internet of things concept in the context of the COVID-19 pandemic: a multi-sensor application design. Sensors. (2022) 22:503. doi: 10.3390/s22020503
30. Javaid M, Khan IH. Internet of Things (IoT) enabled healthcare helps to take the challenges of COVID-19 Pandemic. J Oral Biol Craniofacial Res. (2021) 11:209–14. doi: 10.1016/j.jobcr.2021.01.015
31. Singh RP, Javaid M, Haleem A, Suman R. Internet of things (IoT) applications to fight against COVID-19 pandemic. Diabetes Metab Syndrome. (2020) 14:521–4. doi: 10.1016/j.dsx.2020.04.041
32. Abdulkareem KH, Mohammed MA, Salim A, Arif M, Geman O, Gupta D, et al. Realizing an effective COVID-19 diagnosis system based on machine learning and IOT in smart hospital environment. IEEE Internet Things J. (2021) 8:15919–28. doi: 10.1109/JIOT.2021.3050775
33. Ranaweera P, Liyanage M, Jurcut AD. Novel MEC based approaches for smart hospitals to combat COVID-19 pandemic. IEEE Consum Electron Mag. (2020) 10:80–91. doi: 10.1109/MCE.2020.3031261
34. Lin CL, Chen JK, Ho HH. BIM for smart hospital management during COVID-19 Using MCDM. Sustainability. (2021) 13:6181. doi: 10.3390/su13116181
35. Saleem K, Saleem M, Zeeshan R, Javed AR, Alazab M, Gadekallu TR, et al. Situation-aware BDI reasoning to detect early symptoms of COVID 19 using smartwatch. IEEE Sens J. (2022) 1–1. doi: 10.1109/JSEN.2022.3156819
36. Quer G, Gadaleta M, Radin JM, Andersen KG, Baca-Motes K, Ramos E, et al. Inter-individual variation in objective measure of reactogenicity following COVID-19 vaccination via smartwatches and fitness bands. npj Digit Med. (2022) 5:1–9. doi: 10.1038/s41746-022-00591-z
37. Alavi A, Bogu GK, Wang M, Rangan ES, Brooks AW, Wang Q, et al. Real-time alerting system for COVID-19 and other stress events using wearable data. Nat Med. (2022) 28:175–84. doi: 10.1038/s41591-021-01593-2
38. Saeed U, Shah SY, Ahmad J, Imran MA, Abbasi QH, Shah SA. Machine learning empowered COVID-19 patient monitoring using non-contact sensing: An extensive review. J Pharm Anal. (2022) 12:193–204. doi: 10.1016/j.jpha.2021.12.006
39. Sornalakshmi K, Venkataramanan R, Pradeepa R. Machine learning for human activity detection using wearable healthcare device. In: Proceedings of the International Conference on Paradigms of Communication, Computing and Data Sciences. Singapur: Springer (2022). p. 711–24.
40. Tan TH, Wu JY, Liu SH, Gochoo M. Human activity recognition using an ensemble learning algorithm with smartphone sensor data. Electronics. (2022) 11:322. doi: 10.3390/electronics11030322
41. Mohan S, Abugabah A, Kumar Singh S, kashif Bashir A, Sanzogni L. An approach to forecast impact of Covid-19 using supervised machine learning model. Software. (2022) 52:824–40. doi: 10.1002/spe.2969
42. Kallel A, Rekik M, Khemakhem M. Hybrid-based framework for COVID-19 prediction via federated machine learning models. J Supercomput. (2022) 78:7078–105. doi: 10.1007/s11227-021-04166-9
43. Conroy B, Silva I, Mehraei G, Damiano R, Gross B, Salvati E, et al. Real-time infection prediction with wearable physiological monitoring and AI to aid military workforce readiness during COVID-19. Sci Rep. (2022) 12:1–12. doi: 10.1038/s41598-022-07764-6
44. Pandey R, Gautam V, Pal R, Bandhey H, Dhingra LS, Misra V, et al. A machine learning application for raising wash awareness in the times of covid-19 pandemic. Sci Rep. (2022) 12:1–10. doi: 10.1038/s41598-021-03869-6
45. Khoa BT, Oanh NTT, Uyen VTT, Dung DCH. Customer loyalty in the Covid-19 pandemic: the application of machine learning in survey data. In: Smart Systems: Innovations in Computing. Cham: Springer (2022). p. 419–29.
46. Johnson JM, Khoshgoftaar TM. Survey on deep learning with class imbalance. J Big Data. (2019) 6:1–54. doi: 10.1186/s40537-019-0192-5
47. Marfell-Jones MJ, Stewart A, De Ridder J. International standards for anthropometric assessment. In: Wellington, New Zealand: International Society for the Advancement of Kinanthropometry. (2012).
48. Chobanian AV, Bakris GL, Black HR, Cushman WC, Green LA, Izzo JL Jr, et al. Seventh report of the joint national committee on prevention, detection, evaluation, and treatment of high blood pressure. Hypertension. (2003) 42:1206–52. doi: 10.1161/01.HYP.0000107251.49515.c2
49. Craig CL, Marshall AL, Sjöström M, Bauman AE, Booth ML, Ainsworth BE, et al. International physical activity questionnaire: 12-country reliability and validity. Med Sci Sports Exerc. (2003) 35:1381–95. doi: 10.1249/01.MSS.0000078924.61453.FB
50. Spielberger CD, Smith LH. Anxiety (drive), stress, and serial-position effects in serial-verbal learning. J Exp Psychol. (1966) 72:589. doi: 10.1037/h0023769
51. Horváth A, Montana X, Lanquart JP, Hubain P, Szűcs A, Linkowski P, et al. Effects of state and trait anxiety on sleep structure: a polysomnographic study in 1083 subjects. Psychiatry Res. (2016) 244:279–83. doi: 10.1016/j.psychres.2016.03.001
52. Stewart AL, Ware JE. Measuring Functioning and Well-Being: the Medical Outcomes Study Approach. Duke: Duke University Press (1992).
53. Spritzer K, Hays R. MOS Sleep Scale: A Manual for Use and Scoring, version 1.0. Los Angeles, CA (2003).
54. Haskell WL, Lee IM, Pate RR, Powell KE, Blair SN, Franklin BA, et al. Physical activity and public health: updated recommendation for adults from the American College of Sports Medicine and the American Heart Association. Circulation. (2007) 116:1081. doi: 10.1161/CIRCULATIONAHA.107.185649
55. Connor S, Khoshgoftaar TM, Borko F. Deep learning applications for COVID-19. J Big Data. (2021) 8:18. doi: 10.1186/s40537-020-00392-9
56. Nanda S, Panigrahi CR, Pati B, Rath M, Weng TH. COVID-19 risk assessment using the C4. 5 Algorithm. In: Computational Intelligence Techniques for Combating COVID-19. Cham. (2021). p. 61.
57. Yan L, Zhang HT, Goncalves J, Xiao Y, Wang M, Guo Y, et al. An interpretable mortality prediction model for COVID-19 patients. Nat Mach Intell. (2020) 2:283–8. doi: 10.1038/s42256-020-0180-7
58. Bekkar M, Djemaa HK, Alitouche TA. Evaluation measures for models assessment over imbalanced data sets. J Inf Eng Appl. (2013) 3(10). doi: 10.5121/ijdkp.2013.3402
59. Fernández A, García S, Galar M, Prati RC, Krawczyk B, Herrera F. Learning From Imbalanced Data Sets. Vol. 10. Cham: Springer (2018).
60. Lunardon N, Menardi G, Torelli N. ROSE: a package for binary imbalanced learning. R J. (2014) 6:8. doi: 10.32614/RJ-2014-008
61. Chawla NV, Bowyer KW, Hall LO, Kegelmeyer WP. SMOTE: synthetic minority over-sampling technique. J Artif Intell Res. (2002) 16:321–57. doi: 10.1613/jair.953
62. Alballa N, Al-Turaiki I. Machine learning approaches in COVID-19 diagnosis, mortality, and severity risk prediction: a review. Inform Med Unlocked. (2021) 24:100564. doi: 10.1016/j.imu.2021.100564
63. Pahar M, Klopper M, Warren R, Niesler T. COVID-19 cough classification using machine learning and global smartphone recordings. Comput Biol Med. (2021) 135:104572. doi: 10.1016/j.compbiomed.2021.104572
64. Kukar M, Gunčar G, Vovko T, Podnar S, Černelč P, Brvar M, et al. COVID-19 diagnosis by routine blood tests using machine learning. Sci Rep. (2021) 11:1–9. doi: 10.1038/s41598-021-90265-9
65. Heldt FS, Vizcaychipi MP, Peacock S, Cinelli M, McLachlan L, Andreotti F, et al. Early risk assessment for COVID-19 patients from emergency department data using machine learning. Sci Rep. (2021) 11:1–13. doi: 10.1038/s41598-021-83784-y
66. Hossain M, Asadullah M, Rahaman A, Miah M, Hasan MZ, Paul T, et al. Prediction on domestic violence in bangladesh during the covid-19 outbreak using machine learning methods. Appl Syst Innovat. (2021) 4:77. doi: 10.3390/asi4040077
67. Wu J, Shen J, Xu M, Shao M. A novel combined dynamic ensemble selection model for imbalanced data to detect COVID-19 from complete blood count. Comput Methods Programs Biomed. (2021) 211:106444. doi: 10.1016/j.cmpb.2021.106444
68. Wibowo P, Fatichah C. Pruning-based oversampling technique with smoothed bootstrap resampling for imbalanced clinical dataset of Covid-19. In: Journal of King Saud University-Computer and Information Sciences. Riyadh. (2021).
69. Bobadilla J, Ortega F, Hernando A. A collaborative filtering similarity measure based on singularities. Inform Process Manag. (2012) 48:204–17. doi: 10.1016/j.ipm.2011.03.007
70. Zheng Z, Wu X, Srihari RK. Feature selection for text categorization on imbalanced data. SIGKDD Explorat. (2004) 6:80–9. doi: 10.1145/1007730.1007741
71. Nasiri H, Alavi SA. A novel framework based on deep learning and ANOVA feature selection method for diagnosis of COVID-19 cases from chest X-ray Images. Comput Intell Neurosci. (2021) 2022:16713244. doi: 10.36227/techrxiv.16713244
73. Strobl C, Boulesteix AL, Kneib T, Augustin T, Zeileis A. Conditional variable importance for random forests. BMC Bioinformatics. (2008) 9:1–11. doi: 10.1186/1471-2105-9-307
74. Therneau T, Atkinson B, Ripley B, Ripley MB. Package ‘rpart’. (2015). Available online at: http://uk/web/packages/rpart/rpartpdf (accessed on April 20, 2016).
76. Chen T, Guestrin C. Xgboost: A scalable tree boosting system. In: Proceedings of the 22nd ACM Sigkdd International Conference on Knowledge Discovery and Data Mining. New York. (2016). p. 785–94.
77. Boser BE, Guyon IM, Vapnik VN. A training algorithm for optimal margin classifiers. In: Proceedings of the Fifth Annual Workshop on Computational Learning Theory. Pennsylvania. (1992). p. 144–52.
78. Urbanowicz RJ, Moore JH. ExSTraCS 2.0: description and evaluation of a scalable learning classifier system. Evol Intell. (2015) 8:89–116. doi: 10.1007/s12065-015-0128-8
79. Hinton GE, Osindero S, Teh YW. A fast learning algorithm for deep belief nets. Neural Comput. (2006) 18:1527–54. doi: 10.1162/neco.2006.18.7.1527
80. Chollet F,. Keras. (2015). Available online at: https://keras.io (accessed on March 12, 2022).
81. Romanski P, Kotthoff L, Kotthoff ML. Package ‘FSelector’. (2013). Available online at: http://cran/r-projectorg/web/packages/FSelector/indexhtml.
83. RColorBrewer S, Liaw A, Wiener M, Liaw MA. Package ‘randomForest’. (2018). Available online: https://cran.r-project.org/web/packages/randomForest/randomForest.pdf (accessed on January 20, 2022).
84. Therneau TM, Atkinson B, Ripley MB. The rpart Package. Oxford, UK: R Foundation for Statistical Computing (2010).
85. Chen T, He T, Benesty M, Khotilovich V, Tang Y, Cho H, et al. Xgboost: extreme gradient boosting. R Package Version 04-2. (2015).
87. Rasheed J, Hameed AA, Djeddi C, Jamil A, Al-Turjman F. A machine learning-based framework for diagnosis of COVID-19 from chest X-ray images. Interdisc Sci. (2021) 13:103–17. doi: 10.1007/s12539-020-00403-6
88. Kumar R, Arora R, Bansal V, Sahayasheela VJ, Buckchash H, Imran J, et al. Accurate prediction of COVID-19 using chest X-ray images through deep feature learning model with SMOTE and machine learning classifiers. MedRxiv. (2020) doi: 10.1101/2020.04.13.20063461
89. Acar E, Yilmaz I. COVID-19 detection on IBM quantum computer with classical-quantum transfer learning. Turkish J Electr Eng Comput Sci. (2021) 29:46–61. doi: 10.3906/elk-2006-94
90. Subramani P, Srinivas K, Kavitha Rani B, Sujatha R, Parameshachari BD. Prediction of muscular paralysis disease based on hybrid feature extraction with machine learning technique for COVID-19 and post-COVID-19 patients. Pers Ubiquitous Comput. (2021) 1–14. doi: 10.1007/s00779-021-01531-6
91. Brinati D, Campagner A, Ferrari D, Locatelli M, Banfi G, Cabitza F. Detection of COVID-19 infection from routine blood exams with machine learning: a feasibility study. J Med Syst. (2020) 44:1–12. doi: 10.1007/s10916-020-01597-4
92. Muhammad L, Algehyne EA, Usman SS, Ahmad A, Chakraborty C, Mohammed IA. Supervised machine learning models for prediction of COVID-19 infection using epidemiology dataset. SN Comput Sci. (2021) 2:1–13. doi: 10.1007/s42979-020-00394-7
93. Hsu CW, Chang CC, Lin CJ. A Practical Guide to Support Vector Classification. : Taipei: National Taiwan University. (2003).
94. Testino G. Are patients with alcohol use disorders at increased risk for Covid-19 infection? Alcohol Alcoholism. (2020) 55:344–6. doi: 10.1093/alcalc/agaa037
95. Okuno F, Arai M, Ishii H, Shigeta Y, Ebihara Y, Takagi S, et al. Mild but prolonged elevation of serum angiotensin converting enzyme (ACE) activity in alcoholics. Alcohol. (1986) 3:357–9. doi: 10.1016/0741-8329(86)90053-4
96. Kianersi S, Ludema C, Macy JT, Chen C, Rosenberg M. High-risk alcohol consumption may increase the risk of SARS-CoV-2 seroconversion: a prospective seroepidemiologic cohort study among American college students. medRxiv. (2021) doi: 10.1101/2021.08.03.21261444
97. Partinen M. Sleep research in 2020: COVID-19-related sleep disorders. Lancet Neurol. (2021) 20:15–17. doi: 10.1016/S1474-4422(20)30456-7
98. Sattar N, McInnes IB, McMurray JJ. Obesity is a risk factor for severe COVID-19 infection: multiple potential mechanisms. Circulation. (2020) 142:4–6. doi: 10.1161/CIRCULATIONAHA.120.047659
99. Kassir R. Risk of COVID-19 for patients with obesity. Obesity Rev. (2020) 21:13034. doi: 10.1111/obr.13034
100. Kwok S, Adam S, Ho JH, Iqbal Z, Turkington P, Razvi S, et al. Obesity: a critical risk factor in the COVID-19 pandemic. Clin Obes. (2020) 10:e12403. doi: 10.1111/cob.12403
101. Romero Starke K, Petereit-Haack G, Schubert M, Kämpf D, Schliebner A, Hegewald J, et al. The age-related risk of severe outcomes due to COVID-19 infection: a rapid review, meta-analysis, and meta-regression. Int J Environ Res Public Health. (2020) 17:5974. doi: 10.3390/ijerph17165974
102. Rashedi J, Mahdavi Poor B, Asgharzadeh V, Pourostadi M, Samadi Kafil H, Vegari A, et al. Risk factors for COVID-19. Infez Med. (2020) 28:469–74.
103. Lee SW, Lee J, Moon SY, Jin HY, Yang JM, Ogino S, et al. Physical activity and the risk of SARS-CoV-2 infection, severe COVID-19 illness and COVID-19 related mortality in South Korea: a nationwide cohort study. Br J Sports Med. (2021) 1–13. doi: 10.1136/bjsports-2021-104203
104. Sattar N, Ho FK, Gill JM, Ghouri N, Gray SR, Celis-Morales CA, et al. BMI and future risk for COVID-19 infection and death across sex, age and ethnicity: Preliminary findings from UK biobank. Diab Metab Syndrome. (2020) 14:1149–51. doi: 10.1016/j.dsx.2020.06.060
105. Ranjan P, Kumar A, Chowdhury S, Pandey S, Choudhary A, Bhattacharya A, et al. Is excess weight a risk factor for the development of COVID 19 infection? A preliminary report from India. Diab Metab Syndrome. (2020) 14:1805–7. doi: 10.1016/j.dsx.2020.09.012
106. Zhang K, Guo Y, Wang ZX, Ding JM, Yao S, Chen H, et al. Causally associations of blood lipids levels with COVID-19 risk: Mendelian randomization study. medRxiv. (2020) doi: 10.21203/rs.3.rs-86425/v1
107. Willette AA, Willette SA, Wang Q, Pappas C, Klinedinst BS, Le S, et al. Using machine learning to predict COVID-19 infection and severity risk among 4,510 aged adults: a UK Biobank cohort study. medRxiv. (2021) doi: 10.1101/2020.06.09.20127092
108. Rozenfeld Y, Beam J, Maier H, Haggerson W, Boudreau K, Carlson J, et al. A model of disparities: risk factors associated with COVID-19 infection. Int J Equity Health. (2020) 19:1–10. doi: 10.1186/s12939-020-01242-z
109. Yasmin F, Najeeb H, Asghar MS, Ullah I, Islam SMS. Increased COVID-19 infection risk, COVID-19 vaccine inaccessibility, and unacceptability: worrisome trio for patients with substance abuse disorders. J Glob Health. (2021) 11:3106. doi: 10.7189/jogh.11.03106
110. Fatima Y, Bucks RS, Mamun AA, Skinner I, Rosenzweig I, Leschziner G, et al. Shift work is associated with increased risk of COVID-19: findings from the UK Biobank cohort. J Sleep Res. (2021) 30:e13326. doi: 10.2139/ssrn.3684452
111. Ashrafian H, Darzi A. Transforming health policy through machine learning. PLoS Med. (2018) 15:e1002692. doi: 10.1371/journal.pmed.1002692
112. Macarayan EK, Balabanova D, Gotsadze G. Assessing the field of health policy and systems research using symposium abstract submissions and machine learning techniques. Health Policy Plan. (2019) 34:721–31. doi: 10.1093/heapol/czz086
113. Peiffer-Smadja N, Rawson TM, Ahmad R, Buchard A, Georgiou P, Lescure FX, et al. Machine learning for clinical decision support in infectious diseases: a narrative review of current applications. Clin Microbiol Infect. (2020) 26:584–95. doi: 10.1016/j.cmi.2019.09.009
114. Jain K. Artificial intelligence applications in handling the infectious diseases. Primary Health Care. (2020) 10:1–3. doi: 10.35248/2167-1079.20.10.351
115. Hay SI, George DB, Moyes CL, Brownstein JS. Big data opportunities for global infectious disease surveillance. PLoS Med. (2013) 10:e1001413. doi: 10.1371/journal.pmed.1001413
116. Apolinardo-Arzube O, García-Díaz JA, Medina-Moreira J, Luna-Aveiga H, Valencia-García R. Evaluating information-retrieval models and machine-learning classifiers for measuring the social perception towards infectious diseases. Appl Sci. (2019) 9:2858. doi: 10.3390/app9142858
117. Willem L, Stijven S, Vladislavleva E, Broeckhove J, Beutels P, Hens N. Active learning to understand infectious disease models and improve policy making. PLoS Comput Biol. (2014) 10:e1003563. doi: 10.1371/journal.pcbi.1003563
118. Dandekar R, Barbastathis G. Quantifying the effect of quarantine control in Covid-19 infectious spread using machine learning. medRxiv. (2020) doi: 10.1101/2020.04.03.20052084
119. Alahmadi A, Belet S, Black A, Cromer D, Flegg JA, House T, et al. Influencing public health policy with data-informed mathematical models of infectious diseases: recent developments and new challenges. Epidemics. (2020) 32:100393. doi: 10.1016/j.epidem.2020.100393
120. Robison HM, Chapman CA, Zhou H, Erskine CL, Theel E, Peikert T, et al. Risk assessment of latent tuberculosis infection through a multiplexed cytokine biosensor assay and machine learning feature selection. Sci Rep. (2021) 11:1–10. doi: 10.1038/s41598-021-99754-3
121. Akhtar M, Kraemer MU, Gardner LM. A dynamic neural network model for predicting risk of Zika in real time. BMC Med. (2019) 17:1–16. doi: 10.1186/s12916-019-1389-3
122. Manivannan P, Devi PI. Dengue fever prediction using K-means clustering algorithm. In: 2017 IEEE International Conference on Intelligent Techniques in Control, Optimization and Signal Processing (INCOS). Srivilliputtur: IEEE (2017). p. 1–5.
123. Sen C, Hartvigsen T, Rundensteiner E, Claypool K. Crest-risk prediction for clostridium difficile infection using multimodal data mining. In: Joint European Conference on Machine Learning and Knowledge Discovery in Databases. Macedonia: Springer (2017). p. 52–63.
124. Feller DJ, Zucker J, Yin MT, Gordon P, Elhadad N. Using clinical notes and natural language processing for automated HIV risk assessment. J Acquir Immune Defic Syndr. (2018) 77:160. doi: 10.1097/QAI.0000000000001580
125. Sun CL, Zuccarelli E, El Ghali AZ, Lee J, Muller J, Scott KM, et al. Predicting coronavirus disease 2019 infection risk and related risk drivers in nursing homes: a machine learning approach. J Am Med Dir Assoc. (2020) 21:1533–8. doi: 10.1016/j.jamda.2020.08.030
Keywords: COVID-19, machine learning, feature selection, imbalanced data, predictive model
Citation: Ramírez-del Real T, Martínez-García M, Márquez MF, López-Trejo L, Gutiérrez-Esparza G and Hernández-Lemus E (2022) Individual Factors Associated With COVID-19 Infection: A Machine Learning Study. Front. Public Health 10:912099. doi: 10.3389/fpubh.2022.912099
Received: 04 April 2022; Accepted: 24 May 2022;
Published: 30 June 2022.
Edited by:
Reza Lashgari, Shahid Beheshti University, IranReviewed by:
Daniel Huson, University of Tübingen, GermanyWenhuan Zeng, Institute for Bioinformatics and Medical Informatics, University of Tuebingen, Germany, in collaboration with reviewer DH
Abdul Rehman Javed, Air University, Pakistan
Copyright © 2022 Ramírez-del Real, Martínez-García, Márquez, López-Trejo, Gutiérrez-Esparza and Hernández-Lemus. This is an open-access article distributed under the terms of the Creative Commons Attribution License (CC BY). The use, distribution or reproduction in other forums is permitted, provided the original author(s) and the copyright owner(s) are credited and that the original publication in this journal is cited, in accordance with accepted academic practice. No use, distribution or reproduction is permitted which does not comply with these terms.
*Correspondence: Guadalupe Gutiérrez-Esparza, Z2d1dGllcnJlemVAY29uYWN5dC5teA==; Enrique Hernández-Lemus, ZWhlcm5hbmRlekBpbm1lZ2VuLmdvYi5teA==