 Mazrura Sahani1
 Hidayatulfathi Othman1
 Soo Chen Kwan1
 Liew Juneng2
 Mohd Faiz Ibrahim3
 Rozita Hod3
 Zul'Izzat Ikhwan Zaini4
 Maizatun Mustafa5
 Issmail Nnafie6
 Lai Che Ching7
 Ramzah Dambul7
 Helena Varkkey8
 Vera Ling Hui Phung9
 Siti Nur Hanis Mamood1
 Norhafizah Karim1
 Nur Faizah Abu Bakar10
 Muhammad Ikram A. Wahab1
 Siti Shahara Zulfakar1
 Yanti Rosli1*
- 1Center for Toxicology and Health Risk Studies (CORE), Faculty of Health Sciences, Universiti Kebangsaan Malaysia, Kuala Lumpur, Malaysia
- 2Centre for Earth Sciences and Environment, Faculty of Science and Technology, Universiti Kebangsaan Malaysia, Selangor, Malaysia
- 3Department of Community Health, Faculty of Medicine, Universiti Kebangsaan Malaysia, Kuala Lumpur, Malaysia
- 4Faculty of Health Sciences, Universiti Teknologi Mara, Penang Branch, Pulau Pinang, Malaysia
- 5Legal Practice Department, Ahmad Ibrahim Kulliyyah of Laws, International Islamic University, Kuala Lumpur, Malaysia
- 6Climate and Environment, UNICEF Malaysia, Putrajaya, Malaysia
- 7Faculty of Humanities, Arts and Heritage, Universiti Malaysia Sabah, Kota Kinabalu, Malaysia
- 8Department of International and Strategic Studies, Universiti Malaya, Kuala Lumpur, Malaysia
- 9Center for Climate Change Adaptation, National Institute for Environmental Studies (NIES), Tsukuba, Japan
- 10Center for Diagnostic Therapeautic and Investigative Studies (CODTIS), Faculty of Health Sciences, Universiti Kebangsaan Malaysia, Kuala Lumpur, Malaysia
The impacts of climate change and degradation are increasingly felt in Malaysia. While everyone is vulnerable to these impacts, the health and wellbeing of children are disproportionately affected. We carried out a study composed of two major components. The first component is an environmental epidemiology study comprised of three sub-studies: (i) a global climate model (GCM) simulating specific health-sector climate indices; (ii) a time-series study to estimate the risk of childhood respiratory disease attributable to ambient air pollution; and (iii) a case-crossover study to identify the association between haze and under-five mortality in Malaysia. The GCM found that Malaysia has been experiencing increasing rainfall intensity over the years, leading to increased incidences of other weather-related events. The time-series study revealed that air quality has worsened, while air pollution and haze have been linked to an increased risk of hospitalization for respiratory diseases among children. Although no clear association between haze and under-five mortality was found in the case-crossover study, the lag patterns suggested that health effects could be more acute if haze occurred over a longer duration and at a higher intensity. The second component consists of three community surveys on marginalized children conducted (i) among the island community of Pulau Gaya, Sabah; (ii) among the indigenous Temiar tribe in Pos Kuala Mu, Perak; and (iii) among an urban poor community (B40) in PPR Sg. Bonus, Kuala Lumpur. The community surveys are cross-sectional studies employing a socio-ecological approach using a standardized questionnaire. The community surveys revealed how children adapt to climate change and environmental degradation. An integrated model was established that consolidates our overall research processes and demonstrates the crucial interconnections between environmental challenges exacerbated by climate change. It is recommended that Malaysian schools adopt a climate-smart approach to education to instill awareness of the impending climate change and its cascading impact on children's health from early school age.
Introduction
The United Nations High Commissioner for Refugees (UNHCR) defines a child as “a human being below 18 years under the law applicable to that child” (1). There are currently 2.3 billion people below 18 years old globally (2), accounting for ~30% of the world population (3). In Malaysia, 9.1 million of the total population are children under the age of 18 (4). Climate change is altering the earth's systems in many ways that threaten children's physical and mental wellbeing (5). The global average temperature is already 1°C above pre-industrial times; hence, the likelihood of current children experiencing a world that is on average 1.5, 2 or 3°C above pre-industrial times is significantly higher than that of adults. Climate change poses a significant threat to children's health because children have unique metabolism, behavior, physiology, cognitive and developmental characteristics compared to adults (6, 7).
In Malaysia, rising sea levels and temperatures are causing more floods, less food and water shortages. Additionally, droughts and floods have been linked to increased water pollution and pesticides in food (8). Ambient air quality is sensitive to the effects of climate change and the weather (9, 10). In Malaysia, haze events due to forest and peatland fires have been common, especially during years of intensified dry weather (i.e., induced by the El-Niño phenomenon) (11). These forest and peatland fires (hereafter referred to as wildfires) have contributed to haze events and poor air quality in Malaysia. Climate scientists have predicted that, by 2030, about a quarter of Malaysia's population will be displaced because of climate change.
Despite the many ways climate change impacts children, they are consistently overlooked in the design and content of climate policies and related processes. As UNICEF noted, only 42% of countries' Paris Agreement climate action plans mentioned children or youth (12). This could be due to inadequate evidence guiding policies and plans on the impacts of climate change, as well as environmental pollution and degradation on children's healthy growth, development and socialization. In addition, insufficient attention has been directed to increasing community understanding of the impacts of climate change and environmental degradation on the lives of families and children—particularly those in vulnerable communities—and encouraging environment-friendly values and practices among children and young people. In marginalized communities, climate- and environment-related risks are further exacerbated by poverty, illiteracy and limited access to information. The marginalized groups here include persons with disabilities, youth, women, members of minority groups, indigenous people, internally displaced persons and non-nationals (13). In addition, urban poor communities (based on the country's poverty line income—B40) can also be counted among these marginalized communities, as low family income can increase the impact of climate- and environment-related risks, such as food insecurity and internal displacement.
This study aimed to investigate the impacts of climate change on children in Malaysia, with a special focus on marginalized children in its community-survey component. It is the first exploratory study in Malaysia with children as the focus of actions aimed at mitigating climate change and environmental degradation. This paper describes the methods and major findings of the research project, which consists of two main components: an environmental epidemiology study (on climate, air pollution and haze) and community surveys conducted in three geographically different locations in Malaysia (i.e., Pulau Gaya, Sabah; Pos Kuala Mu, Perak; and Kuala Lumpur; Figure 1).
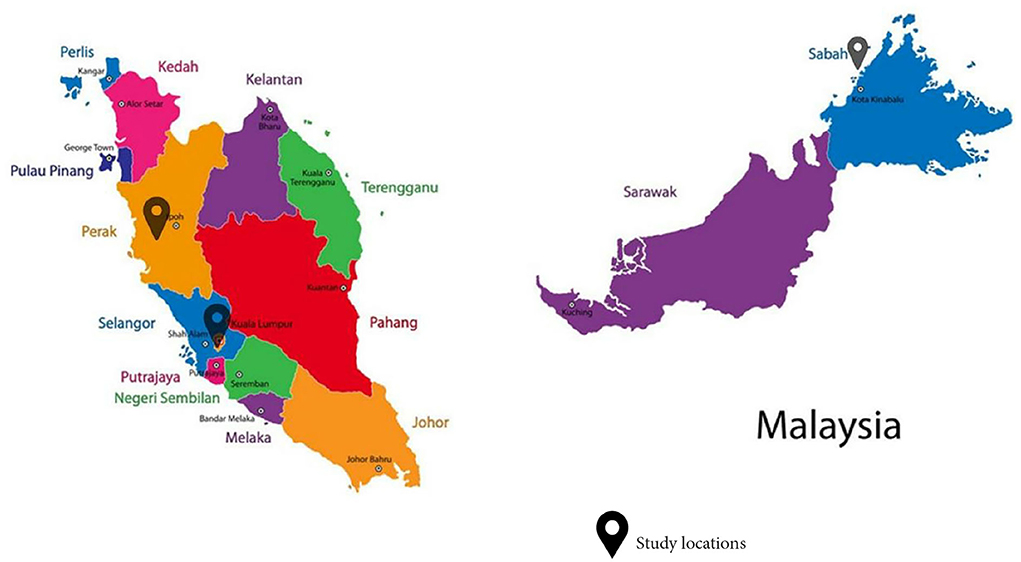
Figure 1. Map of study locations.
Method
Specific health sector climate indices from regional climate model downscaling
This study provides physical evidence of climate change in Malaysia over the last two decades.
To this end, using a dynamic downscaling technique (14, 15), we refitted a regional climate model with data from two regions of Malaysia: Kuala Lumpur and Pulau Gaya, Sabah.
Study area
The closest available meteorological station for Pulau Gaya is the Kota Kinabalu Airport station, which is about 5 km away from the study area. For Kuala Lumpur, the data from the meteorological station at Subang Airport was used. The Malaysian Meteorological Department maintains both stations.
Data analysis
Data was sent to the World Meteorological Organization's Global Telecommunication System and made available at the NOAA's National Climatic Data Center (NCDC) website (https://data.noaa.gov/dataset/dataset/global-surface-summary-of-the-day-gsod) as the global surface summary of the day data sets (GSOD) (16). Data was available in daily resolution. In the current study, the variables obtained and used included the maximum temperature (TX), minimum temperature (TN) and precipitation (PREC). For the Kota Kinabalu Airport station, data was available from 1976 to 2019—spanning 44 years—while the data from Subang Airport station started in 1997. Projection simulations based on Representative Concentration Pathways (RCPs) (i.e., RCP45 and RCP8.5) from a subset of the CORDEX-SEA experiment were used to assess future climate changes. Data was available at a 25 km × 25 km grid resolution and downscaled from CMIP5 GCMs. Downscaled data from two GCMs (i.e., CNRM-CM5 and HadGEM2-ES) using the RCM RCA4 were used. Details on the CORDEX-SEA simulation experiment can be found in Tangang et al. (17) and Malaysia (14).
In the current study, the focus of the assessment was based on health sector-specific climate indices as depicted in Table 1. These indices are identified by the Expert Team on Sector-Specific Climate Indices (ET-SCI). For each year, the climate indices defined in Table 1 are computed separately to form the annual time series. These selected indices are considered proxies of the relevant hazards associated with climate extremes relevant to public health sectors and were computed from the CORDEX-SEA simulated daily meteorological variables:
a) The maximum near-surface air temperature;
b) The minimum near-surface air temperature; and
c) The precipitation of the grids (25 km × 25 km) containing the Kota Kinabalu Airport station.
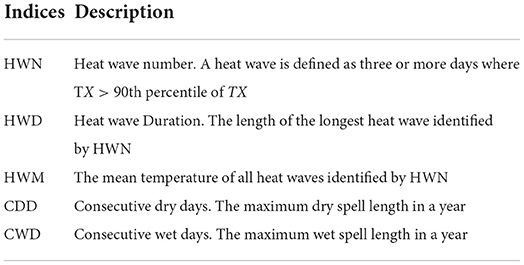
Table 1. Health sector-related climate indices examined.
Future changes in these indices were calculated as the relative changes between the future values and the historical (1986–2005) reference values from the regional climate model's output. The future periods are divided into three 30-year epochs. The early twenty-first-century span a period from 2011 to 2040, the mid-twenty-first century from 2041 to 2070 and the end of twenty-first century from 2071 to 2100.
Association between air pollution and childhood respiratory admissions: A time-series analysis in Sarawak and Kuala Lumpur, Malaysia
The second environmental epidemiological study estimates the risk of childhood respiratory diseases attributable to ambient air pollution in Asia using time-series analyses. This study was conducted in two Malaysian urban areas (Klang Valley and Kuching). The two areas were chosen due to their high levels of ambient air pollution due to urbanization and transboundary haze.
Study area
Klang Valley is a Malaysian urban area centered around Kuala Lumpur and encompassing cities and towns in Selangor and Putrajaya. Klang Valley is the most populous city in Malaysia and the country's industrial and commercial hub, with ~8 million inhabitants. Meanwhile, Kuching is Sarawak's (a state in East Malaysia) capital and the most populous city. The city is located at the southwest tip of Borneo and has a population of ~325,000 people. Kuching's main industrial sectors are agriculture and forestry. This study included children below 18 years of age from Klang Valley and Kuching. It is assumed in this study that sick children were transported immediately from their homes to the nearest hospitals.
Exposure assessment
We used data provided by the Department of Environment (DOE) Malaysia's Continuous Ambient Air Quality Monitoring Station (CAAQMS) on the daily ambient air pollution data, including measurements of average 24-h PM10, SO2, NO2, CO and O3 concentrations between 1 January 2010 and 31 December 2018. Data on children aged 0–17 years hospitalized for respiratory diseases (ICD10: J00-J99) were obtained from two primary sources: the Malaysian Health Data Warehouse (MyHDW), derived from all Ministry of Health (MOH) hospitals in Malaysia, and an electronic database of Hospital Canselor Tuanku Mizan, a teaching hospital in Kuala Lumpur. A total of 17 hospitals in Klang Valley and Sarawak were included. Demographic information (including age and gender) was also obtained from the MyHDW.
Data analysis
Poisson regression in a single- and multiple-pollutant generalized linear model (GLM) with a log function was used in this study to estimate the relationship between pollutants and hospital admissions on various lag days. These models were used to regress the dependent variable—the daily number of hospital admissions—on the independent variables (pollutant concentrations). The covariates were the time variable (day), the daily mean temperature, the relative humidity, a holiday indicator and the day of the week. The Poisson models incorporated natural cubic spline functions to account for long-term seasonality patterns in daily hospital admissions as well as other time-varying covariates that could confound the relationship between air pollution and hospital admission. The procedure began with developing the basic core model, which was then adjusted for seasonality, trends and potential confounders. The basic core model was constructed separately for each group (total hospital admissions, boys, girls, under 5 years, 5–9 years and 10–17 years). The quasi-Akaike information criterion (qAIC) was used during the GLM application to determine the number of degrees of freedom (df) for a time in the core model. Based on previous studies, a natural cubic spline of 3 df per year was used for the temporal trends, temperatures and humidity for all groups (18, 19). The Poisson regression estimated the excess risk (ER) effects of a 10-unit (10 μg/m3) increase in air pollutants over a 7-day lag period. The ER per 10 μg/m3 increment of each pollutant (except CO, where the ER was per 1 mg/m3) was calculated as ER = (RR – 1) × 100. This study used a simple GLM regression over a 7-day lag period. All statistical analyses were performed using the R Studio version 1.2.5033 with the “mgcv” and “splines” packages (20).
Case-crossover study: Assessing the health effects of wildfire haze among children in Malaysia
The third study applied a case-crossover design to examine the association between haze and under-five mortality in Malaysia (21). The study highlighted the need to consider different aspects of haze exposure assessments, namely duration, intensity and time lags. This adds to the limited number of epidemiological studies that have conducted exposure assessments of haze via binary or categorical variables that are derived from particulate matter (PM) concentrations (22), the Pollutant Standards Index (23), visibility (24), intensity (25) and duration (25, 26).
Study area and data sources
This study included 12 districts in Malaysia during the time period of 2014–2016. The study areas were selected based on the population size (>500,000) and the availability of monitoring stations. The 12 districts that fulfilled the criteria were Kuala Muda, Timur Laut, Kinta, Kuala Lumpur, Klang, Petaling, Melaka Tengah, Johor Bahru, Seremban, Kuantan, Kota Bharu and Kuching. The data for under-five mortality were provided by the Family Health Development Division, MOH Malaysia. Only mortality from natural causes (ICD-10: A00-R99) was included in the analysis part of this study. Using a bootstrap with 10,000 simulations, the empirical under-five mortality rate was 8.2 (95% CI 7.9, 8.5) per 1,000 live births per year.
The environmental data (air pollutants and weather) were provided by the Air Quality Division, DOE Malaysia. For air pollutant data, the data from the monitoring station in the district was used. As weather data was available at all monitoring stations, the temperature and relative humidity (RH) data was averaged from the monitoring stations over the whole state of each district.
Exposure assessment
Binary indicators of haze days were derived via a combination of duration and intensity. The intensity was determined by the PM10 concentration. Four levels of intensity were considered: (i) Intensity-1 (PM10 > 50 μg/m3), (ii) Intensity-2 (PM10 > 75 μg/m3), (iii) Intensity-3 (PM10 > 100 μg/m3) and (iv) Intensity-4 (PM10 > 150 μg/m3). These intensity levels were based on several air quality standards for PM10 (21), including the WHO Air Quality Guidelines (50 μg/m3), Malaysia New Ambient Air Quality Standards (AAQS) of 2020 (100 μg/m3) and the Malaysia AAQS during the study period (2015) (150 μg/m3). Additionally, an intermediate level (75 μg/m3) between the Malaysia New AAQS and WHO guidelines was included. Besides the intensity criterion, three durations were considered based on the number of successive days with PM10 > 50 μg/m3: (i) Duration-1 (PM10 > 50 μg/m3 for 1 day), (ii) Duration-2 (PM10 > 50 μg/m3 for two consecutive days) and (iii) Duration-3 (PM10 > 50 μg/m3 for > three consecutive days). For each haze binary indicator defined by the combination of intensity and duration, lagged effects of up to 7 days were examined.
Data analysis
A time-stratified case-crossover method was applied to explore the association between haze and under-five mortality. This method allows for adjustments for seasonal patterns and long-term trends through its design (27). A generalized additive regression model with a Poisson distribution was applied, adjusting for temperature and RH in the model. Each case was matched with a stratum of days of the week in the same month and year. The districts were treated as random effects in the model. Additionally, indicators of influenza were adjusted for in the sensitivity analysis. The data on influenza in Malaysia were obtained from FluNet (28), the Global Influenza Surveillance and Response System of the WHO. The results of this study were reported as an odds ratio (OR) with a 95% confidence interval (95% CI). All statistical analyses were conducted using the R statistical software (29).
Community surveys
Study locations
The community surveys were conducted in three distinct locations: Pulau Gaya of Sabah (6°1.0798′N 116°1.7909′E); Pos Kuala Mu, Sungai Siput (U), Perak (4°50.2499′N 101°20.0445′E); and People's Housing Project (PPR) Sungai Bonus, Setapak, Kuala Lumpur (3°11.1778′N 101°43.3215′E). The populations in all three locations consist of marginalized communities: documented and undocumented Bajau groups in Pulau Gaya, Sabah; Temiar indigenous people (Orang Asli) in Sungai Siput (U), Perak; and urban poor families in PPR Sungai Bonus, Kuala Lumpur. These three communities live in three distinct geographical settings: an island, a mountainous region and a city at a confluence of the Klang and Gombak Rivers in a vast valley bordered by a few mountain ranges, respectively. These areas were chosen as locations for the community surveys to demonstrate the climate patterns and trends of climate change and environmental degradation as well as the degree of behavioral changes in children living in these particular areas.
Study design
A cross-sectional survey was conducted in these communities.
Instrument
A set of standardized questionnaires was developed to gather information on related topics in the three study locations (Appendix 1 in Supplementary material). These questionnaires consisted of six sections regarding the respondent's (i) socio-demographical profile; (ii) health status related to diseases, wellbeing and hygiene; (iii) family socio-economical background and living conditions; (iv) accessibility and mobility; (v) perceived impact of climate change and environmental degradation; and (vi) coping mechanism employed due to the climate change and environmental degradation. A six-point Likert scale ranging from 0 = Not Sure, 1 = Strongly Disagree, to 5 = Strongly Agree was used for all questions related to the respondent's perceptions. The questionnaire was pre-tested at the first study location and then adopted at the remaining two locations. Expert reviews were gathered for face and content validity. These experts were given a validation form that contained all the questions for community surveys and were asked to rate items based on their relevancy and clarity using four points: [1 (not relevant), 2 (somewhat relevant), 3 (quite relevant) and 4 (highly relevant)]. Scale-level CVI using Universal Agreement among experts (S-CVI/UA) was calculated. The scale for each item was dichotomised by combining values 3 and 4 together as relevant and values 1 and 2 together as not relevant. In S-CVI/UA, the number of items considered relevant is divided by the total number of items. The S-CVI/UA for relevancy and clarity of the questionnaire was 1.0 (30). As for reliability, Cronbach's alpha value for internal consistency was 0.673, which indicates an acceptable level of reliability (31).
Data collection and sample size
The study population was informed by the head of the community and their teachers about the study before the data collection activities. The community surveys were conducted in selected community settings and carried out during different periods from August to December 2020 (Table 2). The sampling method carried out was purposive sampling; however, due to the enforcement of the Movement Control Order by the Malaysian government to curb the COVID-19 pandemic, the number of respondents was restricted. Total respondents for each study location were 200, 196 and 62 in Pulau Gaya, Pos Kuala Mu and PPR Sungai Bonus, respectively.
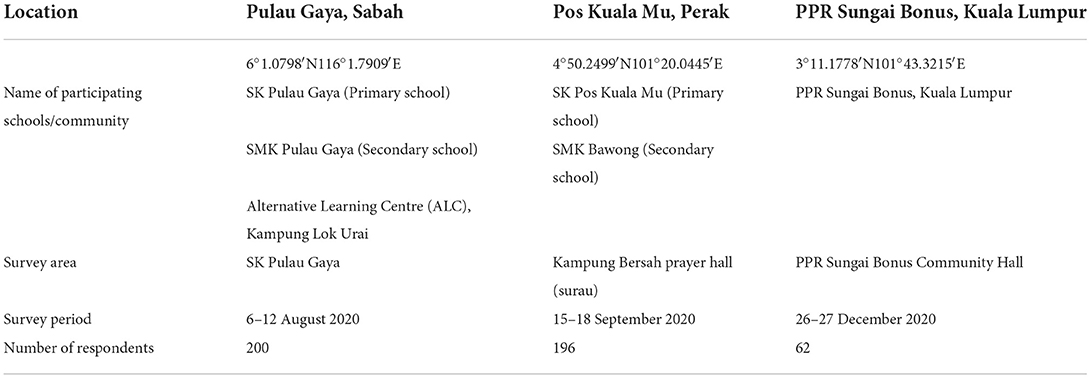
Table 2. Details of participants in the community surveys.
Inclusion and exclusion criteria
A self-administered technique with minimum guidance was adopted for questionnaire data collection during the surveys. The inclusion criteria for participants were children aged 6–18 years old, parental consent and being physically healthy. Respondents who were absent during the data collection were excluded from the study.
Statistical analysis
Data was entered and analyzed using the IBM SPSS version 23 software. Data cleaning was conducted before analysis to avoid any incorrect or duplicate data that may affect the analysis. Descriptive data using percentage and frequency were used to represent responses for categorical data in the three locations related to respondents' demographics: health status, wellbeing and hygiene, socio-economic and living conditions, and accessibility and mobility to basic amenities. The exploratory factor analysis through the principal component analysis (PCA) method was used on the 41 perceptions statements related to respondents' perceptions to study how the study locations uniquely generate their own indicators. The factor analysis provided correlations between the statements and components—known as factor loadings. Certain statements generated more than one-factor loading—known as cross-loadings, which simultaneously measure more than one component. To overcome this, the factor loading was rotated and redistributed to ensure that each statement measured only one component. Statements with a factor loading of < 0.6 were omitted from the component. The interpretation of the components was addressed as an indicator in this study, and each location generated its own group of indicators with a different set of statements based on the respondents' responses.
Results
Specific health sector climate indices from regional climate model downscaling
Annual time series of maximum dry and wet spells identified from the daily rainfall data collected at Kota Kinabalu Airport from 1976 to 2019 showed that the dry spell length over the study area has reduced over the past four decades, while the wet spell length has increased over time. Based on the heatwave definition as per Table 1, heatwave events were not recorded until the early 2000s.
Figure 2 shows the projected changes in terms of heatwave number, duration and magnitude for the three different epochs. The ranges of bars are the projected ranges of the changes. The heatwave number was projected to increase dramatically in the future. The likelihood of heatwave occurrences was projected to be three to seven times higher compared to the historical period. Changes in magnitude could be 1–1.8°C greater than the historical period (Figure 2).
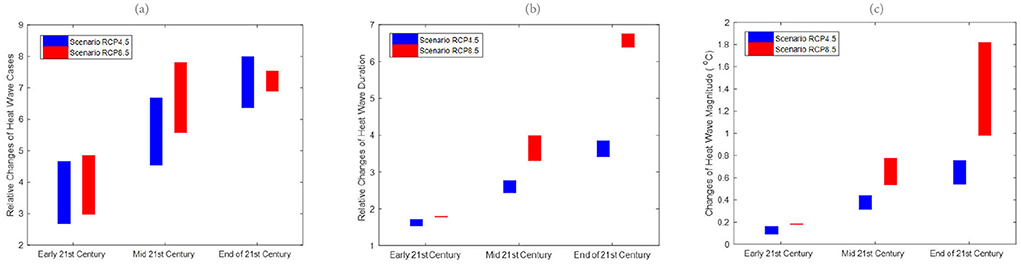
Figure 2. Relative changes of future (a) heat wave number, (HWN) (b) duration (HWD), and (c) magnitude (HWM) for the early 21st century, mid-21st century and end of 21st century for both RCP4.5 and RCP8.5 downscaled projections to historical period (1976–2005) at Kota Kinabalu.
Similar to Kota Kinabalu, the heatwave number in Subang was projected to increase dramatically in the future, indicating an increased risk of extreme heating issues in temperature-sensitive socio-economic sectors (Figure 3). Overall, the increasing wet spell length in RCP8.5 suggests the likelihood that wet spells will continue to lengthen in the future (Figure 4). Like Kota Kinabalu, the projection of rainfall-associated indices at Subang is rather noisy and uncertain in the future (Figures 4, 5). As mentioned earlier, rainfall can be a non-linear response to the different degrees of emissions and radiative forcings.

Figure 3. Relative changes of future (a) heat wave number (HWN), (b) duration (HWD), and (c) magnitude (HWM) for the early 21st century, mid-21st century and end of 21st century for both RCP4.5 and RCP8.5 downscaled projections to historical period (1976–2005) at Subang.
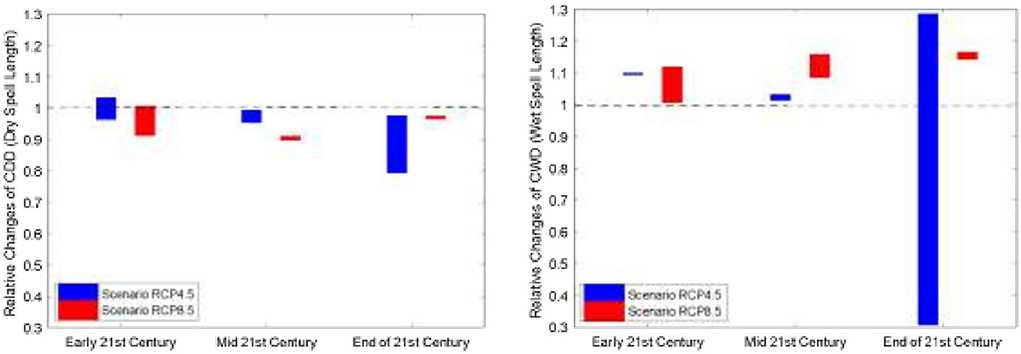
Figure 4. Relative changes of dry spells (left panel) and wet spells (right panel) for the early 21st century (2011–2040), mid-21st century (2041–2070) and end of 21stcentury (2071–2100) for both RCP4.5 and RCP8.5 downscaled projection at Kota Kinabalu. The dotted line indicates no changes between the future and the historical period.
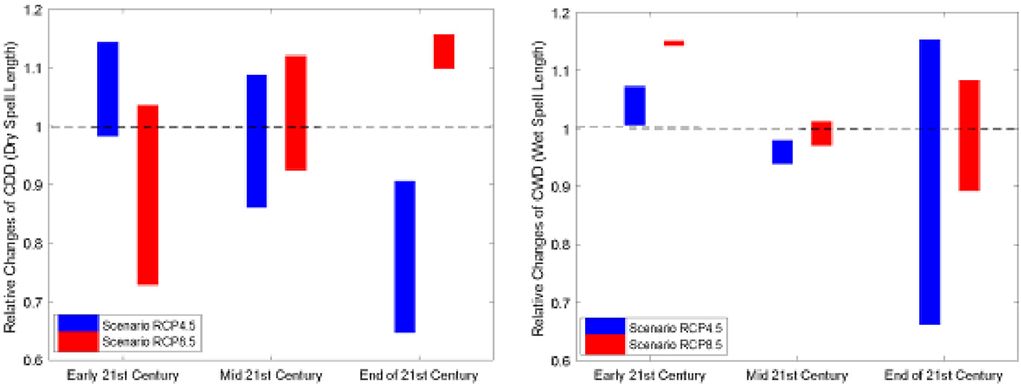
Figure 5. Relative changes of dry spells (left panel) and wet spells (right panel) for the early 21st century (2011–2040), mid-21st century (2041–2070) and end of 21st century (2071–2100) for both RCP4.5 and RCP8.5 downscaled projection at Subang. The dotted line indicates no changes between the future and the historical period.
Association between air pollution and childhood respiratory admissions: A time-series analysis in Sarawak and Kuala Lumpur, Malaysia
Table 3 summarizes the descriptive analysis of hospital admissions for respiratory diseases among children and the environmental parameters in Klang Valley and Kuching. From 1 January 2010 to 31 December 2018, Klang Valley had 179,699 hospital admissions for childhood respiratory diseases. Of all the children hospitalized for respiratory diseases, 57.8% were boys and 42.2% were girls. According to the age group, there were 77.7% of children aged 0–4 years, 15.4% of children aged 5–9 years and 6.9% of children aged 10–17 years. Meanwhile, 32,373 children were hospitalized in Kuching for respiratory diseases. In Kuching, of all the children hospitalized for respiratory diseases, 59.9% were boys and 40.1% were girls. About 80.3% of children aged 0–4 years, 14.3% of children aged 5–9 years old and 5.3% of children aged 10–17 years were admitted for respiratory diseases in Kuching. The trends in daily hospital admissions for respiratory diseases in both Klang Valley and Kuching showed an increase in respiratory admissions throughout the study period. Our results shown in Figures 6–8 highlight the excess risk (ER) estimates and 95% confidence intervals associated with an increase in pollutant concentration of 10 μg/m3 obtained for each pollutant (only CO the ER was for every 1 mg/m3 increment) and evaluated for 7-day lag effects (lag of 0–7 days).
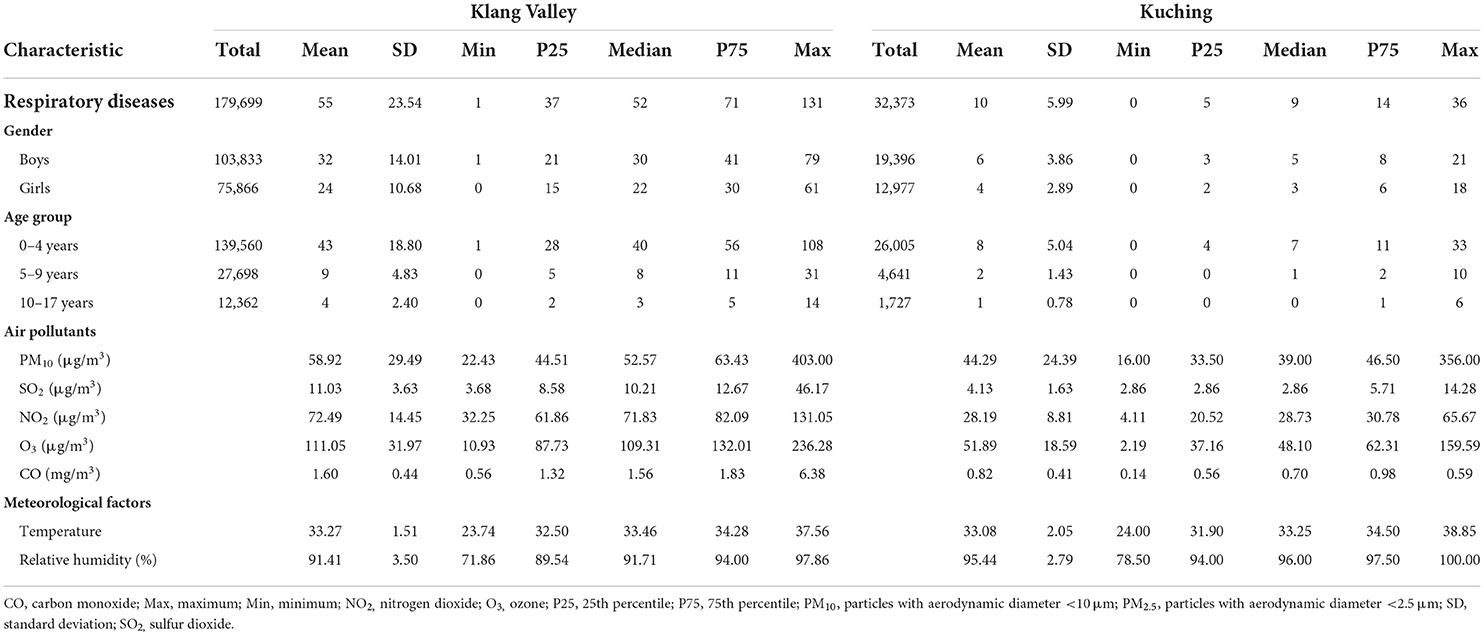
Table 3. Summary statistics of daily hospital admissions for respiratory diseases, air pollutants concentration and meteorological factors in Klang Valley and Kuching from 2010 to 2018.
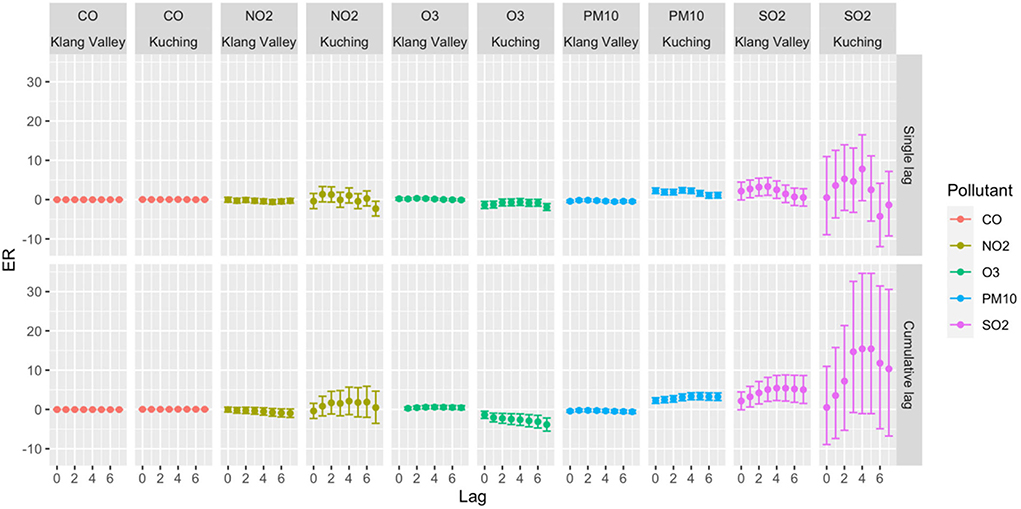
Figure 6. ER with 95% CI of total daily hospital admission with 10 μg/m3 increase of pollutant concentrations in Klang Valley and Kuching for 2010–2018.
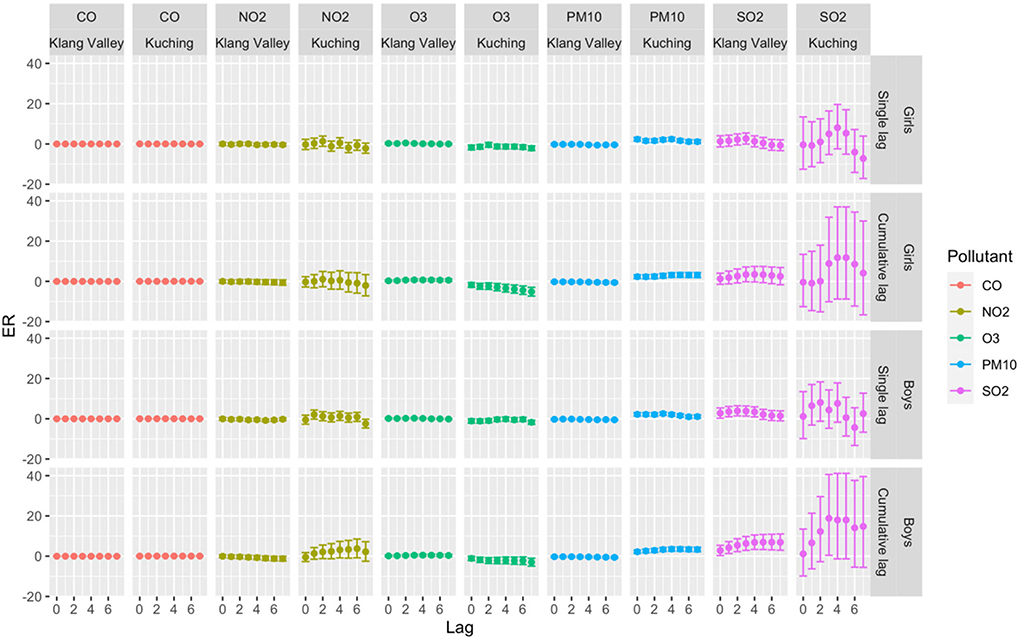
Figure 7. ER with 95% CI of total daily hospital admission by gender with 10 μg/m3 increase of pollutant concentrations in Klang Valley and Kuching for 2010–2018.
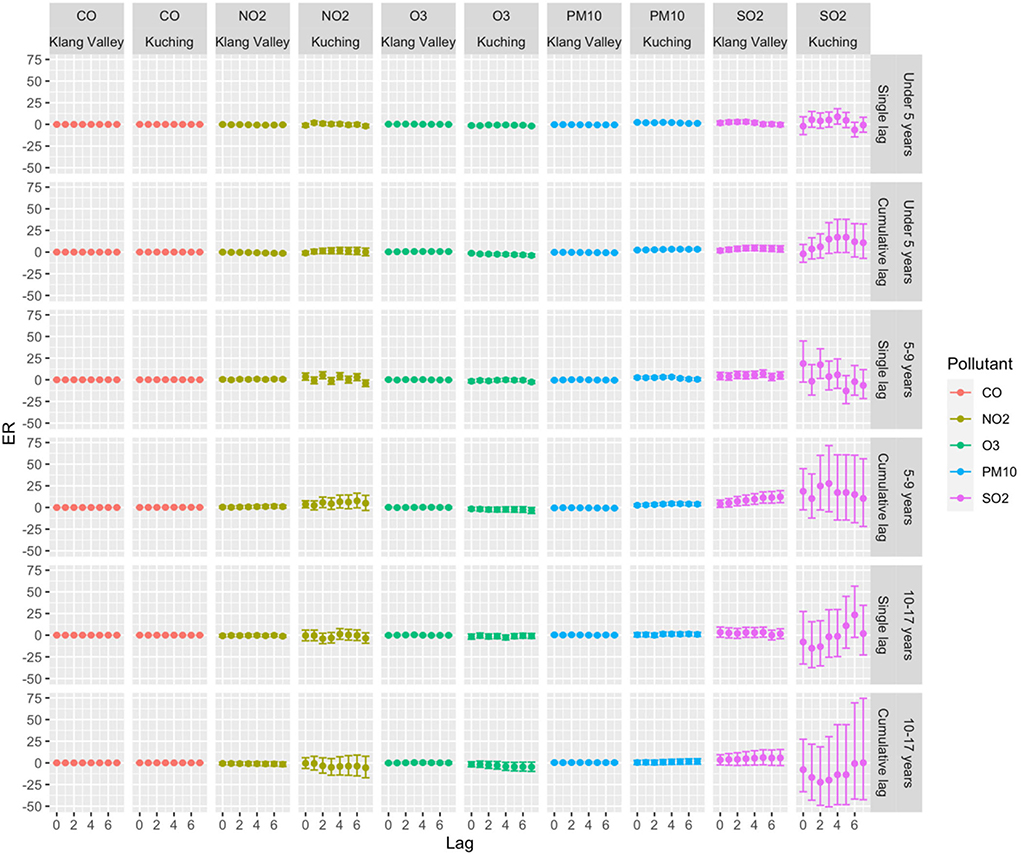
Figure 8. ER with 95% CI of daily hospital admissions by age group with 10 μg/m3 increase of pollutant concentrations in Klang Valley and Kuching for 2010–2018.
Klang Valley (Kuala Lumpur)
For the total hospital admissions in Klang Valley, significant single-lag and average cumulative-lag effects of SO2 and O3 were found (Figure 6). The greatest single-lag effect estimation for SO2 was observed at lag 3 with ER 3.33 (95% CI 1.10–5.60), and for O3, the highest ER was observed at lag 2 with 0.32 (95% CI 0.05–0.59). The highest ERs for cumulative-lag effects were observed at lags 0–5 with 5.41 (95% CI 2.13–8.79) and lags 0–4 with 0.59 (95% CI 0.14–1.04) for SO2 and O3, respectively. In the single-lag effect for the boys, the highest ER was observed for SO2 at lag 2 with ER 3.91 (95% CI 1.42–6.46). The highest ER for girls was observed for O3 at lag 2 with ER 0.48 (95% CI 0.15–0.81). In terms of the cumulative-lag effects for boys, the highest ER was observed at lags 0–5 with 6.97 (95% CI 3.28–10.78) and at lags 0–4 with 0.51 (95% CI 0.01–1.02) for SO2 and O3, respectively. Meanwhile, among the girls, the highest ER for O3 in terms of the cumulative-lag effect was found at lags 0–3 with ER 0.71 (95% CI 0.19–1.24). This study shows that both boys and girls in Klang Valley were susceptible to air pollution.
In terms of age group, statistically significant associations (p < 0.05) were found for children aged 0–9 years, but not for those aged 10–17 years. Age was an effect modifier of respiratory hospital admissions, with young children being more susceptible to SO2. In terms of single-lag effects, the highest association between pollutants and respiratory hospital admissions for the children aged 0–4 years was observed at lag 3 with ER 2.98 (95% CI 0.70–5.31) and lag 2 with ER 0.36 (95% CI 0.08–0.63) for SO2 and O3, respectively. SO2 at lag 5 had the highest single-effect estimation for children aged 5–9 years with 7.09 (95% CI 2.93–11.42). The highest ER was observed in the cumulative lag of 0–4 days for children aged 0–4 years with 4.65 (95% CI 1.44–7.96) and 0.69 (95% CI 0.22–1.16) for SO2 and O3, respectively. Meanwhile, for children aged 5–9 years, the highest ER for SO2 in the cumulative-lag effect was found at lags 0–7 with 12.32 (95% CI 5.56–19.50).
Kuching (Sarawak)
A strong relationship was found between PM10 and hospital admissions for respiratory diseases among children in terms of total hospital admissions (Figure 6). Significant single-lag and cumulative-lag effects for PM10 were observed at all lags. The greatest single-lag effect estimation for the PM10 was found at lag 3 with 2.37 (95% CI 1.67–3.07). The highest ER for cumulative-lag effects was observed at lags 0–5 with 3.37 (95% CI 2.45–4.29). Similar to the findings in Klang Valley, both boys and girls in Kuching were also vulnerable to air pollution (Figure 7). Only PM10 was significantly associated with respiratory admission in both genders. The highest ER was observed for PM10 at lag 3 in the single-lag effect for the boys with ER 2.55(95% CI 1.74–3.37). PM10 had the highest ER for girls at lag 4, with an ER of 2.40. (95% CI 1.50–3.30). The highest ER in cumulative-lag effect for PM10 was observed at lags 0–4 with ER 3.50 (95% CI 2.45–4.55) and at lags 0–5 with ER 3.19 (95% CI 1.99–4.40) for boys and girls, respectively.
Statistically significant associations were discovered for the 0–4-year and 5–9-year age groups, but not for the 10–17-year age group (Figure 8). Children under 5 years old were susceptible to PM10 and SO2. In the single-lag effect, the highest association of PM10 for children aged 0–4 was observed at lag 0 (ER 2.31, 95% CI 1.56–3.07), and SO2 was observed at lag 4 (ER 8.79, 95% CI 0.24–18.07). In the cumulative-lag effects for children aged 0–4 years, the highest ER (3.33) was only found for PM10 at lags 0–5 (95% CI 2.36–4.31). For children aged 5–9 years, the findings showed that the relative magnitude of risk for an association of the pollutants with respiratory hospital admissions followed the descending order of SO2, NO2, PM10 and CO. In the single lag effect, the highest association of each pollutant with hospital admissions was observed for SO2 at lag 2 (ER 17.41, 95% CI 1.50–35.81), NO2 at lag 4 (ER 5.09, 95% CI 1.109.24). PM10 at lag 4 (ER 3.19, 95% CI 1.82–4.58) and CO at lag 4 (ER 0.16, 95% 0.09–0.244).
Case-crossover study: Assessing the health effects of wildfire haze among children in Malaysia
The study by Phung et al. (21) showed no clear association between haze and under-five mortality. A significant positive association was only observed at Duration-3, and Intensity-2 of the “low” category [OR: 1.210 (95% CI 1.000, 1.464)]. The lag patterns revealed that, with longer durations, a higher OR of under-five mortality occurred at shorter lags; though this variation was minimal. The lag patterns at Intensity-2 and Intensity-3 were similar. Districts with “low” exposure (95th percentile of PM10 concentration < 100 mg/m3) were sensitive to haze days defined at Intensity-2, whereas those with “high” exposure showed higher ORs at Intensity-3 and Intensity-4. The ORs of under-five mortality were increased at shorter lags under two conditions: (i) with increasing duration and (ii) with increasing intensity (except for Intensity-4). The OR increase with increasing duration was minimal, whereas it was more observable over increasing intensity.
Community surveys
Table 4 presents the descriptive socio-demographic characteristics of the participants in the three study locations. A majority of the respondents for Pulau Gaya, Pos Kuala Mu and PPR Sungai Bonus were in the 10–14-year-old age group at percentages of 69, 69.4, and 71%, respectively. In Pulau Gaya and Pos Kuala Mu, the majority of the respondents were female (57.5 and 63.3%, respectively), whereas, in PPR Sungai Bonus, the majority were male (53.2%). About 50% of the respondents in Pulau Gaya were currently studying at the Alternative Learning Centre (ALC). Meanwhile, 86.7% of the Pos Kuala Mu respondents were in secondary school, and 51.6% of the respondents in the PPR Sungai Bonus were in primary school during the period of this study.
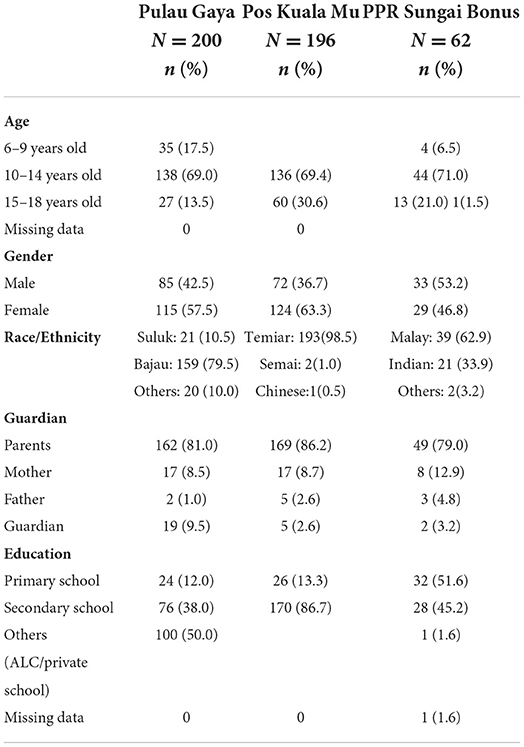
Table 4. Socio-demographic characteristics of participants in the cross-sectional surveys.
The basic amenities available for the respondents as well as their level of accessibility and mobility to the nearest town and health-related information are shown in Table 5. A total of 72% of the respondents from Pulau Gaya did not have access to a treated water supply and relied on seawater instead. Almost all the respondents had access to an electricity supply—either from a private electricity provider or generators. The respondents from Pos Kuala Mu mostly reported using water from the river (70.8%), while 100% of respondents of the PPR reported being supplied with pipe water. In both Pulau Gaya and Pos Kuala Mu, the respondents reported being hindered from going into town (23.5 and 73.5%, respectively) due to weather factors.
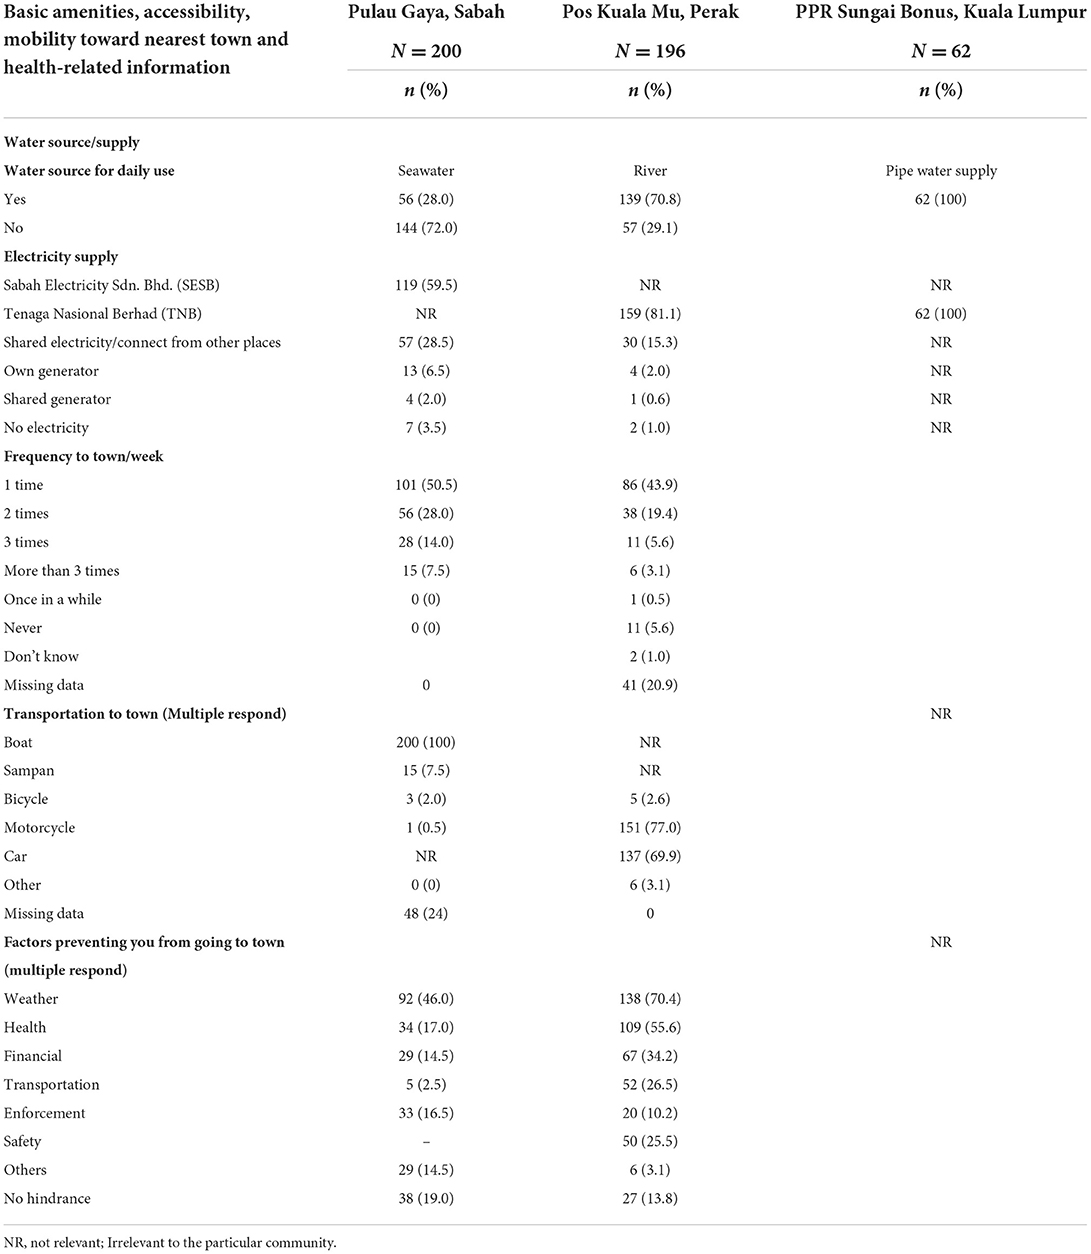
Table 5. Participants basic amenities, accessibility, mobility to town and health-related information.
The indicators on the perceived impact of climate change and environmental degradation and their respective factor loadings for Pulau Gaya, Pos Kuala Mu and PPR Sungai Bonus are shown in Tables 6–8. Table 6 lists seven indicators for Pulau Gaya, six indicators for Pos Kuala Mu and five indicators for the PPR—all with factor loadings of 0.6 up to 0.9. The first four major indicators for children living in Pulau Gaya were socializing ability, climate resilience, access to healthcare services and social support, and citizenship. In Pulau Gaya, the children perceived socializing ability (factor loading: 0.755–0.836) as the first indicator of being treated equally in school despite their gender. They also perceived themselves as being healthy during bad weather and as receiving good social support. Many were of the opinion that those without proper state registration documentation would face difficulties in receiving assistance from government facilities. Finally, the children also felt that their house was not the safest place during stormy weather conditions.
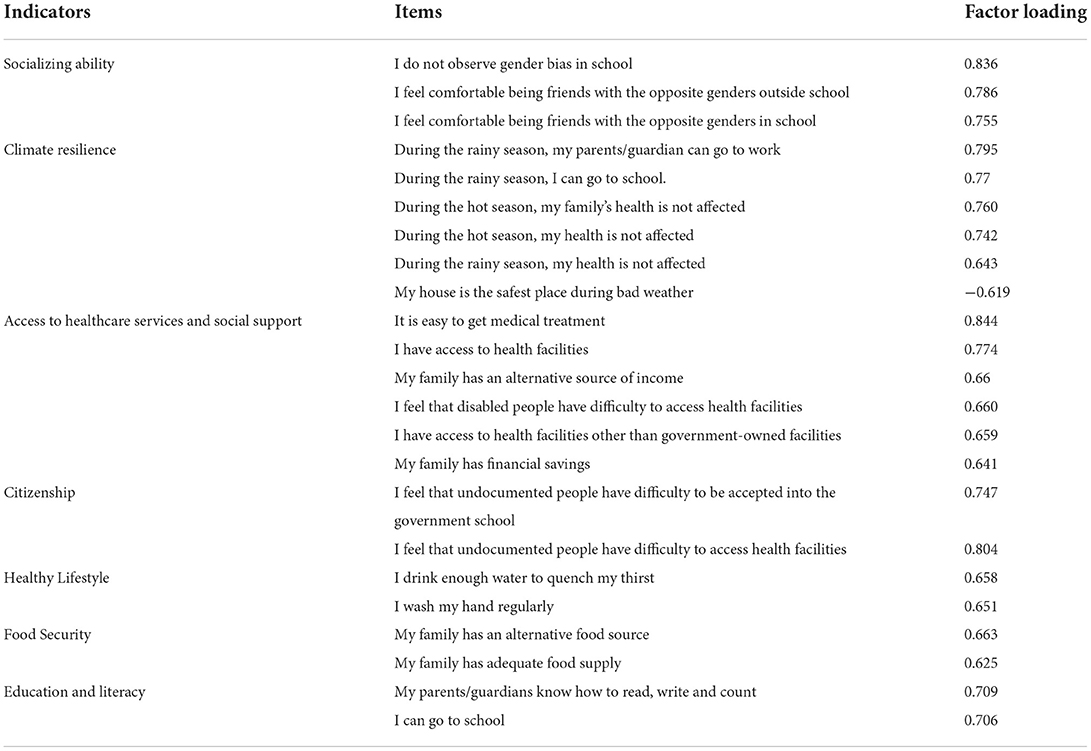
Table 6. Indicators and items with respective factor loadings for Pulau Gaya, Sabah.
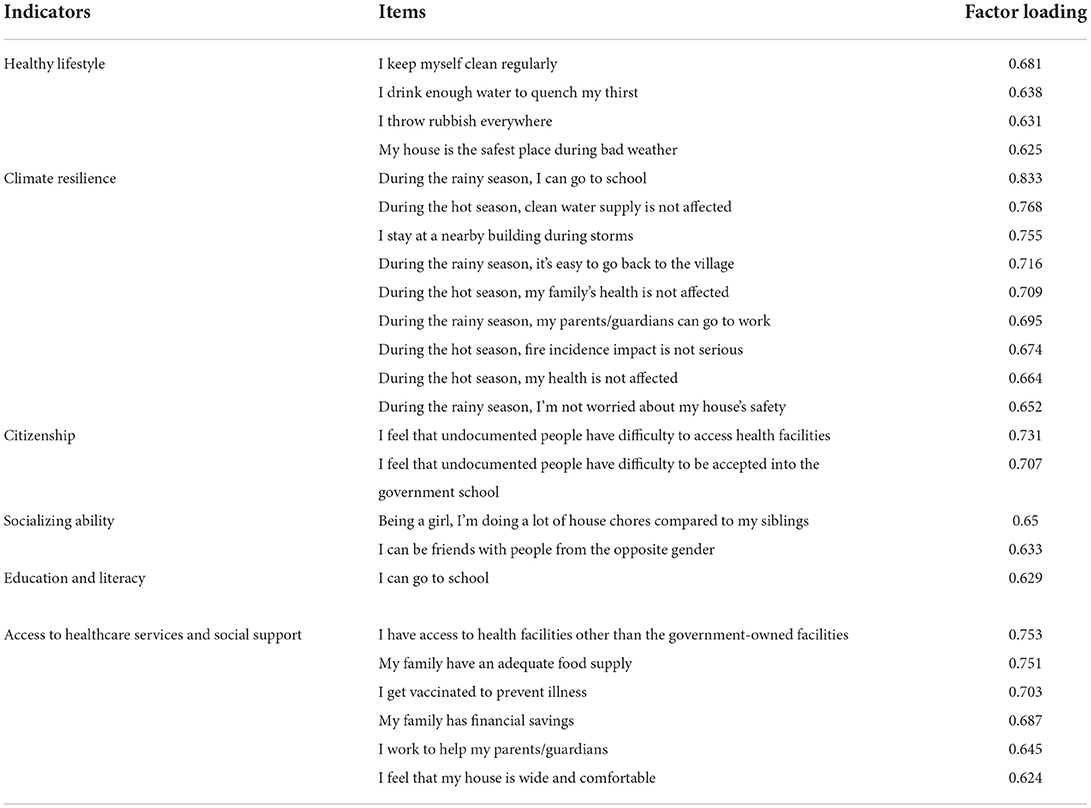
Table 7. Indicators and items with respective factor loadings for Pos Kuala Mu, Perak.
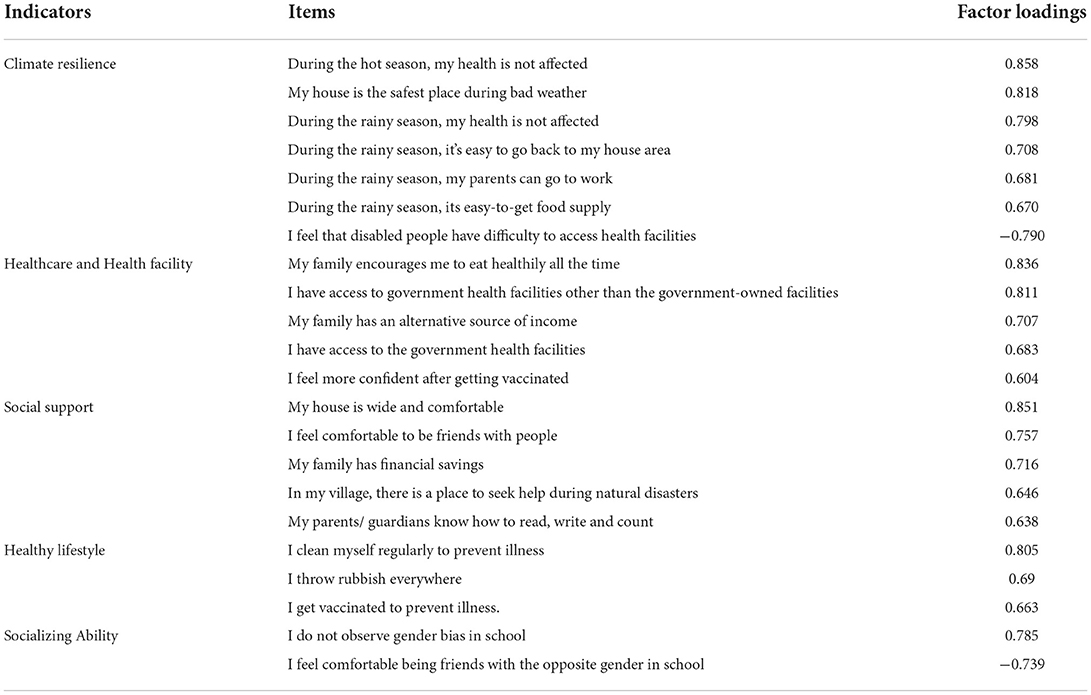
Table 8. Indicators and items with respective factor loadings for PPR Sg Bonus, Kuala Lumpur.
On the other hand, the main indicator for the children's perception of the impact of climate change and environmental degradation based on factor loading for Pos Kuala Mu was climate resilience (factor loading: 0.652–0.833) concerning rain and mobility. During the rainy season, children reported experiencing difficulties in getting to school. On the other hand, they reported little trouble due to heat, since they live at higher altitudes which are much cooler. Another indicator for Pos Kuala Mu was having a healthy lifestyle (factor loading: 0.652–0.681), with personal hygiene perceived as the most important for the children. Similarly, the main indicator for PPR Sungai Bonus is climate resilience (factor loading: 0.670–0.858). There was also a common perception among these students in that they felt uncomfortable in their respective schools—although socializing at school was simultaneously considered a non-issue for them. Based on the results from the climate model, time-series, case-crossover and case studies, we constructed a model showing the short-term and long-term impacts of climatic changes on children (Figure 9).
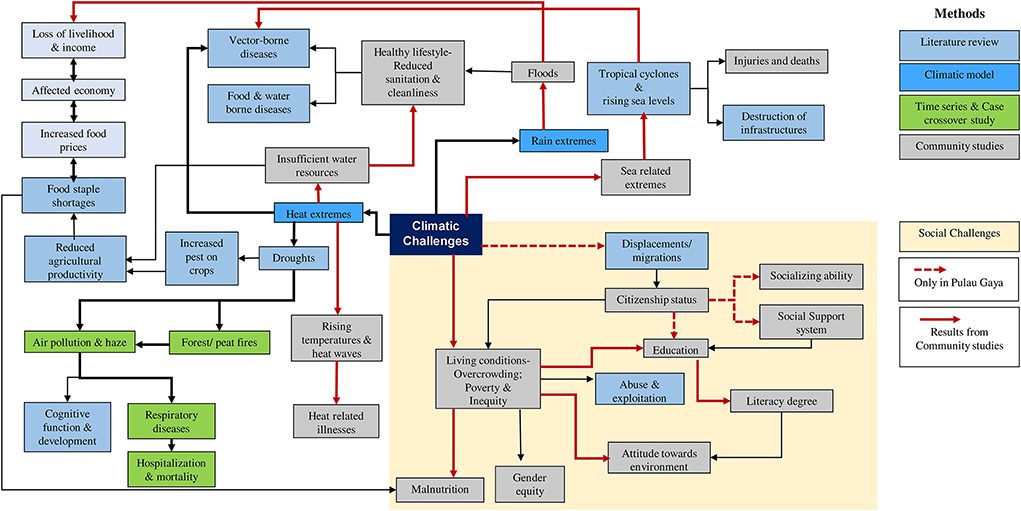
Figure 9. Model of the impacts of climate change on children in Malaysia.
Discussion
Specific health sector climate indices from regional climate model downscaling
As reported in studies from other parts of the world, heat waves have become more frequent in recent decades (32–34). Health-related climatic indices include wet and dry spell lengths as well as heatwave occurrence, duration and magnitude (35). The downscaled projection of future climates based on a subset of CORDEX-SEA (17, 36) simulation outputs suggests a high likelihood of a continual increment of heatwaves in terms of heatwave number, duration and magnitude. The hottest and longest heatwave event ever recorded occurred in 2016 in Southeast Asia during a period of extremely high temperatures in conjunction with the strongest El Niño event extending from 2015 to 2016 (37). In 2016, most of the Southeast Asia Maritime region experienced record-breaking extreme heat events over a period of ~10 days. During this period, the El Nino event contributed to ~49% of global warming; anthropogenic global warming has contributed 29% (38). El Ni1o events have been associated with various disease outbreaks worldwide (39). In Malaysia, El Niño has been associated with heatwave events, haze pollution and related diseases, including the association between heat-related variables and under-five mortality (40) together with cause-specific mortality (41).
In the present study, we report that the heatwave occurrence frequency appeared to be less sensitive to the greenhouse concentration pathways. However, both the duration and magnitude showed considerable dependence on the greenhouse concentration pathways. Duration and magnitude appeared more severe in the higher emissions scenarios. A higher emission scenario (i.e., RCP8.5) is expected to double the duration and magnitude of the heatwave compared to RCP4.5 toward the end of the twenty-first century. On the other hand, rain spell length is projected to increase under the higher emissions scenarios, while future conditions remain very uncertain under the lower emissions scenario (RCP4.5). Dry spell length is projected to become shorter under both the RCP4.5 and RCP8.5 scenarios. Nevertheless, it should be noted that rainfall projections had greater uncertainties and noise levels as compared to the temperature (42). As a corollary, the increased likelihood of extreme heat events under a future warmer climate is also expected to increase the disease burden. Nevertheless, proper quantification of such a specific relationship is challenging due to the nature of impacts from the environmental and climate variabilities that is multifactorial.
Association between air pollution and childhood respiratory admissions: A time-series analysis in Sarawak and Kuala Lumpur, Malaysia
We found that short-term exposure to ambient air pollution increased the risk of the respiratory disease up to 8 days (7-day lag) after exposure. In the Klang Valley, SO2 and O3 were significantly associated with increased respiratory hospital admissions, whereas in Kuching, only PM10 was significantly associated with increased total admissions for respiratory diseases among children. In Klang Valley, SO2 was the most significantly associated pollutant with respiratory hospital admissions, while PM10 was the most significantly associated pollutant in Kuching. This observation was expected due to the urban and dense population of Klang Valley, which would lead to higher levels of SO2, NO2, CO and O3 when compared to Kuching. The high level of PM10 in Kuching is caused by the burning of local biomass and exacerbated by the (almost) annual transboundary haze from Kalimantan, Indonesia (43).
Most of the related research in Asian countries has found SO2 to be linked to an increased number of emergency and outpatient visits for respiratory diseases. In China, every 10 μg/m3 increase in SO2 concentration was found to be associated with an increase in hospital visits for URTI, pneumonia, and upper and lower respiratory tract infections, with ERs of 2.92 [95% CI 1.88–3.97; (44)], 5.00 (95% CI 1.30–8.80) (45) and 15.17 (95% CI 11.29–19.19) (46), respectively. A similar finding was discovered in an Iranian modeling study, which found a significant association between SO2 and acute respiratory diseases at an attributed proportion of 3.65 (95% CI 1.30–5.94) (47).
This study adds to the existing evidence on air pollution and respiratory diseases in children, showing that, despite low levels of SO2 (lower than MAAQS) in Klang Valley, the risk of respiratory hospital admissions with the highest ER for a single-lag effect was 3.33 (95 % CI 1.10–5.60) at lag 3 and the highest ER for a cumulative lag-effect was 5.41 (95 % CI 2.13–8.79) at lag 0–5. The source of SO2 in Klang Valley is most likely industrial activities (48, 49) and power generation (50) from the power plant located in the city. PM10 posed a greater risk to children in Kuching. The lag pattern showed a positive association between PM10 and child respiratory hospitalization, and the effects were higher at shorter lags. This study's findings have strengthened the evidence regarding air pollution and its health effects in Malaysia. Previous case-crossover studies have discovered that respiratory mortality was significantly associated with haze events (PM10 > 10 μg/m3) for all ages at lag 0 (OR 1.19, 95% CI 1.02–1.40) (22). The findings of this study provide evidence that short-term exposure to ambient air pollution increases the risk of hospitalization for respiratory disease in children. Child age was also identified as a moderator of respiratory hospital admissions, with children aged 5–9 years being more vulnerable to ambient air pollution. Compared to the other age group of children, this group (5–9 years) was more susceptible to air pollution because their lungs are in a period of rapid development and they are active and engage in many outdoor activities (going to school, playing on the playground and participating in outdoor sports) (51, 52).
Furthermore, this study found no gender-based difference in the effects of air pollution on respiratory hospitalisations, which contradicts recent evidence that girls are at a higher risk of respiratory hospitalisations attributable to air pollution than boys (18, 53, 54). Further studies are needed to clarify the differential effects of gender on the association between air pollution and respiratory hospitalization.
Case-crossover study: Assessing the health effects of wildfire haze among children in Malaysia
This study demonstrated the need to consider duration, intensity and lag in exposure assessments of haze. The reporting of results through a combination of these three aspects would provide more in-depth information to help understand pathophysiological pathways and ultimately contribute to a better risk communication strategy for policy decision-makers and the public. Specifically, lag patterns suggested potentially more acute health risks if haze occurs over longer durations or higher intensities. Policies on preventive measures should consider these aspects for more efficient implementation. Moreover, this study added to the limited understanding of haze health effects in Southeast Asia. The health effects of haze in this region may differ from those reported in other regions (55) due to differences in climate, vegetation and causes of wildfires. Finally, this study contributed to the literature on haze-related health effects in children, especially younger children aged below 5 years old. Children make up a population quite vulnerable to air pollutants, with potentially differentiated health effects in younger vs. older children due to differences in their immune systems (56) and behavior (57).
Community surveys
From the results, we examined the impact of climate change on children's health in Malaysia based on environmental epidemiology, supported by primary data from community studies that employed a socio-ecological approach. As many researchers have been pointing out, global changes in temperature over time may have a disproportionate impact on children's wellbeing (58–60). For instance, they are more susceptible to diarrheal diseases, skin and eye infections, leptospirosis and vector-borne diseases (e.g., dengue) during the rainy season. In the dry season, health risks to children can include fever and cough, with heatwaves representing a particularly prominent danger in this regard.
The study demonstrated that children from the surveyed locations display degrees of resilience toward climate change and/or environmental degradation—although each location faced specific challenges based on local issues. Specifically, children of Pulau Gaya as well as Pos Kuala Mu dealt with unique challenges during the rainy season, especially in terms of getting to school. According to the IPCC (61), excessive rains are one of the most noticeable events for climate change, leading to unfavorable sea conditions in Pulau Gaya and flash floods in Pos Kuala Mu. Similar phenomena have occurred in Bangladesh, also causing thousands of children to be cut off from their schools (62). However, this was not a problem in PPR Sungai Bonus; these respondents reported their health being impacted during both the rainy and hot seasons instead. Here, the children also perceived that their health was adversely affected during climate extremes. However, since they have access to healthcare and health facilities, social support and realized the importance of a healthy lifestyle, this was not a major concern for them. Heat extremes were also highlighted in our community studies as a source of heat-related illnesses among children that hinders their school attendance. Children in the poor urban community reported similar experiences, most likely due to urban heat islands. The indigenous Temiar children and children in Pulau Gaya also mentioned insufficient processed water as contributing to poor sanitation and self-hygiene. Interestingly, vector-borne diseases would also become another problem, as climate conditions affect the survival and reproductive rates of mosquitoes which, in turn, influences the distribution, abundance, intensity and annual temporal patterns of mosquito activity, particularly their biting rates (63, 64).
Rainy weather extremes also contribute to floods, as demonstrated by our community studies, with floods affecting the family's economy in marginalized communities. The available food supply was also reported to diminish during floods, leading to increases in fresh food demand and prices and thus, adding additional pressure to these communities. Children from affected families often choose to skip school to support their families. In Pulau Gaya, Sabah, we also found families displaced indirectly by climatic challenges (denoted by the dashed red line in Figure 9). This minority group faces difficulties due to their citizenship status, which further impacts the chance of local education for their children and limits their social support system. In this community, children attended NGO-run schools instead, where they are taught basic literacy and numeracy.
Increasing public awareness regarding the importance of education, health, hygiene and environmental management will contribute to these children's wellbeing, building their resilience against climate change and the impacts of environmental degradation. Moreover, certain socio-demographic factors can be strengthened with sufficient knowledge, resources and support to enhance children's adaptive capacity in the face of climate change. A robust adaptation plan and sufficient implementation may help them prepare against impending climactic impacts.
Conclusion and recommendations
In summary, climate change, environmental degradation and pollution are intensifying in Malaysia alongside the country's rapid development. Accelerated climate change, environmental degradation and pollution present serious risks for children in Malaysia in general. In particular, children living in marginalized communities are even more vulnerable to climate and environmental risks. Based on the results from the studies on specific health sector climate indices, time series, case-crossover and community surveys, we constructed an integrated model that consolidates our overall research processes and demonstrates the crucial interconnections between environmental challenges and impacts exacerbated by climate change (Figure 9). Based on the main findings of this study, several recommendations can be made:
1. Strengthening the Malaysian education sector toward being climate-smart, including enhancing environmental education by focussing on three areas: (i) climate-smart educational content; (ii) climate-smart schools; and (iii) support for teachers with the latest knowledge on climate change science and local impacts and solutions (65).
2. Enhancing and supporting advocacy and representation for children and vulnerable groups.
3. Further research and development to ensure that all child-sensitive climate and environmental governance initiatives are evidence-based.
Although representing only preliminary findings on the status of children in Malaysia, together, the evidence in this study underscores the importance of addressing children's issues in relation to climate change and environmental degradation specifically and not as part of the general population. It is time to re-examine current policies, action plans and international documents on national commitments to climate change and environmental degradation in the context of children. It is hoped that these findings and recommendations will be widely disseminated within relevant networks for further action to be taken at both the community and policymaking levels through effective intersectoral strategies and implementation synergies across all relevant stakeholders.
Data availability statement
The original contributions presented in the study are included in the article/Supplementary material, further inquiries can be directed to the corresponding author.
Ethics statement
The studies involving human participants were reviewed and approved by Resaerch Ethics Committee, Faculty of Medicine, National University of Malaysia (JEP-2020-668). Written informed consent to participate in this study was provided by the participants' legal guardian/next of kin.
Author contributions
MS, IN, SCK, and MM: conceptualization. MS, RD, and YR: validation. MS, HO, and YR: supervision. MS, HO, SCK, and YR: project administration. MS and IN: funding acquisition. MS, HO, RH, MM, IN, RD, and HV: writing—review and editing. SCK, LJ, MFI, VLHP, SNHM, NK, ZIIZ, MM, and LCC: methodology. KC, LJ, MFI, VLHP, SNHM, NK, and ZIIZ: formal analysis. SCK, LJ, MFI, VLHP, SNHM, NK, ZIIZ, LCC, SSZ, MIAW, and NFAB: investigation. SCK, LJ, MFI, VLHP, SNHM, NK, LCC, SSZ, MIAW, and ZIIZ: data curation. SCK and YR: writing—original draft. SCK, YR, and RD: visualization. LJ, MFI, VLHP, SNHM, NK, SSZ, MIAW, NFAB, LCC, and ZIIZ: writing. NFAB: data acquisition and financial management. YR: editing. All authors contributed to the article and approved the submitted version.
Funding
This research was funded by UNICEF Malaysia (Award No: MLY/PCA202027/PD202021) and co-funded by Universiti Kebangsaaan Malaysia (UKM-NN-2020-041) for the project Analysis of Impacts of Climate Change and Environmental Degradation on Children in Malaysia and Assessment of Child Sensitivity of Current Adaptation and Mitigation Policies.
Conflict of interest
The authors declare that the research was conducted in the absence of any commercial or financial relationships that could be construed as a potential conflict of interest.
The reviewer AN declared a shared affiliation with the author HV to the handling editor at the time of review.
Publisher's note
All claims expressed in this article are solely those of the authors and do not necessarily represent those of their affiliated organizations, or those of the publisher, the editors and the reviewers. Any product that may be evaluated in this article, or claim that may be made by its manufacturer, is not guaranteed or endorsed by the publisher.
Supplementary material
The Supplementary Material for this article can be found online at: https://www.frontiersin.org/articles/10.3389/fpubh.2022.909779/full#supplementary-material
References
1. Taib F. Invisible, vulnerable, and marginalised children in Malaysia. Malaysian J Paediatr Child Health. (2012). Available online at: https://mpaeds.my/journals/index.php/MJPCH/article/view/89 (accessed February 28, 2022).
2. Menke I, Schleussner C-F (2019). Global Climate Change Impacts on Children. Climate Analytics. Available online at: https://climateanalytics.org/publications/2019/global-impacts-of-climate-change-on-children/ (accessed September 20, 2022).
3. UNICEF. The Climate Crisis is a Child Rights Crisis: Introducing the Children's Climate Risk Index. (2021). Available online at: https://www.unicef.org/reports/climate-crisis-child-rights-crisis (accessed January 20, 2022).
4. Department of Statistic Malaysia. Vital Statistics, Malaysia. (2021). Available online at: https://www.dosm.gov.my/v1/index.php?r=column/cthemeByCat&cat=165&bul_id=UDlnQ05GMittVXJWZUVDYUFDcjVTZz09&menu_id=L0pheU43NWJwRWVSZklWdzQ4TlhUUT09 (accessed September 2, 2022).
5. Currie J, Deschenes O. Children and climate change: introducing the issue. Fut Child. (2016) 26:2–9. doi: 10.1353/foc.2016.0000 (accessed January 19, 2022)
6. Xu Z, Sheffield PE, Hu W, Su H, Yu W, Qi X, et al. Climate change and children's health-A call for research on what works to protect children. Int J Environ Res Public Health. (2012) 9:3298–316. doi: 10.3390/ijerph9093298
7. Anderko L, Chalupka S, Du M, Hauphman M. Climate changes reproductive and children's health: a review of risks, exposures, and impacts. Paediatric Rev. (2019) 87:414–9. doi: 10.1038/s41390-019-0654-7
8. Aliagha GU, Mar Iman AH, Ali AH, Kamaruddin N, Ali KM. Discriminant factors of flood insurance demand for flood-hit residential properties: A case for Malaysia. J Flood Risk Manag. (2013) 8:39–51. doi: 10.1111/jfr3.12065
9. Hong C, Zhang Q, Zhang Y, Davis SJ, Tong D, Zheng Y, et al. Impacts of climate change on future air quality and human health in China. PNAS. (2019) 116:17193–200. doi: 10.1073/pnas.1812881116
10. Perera FP. Multiple threats to child health from fossil fuel combustion: Impacts of air pollution and climate change. Environ Health Perspect. (2017) 125:141–8. doi: 10.1289/EHP299
11. van der Werf G, Dempewolf J, Trigg S, Randerson J, Kasibhatla P, Giglio L, et al. Climate regulation of fire emissions and deforestation in equatorial Asia. PNAS. (2008) 105:20350–5. doi: 10.1073/pnas.0803375105
12. Pegram J, Colon C. Are Climate Change Policies Child-Sensitive? A Guide for Action: Summary. United Nations Children's Fund (UNICEF), New York, USA (2019). Available online at: https://www.unicef.org/media/72561/file/Are-climate-change-policies-child-sensitive-2020_0.pdf (accessed January 6, 2022).
13. OHCHR. Marginalized Groups: UN Human Rights Expert Calls for an End to Relegation. (2014). Available online at: https://www.ohchr.org/en/pressreleases/014/06/marginalized-groups-un-human-rights-expert-calls-endrelegation (accessed November 11, 2021).
14. Ngai ST, Juneng L, Tangang F, Chung JX, Salimun E, Tan ML, et al. Future projections of Malaysia daily precipitation characteristics using bias correction technique. Atmos Res. (2020) 240:104926. doi: 10.1016/j.atmosres.2020.104926
15. Baghel T, Babel MS, Shrestha S, Salin KR, Virdis SG. A generalised methodology for ranking climate models based on climate indices for sector-specific studies: an application to the Mekong sub-basin. Sci Total Environ. (2022) 829:154551. doi: 10.1016/j.scitotenv.2022.154551
16. National Oceanic Atmospheric Administration. Global Surface Summary of the Day. (2020). Available online at: https://data.noaa.gov/dataset/dataset/globalsurface-summary-of-the-day-gsod (accessed September 20, 2022).
17. Tangang F, Chung JX, Juneng L, Salimun E, Ngai ST, Jamaluddin AF, et al. Projected future changes in rainfall in Southeast Asia based on CORDEX-SEA multi-model simulations. Clim Dyn. (2020) 55:1247–67. doi: 10.1007/s00382-020-05322-2
18. Ibrahim MF, Hod R, Ahmad Tajudin MAB, Wan Mahiyuddin WR, Mohammed Nawi A, Sahani M, et al. Children's exposure to air pollution in a natural gas industrial area and their risk of hospital admission for respiratory diseases. Environ Res. (2022) 210:112966. doi: 10.1016/j.envres.2022.112966
19. Tajudin MABA, Khan MF, Wan Mahiyuddin WR, Hod R, Latif MT, Hamid AH, et al. Risk of concentrations of major air pollutants on the prevalence of cardiovascular and respiratory diseases in urbanised area of Kuala Lumpur, Malaysia. Ecotoxicol Environ Saf. (2019) 171:290–300. doi: 10.1016/j.ecoenv.2018.12.057
20. Wood SN. mgcv: GAMs and generalized ridge regression for R. R News. (2001) 1:20–5. Available online at: https://journal.r-project.org/articles/RN-2001-015/ (accessed September 15, 2021).
21. Phung VLH, Ueda K, Sahani M, Seposo XT, Wan Mahiyuddin WR, Honda A, et al. Investigation of association between smoke haze and under-five mortality in Malaysia. Accounting for time lag, duration and intensity. Int J Epidemiol. (2022) 51:155–65. doi: 10.1093/ije/dyab100
22. Sahani M, Zainon NA, Mahiyuddin WR, Latif M, Hod R, Khan F, et al. A case-crossover analysis of forest fire haze events and mortality in Malaysia. Atmos Environ. (2014) 96:257–65. doi: 10.1016/j.atmosenv.2014.07.043
23. Ho RC, Zhang MW, Ho CS, Pan F, Lu Y, Sharma VK. Impact of 2013 south Asian haze crisis: study of physical and psychological symptoms and perceived dangerousness of pollution level. BMC Psychiatry. (2014) 14:81. doi: 10.1186/1471-244X-14-81
24. Sastry N. Forest fires, air pollution, and mortality in Southeast Asia. Demography. (2002) 2002:1–23. doi: 10.1353/dem.2002.0009
25. Faustini A, Alessandrini ER, Pey J, Perez N, Samoli E, Querol X, et al. Short-term effects of particulate matter on mortality during forest fires in Southern Europe: Results of the MED-PARTICLES project. Occup Environ Med. (2015) 72:323–9. doi: 10.1136/oemed-2014-102459
26. Künzli N, Avol E, Wu J, Gauderman WJ, Rappaport E, Millstein J, et al. Health effects of the 2003 Southern California wildfires on children. Am J Respir Crit Care Med. (2006) 174:1221–8. doi: 10.1164/rccm.200604-519OC
27. Janes H, Sheppard L, Lumley T. Case-crossover analyses of air pollution exposure data: Referent selection strategies and their implications for bias. Epidemiology. (2005) 16:717–26. doi: 10.1097/01.ede.0000181315.18836.9d
28. WHO GISRS. (2022). Available at: https://app.powerbi.com/view?r=eyJrIjoiNjViM2Y4NjktMjJmMC00Y2NjLWFmOWQtODQ0NjZkNWM1YzNmIiwidCI6ImY2MTBjMGI3LWJkMjQtNGIzOS04MTBiLTNkYzI4MGFmYjU5MCIsImMiOjh9 (accessed September 10, 2022).
29. R Core Team. R: A language environment for statistical computing. R Foundation for Statistical Computing. (2018). Available online at: https://www.Rproject.org/ (accessed June 12, 2021).
30. Zamanzadeh V, Ghahramanian A, Rassouli M, Abbaszadeh A, Alavi-Majd H, Nikanfar AR, et al. Design and implementation content validity study: development of an instrument for measuring patient-centered communication. J Caring Sci. (2015) 4:165–78. doi: 10.15171/jcs.2015.017
31. Ursachi G, Horodnic IA. How reliable are measurement scales? External factors with indirect influence on reliability estimators. Proc Econ Finance. (2015) 20:679–86. doi: 10.1016/S2212-5671(15)00123-9
32. Dosio A. Projection of temperature and heatwaves for Africa with an ensemble of CORDEX regional climate models. Clim Dyn. (2017) 49:493–519. doi: 10.1007/s00382-016-3355-5
33. Molina MO, Sánchez E, Gutiérrez C. Future heatwaves over the Mediterranean from an Euro-CORDEX regional climate model ensemble. Sci Rep. (2020) 10:1–10. doi: 10.1038/s41598-020-65663-0
34. Das J, Umamahesh NV. Heatwave magnitude over India under changing climate: Projections from CMIP5 and CMIP6 experiments. Int J Climatol. (2022) 42:331–51. doi: 10.1002/joc.7246
35. Junk J, Goergen K, Krein A. Future heatwaves in different European capitals based on climate change indicators. Int J Environ Res Public Health. (2019) 20:3959. doi: 10.3390/ijerph16203959
36. Tangang F, Supari S, Chung J, Cruz F, Salimun E, Ngai T, et al. Future changes in annual precipitation extremes over Southeast Asia under global warming of 2°C. APN Sci Bull. (2018) 8. doi: 10.30852/sb.2018.436
37. Santoso A. The defining characteristics of ENSO extremes and the strong 2015/2016 El Niño. Rev Geophy. (2019) 55:1079–129. doi: 10.1002/2017RG000560
38. Thirumalai K, DiNezio P, Okumura Y, Deser C. Extreme temperatures in Southeast Asia caused by El Niño and worsened by global warming. Nat Commun. (2017) 8:15531. doi: 10.1038/ncomms15531
39. Anyamba A, Chretien JP, Britch SC, et al. Global disease outbreaks associated with the 2015–2016 el niño event. Sci Rep. (2019) 9:1930. doi: 10.1038/s41598-018-38034-z
40. Phung VLH, Oka K, Hijioka Y, Ueda K, Sahani M, Wan Mahiyuddin WR, et al. Environmental variable importance for under-five mortality in Malaysia: a random forest approach. Sci Total Environ. (2022) 845:157312. doi: 10.1016/j.scitotenv.2022.157312
41. Yatim ANM, Latif MT, Sofwan NM, Ahamad F, Khan MF, Mahiyuddin WRW, et al. The association between temperature and cause-specific mortality in the Klang Valley, Malaysia. Environ Sci Pollut Res Int. (2021) 28:60209–20. doi: 10.1007/s11356-021-14962-8
42. Woldemeskel FM, Sharma A, Sivakumar B. An error estimation method for precipitation and temperature projections for future climates. J Geophys Res Atmos. (2012) 117:D22. doi: 10.1029/2012JD018062
43. Abdullah S, Napi NNLM, Ahmed AN, Mansor WNW, Mansor AA, Ismail M, et al. Development of multiple linear regression for particulate matter (PM10) forecasting during episodic transboundary haze event in Malaysia. Atmosphere. (2020) 11:289. doi: 10.3390/atmos11030289
44. Li YR, Xiao CC, Li J, Tang J, Geng XY, Cui LJ, et al. Association between air pollution and upper respiratory tract infection in hospital outpatients aged 0–14 years in Hefei, China: A time series study. Public Health. (2018) 156:92–100. doi: 10.1016/j.puhe.2017.12.006
45. Li D, Wang JB, Zhang ZY, Shen P, Zheng PW, Jin MJ, et al. Effects of air pollution on hospital visits for pneumonia in children: a two-year analysis from China. Environ Sci Pollut Res. (2018) 25:10049–57. doi: 10.1007/s11356-018-1192-2
46. Zheng PW, Wang JB, Zhang ZY, Shen P, Chai PF, Li D, et al. Air pollution and hospital visits for acute upper and lower respiratory infections among children in Ningbo, China: a time-series analysis. Environ Sci Pollut Res. (2017) 24:18860–9. doi: 10.1007/s11356-017-9279-8
47. Ghaffari HR, Aval HE, Alahabadi A, Mokammel A, Khamirchi R, Yousefzadeh S, et al. Asthma disease as a cause of admission to hospitals due to exposure to ambient oxidants in Mashhad, Iran. Environ Sci Pollut Res. (2017) 24:27402–8. doi: 10.1007/s11356-017-0226-5
48. Latif MT, Dominick D, Hawari NSSL, Mohtar AAA, Othman M. The concentration of major air pollutants during the movement control order due to the COVID-19 pandemic in the Klang Valley, Malaysia. Sustain Cities Soc. (2021) 66:102660. doi: 10.1016/j.scs.2020.102660
49. Leh OLH, Marzukhi MA, Kwong QJ, Mabahwi NA. Impact of urban land uses and activities on the ambient air quality in Klang Valley, Malaysia from 2014 to 2020. Plan Malay. (2020) 18:239–58. doi: 10.21837/pm.v18i14.829
50. Salleh SF, Mohd Roslan ME, Abd Rahman A, Shamsuddin AH, Tuan Abdullah TAR, Sovacool BK. Transitioning to a sustainable development framework for bioenergy in Malaysia: Policy suggestions to catalyze the utilisation of palm oil mill residues. Energy Sustain Soc. (2020) 10:1–20. doi: 10.1186/s13705-020-00269-y
51. Aarts MJ, Wendel-Vos W, van Oers HA, Van de Goor IA, Schuit AJ. Environmental determinants of outdoor play in children: a large-scale cross-sectional study. Am J Prev Med. (2010) 39:212–9. doi: 10.1016/j.amepre.2010.05.008
52. Christian H, Lester L, Trost SG, Schipperijn J, Pereira G, Franklin P, et al. Traffic exposure, air pollution and children's physical activity at early childhood education and care. Int J Hyg Environ Health. (2022) 240:113885. doi: 10.1016/j.ijheh.2021.113885
53. Ma Y, Yue L, Liu J, He X, Li L, Niu J, et al. Association of air pollution with outpatient visits for respiratory diseases of children in an ex-heavily polluted Northwestern city, China. BMC Public Health. (2020) 20:1–14. doi: 10.1186/s12889-020-08933-w
54. Shin HH, Maquiling A, Thomson EM, Park IW, Stieb DM, Dehghani P. Sex-difference in air pollution-related acute circulatory and respiratory mortality and hospitalization. Sci Total Environ. (2022) 806:150515. doi: 10.1016/j.scitotenv.2021.150515
55. Reid CE, Brauer M, Johnston FH, Jerrett M, Balmes JR, Elliott CT. Critical review of health impacts of wildfire smoke exposure. Environ Health Perspect. (2016) 124:1334–43. doi: 10.1289/ehp.1409277
56. Decker ML, Gotta V, Wellmann S, Ritz N. Cytokine profiling in healthy children shows association of age with cytokine concentrations. Sci Rep. (2017) 7:17842. doi: 10.1038/s41598-017-17865-2
57. De Pretto L, Acreman S, Ashfold MJ, Mohankumar SK, Campos-Arceiz A. The link between knowledge, attitudes and practices in relation to atmospheric haze pollution in Peninsular Malaysia. PLoS ONE. (2015) 10:e0143655. doi: 10.1371/journal.pone.0143655
58. Ansah IGK, Gardebroek C, Ihle R. Resilience and household food security: a review of concepts, methodological approaches and empirical evidence. Food Secur. (2019) 11:1187–203. doi: 10.1007/s12571-019-00968-1
59. Stanberry LR, Thomson MC, James W. Prioritising the needs of children in a changing climate. PLoS Med. (2018) 15:e1002627. doi: 10.1371/journal.pmed.1002627
60. Towers B, Ronan K, Rashid M. Geographies of Global Issues: Change and Threat, Geographies of Children and Young People, Vol. 8. Singapore: Springer (2016).
61. IPCC. (2022). Field CB, Barros V, Stocker TF, Qin D, Dokken DJ, Ebi KL, et al. Available online at: https://www.ipcc.ch/report/managing-the-risks-of-extreme-events-and-disasters-to-advance-climate-change-adaptation/ (accessed September 2, 2022).
62. Asadullah MN, Islam K, Wahhaj Z. Child marriage, climate vulnerability and natural disasters in coastal Bangladesh. J Biosoc Sci. (2021) 53:948–67. doi: 10.1017/S0021932020000644
63. Yu W, Mengersen K, Dale P, Ye X, Guo Y, Turner L, et al. Projecting future transmission of malaria under climate change scenarios: challenges and research needs'. Crit Rev Environ Sci Technol. (2015) 45:777–811. doi: 10.1080/10643389.2013.852392
64. Watts N, Adger WN, Agnolucci P, Blackstock J, Byass P, Cai W, et al. Health and climate change: policy responses to protect public health. Lancet. (2015) 386:1861–914. doi: 10.1016/S0140-6736(15)60854-6
65. UNICEF. Impact of Climate Change on Children: A Malaysian Perspective-Summary Boolet. (2021). Available online at: https://www.unicef.org/malaysia/reports/impact-climate-change-children (accessed March 18, 2022).
Keywords: environmental degradation, climate change, children, marginalized communities, Malaysia
Citation: Sahani M, Othman H, Kwan SC, Juneng L, Ibrahim MF, Hod R, Zaini ZI, Mustafa M, Nnafie I, Ching LC, Dambul R, Varkkey H, Phung VLH, Mamood SNH, Karim N, Abu Bakar NF, Wahab MIA, Zulfakar SS and Rosli Y (2022) Impacts of climate change and environmental degradation on children in Malaysia. Front. Public Health 10:909779. doi: 10.3389/fpubh.2022.909779
Received: 31 March 2022; Accepted: 12 September 2022;
Published: 14 October 2022.
Edited by:
Xerxes Seposo, Hokkaido University, JapanReviewed by:
Maquins Odhiambo Sewe, Umeå University, SwedenAnna Nathan, University of Malaya, Malaysia
Athicha Uttajug, Hokkaido University, Japan
Copyright © 2022 Sahani, Othman, Kwan, Juneng, Ibrahim, Hod, Zaini, Mustafa, Nnafie, Ching, Dambul, Varkkey, Phung, Mamood, Karim, Abu Bakar, Wahab, Zulfakar and Rosli. This is an open-access article distributed under the terms of the Creative Commons Attribution License (CC BY). The use, distribution or reproduction in other forums is permitted, provided the original author(s) and the copyright owner(s) are credited and that the original publication in this journal is cited, in accordance with accepted academic practice. No use, distribution or reproduction is permitted which does not comply with these terms.
*Correspondence: Yanti Rosli, eWFudGlfcm9zbGlAdWttLmVkdS5teQ==