 Karuppusamy Balasubramani1
 Kumar Arun Prasad1
 Naveen Kumar Kodali2
 Nishadh Kalladath Abdul Rasheed3
 Savitha Chellappan4
 Devojit Kumar Sarma5
 Manoj Kumar6
 Rashi Dixit2
 Meenu Mariya James2
 Sujit Kumar Behera2Sulochana Shekhar1
 Praveen Balabaskaran Nina2,7*
- 1Department of Geography, Central University of Tamil Nadu, Thiruvarur, Tamil Nadu, India
- 2Department of Epidemiology and Public Health, Central University of Tamil Nadu, Thiruvarur, Tamil Nadu, India
- 3IGAD Climate Prediction and Applications Centre (ICPAC), Nairobi, Kenya
- 4Department of Public Health and Community Medicine, ICMR—National Institute of Traditional Medicine, Belgaum, Karnataka, India
- 5Department of Molecular Biology, ICMR—National Institute for Research in Environmental Health, Bhopal, Madhya Pradesh, India
- 6Department of Microbiology, ICMR—National Institute for Research in Environmental Health, Bhopal, Madhya Pradesh, India
- 7Department of Public Health and Community Medicine, Central University of Kerala, Kasaragod, Kerala, India
Background: In India, acute respiratory infections (ARIs) are a leading cause of mortality in children under 5 years. Mapping the hotspots of ARIs and the associated risk factors can help understand their association at the district level across India.
Methods: Data on ARIs in children under 5 years and household variables (unclean fuel, improved sanitation, mean maternal BMI, mean household size, mean number of children, median months of breastfeeding the children, percentage of poor households, diarrhea in children, low birth weight, tobacco use, and immunization status of children) were obtained from the National Family Health Survey-4. Surface and ground-monitored PM2.5 and PM10 datasets were collected from the Global Estimates and National Ambient Air Quality Monitoring Programme. Population density and illiteracy data were extracted from the Census of India. The geographic information system was used for mapping, and ARI hotspots were identified using the Getis-Ord Gi* spatial statistic. The quasi-Poisson regression model was used to estimate the association between ARI and household, children, maternal, environmental, and demographic factors.
Results: Acute respiratory infections hotspots were predominantly seen in the north Indian states/UTs of Uttar Pradesh, Bihar, Delhi, Haryana, Punjab, and Chandigarh, and also in the border districts of Uttarakhand, Himachal Pradesh, and Jammu and Kashmir. There is a substantial overlap among PM2.5, PM10, population density, tobacco smoking, and unclean fuel use with hotspots of ARI. The quasi-Poisson regression analysis showed that PM2.5, illiteracy levels, diarrhea in children, and maternal body mass index were associated with ARI.
Conclusion: To decrease ARI in children, urgent interventions are required to reduce the levels of PM2.5 and PM10 (major environmental pollutants) in the hotspot districts. Furthermore, improving sanitation, literacy levels, using clean cooking fuel, and curbing indoor smoking may minimize the risk of ARI in children.
Introduction
Respiratory infections are one of the major causes of chronic diseases in children worldwide, causing significant deaths in developing countries and greatly contributing to increases in disability-adjusted life years (1, 2). Globally, lower respiratory infections (LRI) are a major cause of death in children under 5 years (3), and in 2015, an estimated 104.8 children per million died of LRI (2). In India, even though there was a substantial decrease in the deaths of children under 5 years (2.516 million deaths in 2000 to 1.201 million deaths in 2015), the count is still the highest in the world in this category (4). Among children under 5 years in India, pneumonia—a major manifestation of LRI—was the second leading cause of mortality, with 0.191 million deaths (15.9%), next to preterm birth complications (0.33 million, 27.5%) (5).
Etiology and risk factors for respiratory tract infections are multifactorial: solid fuel cookstove use, household tobacco use, and agricultural crop burning are important environmental risk factors for respiratory tract infections in children in India (6–8). Solid fuel is a key risk factor for acute respiratory infections (ARI) (6, 9–13), and 50% of pneumonia-related deaths in children under 5 years are due to inhalation of particulate matter (soot) arising from indoor air pollution (14). When inhaled, particulate matter (PM2.5) can settle deep in the lungs and can enter into circulation, resulting in an increased risk of respiratory and cardiac illnesses (15). Solid fuel burning, windblown soil, vehicular exhaust, agricultural crop burning, and fine particulate matter (PM2.5) from construction sites pollute air and cause respiratory diseases (16). Improved sanitation and hygiene interventions have been reported to reduce ARI in children (17, 18).
The National Family Health Survey-4 (NFHS-4) estimated the prevalence of ARI to be 2.7% in 2015–2016 in India, which is a ~50% decrease from 5.6% reported in 2005–2006 by the NFHS-3 (19). Despite a ~50% decrease in ARI mortality of children under 5 years (4), India has not achieved the target of reducing child mortality by two-thirds between 1990 and 2015, as envisaged in the Millennium Development Goal 4 (20). Achieving the sustainable development goal target of child survival (neonatal mortality of ≤12/1,000 live births and mortality of children under 5 years of ≤25/1,000 live births) by 2030 (21) may not be possible for many states in India at the current rate of progress (5).
As ARIs are major determinants of child mortality, understanding their spatial distribution at the district level across India is critical for devising targeted intervention strategies. In this study, we have mapped the prevalence of ARI in children under 5 years at the district level across India using data from the NFHS-4 and the Census of India. In addition, using spatial statistics, we have mapped the hotspots to identify high-risk districts and states in India. In addition, the spatial association of environmental (PM2.5 and PM10), household (cooking fuel, sanitation, and vaccination status), and behavioral (tobacco smoking) risk factors with ARI epidemiology in children under 5 years at the district level across India was also outlined. Furthermore, the statistical association of ARI and its associated risk factors were estimated using the quasi-Poisson regression model.
Methods
Data source
Data on ARI, unclean fuel, improved sanitation, mean maternal BMI, mean household size, mean number of children, median months of breastfeeding the children, percentage of poor households, percentage of children with diarrhea, percentage of low birth weight, percentage of people who smoke tobacco, and immunization status of children data were obtained from the NFHS-4, a district-level survey carried out in all Indian districts for determining many important health indicators, including ARI (22). The survey was carried out across India from January 2015 to December 2016. The NFHS-4 data are available for public use at https://dhsprogram.com/ and can be used after obtaining authorization from the Demographic and Health Survey (DHS) program. Data on the district-wise population (total and children) and illiteracy data (2011) for all 640 districts in India were collected from the Census of India website (https://www.censusindia.gov.in/2011census/dchb/DCHB.html) for mapping and comparative analysis. The average concentration of PM2.5 for districts for the period 2013–2016 was collected from the Global Estimates data. The Global Estimates of fine particulate matter concentration are collated by combining data retrieved from aerosol optical depth (AOD) from satellite products, GEOS-Chem chemical transport modeling on surface PM2.5, and ground-monitored data. The satellite products, such as NASA's MODIS C6.1, MISR V23, NASA's MAI ACC6 and SeaWiFS, were used to derive AOD. The estimates were calibrated with the global ground-based PM2.5 observations to obtain long-term consistency for trend assessment. The year-wise net CDF files were downloaded from the Global Estimates V4.GL.03/V4.GL.03.NoGWR datasets available at https://sites.wustl.edu/acag/datasets/surface-pm2-5/. In addition to PM2.5 data, ground-monitored PM10 data from 168 cities in India were collected from the National Ambient Air Quality Monitoring Programme (23) for the period 2013–2016 for comparative analysis. The datasets used for analysis are provided in Supplementary material S1.
Study measures
Outcome variable
The outcome of interest is the number of ARI cases per 100 population in each of the 640 districts in India. ARI cases are identified based on symptoms of (a) cough accompanied by (b) short, rapid breathing that is chest-related and/or (c) difficult breathing that is chest-related. A child with all these three symptoms was considered to be suffering from ARI (22).
Independent variables
The particulate matter, PM2.5 (average annual concentrations of PM2.5 in μg/m3), was used as an environmental variable in the analysis. The following variables were considered household variables: (a) unclean cooking fuel use (percentage of households using solid fuels including coal, charcoal, wood, straw/shrub/grass, and animal dung), (b) improved sanitation facilities (percentage of households using non-shared toilet type with piped sewer systems), and (c) tobacco consumption (percentage of people smoking tobacco). Mothers' characteristics include median months of breastfeeding, the mean number of children, and mean maternal BMI. The percentage of children with diarrhea, low birth weight, and immunization status of children (percentage of <2-year-old children immunized with BCG, measles, polio, and DPT) were considered children-level variables. The demography variables included (a) mean household size, (b) rural/urban residence (dominant category of residence in a district), (c) illiteracy level (percentage of illiterates to the total population), and (d) percentage of poor households.
Data normalization and mapping
In this study, the data points of PM2.5 with 0.01° × 0.01° resolution from each district boundary across India were spatially averaged (all the pixel values within a district boundary) to derive the annual PM2.5 data. To avoid temporal deviations and compare the PM2.5 values with NFHS-4 ARI datasets, a 4-year (2013–2016) average concentration of PM2.5 was computed. Similarly, the 4-year values of location-specific PM10 data were averaged and compared with PM2.5 through the GIS.
All the generated datasets were prepared as spatial layers for spatial analysis and mapped using ArcMap 10.4 software (https://www.esri.com/en-us/arcgis/products/arcgis-desktop/resources). We used choropleth mapping techniques for better visualization and easy interpretation.
Hotspot analysis
Spatial autocorrelation investigates the degree to which a phenomenon is correlated to itself in a two-dimensional geographical surface. The evaluation of such identifiable spatial patterns of ARI is necessary to better understand the propagation of ARI in a geographical area. The overall clustering of the incidence of ARI can be measured by global spatial autocorrelation methods. For example, Moran's I statistic tests the null hypothesis that the spatial autocorrelation of a variable is assumed to be zero. The variable is said to have spatial autocorrelation if the null hypothesis is rejected (24). A family of G statistics, developed by Getis and Ord, is more popular and is used to study spatial interdependency. The general G statistic (25), similar to Moran's I statistics, measures only the overall degree of spatial autocorrelation and results in a single index for the entire study area. However, the global statistic is too general, and the local patterns in spatial autocorrelation are neutralized and will go undetected (26, 27). Local-level spatial autocorrelation methods will focus on factors controlling the local variation in a larger space, and the detection of such clusters will enable us to identify hotspots without any preconceptions about their locations (28). Getis and Ord proposed Gi and , a local spatial autocorrelation statistic more suitable for detecting significant pockets of clustering, which are often undetected using global statistics (29).
In this study, we used district-level NFHS-4 data on the percentage of children with ARI symptoms for detecting ARI clusters in India. The hotspot analysis tool in ArcGIS software was used to identify the intensity of clustering in a bin (district) relative to its neighboring bins (districts). The hotspot analysis was performed by determining the standardized Getis-Ord Gi* spatial statistic with the null hypothesis that there is no spatial autocorrelation among the features with respect to the variable ARI cases (in %). The analysis revealed the identification of ARI hotspots based on Z-scores (standard deviations) and p-values (probability). The standardized Getis-Ord Gi* spatial statistic considering wii ≠ 0 can be expressed as follows:
where ; wij is the spatial weight between the features i and j; and s represent the sample mean and standard deviation, respectively; n represents the total number of features; and Wi represents the sum of weights for a distance d, and that can be expressed as .
The Gi* statistic generates the p-value obtained from the significance test, and that could be used to determine whether or not to accept the null hypothesis. The standardized G (Z-score of G) can be calculated as follows (26):
where E(G) represents the expected G and V(G) is the variance of G. The E(G) and V(G) can be calculated as follows:
When the absolute value of the Z-score is large, and the p < 0.05, the null hypothesis can be rejected, that is, the districts (or ARI values associated with the districts) exhibit statistically significant clustering.
In this study, the local sum of ARI cases (in %) of a single district and its neighboring districts is compared proportionally with the sum of ARI cases (in %) of all Indian districts. We have defined a Euclidean distance of 200 km as a spatial limit to define the neighborhood relationships. Thus, the prevalence of ARI in each of the districts is compared spatially with the neighboring districts (the districts that are within 200 km radial distance) as well as with all the 640 districts of India. As a result of this comparison, a Z-score (standard deviation) and a p-value (probability) are generated for each district within the context of the neighboring districts at 95% CI. When the local sum is quite different from the expected local sum, and that difference is larger than expected to be from random chance, a statistically significant Z-score (p < 0.05) is obtained (30). A high Z-score and a small p-value for a district indicate a spatial clustering of high values (hotspots). A low negative Z-score and a small p-value indicate a spatial clustering of low values (cold spots). A Z-score near zero indicates no apparent spatial clustering (31).
Statistical analysis
A quasi-Poisson regression model was used to estimate the association between ARI (cases per 100 population) and the independent variables (PM2.5, percentage of unclean fuel, percentage of improved sanitation, percentage of childhood immunization, percentage of illiteracy level, percentage of people smoking tobacco, mean maternal BMI, mean household size, mean number of children, median months of breastfeeding, percentage of poor household, percentage of children with diarrhea, percentage of low birth weight, and rural/urban residence). The quasi-Poisson regression model was used to account for the overdistribution in the count data. All the independent variables were included in the multivariate analysis, irrespective of significance in the univariate analysis. There was no multicollinearity issue among the independent variables. The adjusted incidence rate ratios (aIRRs) and the corresponding 95% CI are presented. A p < 0.05 was considered significant. The statistical analysis was carried out using STATA software version 17 (StataCorp, TX, USA).
Results
Spatial pattern of ARI
The prevalence of ARI in children under 5 years in each district was taken as an absolute percentage of the population, as shown in Figure 1A. The average percentage of children (under 5 years) having symptoms of ARI in India during the study period was 2.7% (6,529 out of 238,945 surveyed children). The district-wise ARI percentage is classified into five classes: <1.0- very low; 1.1-2.0-low; 2.1-5.0-moderate; 5.1-10.0-high; 10.1-20.0- very high. The class interval of 10.1–20.0 (%) represents districts that have the highest prevalence rates, while the class interval of <1.0 shows districts with a very low prevalence of ARI. Many districts in the northern states of India, such as Jammu and Kashmir, Punjab, Uttarakhand, and Uttar Pradesh, show the prevalence of ARI prevalence of more than 5%. In addition, a few districts in Bihar, West Bengal, Assam, Meghalaya, Jharkhand, Odisha, and Madhya Pradesh report a prevalence of ARI of >5%. In the districts surrounding the major cities of Delhi, Kolkata, Mumbai, Bhopal, and Hyderabad, the prevalence of ARI was >5%. Many districts in the northern states were found to have the prevalence of ARI of >5%, with several other districts varying between 2–5%. Similarly, many districts of Maharashtra (west), Telangana (south), and Tamil Nadu (south) showcased the prevalence of ARI between 2–5%.
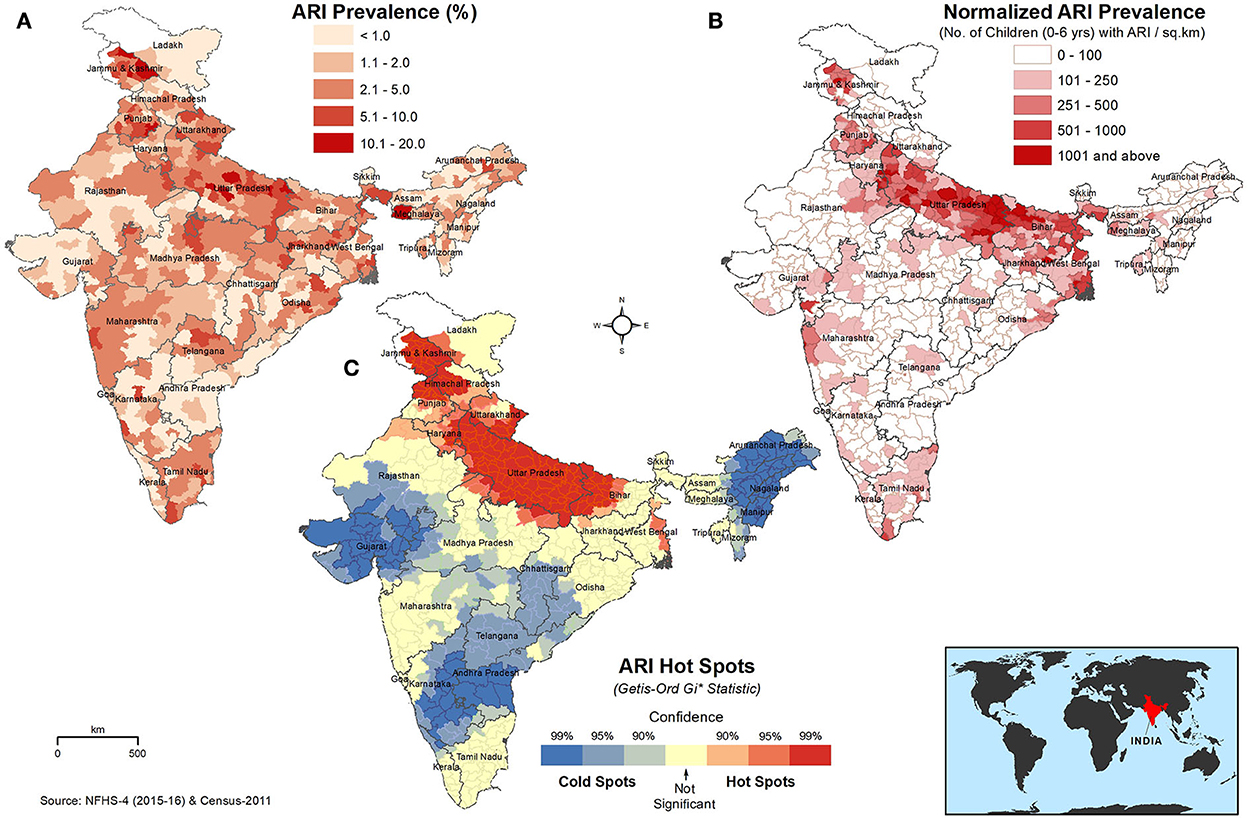
Figure 1. Spatial distribution of (A) absolute percentage of ARI in children under 5 years, (B) ARI prevalence normalized to the children population density (children with ARI/km2), and (C) hot and cold spots of ARI in children under 5 years. The darker red shades indicate higher values/hotspots of ARI. The inset map shows the location of India on the world map.
The absolute ARI prevalence in percentage was normalized to the children population density at the district level for relative comparison, as shown in Figure 1B. The highest prevalence of ARI (>1,001 cases/km2) was observed predominantly in the districts of the Great Plains of India (Indus–Ganga–Brahmaputra plains), which stretches from Jammu and Kashmir to West Bengal and includes the states of Punjab, Haryana, Uttar Pradesh, and Bihar. Several districts in Uttar Pradesh showed highest prevalence rates of ARI among children. The highest incidence of ARI per km2 was also observed in Kolkata, Mumbai, Delhi, Chennai, Hyderabad, and Chandigarh, which are major cities in India.
The hotspots of ARI in children under 5 years are shown in Figure 1C. ARI hotspots, with a 95% confidence level, were predominantly seen in north India, covering the entire state/UTs of Uttar Pradesh and Delhi and many districts of Bihar, Haryana, Punjab, Uttarakhand, Himachal Pradesh, and Jammu and Kashmir.
Spatial distribution of environmental pollutants and population density
The ambient PM2.5 (μg/m3) and PM10 (μg/m3) concentrations at the district level across India are shown in Figure 2A. The average district-wise PM2.5 concentration in India was 62.4 μg/m3. The entire floodplains of the Ganges River in north India were gravely affected by high concentrations of PM2.5. In several districts of Uttar Pradesh, Haryana, Delhi, and Bihar, alarming concentrations (>100 μg/m3) of PM2.5 were observed. PM2.5 concentrations surrounding the Ganges Plains were also very high (60–80 μg/m3). The average PM10 concentration in Indian cities was 104.1 μg/m3. The highest concentrations of PM10 (>200 μg/m3) were observed in the cities of the Ganges Plains, especially around the National Capital Territory (NCT) of Delhi. The majority of the developed cities in the states of Punjab, Haryana, Uttar Pradesh, Uttarakhand, Bihar, Jharkhand, and West Bengal were the major hotspots for PM10. The state capitals of Chhattisgarh (Raipur), Madhya Pradesh (Bhopal), and Rajasthan (Jaipur) also reported alarming concentrations (150–200 μg/m3) of PM10.
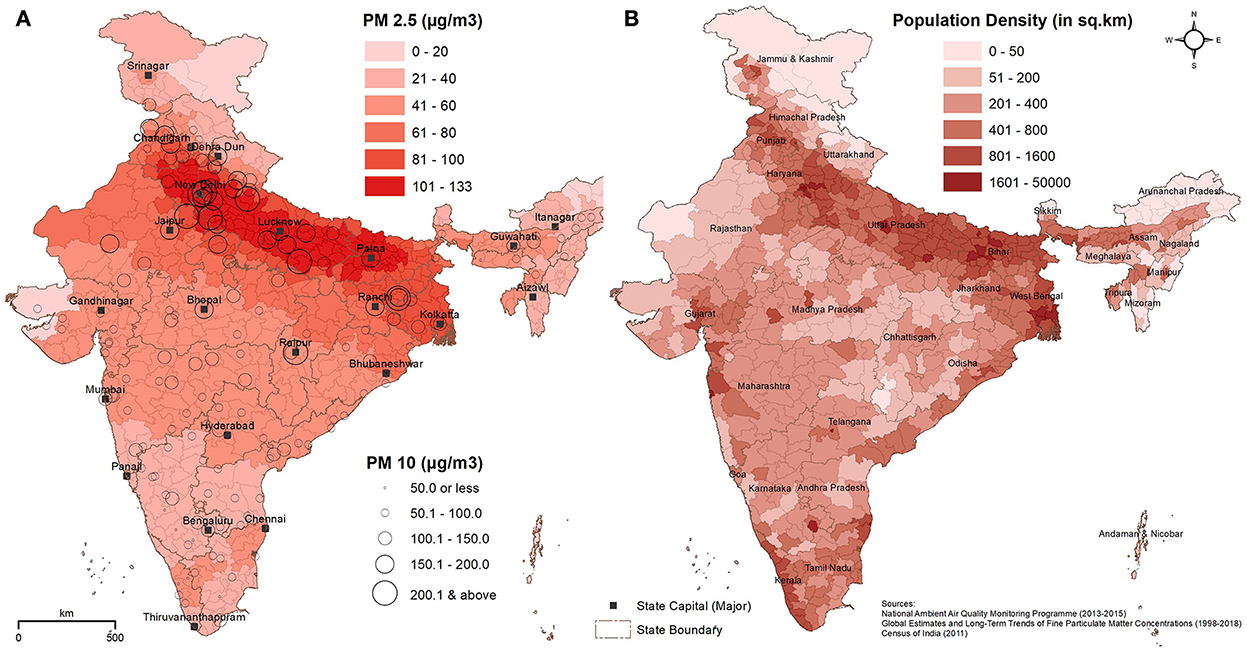
Figure 2. Spatial distribution of (A) ambient air pollutants PM2.5 (μg/m3) and PM10 (μg/m3), and (B) population density (persons/km2). The darker red and brown shades in the maps denote higher PM2.5 and population density, respectively. The higher concentrations of PM10 in the major cities of India are represented by larger circles.
The density of the population (persons/km2) at the district level is shown in Figure 2B. In addition to megacities of India, such as Mumbai, Kolkata, Delhi, Chennai, Bengaluru, and Hyderabad, the most populous districts are found in the states of Uttar Pradesh, Punjab, Bihar, Jammu and Kashmir, and West Bengal, with a density of >800 persons per km2.
Spatial distribution of significant household, children, and demography factors
The district-wise pan-India distribution of significant household, children, and demographic factors is shown in Figures 3A–D. The usage of clean cooking fuel across different districts of India is shown in Figure 3A. Clean fuel includes the use of electricity, LPG/natural gas, or biogas in the household. The district-level data showed that the mean usage of clean fuel for cooking was 37.5%. The class interval of 0.0–20 (%) indicated the districts with the lowest usage of clean fuel, and these districts were predominantly in the north and eastern parts of India, comprising the states of Uttar Pradesh, Madhya Pradesh, Chhattisgarh, Bihar, Jharkhand, Odisha, West Bengal, Assam, and Meghalaya. Clean fuel usage was high in many districts of South India, especially in the states of Tamil Nadu, Kerala, Andhra Pradesh, and Maharashtra.
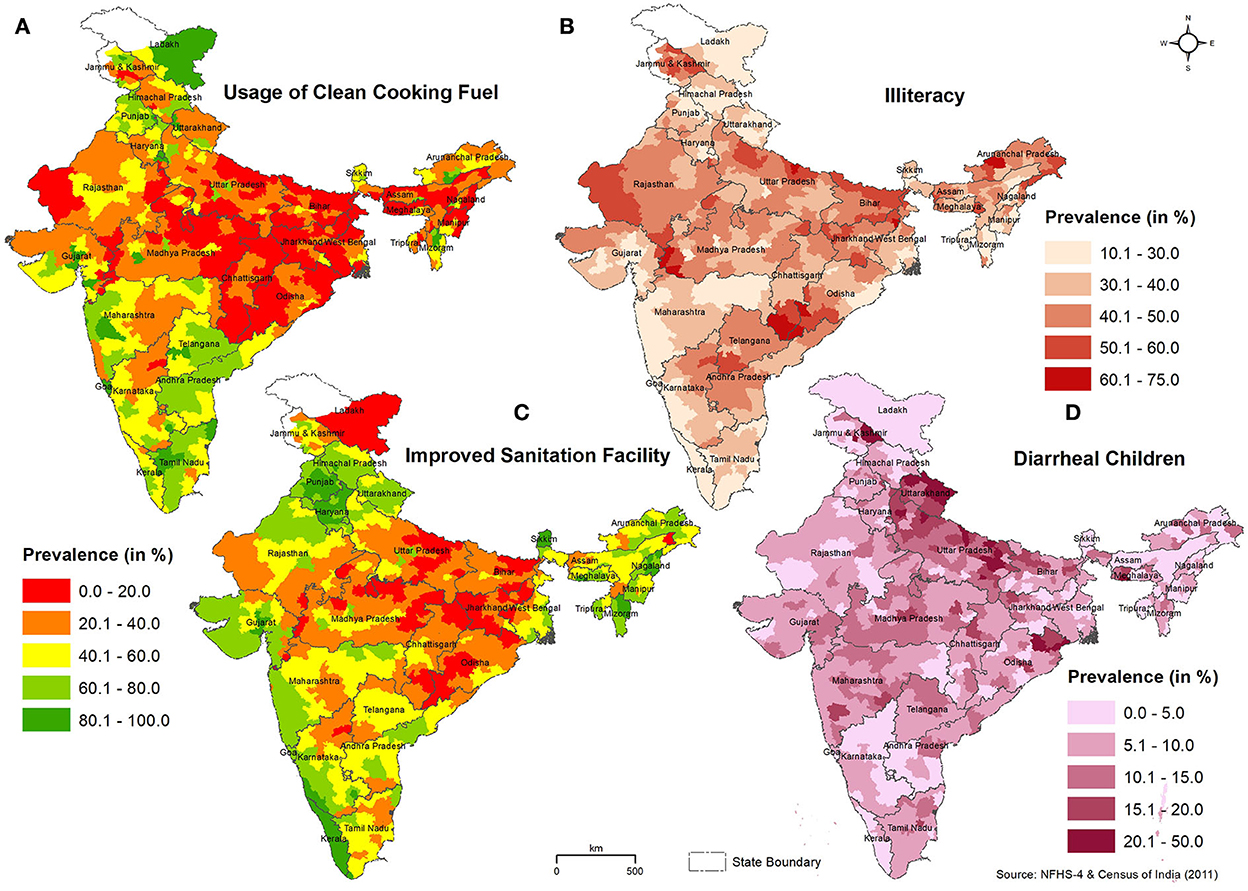
Figure 3. Spatial pattern of (A) usage of clean cooking fuel, (B) illiteracy rate, (C) improved sanitation facility, and (D) children with diarrhea in India. The district-wise percentage value of each parameter is classified into five classes.
The spatial pattern of the illiteracy rate is shown in Figure 3B. The Census of India (2011) data showed that the average illiteracy rate in Indian districts was 37.6%. Except for Kerala and certain districts in Mizoram, the illiteracy rate across districts in India is more than 20%. Most of the districts in the northern states (Uttar Pradesh, Bihar, Rajasthan, Madhya Pradesh, and Jharkhand) have a higher illiteracy rate (>40%). The improved sanitation facility (non-shared toilet facilities in the households) at the district level across India is shown in Figure 3C. The average availability of improved sanitation facilities in Indian districts was 47.7%. Many districts in the ARI-prevalent states of Uttar Pradesh, Bihar, Jharkhand, Madhya Pradesh, and Odisha had a low prevalence of sanitation facilities, while states such as Kerala, Punjab, and Haryana had improved sanitation facilities. The prevalence of diarrhea among children in India was comparatively highest in several districts of Uttar Pradesh, Uttarakhand, and Bihar states and a few districts in the states of Jammu and Kashmir, Jharkhand, Meghalaya, Madhya Pradesh, and Maharashtra (Figure 3D).
Spatial distribution of smoking, a behavioral risk factor
The district-wise spatial distribution (%) of tobacco consumption among men and women is shown in Figure 4, and the state-wise distribution (%) of cigarettes and bidis, the two dominant types of smoking tobacco across the different states/UTs in India, is shown in Supplementary Figure S1. In addition to the northern-eastern (NE) states, the prevalence (>60%) of tobacco consumption by men was high in a majority of districts of Madhya Pradesh and Uttar Pradesh (Figure 4A). Tobacco consumption by women was >5% in the districts of the northern states of India (Figure 4B). Even though the national average of smoking/tobacco use in India was around 13%, the ARI-dominated northern (Jammu and Kashmir, Himachal Pradesh, Uttarakhand, and Haryana) and central (Madhya Pradesh) states showed >20% tobacco consumption (either in cigarettes or bidis, or both). All the NE states and West Bengal also reported a very high prevalence of smoking/tobacco consumption.
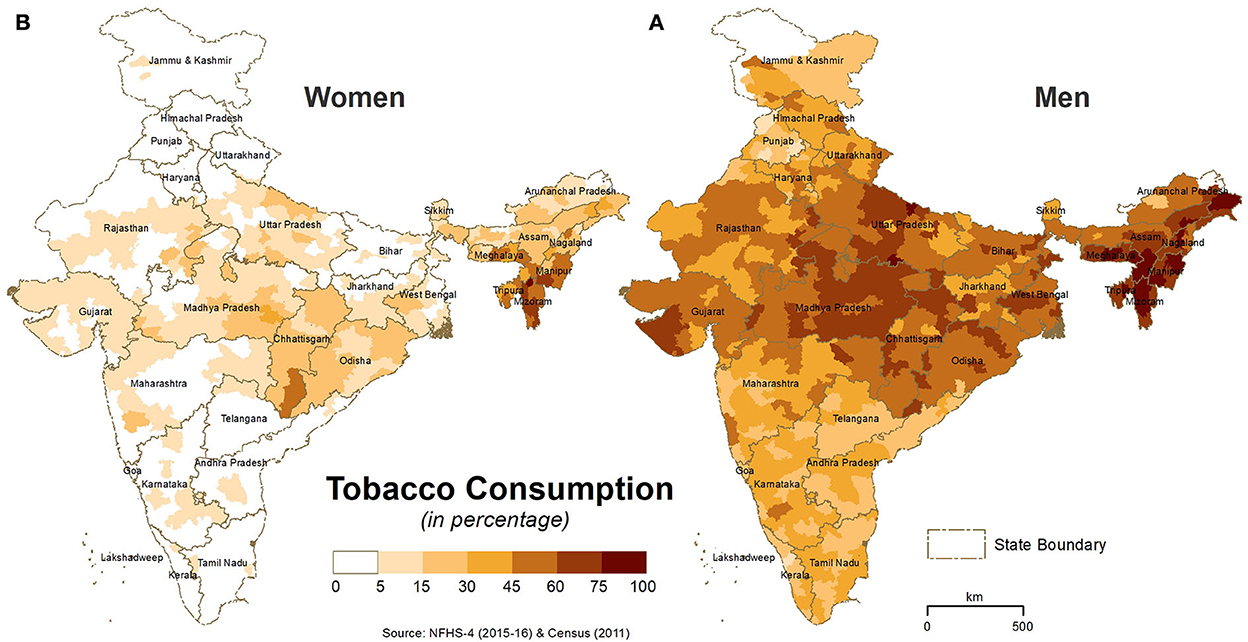
Figure 4. District-wise spatial distribution of (A) tobacco consumption by men and (B) tobacco consumption by women in India. The darker shades in the maps show higher tobacco consumption.
Distribution of risk factors in the ARI hotspots
The average distribution of risk factors in the major ARI hotspot states/UT of India is given in Table 1. The normalized ARI cases (ARI children per sq.km) in the hotspot states/UTs of Uttar Pradesh, Bihar, and Delhi were higher than average cases in all Indian districts. Delhi was 20 times higher than the national average. The average levels of environmental pollutants (PM2.5 and/ PM10) were higher in all the hotspot states, and in Delhi, it was more than two times the national average. The household variables such as clean cooking fuel, improved sanitation facilities, and status of children with diarrhea were worse in Bihar and Uttar Pradesh. When compared with the national average, men's tobacco consumption is also high in Bihar and Uttar Pradesh.
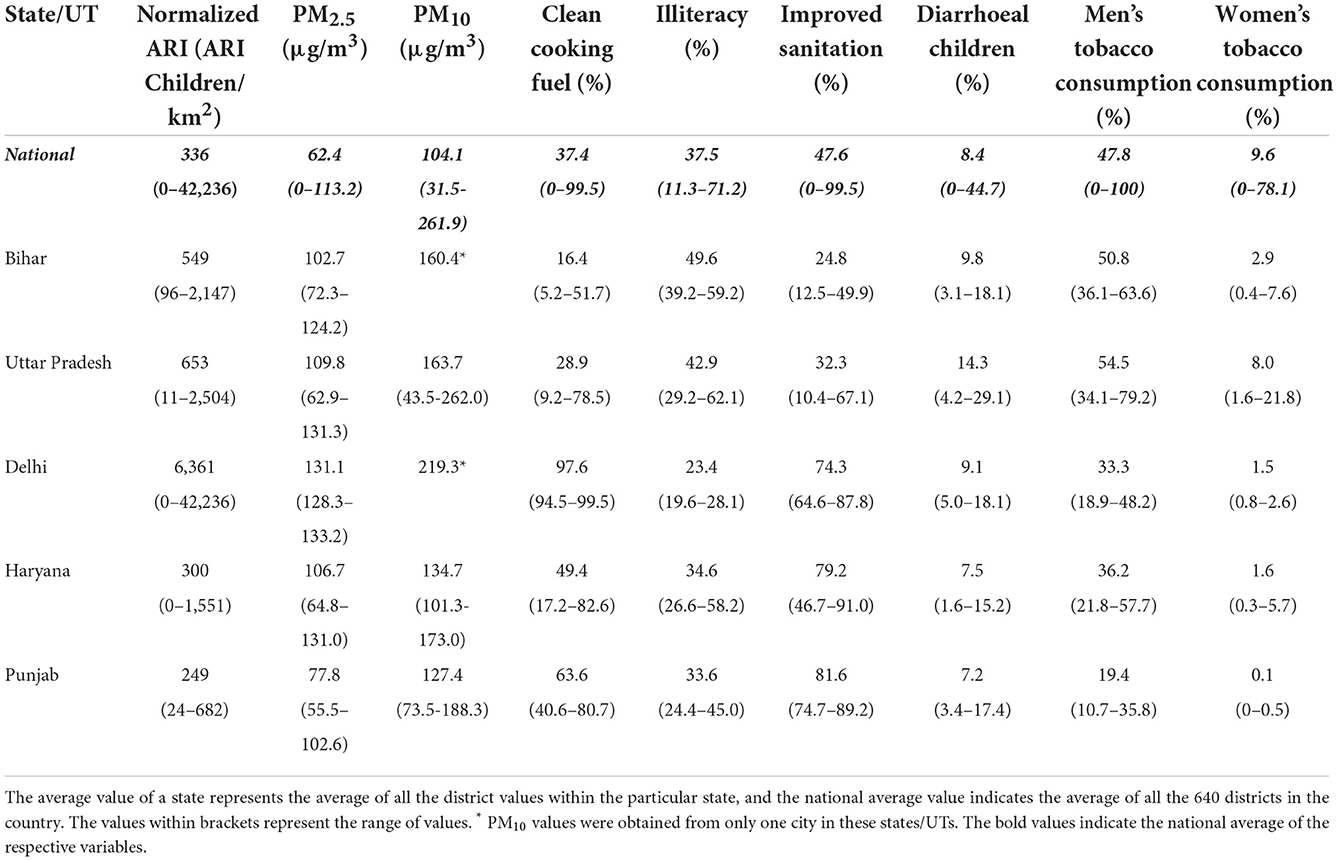
Table 1. Distribution of environmental, household, demographic, and behavioral variables in the ARI hotspot states/UTs of India.
Statistical analysis of the prevalence of ARI and associated factors
The multivariate association between the prevalence of ARI cases per 100 population and children, mothers, household, and environmental variables estimated by the quasi-Poisson regression model is shown in Table 2. The descriptive statistics of the dependent and independent variables are presented in Supplementary Table S1. There was a statistically significant association between ARI and PM2.5 μg/m3, percentage of illiterates, the percentage of children with diarrhea, and the mother's mean BMI. For each μg/m3 increase in the PM2.5 level, the rate of ARI cases increased by 0.6% (aIRR 1.006; 95% CI 1.003–1.008). The rate of ARI increased by 1.1% for each percentage increase in district-level illiteracy (aIRR 1.011; 95% CI 1.002–1.021). For each percentage point increase in diarrhea (aIRR 1.059; 95% CI 1.051–1.068), the rate of ARI increased by 5.9%. The rate of ARI increased by 1.3 times with an increase in each mean maternal BMI (aIRR 1.320, 95% CI: 1.206–1.445). The predictors (unclean fuel use %, improved sanitation %, percentage of poor households, mean household size, and the number of children ever born to a woman) were associated with the prevalence of ARI only in the univariate analysis.
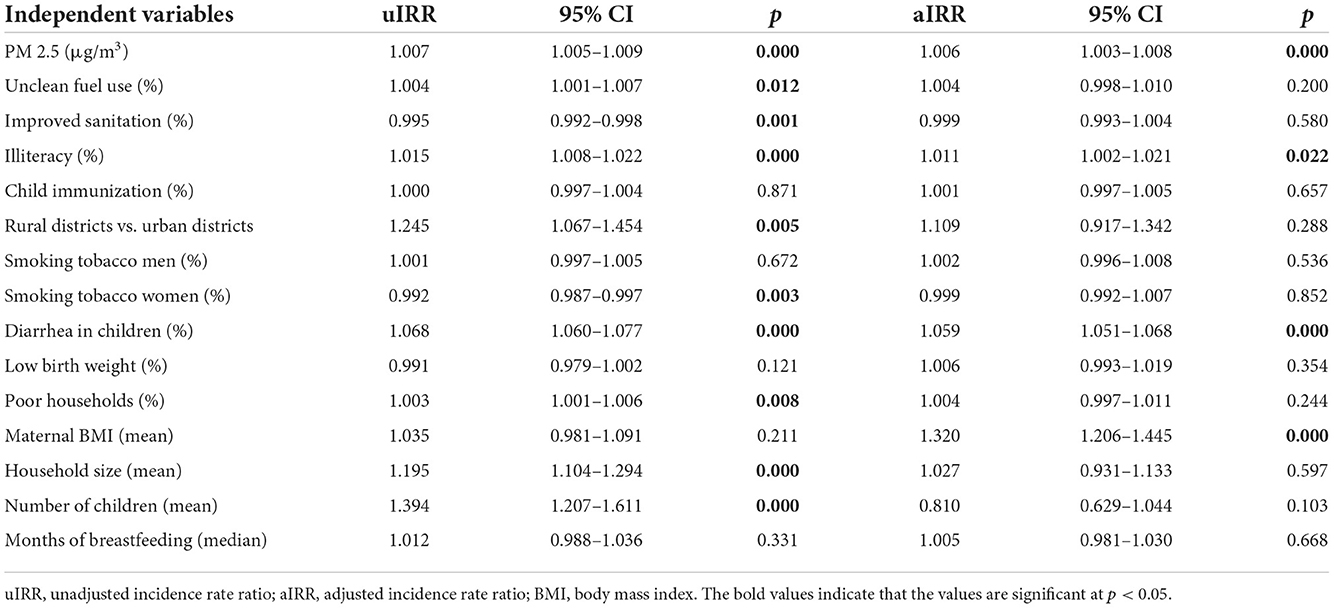
Table 2. Association between ARI cases and environmental, household, behavioral, and demographic variables.
Discussion
The two primary outcomes of the study were (i) mapping the spatial distribution and hotspots of ARI at the district level and (ii) mapping the environmental, household, demography, and behavioral risk factors across India to find their association with ARI. The hotspot districts of ARI cases were predominantly from the states/UTs of Uttar Pradesh, Bihar, Delhi, Haryana, and Punjab (Indo-Gangetic Plain inhabitants). Spatial mapping showed PM2.5, PM10, population density, tobacco use, clean fuel, and improved sanitation facilities to have a strong overlap with ARI, while statistical analysis showed PM2.5, population density, and improved sanitation facilities to have a significant association with ARI among children under 5 years in India.
The states of Uttar Pradesh, Punjab, Bihar, and West Bengal were densely populated (>800 persons/sq. km) and had a high incidence of ARI. The heavily populated megacities of Kolkata, Delhi, Mumbai, Hyderabad, and Chandigarh also showed a high incidence of ARI, suggesting a strong link between population density, urbanization, and ARI. Similar findings were reported in several studies conducted in India, where overcrowding was associated with the prevalence of ARI in children under 5 years (32, 33). Many megacities in India are densely populated and comprise many slums; Dharavi in Mumbai is the biggest slum in Asia. Slums characterized by poor urban populations, overcrowded with unhygienic conditions, and congested housing are favorable hotspots for many respiratory diseases (34). In Brazil, a high incidence of ARI has been reported in children from slums (34, 35). Furthermore, the high transmission of viruses in slums is facilitated by resource-limited facilities, lack of appropriate spacing, improper sanitation systems, poor nutritional status, and education (36).
Spatial mapping indicated strong overlap between environmental pollutants (PM2.5 and PM10) and ARI incidence in children. In this study, the entire Great Plains of India comprising the Indus, Ganges, and Brahmaputra floodplains in the north, covering the states/UTs of Punjab, Haryana, Delhi, Uttar Pradesh, and Bihar, showed alarming concentrations (>100 μg/m3) of PM2.5 and (>150 μg/m3) PM10. Importantly, these states/UTs also showed a very high incidence of ARI, indicating a strong link between PM2.5, PM10, and ARI. The risk of ARI was suggested to increase by 12%; for every 10 μgm, there was a 3 μg/m3 rise in PM2.5 (37). The quasi-Poisson regression model based on district-level data showed a 1.7% rise in the number of ARI cases for each additional unit increase in PM2.5 levels. Vehicular and industrial pollution, agricultural crop burning, solid fuel cookstove use, and household tobacco use were the primary sources of PM2.5 and were associated with increased hospitalization related to adverse respiratory conditions (16). The highly productive and fertile Indo-Gangetic basin supports more than 200 million lives and hosts >10% of India's coal-fired power generation plants. The entire region has high levels of nitrogen and sulfur oxides, which lead to increased particulate matter suspensions in the air and respiratory diseases (38). Agricultural crop residue burning (ACRB) in northern India (Haryana and Punjab) was a major contributor to PM2.5, and the downwind spiked PM2.5 levels in Delhi to ~20 times the permissible concentration specified by the WHO (8). In areas where ACRB is intense, there was a three-fold increase in ARI, and children under 5 years were the most vulnerable (8). The increased levels of PM2.5 had a significant association with population density (39). Spatial analysis indicated that the heavily populated states, particularly in the Indo-Gangetic plains, to have high concentrations (>100 μg/m3) of PM2.5, suggesting the strong interplay between population density and increased PM2.5 levels in increasing the prevalence of ARI among children under 5 years in India.
Diarrhea is significantly associated with ARI in children under 5 years. Acute lower respiratory tract infections (ALRIs) and diarrhea are the major causes of morbidity and mortality among children under 5 years (40). A study conducted among infants aged 0–23 months in Pakistan reported children comorbid with diarrhea to have higher odds of ARI (41). A quantitative analysis among Nepali and Indian children found the incidence of ARI to increase when an episode of diarrhea occurred within 28 days before the onset of ARI (40). Similarly, in Ghana, within 2–4 weeks of the occurrence of diarrhea, the risk of ALRI substantially increased among the children (42). A previous study showed that diarrhea led to acute loss of micronutrients, dehydration, and stresses in the immune system, resulting in the increased risk of ALRI (42). The body mass index of the mother was also associated with the increased risk of ARI among children under 5 years in India. Similar observations were reported by Rajappan et al. (43), where high BMI of the mother was associated with increased risks of wheezing, prolonged cough, and lower respiratory tract infection in their children. A significant association between pre-pregnancy maternal obesity and asthma and current wheezing in 7–8 years children was reported in a development study cohort in Amsterdam (44). Maternal obesity was found to affect the development of the lower airway tract in infants, and the alterations in airway branching may result in an increased risk of respiratory infections (43).
A strong spatial association between the usage of unclean cooking fuel and the hotspots of ARI was observed. The results from the univariate analysis also showed a significant association between the prevalence of ARI and unclean fuel use. Household air pollution (HAP), majorly contributed by the use of coal, wood, charcoal, animal dung, and crop residues for cooking and heating, was identified as a major cause of respiratory illness and death in children under 5 years in India (45). Children under 5 years were found to be highly vulnerable to HAP if they spend a considerable amount of time with their mothers in the kitchen (46, 47). An estimated 3 billion people, especially from low- and middle-income countries (LMICs), cook with solid fuels, which are the primary sources of household air pollution (HAP) (46). In India, in 2017, an estimated 55% of the population used solid fuels for cooking (48). The ARI hotspots in India, clustered primarily in central and northern belts of India, pointed toward the use of unclean cooking fuel in these states. The use of solid fuel was relatively higher (≥80%) in north and central India (Bihar, Uttar Pradesh, Madhya Pradesh, Jharkhand, Chhattisgarh) and some states in the east (Odisha and West Bengal) and the north-east (Assam and Meghalaya). Among the states that used high solid fuel, Uttar Pradesh and Bihar reported a >5% ARI incidence (>10 children/km2), while Jharkhand and West Bengal reported a >2% incidence (2–5 children/km2). Also, the prevalence of ARI (persons per sq. km) was observed to be relatively higher in these states. A similar trend in the spatial distribution in the increased PM2.5 level (101–133 ug/m3) was observed in the central and northern belts, especially in New Delhi, Uttar Pradesh, and Bihar. The WHO guideline for 24 hours mean PM2.5 is 25 μg/m3. However, in India, HAP as high as 609 μg/m3 has been recorded in the kitchen of rural households (47). A recent Indian study that utilized NFHS-4 datasets showed that households using unclean cooking fuel, households without separate kitchens, and smoking inside the house increased the likelihood of ARI in children under 5 years presumably due to indoor air pollution (49). Similarly, a prospective case–control study in South India (50) and a prospective observational study in rural central India (6) have documented the association between indoor air pollution and the risk of ARI in children. HAP exposure–response studies in other LMICs, such as Guatemala and Nepal, have also shown a direct association between HAP and ARI (51, 52). In order to promote the use of clean cooking fuel, several initiatives were introduced by the Indian government, including the Pradhan Mantri Ujjwala Yojana scheme, giving free liquid petroleum gas (LPG) connection to over 80 million households below the poverty line (53) and is in the process of replacing solid cooking fuel for cooking with LPG in 80% of the households by 2019 (54).
In most ARI hotspot states, cigarettes and bidis are widely smoked. The use of bidi is very high in the states of West Bengal, Himachal Pradesh, Haryana, Uttarakhand, and Madhya Pradesh, which are also the hotspot states of ARI. Tobacco smoking, contributing majorly to indoor air pollution, is an important risk factor for ARI (55). In a cross-sectional study conducted in India, the analysis of NFHS-4 data indicated that indoor smoking increased ARI susceptibility in children under 5 years (49). Particulate matter is one of the major toxic components found in tobacco smoke. Fractions of PM10 and PM2.5 deposit and retain in the respiratory tract (56), and long-term exposure to PM2.5 increases the risk of ARI in children (57).
This study found most districts, including those with a higher rate of the prevalence of ARI, lack access to improved sanitation facilities. When mapped for sanitation facilities, the ARI hotspot states of Uttar Pradesh, Bihar, and Madhya Pradesh had relatively lower sanitation facilities, while Uttarakhand, Punjab, Himachal Pradesh, and Haryana, and the other ARI hotspots ranked higher in the sanitation levels. A similar observation was made by Reese et al. in their matched cohort study carried out in Odisha, India, which reported no reduction in ARI on improved water and sanitation intervention (58). On the contrary, several randomized controlled trials showed a strong association between hygiene interventions and reduction in ARI symptoms in urban children of LMICs (59). A randomized control trial carried out in Bangladesh showed a reduced prevalence of reported ARI in the household that received sanitation intervention (latrines, potties, scoops, chlorinated drinking water, handwashing alone, or in combination with nutritional supplements) compared with the control group (17). Similarly, the analysis of Demographic Health Survey (DHS) data in Bangladesh showed that a lack of improved water, sanitation, and hygiene facilities was associated with higher odds of ARI in children under 5 years (60). Statistical analysis in this study showed that improved sanitation facilities were associated with a reduction in the rate of ARI, which is in line with previous findings.
This study has its limitations and challenges. Importantly, the study results are not causative and reflect only associations between the independent variables and ARI. The statistical analysis was challenging as the datasets were aggregated from multiple sources (NFHS-4, Census of India, satellite products, and ground-based stations). Few of the independent variables were self-reported, and the respondents may have given answers that are generally desirable, especially regarding cooking fuel and improved sanitation.
Conclusion
Population density, environmental pollution (PM2.5 and PM10), comorbidity of diarrhea, maternal BMI, and sanitation were found to be significantly associated with ARI in children under 5 years in India; most of the ARI hotspot states with a higher population density exhibited a relatively higher level of PM2.5. Among the household factors, the use of clean cooking fuel, poor sanitation, tobacco consumption, and illiteracy rate shared a strong spatial association with ARI in many hotspot districts, suggesting a synergistic role for multiple variables in causing ARI. Overall, this study provides important insights into the spatial distribution of ARI hotspots and associated risk factors at the district level across India. To draw decisive inferences, more research and modeling studies are required, especially in the hotspot states/UTs, to support policymakers and stakeholders to formulate a comprehensive action plan to reduce ARI in children.
Data availability statement
Publicly available datasets were analyzed in this study. This data can be found here: https://www.dhsprogram.com.
Ethics statement
The studies involving human participants were reviewed and approved by Institutional Review Board of International Institute for Population Sciences, Mumbai. Written informed consent to participate in this study was provided by the participants' legal guardian/next of kin.
Author contributions
KB and PB designed the study and wrote the initial manuscript. KB, NA, and PB collected the data. KB, KP, NK, NA, DS, and PB analyzed the data. KB, NK, SC, DS, MK, RD, MJ, SB, KP, SS, and PB interpreted the data. All authors reviewed and finalized the manuscript.
Acknowledgments
We thank the DHS for providing the datasets for analysis.
Conflict of interest
The authors declare that the research was conducted in the absence of any commercial or financial relationships that could be construed as a potential conflict of interest.
Publisher's note
All claims expressed in this article are solely those of the authors and do not necessarily represent those of their affiliated organizations, or those of the publisher, the editors and the reviewers. Any product that may be evaluated in this article, or claim that may be made by its manufacturer, is not guaranteed or endorsed by the publisher.
Supplementary material
The Supplementary Material for this article can be found online at: https://www.frontiersin.org/articles/10.3389/fpubh.2022.906248/full#supplementary-material
Supplementary Figure S1. State-wise spatial distribution of (A) cigarettes and (B) bidis (hand-rolled tobacco product) in India. The darker red shades in the maps show higher tobacco consumption.
Supplementary Table S1. Descriptive statistics of the dependent and independent variables.
Abbreviations
ARI, acute respiratory infection; LRI, lower respiratory infections; PM, particulate matter; NFHS, National Family Health Survey; DHS, Demographic and Health Survey; UT, union territory; AOD, aerosol optical depth; GIS, geographic information system; NCT, National Capital Region; ACRB, agricultural crop residue burning; HAP, household air pollution; LPG, liquid petroleum gas.
References
1. Ferkol T, Schraufnagel D. The global burden of respiratory disease. Ann Am Thorac Soc. (2014) 11:404–6. doi: 10.1513/AnnalsATS.201311-405PS
2. Collaborators GL. Estimates of the global, regional, and national morbidity, mortality, and aetiologies of lower respiratory tract infections in 195 countries: a systematic analysis for the Global Burden of Disease Study 2015. Lancet Infect Dis. (2017) 17:1133–61. doi: 10.1016/S1473-3099(17)30396-1
3. Mortality GBD Causes Causes of Death C. Global, regional, and national age-sex specific all-cause and cause-specific mortality for 240 causes of death, 1990–2013: a systematic analysis for the Global Burden of Disease Study 2013. Lancet. (2015) 385:117–71. doi: 10.1016/S0140-6736(14)61682-2
4. Liu L, Oza S, Hogan D, Chu Y, Perin J, Zhu J, et al. Global, regional, and national causes of under-5 mortality in 2000-15: an updated systematic analysis with implications for the Sustainable Development Goals. Lancet. (2016) 388:3027–35. doi: 10.1016/S0140-6736(16)31593-8
5. Liu L, Chu Y, Oza S, Hogan D, Perin J, Bassani DG, et al. National, regional, and state-level all-cause and cause-specific under-5 mortality in India in 2000-15: a systematic analysis with implications for the Sustainable Development Goals. Lancet Global Health. (2019) 7:e721–34. doi: 10.1016/S2214-109X(19)30080-4
6. Arlington L, Patel AB, Simmons E, Kurhe K, Prakash A, Rao SR, et al. Duration of solid fuel cookstove use is associated with increased risk of acute lower respiratory infection among children under six months in rural central India. PLoS ONE. (2019) 14:e0224374. doi: 10.1371/journal.pone.0224374
7. Bonu S, Rani M, Jha P, Peters DH, Nguyen SN. Household tobacco and alcohol use, and child health: an exploratory study from India. Health Policy. (2004) 70:67–83. doi: 10.1016/j.healthpol.2004.02.003
8. Chakrabarti S, Khan MT, Kishore A, Roy D, Scott SP. Risk of acute respiratory infection from crop burning in India: estimating disease burden and economic welfare from satellite and national health survey data for 250 000 persons. Int J Epidemiol. (2019) 48:1113–24. doi: 10.1093/ije/dyz022
9. Million Death Study C, Bassani DG, Kumar R, Awasthi S, Morris SK, Paul VK, et al. Causes of neonatal and child mortality in India: a nationally representative mortality survey. Lancet. (2010) 376:1853–60. doi: 10.1016/S0140-6736(10)61461-4
10. Awasthi S, Glick HA, Fletcher RH. Effect of cooking fuels on respiratory diseases in preschool children in Lucknow, India. Am J Trop Med Hyg. (1996) 55:48–51. doi: 10.4269/ajtmh.1996.55.48
11. Mishra V. Indoor air pollution from biomass combustion and acute respiratory illness in preschool age children in Zimbabwe. Int J Epidemiol. (2003) 32:847–53. doi: 10.1093/ije/dyg240
12. Mishra V, Smith KR, Retherford RD. Effects of cooking smoke and environmental tobacco smoke on acute respiratory infections in young Indian children. Popul Environ. (2005) 26:375–96. doi: 10.1007/s11111-005-0005-y
13. Upadhyay AK, Singh A, Kumar K, Singh A. Impact of indoor air pollution from the use of solid fuels on the incidence of life threatening respiratory illnesses in children in India. BMC Public Health. (2015) 15:300. doi: 10.1186/s12889-015-1631-7
14. WHO. Household Air Pollution and Health. (2018). Available online at: https://www.who.int/news-room/fact-sheets/detail/household-air-pollution-and-health#:~:text=Close%20to%20half%20of%20deaths,inhaled%20from%20household%20air%20pollution (accessed April 13, 2020).
15. Pope CA 3rd, Dockery DW. Health effects of fine particulate air pollution: lines that connect. J Air Waste Manag Assoc. (2006) 56:709–42. doi: 10.1080/10473289.2006.10464485
16. Chen J, Li C, Ristovski Z, Milic A, Gu Y, Islam MS, et al. A review of biomass burning: emissions and impacts on air quality, health and climate in China. Sci Total Environ. (2017) 579:1000–34. doi: 10.1016/j.scitotenv.2016.11.025
17. Ashraf S, Islam M, Unicomb L, Rahman M, Winch PJ, Arnold BF, et al. Effect of improved water quality, sanitation, hygiene and nutrition interventions on respiratory illness in young children in rural Bangladesh: a multi-arm cluster-randomized controlled trial. Am J Trop Med Hyg. (2020) 102:1124–30. doi: 10.4269/ajtmh.19-0769
18. Trinies V, Garn JV, Chang HH, Freeman MC. The impact of a school-based water, sanitation, and hygiene program on absenteeism, diarrhea, and respiratory infection: a matched-control trial in Mali. Am J Trop Med Hyg. (2016) 94:1418–25. doi: 10.4269/ajtmh.15-0757
19. International Institute for Population Sciences. National Family Health Survey (NFHS-3), India, 2005–06. Mumbai: International Institute for Population Sciences (IIPS) (2009).
20. UN Development Programme. Millenium Development Goals. (2015). Available online at: https://www.in.undp.org/content/india/en/home/post-2015/mdgoverview.html (accessed April 13, 2020).
21. UN General Assembly. Transforming Our World: The 2030 Agenda for Sustainable Development. New York: United Nations. (2015). Available online at: https://sustainabledevelopment.un.org/post2015/transformingourworld (accessed April 13, 2020).
22. International Institute for Population Sciences. National Family Health Survey, India. Available online at: http://rchiips.org/nfhs/index.shtml
23. Central Pollution Control Board, Govt. of India. Ministry of Environment, Forest and Climate Change. Available online at: https://cpcb.nic.in/index.php
24. Getis A, Cliff AD, Ord JK. Spatial autocorrelation London: Pion. Prog Human Geogr. (1995) 19:245–9. doi: 10.1177/030913259501900205
25. Getis A, Ord JK. The analysis of spatial association by use of distance statistics. Geogr Anal. (1992) 24:189–206. doi: 10.1111/j.1538-4632.1992.tb00261.x
26. Kun Z, Songlin Z. Testing simulated positive spatial autocorrelation by Getis-Ord general G. In: 23rd International Conference on Geoinformatics. (2015), 19–21 June 2015. p. 1–4.
27. Songchitruksa P, Zeng X. Getis–Ord spatial statistics to identify hot spots by using incident management data. Transp. Res. Record. (2010) 2165:42–51. doi: 10.3141/2165-05
28. Besag J, Newell J. The detection of clusters in rare diseases. J. R. Stat. Soc. Ser. A. (1991) 154:143–55. doi: 10.2307/2982708
29. Ord JK, Getis A. Local spatial autocorrelation statistics: distributional issues and an application. Geogr Anal. (1995) 27:286–306. doi: 10.1111/j.1538-4632.1995.tb00912.x
30. Gi* GO. How Hot Spot Analysis (Getis-Ord Gi*) Works. (2018). Available online at: https://pro.arcgis.com/en/pro-app/tool-reference/spatial-statistics/h-how-hot-spot-analysis-getis-ord-gi-spatial-stati.htm (accessed February 1, 2020).
31. Harris NL, Goldman E, Gabris C, Nordling J, Minnemeyer S, Ansari S, et al. Using spatial statistics to identify emerging hot spots of forest loss. Environ. Res. Lett. (2017) 12:024012. doi: 10.1088/1748-9326/aa5a2f
32. Savitha AK, Gopalakrishnan S. Determinants of acute respiratory infections among under five children in a rural area of Tamil Nadu, India. J Fam Med Prim Care. (2018) 7:1268–73. doi: 10.4103/jfmpc.jfmpc_131_18
33. Hasan MM, Saha KK, Yunus RM, Alam K. Prevalence of acute respiratory infections among children in India: regional inequalities and risk factors. Matern Child Health J. (2022). doi: 10.1007/s10995-022-03424-3
34. Goes LGB, Zerbinati RM, Tateno AF, de Souza AV, Ebach F, Corman VM, et al. Typical epidemiology of respiratory virus infections in a Brazilian slum. J Med Virol. (2020) 92:1316–21. doi: 10.1002/jmv.25636
35. Castro MX, Soares AM, Fonseca W, Rey LC, Guerrant RL, Lima AA. Common infectious diseases and skin test anergy in children from an urban slum in northeast Brazil. Braz J Infect Dis. (2003) 7:387–94. doi: 10.1590/s1413-86702003000600006
36. Rahman SR, Ahmed MF, Islam MA, Majibur Rahman M. Effect of risk factors on the prevalence of influenza infections among children of slums of Dhaka city. Springerplus. (2016) 5:602. doi: 10.1186/s40064-016-2275-5
37. Mehta S, Shin H, Burnett R, North T, Cohen AJ. Ambient particulate air pollution and acute lower respiratory infections: a systematic review and implications for estimating the global burden of disease. Air Qual Atmos Health. (2013) 6:69–83. doi: 10.1007/s11869-011-0146-3
38. Srivastava AK, Sagnik D, Tripathi SN. Aerosol characteristics over the Indo-Gangetic basin: implications to regional climate. Atmos Aerosols. (2012) 10:47782. doi: 10.5772/47782
39. Kim MJ, Chang YS, Kim SM. Impact of income, density, and population size on PM2.5 pollutions: a scaling analysis of 254 large cities in six developed countries. Int J Environ Res Public Health. (2021) 18:9019. doi: 10.3390/ijerph18179019
40. Walker CL, Perin J, Katz J, Tielsch JM, Black RE. Diarrhea as a risk factor for acute lower respiratory tract infections among young children in low income settings. J Glob Health. (2013) 3:010402. doi: 10.7189/jogh.03.010402
41. Mir F, Ariff S, Bhura M, Chanar S, Nathwani AA, Jawwad M, et al. Risk factors for acute respiratory infections in children between 0 and 23 months of age in a peri-urban district in Pakistan: a matched case-control study. Front Pediatr. (2021) 9:704545. doi: 10.3389/fped.2021.704545
42. Schmidt WP, Cairncross S, Barreto ML, Clasen T, Genser B. Recent diarrhoeal illness and risk of lower respiratory infections in children under the age of 5 years. Int J Epidemiol. (2009) 38:766–72. doi: 10.1093/ije/dyp159
43. Rajappan A, Pearce A, Inskip HM, Baird J, Crozier SR, Cooper C, et al. Maternal body mass index: relation with infant respiratory symptoms and infections. Pediatr Pulmonol. (2017) 52:1291–9. doi: 10.1002/ppul.23779
44. van Ginkel MW, London SJ, Magnus MC, Gademan MG, Vrijkotte TG. A study on mediation by offspring BMI in the association between maternal obesity and child respiratory outcomes in the Amsterdam born and their development study cohort. PloS ONE. (2015) 10:e0140641. doi: 10.1371/journal.pone.0140641
45. Naz S, Page A, Agho KE. Household air pollution and under-five mortality in India (1992-2006). Environ Health. (2016) 15:54. doi: 10.1186/s12940-016-0138-8
46. WHO. Household Air Pollution and Health. (2021). Available online at: https://www.who.int/en/news-room/fact-sheets/detail/household-air-pollution-and-health (accessed October 1, 2021).
47. Balakrishnan K, Ghosh S, Ganguli B, Sambandam S, Bruce N, Barnes DF, et al. State and national household concentrations of PM2.5 from solid cookfuel use: results from measurements and modeling in India for estimation of the global burden of disease. Environ Health. (2013) 12:77. doi: 10.1186/1476-069X-12-77
48. India State-Level Disease Burden Initiative Air Pollution. The impact of air pollution on deaths, disease burden, and life expectancy across the states of India: the Global Burden of Disease Study 2017. Lancet Planetary Health. (2019) 3:e26–e39. doi: 10.1016/S2542-5196(18)30261-4
49. Mondal D, Paul P. Effects of indoor pollution on acute respiratory infections among under-five children in India: evidence from a nationally representative population-based study. PLoS ONE. (2020) 15:e0237611. doi: 10.1371/journal.pone.0237611
50. Ramesh Bhat Y, Manjunath N, Sanjay D, Dhanya Y. Association of indoor air pollution with acute lower respiratory tract infections in children under 5 years of age. Paediatr Int Child Health. (2012) 32:132–5. doi: 10.1179/2046905512Y.0000000027
51. Smith KR, McCracken JP, Weber MW, Hubbard A, Jenny A, Thompson LM, et al. Effect of reduction in household air pollution on childhood pneumonia in Guatemala (RESPIRE): a randomised controlled trial. Lancet. (2011) 378:1717–26. doi: 10.1016/S0140-6736(11)60921-5
52. Bates MN, Pokhrel AK, Chandyo RK, Valentiner-Branth P, Mathisen M, Basnet S, et al. Kitchen PM2.5 concentrations and child acute lower respiratory infection in Bhaktapur, Nepal: The importance of fuel type. Environ Res. (2018) 161:546–53. doi: 10.1016/j.envres.2017.11.056
53. Ministry of Petroleum Natural Gas. Official Website of PradhanMantriUjjwalaYojana. Available online at: http://www.pmujjwalayojana.com/ (accessed April 30, 2021).
54. Times of India. 10 Crore LPG Connections Given in 4 Years Against 13 Crore in 6 Decades. (2018). Available online at: https://timesofindia.indiatimes.com/india/pm-modi-10-crore-lpg-connections-given-in-4-years-against-13-crore-in-6-decades/articleshow/64350785.cms (accessed August 2, 2018).
55. Mueller D, Uibel S, Braun M, Klingelhoefer D, Takemura M, Groneberg DA. Tobacco smoke particles and indoor air quality (ToPIQ)—the protocol of a new study. J Occup Med Toxicol. (2011) 6:35. doi: 10.1186/1745-6673-6-35
56. Pinkerton KE, Green FH, Saiki C, Vallyathan V, Plopper CG, Gopal V, et al. Distribution of particulate matter and tissue remodeling in the human lung. Environ Health Perspect. (2000) 108:1063–9. doi: 10.1289/ehp.001081063
57. Larson PS, Espira L, Glenn BE, Larson MC, Crowe CS, Jang S, et al. Long-term PM2.5 exposure is associated with symptoms of acute respiratory infections among children under five years of age in Kenya, 2014. Int J Environ Res Public Health. (2022) 19:2525. doi: 10.3390/ijerph19052525
58. Reese H, Routray P, Torondel B, Sinharoy SS, Mishra S, Freeman MC, et al. Assessing longer-term effectiveness of a combined household-level piped water and sanitation intervention on child diarrhoea, acute respiratory infection, soil-transmitted helminth infection and nutritional status: a matched cohort study in rural Odisha, India. Int J Epidemiol. (2019) 48:1757–67. doi: 10.1093/ije/dyz157
59. McGuinness SL, Barker SF, O'Toole J, Cheng AC, Forbes AB, Sinclair M, et al. Effect of hygiene interventions on acute respiratory infections in childcare, school and domestic settings in low- and middle-income countries: a systematic review. Trop Med Int Health: TM and IH. (2018) 23:816–33. doi: 10.1111/tmi.13080
Keywords: ARI, PM2.5 and PM10, unclean cooking fuel, Getis-Ord Gi* spatial statistic, NFHS-4
Citation: Balasubramani K, Prasad KA, Kodali NK, Abdul Rasheed NK, Chellappan S, Sarma DK, Kumar M, Dixit R, James MM, Behera SK, Shekhar S and Balabaskaran Nina P (2022) Spatial epidemiology of acute respiratory infections in children under 5 years and associated risk factors in India: District-level analysis of health, household, and environmental datasets. Front. Public Health 10:906248. doi: 10.3389/fpubh.2022.906248
Received: 28 March 2022; Accepted: 07 November 2022;
Published: 13 December 2022.
Edited by:
Joao Sollari Lopes, National Statistical Institute of Portugal, PortugalReviewed by:
Santu Ghosh, St. John's Medical College, IndiaArnab Dey, University of California, San Diego, United States
Copyright © 2022 Balasubramani, Prasad, Kodali, Abdul Rasheed, Chellappan, Sarma, Kumar, Dixit, James, Behera, Shekhar and Balabaskaran Nina. This is an open-access article distributed under the terms of the Creative Commons Attribution License (CC BY). The use, distribution or reproduction in other forums is permitted, provided the original author(s) and the copyright owner(s) are credited and that the original publication in this journal is cited, in accordance with accepted academic practice. No use, distribution or reproduction is permitted which does not comply with these terms.
*Correspondence: Praveen Balabaskaran Nina, cHJhdmVlbi5uaW5hQGN1a2VyYWxhLmFjLmlu