 Chihong Zhao
 Bo Liu
 Jing Li
 Sisi Li
 Yan Liu2
 Yuanyuan Guo
 Xiumin Zhang
95% of researchers rate our articles as excellent or good
Learn more about the work of our research integrity team to safeguard the quality of each article we publish.
Find out more
ORIGINAL RESEARCH article
Front. Public Health , 11 July 2022
Sec. Occupational Health and Safety
Volume 10 - 2022 | https://doi.org/10.3389/fpubh.2022.883551
This article is part of the Research Topic Occupational Immunology: Current Knowledge and Future Perspectives View all 7 articles
In this study, a comprehensive evaluation of management for pathogenic microbiology laboratories is performed based on a combination of Technique for Order Preference by Similarity to an Ideal Solution (TOPSIS) and Rank Sum Ratio (RSR) methods; in addition, the basis for improving laboratory management is provided. Using the laboratory evaluation tool developed by World Health Organization and a combination of TOPSIS and RSR methods, a system of evaluation indicators for the management of Chinese pathogenic microbiology laboratories is established for comprehensively evaluating the pathogenic microbiology laboratories of seven provincial Centers for Disease Control and Prevention. The evaluation system includes 12 primary indicators and 37 secondary indicators. In terms of laboratory management, the seven laboratories were ranked as D, G, E, C, F, B, and A in descending order. None of these laboratories were evaluated as “good” or “poor.” One of the laboratories was marked as “relatively poor” (A), two as “medium” (B and F), and four as “relatively good” (C, E, G, and D). In this study, a method for evaluating laboratory management using the TOPSIS and RSR methods is proposed, and a basis for comprehensively evaluating laboratory management for pathogenic microbiology laboratories is provided to reflect management practices.
Emerging and re-emerging infectious diseases remain a major threat to human health (1). Since the beginning of the 21st century, the world has experienced major crises caused by infectious diseases, including the emergence of severe acute respiratory syndrome in 2003 (2), H5N1 influenza in 1997 and its re-emergence in 2003 (3, 4), H1N1 in 2009 (5), Middle East respiratory syndrome in 2012 (6), Ebola virus disease in West Africa in 2014 (7, 8), and Coronavirus disease in 2019 (9).
Laboratories play an important role in detecting outbreaks of highly infectious diseases, risk assessment, early warning, early response and notification, and monitoring and surveillance (10, 11). Laboratory management determines a laboratory's detection capacity, which directly affects the effectiveness of the prevention and control of infectious diseases. Laboratory capacity has been a part of comprehensive planning of national and international public health response plans and has been a critical component of International Health Regulations (12).
Laboratory management has been widely studied, and many international organizations and countries have issued guidelines from different perspectives. World Health Organization (WHO) published the first edition of Laboratory Biosafety Manual in 1983; its fourth edition was published in 2020 (13). The latest version of ISO/IEC 17025 General requirements for the competence of testing and calibration laboratories was published in 2017, which can be used by laboratory customers, regulatory authorities, accreditation bodies, and others for confirming or recognizing the competence of laboratories (14). The sixth edition of the Biosafety in Microbiology and Biomedical Laboratories in USA (15), second edition of the Canadian Biosafety Standard (16), and others are good guides for laboratory management. In China, the national standard, General Requirements for Laboratory Biosafety (GB19489), stipulates the general requirements for the facilities, equipment, and safety management in laboratories with different biosafety levels (17). In addition, the national standard, General Requirements for the Competence of Testing and Calibration Laboratories (GB/T27025), specifies the general requirements pertaining to competence, fair practice, and consistent operation of laboratories (18).
Laboratory management includes a wide range of aspects, such as system construction, management system, data, personnel, equipment, testing capacity, and consumables management. A laboratory must improve the management level in an all-round fashion to achieve the desired capacity and role. Shortcomings in any aspect of laboratory management can directly affect the efficiency of the laboratory.
Standardized assessment is key to the development of comprehensive and integrated laboratory management. Inadequacies in laboratory management can be determined through evaluation; targeted capacity enhancement can be performed. WHO developed a laboratory assessment tool (LAT) in (19). The LAT describes a general process for the assessment of laboratories and provides questionnaires to help in the assessment of the national laboratory system and individual laboratories. Fourteen regional medical science centers have been evaluated using the LAT to enhance the public health laboratory capacity in Thailand (20).
Based on WHO's LAT, a comprehensive evaluation index system suitable for China's actual situation is proposed in the present study. Appropriate dimensions are determined, and indicators are prioritized to evaluate the performance of laboratory management in an appropriate model while considering local conditions.
The combination of Technique for Order Preference by Similarity to an Ideal Solution (TOPSIS) and Rank Sum Ratio (RSR) methods are mature comprehensive evaluation methods. These methods have been employed in different evaluation research (21–27). The TOPSIS method is a technique for order preference according to similarity to the ideal solution. Based on the normalized raw data matrix, this method forms a space for both positive and negative ideal solutions of priority solutions. The solutions to be evaluated are regarded as points in space. The distance between a point and the positive and ideal solutions is obtained. This distance helps identify the relative closeness between the solution to be evaluated and the positive ideal solution and provides a basis for evaluating the advantages and disadvantages of this solution (28, 29). The RSR method is a comprehensive evaluation and analysis method proposed by the Chinese statistician, Professor Fengtiao Tian, in 1988. The RSR method involves a matrix of n rows and m columns. The dimensionless statistic, RSR, is obtained through rank transformation. Statistical parameter analysis is used for studying the distribution of RSR. The RSR value is used to directly rank evaluation objects, rank evaluation objects by level, or compare the confidence intervals of the RSR for each group.
In the present study, a model is proposed for evaluating the performance of laboratory management and the performance of seven provincial Centers for Disease Control and Prevention (CDCs) laboratory management in China is analyzed using TOPSIS and RSR methods.
Considering the regional economic development, local epidemics, as well as the prevention and control for infectious diseases, seven provincial CDCs—Guangxi, Guizhou, Yunnan, Hunan, Zhejiang, Guangdong, and Shanghai—represented by A, B, C, D, E, F, and G, respectively, were investigated.
The evaluation indicators adopted herein are based on the LAT developed by WHO (19). The final system of comprehensive evaluation indicators for the management of pathogenic microbiology laboratory was devised through literature reviews, research and brainstorming, and experts' opinions and suggestions that reflect China's practices. This system includes 12 primary indicators, namely, organizational operation and management, documentation, sample collection, processing and transportation, data and information, consumables and reagents, equipment, analysis and testing capacities, quality control, facilities, human resources, biological risks and public health functions, as well as 37 secondary indicators of external and internal communication (Table 1).
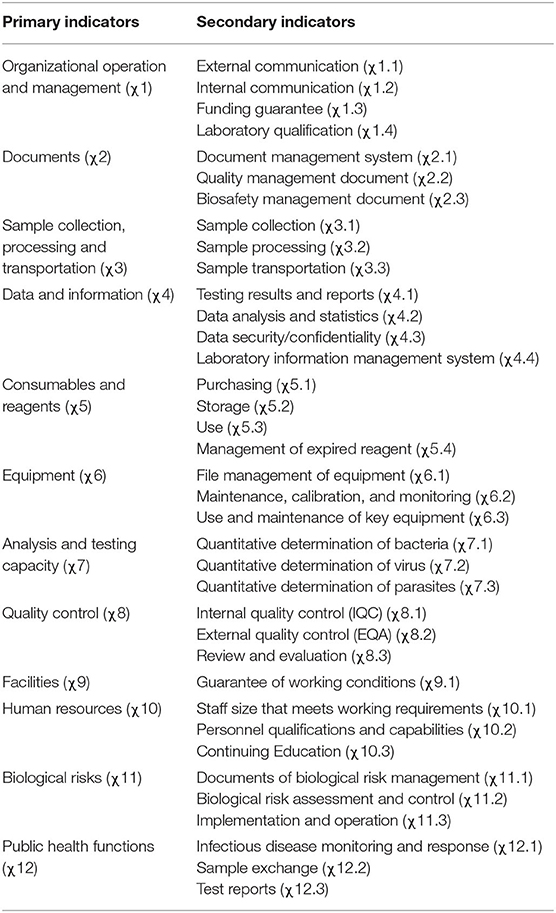
Table 1. Proposed system of evaluation of comprehensive indicators for management of pathogenic microbiology laboratories.
The questionnaires were filled by the CDCs as they sought information on a wide range of items and management of multiple departments. On-site reviews of the filled contents were performed by investigators. To ensure consistency in understanding and review, the team of investigators organized an intensive 2-day training courses for people who filled the questionnaires. During the process of filling in the questionnaires, telephone consultation service was provided. During on-site reviews, investigators conducted quality control of questionnaires through discussions and exchanges, document reviews, and laboratory inspections.
Weight determination methods can be divided into two categories. (1) Subjective weighting, wherein the original data is primarily generated through experts' empirical judgments. It includes the direct evaluation method, Delphi method, analytic hierarchy process, and gray correlation method. (2) Objective weighting, wherein the actual data of each indicator in the evaluation process constitutes the original data. It comprises the coefficient of variation, principal component analysis, entropy method, and critic method. The two types of weighting methods have their own advantages and disadvantages. In subjective weighting methods, experts can reasonably determine the order of weight coefficients of various indicators to resolve actual problems, but with high subjectivity. In contrast, objective weighting methods are based on objective data but introduce an inevitable defect that the determined weights might contradict the actual importance of the indicators (30, 31).
Herein, the gray correlation method and the coefficient of variation method were employed as the subjective and objective weighting methods, respectively. The combined weight of the indicators was obtained by calculating the subjective and objective weights on certain coefficients.
Basic steps:
(1) The same trending method was used for all the indicators.
(2) The original data matrix with the same trend was normalized.
In the equation, xij represents the value of the i-th evaluation object of the j-th indicator. The normalized matrix Z can be presented as
(3) According to the normalized matrix Z, the positive ideal (optimal vector) and negative ideal solutions (worst-case vector) were calculated as follows:
Positive ideal solution: .
Negative ideal solution: .
In these equations, i = 1, 2,…, n and j = 1, 2, …, m. and respectively represent the maximum and minimum values of the evaluation object of the j-th indicator.
(4) The weighted Euclidean distance between (positive ideal solution) and (negative ideal solution) for each indicator values of every laboratory were calculated as follows:
In these equations, ωj represents the weight coefficient of indicator j.
(5) The relative closeness between the positive ideal and negative ideal solutions as well as the indicator values for each laboratory were calculated as follows:
The value of Ci was set between 0 and 1. A Ci value close to 1 indicates a higher likelihood of positive ideal solution (optimal level), whereas a Ci value close to 0 indicates a higher likelihood of negative ideal solution (worst level).
(6) Sorting of evaluation objects
To rank each evaluation object, the evaluation effect was determined by calculating the Ci value.
Basic steps:
(1) Data matrix
m evaluation indicators of n evaluation objects were arranged into a data table with n rows and m columns. The weight for each indicators was not equal; as such, the weight coefficients of the indicators were listed in different rows.
(2) Rank
The evaluation objects were ranked according to each evaluation indicator: the better the situation, the higher the rank.
(3) Calculation of RSR
In a matrix with n rows and m columns, the RSR was calculated as follows:
In this equation, i = 1, 2, …, n and j = 1, 2, …, m. Rij represents the rank of the indicator in the i-th row and j-th column.
In case the weight of each evaluation indicator was different, the weighted rank sum ratio was calculated as follows:
In this equation, i = 1, 2, …, n and j = 1, 2, …, m. Rij represents the rank of indicator in the i-th row and j-th column, and Wj represents the weight of the j-th indicator, .
The RSR value was dimensionless. The minimum value was , and the maximum value was RSRmax = 1.
(4) Determination of RSR distribution
The distribution of RSR refers to the specific downward cumulative frequency of RSR values expressed in the probability unit (Probit). The method includes the following steps:
① Compile the RSR frequency distribution table, list the frequency of each group f, and calculate the cumulative frequency ∑f of each group.
② Determine the rank R and average rank of RSR in each group.
③ Calculate the downward cumulative frequency, .
④ Convert the percentage p to the Probit, which is the percentage ps corresponding to the standard normal deviation u plus 5.
(5) Calculation of the regression equation
Using the Probit corresponding to the cumulative frequency as the independent variable and RSR as the dependent variable, the regression equation was presented as RŜR = a + b× Probit.
(6) Rank by level
The evaluation objects were ranked by levels based on RŜR values.
The TOPSIS method can be applied to the relative closeness value Ci, which ranges from 0 to 1, and the RSR value distributed in the same rank and ratio method can be analyzed using the RSR method.
Here are the basic steps involved:
(1) Determination of RSR distribution for Ci
The RSR distribution of Ci refers to the specific downward cumulative frequency of Ci expressed in the Probit. Specific steps include compiling the frequency distribution table of the Ci values; listing the frequency f of different groups and calculating the cumulative frequency ∑f of each group; determining the rank R, average rank R, and R/n values for each group of Ci values; refering to Appendix Table A1 to convert the percentage to the Probit; and obtaining the corresponding Probit value Y.
(2) Calculation of the regression equation
Using Y as the independent variable and Ci value as the dependent variable, the regression equation becomes Ci = a + b × Probit
(3) Hypothesis testing of the regression equation
Determine whether the Ci value is normally distributed and whether the regression equation is relevant.
(4) Rank by level
The evaluation objects are ranked by level based on the reasonable RSR rank method and the corresponding estimated values obtained using the regression equation.
Percentile and the corresponding Probit values at different levels are presented in Appendix Table A2. This study set 5 levels: poor, relatively poor, medium, relatively good, and good.
Mean scores were calculated for the primary and secondary indicators. Results showed that χ11 (biological risks), χ8 (quality control), and χ12 (public health functions) scored the highest, with scores of 95.19, 94.05, and 91.27, respectively, while χ7 (analysis and testing capacity), χ4 (data and information), and χ1 (organizational operation and management) scored the lowest, with scores of 76.92, 83.39, and 85.63, respectively (Table 2).
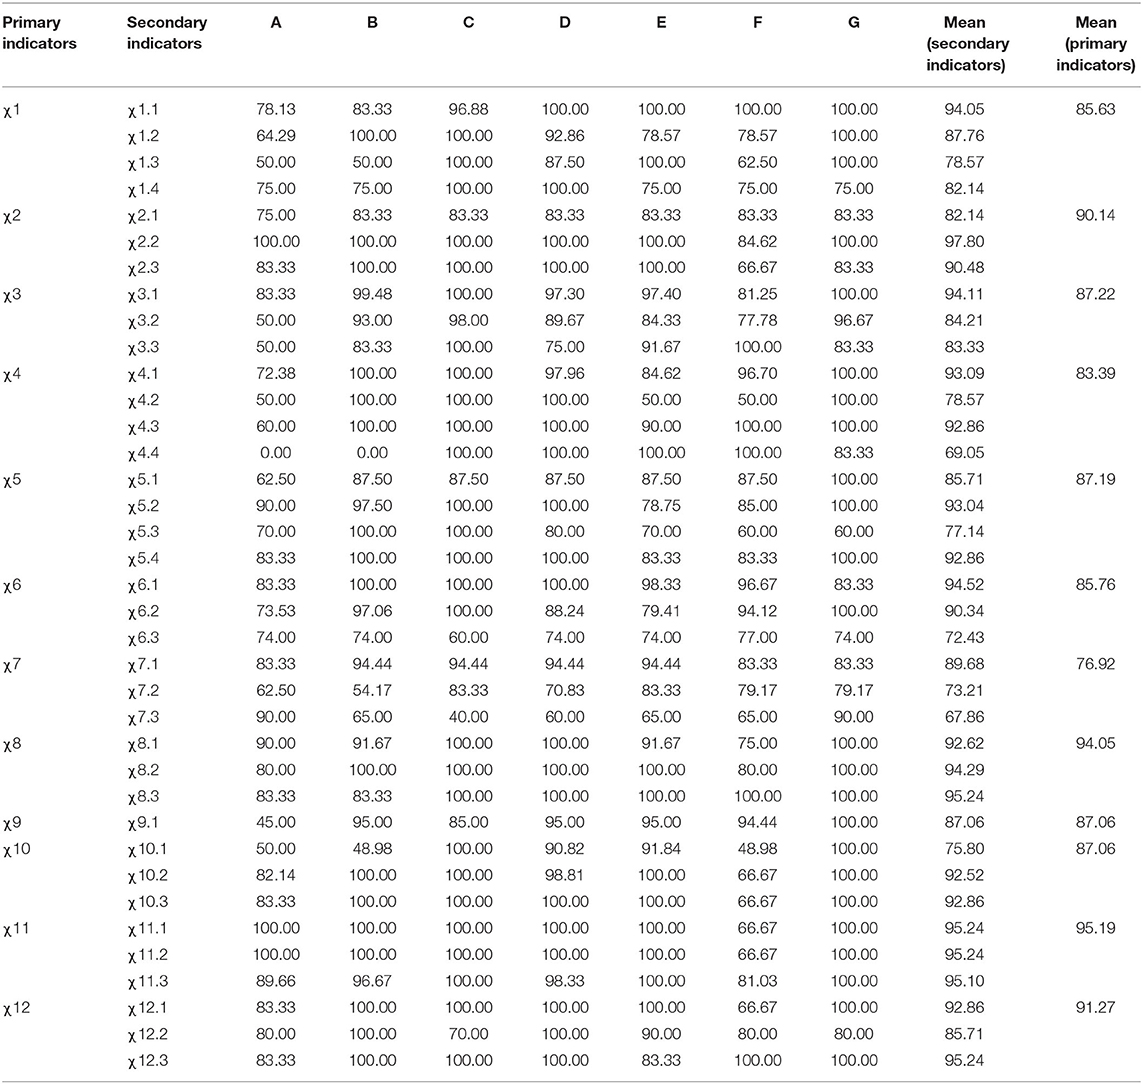
Table 2. Scores for evaluation indicators.
The subjective weight, objective weight, and combination weight for a comprehensive indicator evaluation for pathogenic microbial laboratory management were obtained based on subjective weighting (gray relational analysis) and objective weighting (coefficient of variation). Results are summarized in Table 3. Three primary indicators had the highest weights: χ7 (analysis and testing capacity) (0.1067), χ1 (organizational operation and management) (0.1026), and χ12 (public health functions) (0.1024).
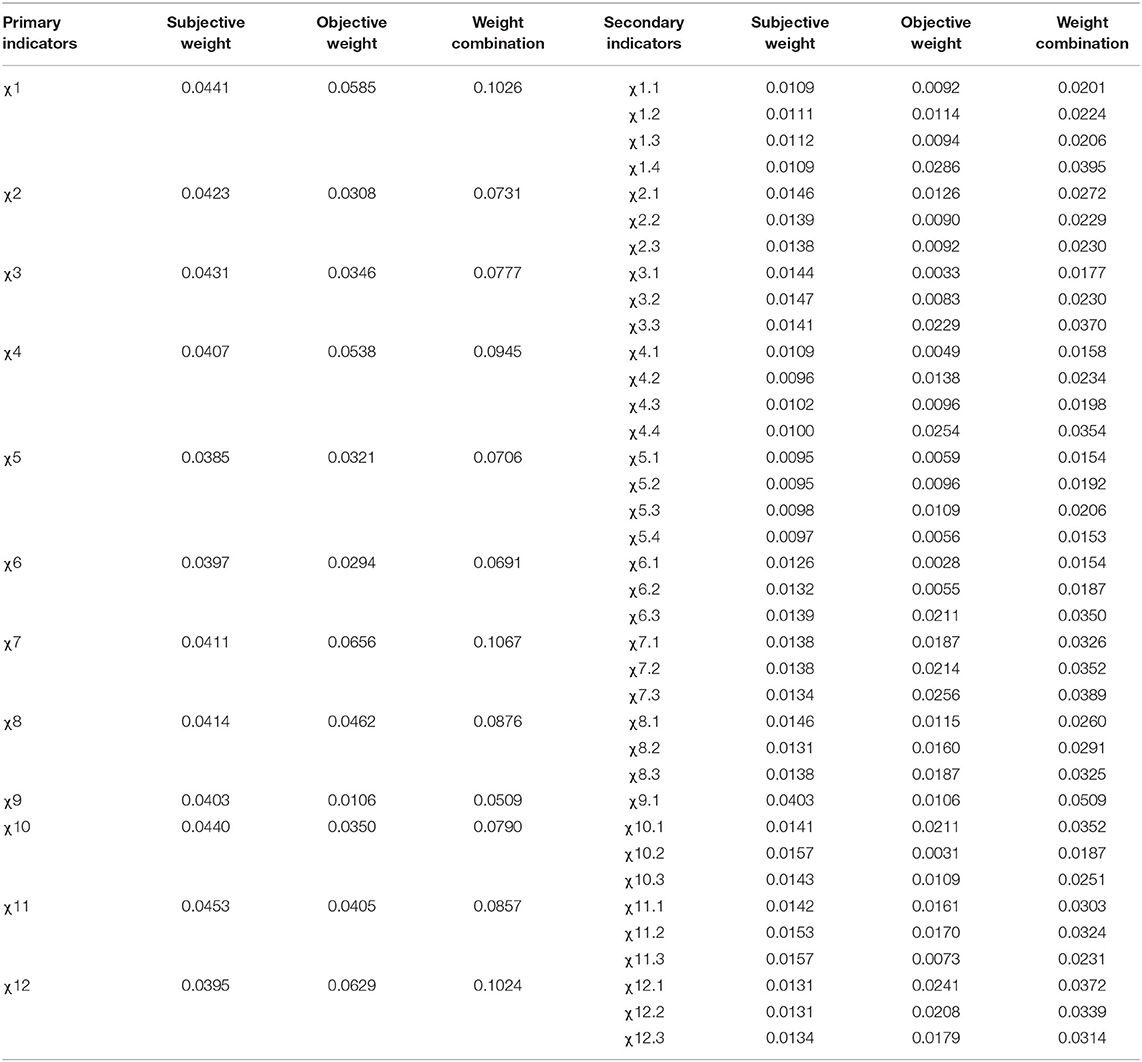
Table 3. Comprehensive evaluation of indicator weights for pathogenic microbial laboratory management.
The seven provincial CDCs studied herein have their own strengths in terms of 12 aspects. The sub-item ranking of the primary indicators is summarized in Table 4.
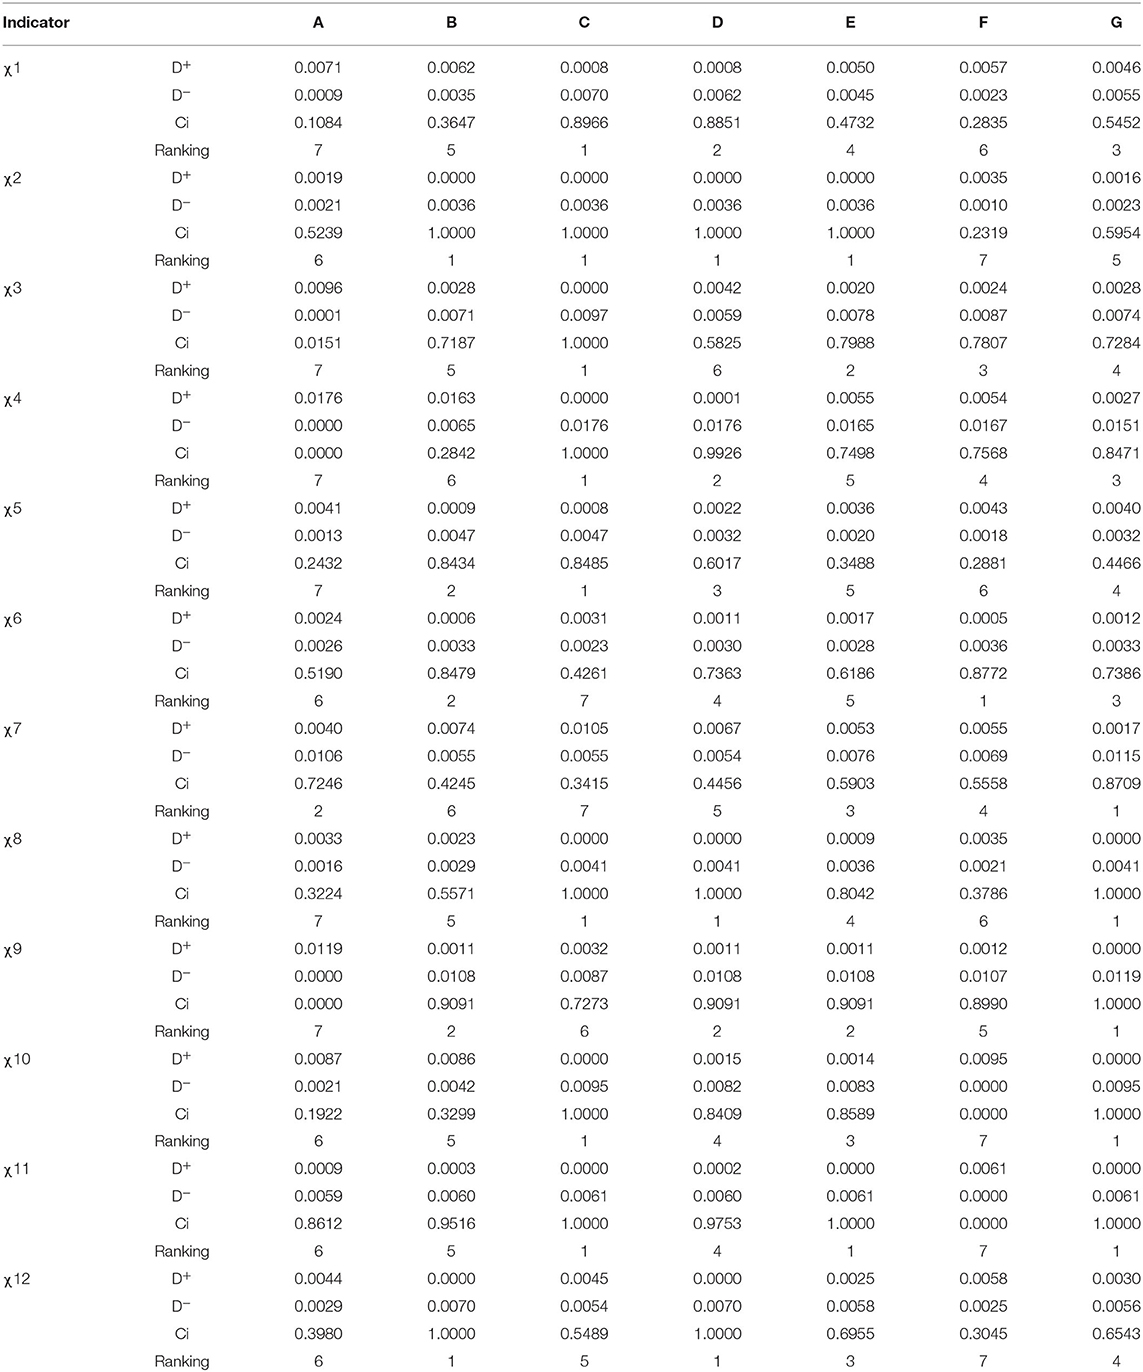
Table 4. Sub-item ranking of the primary indicators for laboratory management.
Next, the 12 aspects were analyzed as a whole, and the seven provincial CDCs were ranked as D, G, E, C, F, B, and A (Table 5).
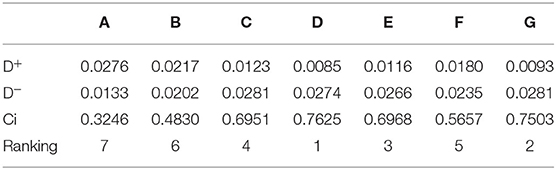
Table 5. Overall ranking of laboratory management.
Ci values were ranked in ascending order, and the downward cumulative frequency was calculated. According to the percentile value, refer to Appendix Table A1 and get the Y value. The corresponding Probit Y values are summarized in Table 6.
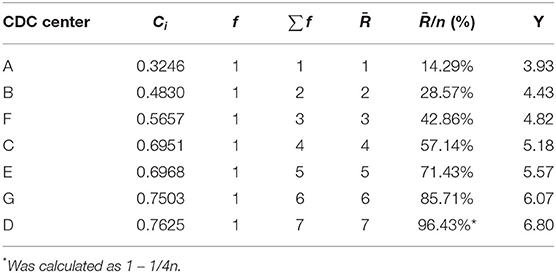
Table 6. Comprehensive evaluation of RSR distribution for different Ci values.
Using the Probit value corresponding to the cumulative frequency as the independent variable and as the dependent variable, the regression equation was obtained as Ci = −0.1831 + 0.1511 × Y. At regression coefficient test statistic t = 5.0945, P < 0.05, indicating that the regression equation was relevant; at F = 25.954 and P < 0.05, the independent variable had a linear regression relationship with the dependent variable.
The management of pathogenic microbiology laboratories in seven institutions was divided into five levels: poor, relatively poor, medium, relatively good, and good. None of the laboratories were marked as “poor” or “good”; one was marked as “relatively poor” (A); two were marked as “medium” (B and F); four were marked as “relatively good” (C, E, G, and D). See Table 7.
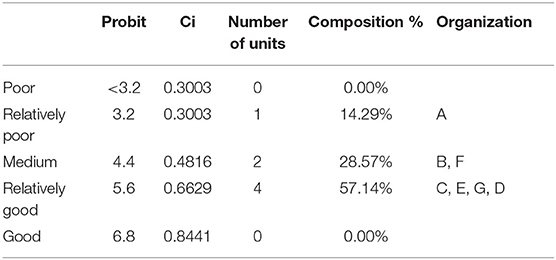
Table 7. Ranking of laboratory management evaluation in terms of performance.
Based on 12 primary indicators and 39 secondary indicators listed in the WHO's LAT, China's practices, literature reviews, and brainstorming, a comprehensive indicator evaluation system, including 12 primary indicators and 37 secondary indicators of management for pathogenic microbiology laboratories, was established herein. These indicators comprised organizational operation and management, documentation, sample collection, processing and transportation, data and information, consumables and reagents, equipment, analysis and testing capabilities, quality control, facilities, human resources, biological risks, and public health functions. Compared with the original LAT, the revised indicator system removed “gap analysis” from primary indicators and included “quality control.” Secondary indicators were adjusted under the framework of the new primary indicators. Although there were differences between the new evaluation system and LAT, the new one better reflects China's actual practices and meets the standard requirements. It also conforms to the WHO's concept of formulating LAT that encourages users to modify the LAT as per their own conditions. For example, a Thai study adopted 15 modules with quantitative output (20).
Management of laboratory biosafety risk has always been an important and difficult aspect of laboratory management. In this evaluation, χ11 (biological risks) had the highest score (95.19), which is largely explained by the continuous training provided by the Chinese disease control system. Training in biological risk management is critical, and should be ongoing conducted at all safety levels laboratories. However, χ7 (analysis and testing capacity) scored the lowest (76.92). Analysis revealed that the laboratories are efficient at detecting viruses and bacteria but are insufficient in parasite detection, which was responsible for overall low scores. With rapid economic development, greatly improved sanitary conditions, and a reduction in the need for parasite detection, laboratories have emphasized the development of bacterial and virus detection to ensure detection ability.
LAT does not give weight to each indicator, but the authors of this study believe that the role and impact of each indicator on laboratory management are different. We conclude that giving different weights to different indicators enables investigators to understand better the status and role of important indicators in the evaluation of the laboratory management process. However, as experts remain divided on the importance of each indicator, the weights assigned to various indicators vary from one expert to another. As such, in this study, both subjective and objective methods are employed for assigning weights to minimize the impact of subjective evaluation. The two types of weighting methods have their own advantages and disadvantages. The subjective weighting method entails experts to reasonably determine the rank of the weight coefficients of various indicators to resolve problems, resulting in a large extent of subjectivity. In contrast, the objective weighting method is based on objective data; however, the determined weights are, at times, contradictory to the actual importance of the indicators (28, 29). In the present study, the three primary indicators given the highest weights were χ7 (analysis and testing capacity), χ1 (organization operation and management), and χ12 (public health functions), whereas the three with the lowest weights were χ9 (facilities), χ6 (equipment), and χ5 (consumables and reagents). These results indicate that more attention should be paid to “analysis and testing capacity,” “organizational operation and management” and “public health functions” for the daily management of the laboratories.
Provincial CDCs play a crucial role in disease monitoring, prevention, and control, as well as public health decision-making. The level of laboratory management matters when it comes to the evaluation of CDC capacity building. In this study, we compared the differences in laboratory management of the provincial CDCs and identified areas in which the laboratories should strengthen the capacity building. Analyses revealed that laboratory A performed the poorest, with only χ7 (analysis and testing capacity) ranking top. B was number one in χ2 (documents), and χ12 (public health functions) but had low scores in χ4 (data and information) and χ7 (analysis and testing capacity), ranking sixth. C did well in 8 indicator, including χ1 (organizational operation and management), χ2 (documents) and so on, but lagged behind in χ6 (equipment) and χ7 (analysis and testing capacity). D had top scores in χ2 (documents), χ8 (quality control), and χ12 (public health functions), but ranked sixth in χ3 (sample collection, processing, and transportation). E ranked first in χ2 (documents) and χ11 (biological risks), with no indicators that were in the last place. F ranked first in χ6 (equipment) and last in χ2 (documents), χ10 (human resources), χ11 (biological risks), and χ12 (public health functions). G had the highest scores in χ7-χ11, with no last-ranked indicators. Therefore, this study will help CDC focus on the areas that need to be improved in comparison with other CDC and provides a reference for further efforts.
Pathogenic microbiology laboratories are not only built in the CDC system, but also widely exist in hospitals, scientific research institutes, universities, third-party medical institution, etc. The connotation and elements of laboratory management in different institutions are consistent. In this study, only 7 provincial CDCs were evaluated for laboratory management, hoping to provide some enlightenment for other institutions.
Based on the LAT by WHO, an evaluation system for pathogenic microbiology laboratory was established in this study to comprehensively evaluate pathogenic microbiology laboratories in seven provincial CDCs by adopting a combination of TOPSIS and RSR methods. In the future, the evaluation system will be further optimized and promoted to devise a more objective evaluation for increased applicability to achieve scientific and accurate evaluation results, thus providing a basis for guiding laboratory capacity building and improving laboratory management.
The original contributions presented in the study are included in the article/Supplementary Material, further inquiries can be directed to the corresponding author.
Conceptualization: CZ, BL, and XZ. Data curation: CZ and BL. Formal analysis: CZ. Investigation: JL, SL, YL, and YG. Methodology, writing—original draft, writing—review, and editing: CZ and XZ. All authors read and approved the final manuscript.
This research was funded by Public Health Emergency Response Mechanism Project of China CDC, grant number 21780404.
The authors declare that the research was conducted in the absence of any commercial or financial relationships that could be construed as a potential conflict of interest.
All claims expressed in this article are solely those of the authors and do not necessarily represent those of their affiliated organizations, or those of the publisher, the editors and the reviewers. Any product that may be evaluated in this article, or claim that may be made by its manufacturer, is not guaranteed or endorsed by the publisher.
We would like to thank the participants in the study, and the chief manager Hong Chen and Kai Kang from the China-U.S. Collaborative Program on Emerging and Re-emerging Infectious Disease for their strong support.
The Supplementary Material for this article can be found online at: https://www.frontiersin.org/articles/10.3389/fpubh.2022.883551/full#supplementary-material
CDC, Centers for Disease Control and Prevention; LAT, Laboratory Assessment Tool; RSR, Rank Sum Ratio; TOPSIS, Technique for Order Preference by Similarity to an Ideal Solution; WHO, World Health Organization.
1. Gao GF. For a better world: biosafety strategies to protect global health. Biosaf Health. (2019) 1:1–3. doi: 10.1016/j.bsheal.2019.03.001
2. Feng Y, Gao GF. Towards our understanding of SARS-CoV, an emerging and devastating but quickly conquered virus. Comp Immunol Microbiol Infect Dis. (2007) 30:309–27. doi: 10.1016/j.cimid.2007.05.009
3. Peiris JS, Yu WC, Leung CW, Cheung CY, Ng WF, Nicholls JM, et al. Re-emergence of fatal human influenza A subtype H5N1 disease. Lancet. (2004) 363:617–9. doi: 10.1016/S0140-6736(04)15595-5
4. Liu J, Xiao H, Lei F, Zhu Q, Qin K, Zhang XW, et al. Highly pathogenic H5N1 influenza virus infection in migratory birds. Science. (2005) 309:1206. doi: 10.1126/science.1115273
5. Garten RJ, Davis CT, Russell CA, Shu B, Lindstrom S, Balish A, et al. Antigenic and genetic characteristics of swine-origin 2009 A(H1N1) influenza viruses circulating in humans. Science. (2009) 325:197–201. doi: 10.1126/science.1176225
6. de Groot RJ, Baker SC, Baric RS, Brown CS, Drosten C, Enjuanes L, et al. Commentary: middle east respiratory syndrome coronavirus (MERS-CoV): announcement of the coronavirus study group. J Virol. (2013) 87:7790. doi: 10.1128/JVI.01244-13
7. Chan M. Ebola virus disease in West Africa — No early end to the outbreak. New Engl J Med. (2014) 371:1183–5. doi: 10.1056/NEJMp1409859
8. Gulland A. Health ministers in West Africa hold crisis talks on Ebola virus. BMJ. (2014) 349:g4478. doi: 10.1136/bmj.g4478
9. Li Q, Guan X, Wu P, Wang X, Zhou L, Tong Y, et al. Early transmission dynamics in Wuhan, China, of novel coronavirus–infected pneumonia. New Engl J Med. (2020) 382:1199–207. doi: 10.1056/NEJMoa2001316
10. Oluwawemimo A, Saheed D, Adebankemo O, Olubunmi FG, Oludayo Fasina F. Capacities and functionalities assessment of veterinary laboratories in south-west nigeria using the FAO laboratory mapping tool. Biomed Environ Sci. (2020) 33:458–63. doi: 10.3967/bes2020.062
11. Strengthening Veterinary Diagnostic Capacities: The FAO Laboratory Mapping Tool. (2016). Available online at: http://www.fao.org/3/i5439e/i5439e.pdf (accessed June 6, 2022)
12. International Health Regulations 3rd ed. Publicaciones de la Organización Mundial de la Salud. France (2005).
14. IEC ISO. General requirements for the competence of testing and calibration laboratories. In: 17025:2017, Switzerland. Edited by IEC, ISO Switzerland (2017). p. 30.
15. CDC NIH. Biosafety in Microbiological and Biomedical Laboratories 6th Edition. Centers for Disease Control and Prevention; National Institutes of Health (2020). U.S. Department of Health and Human Services, Public Health Service, Centers for Disease Control and Prevention, National Institutes of Health.
17. General General Administration of Quality Supervision Inspection Inspection and Quarantine of the People's Republic of China. Laboratories - General requirements for biosafety. Edited by Standardization Administration of the People's Republic of China, Beijing (2008).
18. General General Administration of Quality Supervision Inspection Inspection and Quarantine of the People's Republic of China. General requirements for the competence of testing and calibration laboratories GBT27025–2019. Edited by Standardization Administration of the People's Republic of China. Beijing (2019).
19. WHO. Laboratory Assessment Tool. (2012). Available online at: https://www.who.int/publications/i/item/WHO-HSE-GCR-LYO-2012.2 (accessed June 25, 2022).
20. Peruski AH, Birmingham M, Tantinimitkul C, Chungsamanukool L, Chungsamanukool P, Guntapong R, et al. Strengthening public health laboratory capacity in Thailand for International Health Regulations (IHR) (2005). WHO South East Asia J Public Health. (2014) 3:171–8. doi: 10.4103/2224-3151.206749
21. Shafii M, Hosseini SM, Arab M, Asgharizadeh E, Farzianpour F. Performance analysis of hospital managers using fuzzy AHP and Fuzzy TOPSIS: Iranian experience. Glob J Health Sci. (2015) 8:137–55. doi: 10.5539/gjhs.v8n2p137
22. Chen F, Wang J, Deng Y. Road safety risk evaluation by means of improved entropy TOPSIS–RSR. Safety Sci. (2015) 79:39–54. doi: 10.1016/j.ssci.2015.05.006
23. Wang Z, Dang S, Xing Y, Li Q, Yan H. Applying Rank Sum Ratio (RSR) to the evaluation of feeding practices behaviors, and its associations with infant health risk in Rural Lhasa, Tibet. Int J Env Res Pub Health. (2015) 12:15173–81. doi: 10.3390/ijerph121214976
24. El Allaki F, Christensen J, Vallières A. A modified TOPSIS (Technique for Order of Preference by Similarity to Ideal Solution) applied to choosing appropriate selection methods in ongoing surveillance for Avian Influenza in Canada. Prev Vet Med. (2019) 165:36–43. doi: 10.1016/j.prevetmed.2019.02.006
25. Song L, Zhao Y. Evaluation of the quality of child health care based on TOPSIS method, RSR method, fuzzy combination of TOPSIS method and RSR method. Maternal Child Health Care China. (2019) 34:3875–79. doi: 10.7620/zgfybj.j.issn.1001-4411.2019.17.01
26. Wang Z, Qin T, Qin B, Cong W, Zhang Q, Zheng Y, Chen Y. Weighted TOPSIS method combined with RSR method to evaluate the operation effect of the new rural cooperative medical care system in all cities and prefectures of Gansu Province in 2016. China Health Stat. (2018) 35:563–5. doi: 10.3969/j.issn.1002-3674.2018.04.021
27. Wang S. Using TOPSIS method and rank and ratio method to evaluate hospital bed utilization efficiency. China Med Rec. (2019) 20:39–42. doi: 10.3969/j.issn.1672-2566.2019.03.015
28. Sun Z, Wang L. Comprehensive Evaluation Methods and Their Medical Applications. 1st ed. Beijing: People's Medical Publishing House (2014).
29. Zhang P. Research on Evaluation of Rural Health Service Capability – A Case Study of J Province. Changchun: Jilin University (2014).
Keywords: laboratory management, evaluation, TOPSIS, RSR, combination methods
Citation: Zhao C, Liu B, Li J, Li S, Liu Y, Guo Y and Zhang X (2022) Evaluation of Laboratory Management Based on a Combination of TOPSIS and RSR Methods: A Study in 7 Provincial Laboratories of China. Front. Public Health 10:883551. doi: 10.3389/fpubh.2022.883551
Received: 07 April 2022; Accepted: 17 June 2022;
Published: 11 July 2022.
Edited by:
Dennis Nowak, LMU Munich University Hospital, GermanyReviewed by:
Mohammed Dauda Goni, Universiti Malaysia Kelantan, MalaysiaCopyright © 2022 Zhao, Liu, Li, Li, Liu, Guo and Zhang. This is an open-access article distributed under the terms of the Creative Commons Attribution License (CC BY). The use, distribution or reproduction in other forums is permitted, provided the original author(s) and the copyright owner(s) are credited and that the original publication in this journal is cited, in accordance with accepted academic practice. No use, distribution or reproduction is permitted which does not comply with these terms.
*Correspondence: Xiumin Zhang, eGl1X21pbkBqbHUuZWR1LmNu; emhhbmd4aXVtaW42M0AxNjMuY29t
Disclaimer: All claims expressed in this article are solely those of the authors and do not necessarily represent those of their affiliated organizations, or those of the publisher, the editors and the reviewers. Any product that may be evaluated in this article or claim that may be made by its manufacturer is not guaranteed or endorsed by the publisher.
Research integrity at Frontiers
Learn more about the work of our research integrity team to safeguard the quality of each article we publish.