 Yew Sum Leong
 Khairunnisa Hasikin
 Khin Wee Lai
 Norita Mohd Zain
 Muhammad Mokhzaini Azizan
95% of researchers rate our articles as excellent or good
Learn more about the work of our research integrity team to safeguard the quality of each article we publish.
Find out more
ORIGINAL RESEARCH article
Front. Public Health , 28 April 2022
Sec. Digital Public Health
Volume 10 - 2022 | https://doi.org/10.3389/fpubh.2022.875305
This article is part of the Research Topic Machine Learning in Disease Screening, Diagnosis, and Surveillance View all 20 articles
Breast cancer is among the most common types of cancer in women and under the cases of misdiagnosed, or delayed in treatment, the mortality risk is high. The existence of breast microcalcifications is common in breast cancer patients and they are an effective indicator for early sign of breast cancer. However, microcalcifications are often missed and wrongly classified during screening due to their small sizes and indirect scattering in mammogram images. Motivated by this issue, this project proposes an adaptive transfer learning deep convolutional neural network in segmenting breast mammogram images with calcifications cases for early breast cancer diagnosis and intervention. Mammogram images of breast microcalcifications are utilized to train several deep neural network models and their performance is compared. Image filtering of the region of interest images was conducted to remove possible artifacts and noises to enhance the quality of the images before the training. Different hyperparameters such as epoch, batch size, etc were tuned to obtain the best possible result. In addition, the performance of the proposed fine-tuned hyperparameter of ResNet50 is compared with another state-of-the-art machine learning network such as ResNet34, VGG16, and AlexNet. Confusion matrices were utilized for comparison. The result from this study shows that the proposed ResNet50 achieves the highest accuracy with a value of 97.58%, followed by ResNet34 of 97.35%, VGG16 96.97%, and finally AlexNet of 83.06%.
In 2020, World Health Organization (WHO) reported 2.3 million cases of breast cancer worldwide with over 685,000 fatalities, making it among the highest fatal diseases in the world. Although extensive efforts on breast cancer screening have shown promising results for early intervention, localizing breast lesions has remained a challenge. This is because detection of breast lesions on mammogram images heavily depended on the radiologist's skill (1), which proved to be time consuming, and at times lacked the accuracy and precision Thus, this factor poses a serious challenge onto rapid diagnosis process which in the case of breast cancer, late detection may prove terminal. Advancements and involvement of artificial intelligence (AI) in the healthcare sector have improved accuracy and assisted radiologists by minimizing the rates of false positives and false negatives during clinical diagnosis. Deep Convolutional Neural Networks (D-CNN), a subsidiary of AI, have advanced to the point where they can automatically learn from enormous picture data sets and detect abnormalities in mammograms such as mass lesions (2). D-CNN has quickly become the preferred approach for evaluating medical images to aid the early detection of breast cancer diseases, which resulted in a favourable prognosis and a higher percentage of survival (3, 4).
The presence of microcalcification during breast cancer screening is often missed due to its small size which is approximately 0.1–1.0 mm. In addition, it may be scattered and less visible to naked eyes due to the surrounding dense breast tissues. Different from microcalcification, breast lump has a relatively high predictive value for malignancy (5, 6). Calcifications may appear as white dots with specific patterns, size, density, and location on mammogram images, which might signify breast cancer or precancerous alterations in breast tissue (7). Even with visible calcifications, most lesions are not recalled immediately but identified as interval cancer in subsequent screening due to the poor sensitivity of screening for malignant calcifications (8). This is due to the low contrast and unclear boundaries on conventional images of breast mammograms (9). According to WHO, the survival probabilities of breast cancer patients may reach an astonishing number of 90% if the disease is identified and treated effectively in early stages.
Generally, in terms of detection, diagnosis, and treatment, many healthcare providers are faced with problems such as a lack of human resources and technological capabilities to deliver timely care to breast cancer patients (10). This problem worsens in developing and under-developed countries, where inexperienced radiologists are faced with a myriad number of mammogram images during screening. Therefore, the emergence of current computer-aided diagnosis (CAD) systems aids breast cancer diagnosis by allowing more comprehensive and objective analyses to be performed on many mammogram images. However, the CAD system is mostly based on hand-crafted features. The prognostic choice on the categorization of microcalcification clusters is mostly based on extracting useful handmade characteristics and then creating a highly discriminative classifier on top of them, which frequently yielded false results (11). Also, the installation of a sophisticated computer program in healthcare usually necessitates a multi-pronged strategy as it often involves political, economic, and social issues (12, 13).
The use of AI as an automated image classification tool has increased over the years as it allows automated disease diagnosis, characterization of histology, stage, or subtype, and patient classification based on therapeutic outcome or prognosis (14). Many types of diseases have incorporated the use of AI to form an automated prediction system. As such, the use of the Hippocampal Unified Multi-Atlas Network (HUMAN) algorithm to diagnose Alzheimer's disease (AD) (15). Current algorithms normally utilize transfer learning techniques or pre-trained CNNs to reduce the cost and time of training the network to allow automatic extraction of features at various levels of abstraction, features, and objects from raw images (16).
In the proposed work, we propose an end-to-end machine learning technique for automated breast cancer diagnosis using a pre-trained network to discriminate microcalcification, specifically a novel D-CNN architecture with adaptive transfer learning. In this study, curated Breast Imaging Subset of Digital Database for Screening Mammography (CIBS-DDSM) dataset from The Cancer Imaging Archive (TCIA) data portal which contains ROI images of digital mammography in grayscale will be utilized to facilitate training of the model. Our work utilizes CNN networks to automatically extract features of benign and malignant microcalcification instead of directing the machine to learn from locations identified via *.csv files. A series of pre-processing algorithms are introduced to ensure the images were well prepared before beginning the process of feature extraction to enhance the accuracy of the model.
The primary contribution of the work involves; (i) proposing end-to-end machine learning architecture to diagnose breast cancer using microcalcifications' characteristics, (ii) performing pre-processing operations for the collected mammogram images before classification using deep learning algorithms, and (iii) proposing an adaptive transfer learning technique of CNN to build a breast cancer image classifier. The proposed work involves four state-of-the-art deep learning architectures such as ResNet38, ResNet50, VGG16, and AlexNet, and the performance of the models is compared to evaluate their performance.
The introduction of digital mammography images has made deep learning approaches for breast cancer diagnosis possible in recent years (17, 18). Significant research which involves the use of machine learning, specifically D-CNN-based supervised machine learning for microcalcification detection has been performed. CNNs are able to achieve higher detection accuracy as compared to CAD models by delivering quantitative analysis of suspicious lesions (19). Table 1 depicts the examples of studies that involve the classification of microcalcification of the breast into malignant and benign cases in recent years, including the model used and the accuracy achieved. Existing models of breast image classifiers for microcalcification detection are shown in Table 1. Based on Table 1, the highest accuracy for research breast image classifier involving VGG16 models is 94.3%, AlexNet is 88.6%, Resnet34 is 76.0%, and Resnet50 is 91.0%. Logic-based supervised learning such as Random Forest also managed to achieve an accuracy of 85.0% while Support Vector Machine (SVM) reached 95.8%.
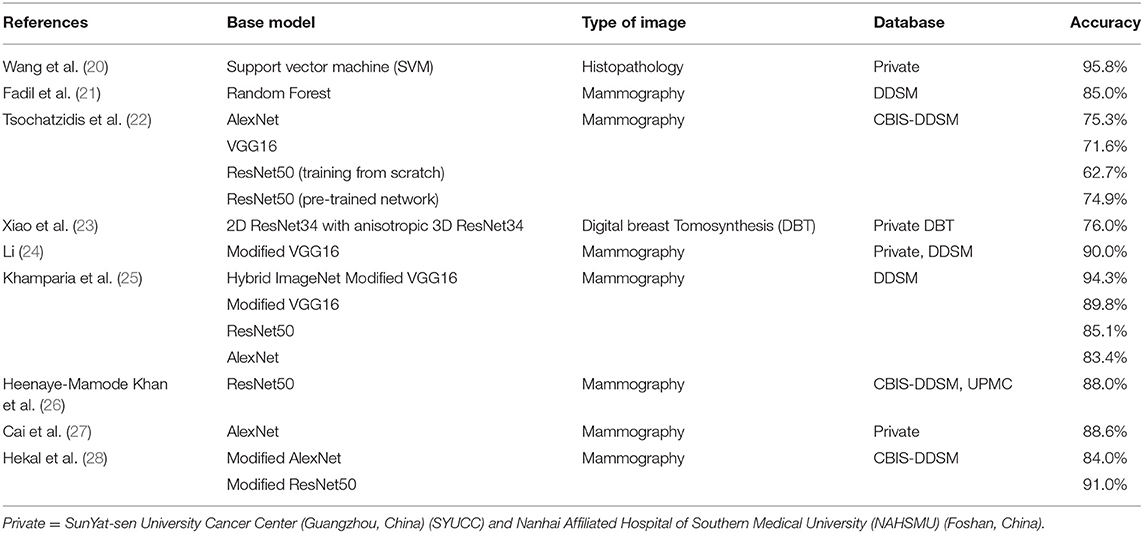
Table 1. Models of breast image classifier for microcalcification detection.
As compared to learning algorithms such as SVM, CNN has gained its popularity due to higher accuracy and greater flexibility when it comes to tuning of hyperparameters. CNNs are feed-forward neural networks that are fully connected and are exceptionally good at lowering the number of parameters without sacrificing model quality. Since images have a high dimensionality as each pixel is considered a feature, it suits the capabilities of CNNs mentioned above.
As more models surfaced, accuracy has become one of the main aspects to compare the performance of models. Works of (22) highlighted that the accuracy for a pre-trained model is higher as compared to the scratch model. The accuracy for ResNet50 has achieved 62.7% for scratch model and 74.9% for pre-trained model respectively with the utilization of dataset from CBIS-DDSM. Ensemble modelling has also been observed in (24, 25, 27), where fusion or modification of existing models has been performed to produce a better model. For instance, the fusion of Modified VGG and ImageNet is observed in works of Khamparia et al. (25). This hybrid model enhances the performance of the model and achieved an astonishing accuracy of 94.3% in breast image classification (25). On the other hand, AlexNet based CNN model that is modified with multiple layer architecture and drop-out strategy together with the fusion of “off-the-shelf” model from ImageNet observed in (27) has demonstrated the ability to get robust and spatially invariant features, achieving an accuracy of 88.6% for morphologically filtered CNN feature.
Inspired by the promising results produced by the deep learning neural network, our research seeks to propose an end-to-end novel adaptive transfer learning convolutional neural network to discriminate microcalcifications of breast mammograms into benign or malignant cases. Most of the methods used were based on the Mammographic Image Analysis Society (MIAS) and InBreast dataset, which uses handcrafted features for machine learning. This research utilizes the CIBS-DDSM dataset obtained from TCIA data portal, which provides a higher resolution and number of images for machine learning to enhance the accuracy of diagnosis. Instead of training the model using a whole mammogram image, the model in this research is trained by using ROI images of calcifications, allowing the model to extract features from a focused area. The main goal of this research is to detect and categorize microcalcification as accurately as possible to aid radiologists to prepare the diagnosis report rapidly. The model is beneficial to be applied in a clinical setting.
The proposed deep learning model is developed in Google Collab's platform with an OpenCV library of programming functions. Data acquisition is performed by downloading the breast mammography ROI images with microcalcification from the TCIA database. Micro-calcified images of the breast mammography were categorized into benign and malignant cases based on the information given in the *.csv files from TCIA. Moving on, the downloaded images were pre-processed to remove artifacts and noises. Since the size of microcalcification is small and scattered in the mammogram, a conventional D-CNN model often failed to classify and often resulted in false positive or false-negative results. Therefore, we propose an end-to-end machine learning technique, which consists two stages of pre-processing technique, specifically implementation of artifacts removal to remove the existence of artifacts surfaced and filtering of images to lower the noise level of images prior to implementation of machine learning. The focus of work on enhancing quality of images were performed automatically upon identifying threshold value of breast region using Google Colab's platform. This step is crucially important to build and train a model with quality information of features extracted from the image itself.
A D-CNN model is developed with finely tuned hyperparameters. To categorize the mammogram images into benign and malignant cases, a CNN model is utilized as a baseline. Transfer learning is used instead of training CNN from scratch. As such, different CNN models pre-trained with torch vision from the fastai library will be transferred to conduct the classification. To get the best possible result, hyperparameters such as the number of extra layers, learning rate, batch size, and epochs will be tuned. Finally, the confusion matrix will be utilized to assess the performance of the model to get the best possible accuracy. The overall algorithm for automated breast microcalcification classification is presented in Figure 1.
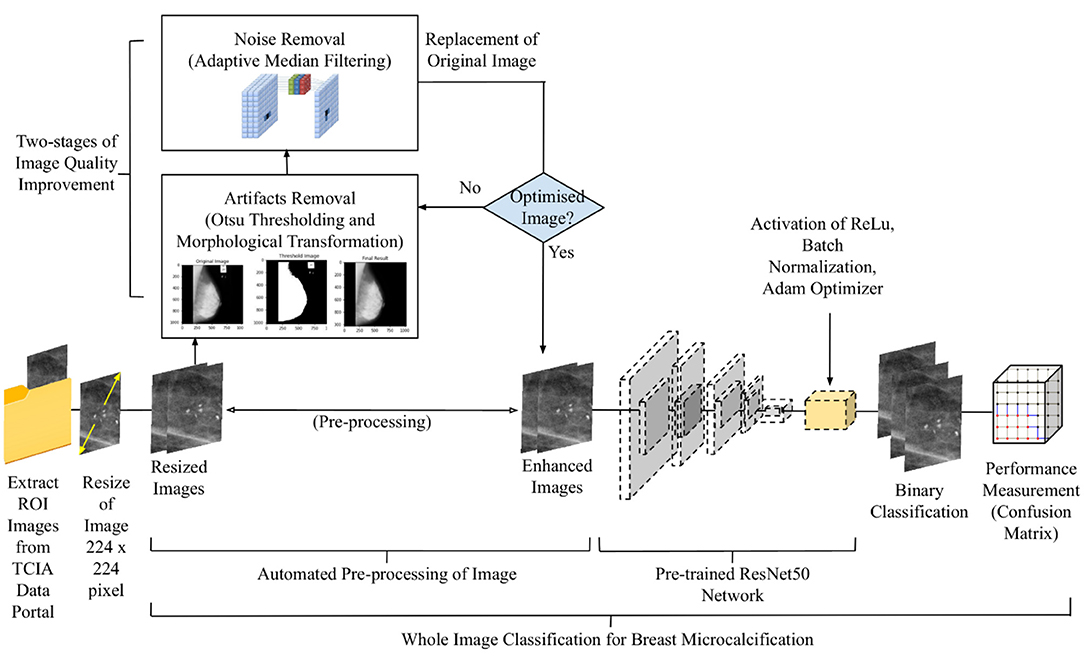
Figure 1. Workflow of the proposed design.
The following are the materials needed for the work of this research:
1. Intel Core i7-4710 HQ, 3.5 GHz, 1 TB SSD, 4 GB RAM,
2. Google Colaboratory Platform (Python OpenCV language and fastai Library)
3. Breast Image dataset CIBS-DDSM from TCIA.
The CIBS-DDSM dataset of ROI microcalcification images for this research is obtainable from Cancer Imaging Archive (TCIA). The prepared dataset consists of 1,077 benign and 577 malignant ROI images in various sizes in DICOM format. Data Retriever software was installed to download radiological pictures from the TCIA Radiology Portal and was later fed into DICOM software to be saved in *.jpeg format with a size of 224 × 224 to achieve uniformity in feature learning. The total number of images for benign and malignant as was multiplied by rotation at 90°, 180°, and 270°, resulting in 4,958 mammogram images for calcified benign ROI and 1,653 mammogram images for calcified malignant ROI. Table 2 shows the distribution of the dataset utilized in this study.
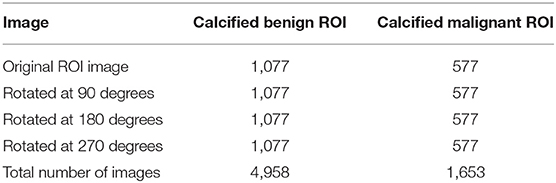
Table 2. Dataset distribution.
Before any pre-processing work was performed, the notebook on Google Collab was set to be under GPU Runtime to allow heavier computational work. Prior to training CNNs, the images will be pre-processed to remove the artifacts and improve the contrast by removing noise. Otsu Segmentation Method and MorphologicalEx Method presented by (29) were utilized to remove the artifacts that may be present at the image. Otsu Segmentation Method works on grayscale images and involves global thresholding or local thresholding to classify pixels values (30, 31). For instance, we denote mammogram image as function of G(x, y) and intensity value of I {I = 0, 1, 2, … I−1}. The variance of these two variables can be computed by using Equation (1).
whereby,
P(i) denotes the probability of gray-level i occurred, given as . In which, the number of pixels with a certain gray-level I is denoted by i. The image's total number of pixels is n. Threshold value th, which determines the class probability of pixels, is denoted as θ1 and θ2, and the mean of the class is calculated as u1and u2 as in Equations (4), (5) below. The threshold value that is predetermined earlier, th, which falls within the range of 0 < th < I will be utilized to divide the original mammogram image into two segments according to the intensity, which are [0, th] and [th + 1, I], where I is the maximum pixel value (255).
The value of interclass variance and global mean-variance can then be computed by using Equations (6) and (7), respectively.
The optimum threshold value is identified to achieve the best performance in distinguishing the target class from the background class, which is mostly utilized in mammography image binarization. Before executing the procedures for breast cancer detection segmentation and feature extraction, this thresholding approach is employed as a pre-processing technique (32, 33).
On the other hand, simple logical operations on local groupings of pixels, which is also defined as morphological operators are utilized in this research. Two of the main morphological operations used are dilation and erosion, which are shown in Equations (8) and (9), respectively (34). The binary image is denoted as X while the structuring element is denoted as B. The term Bx can be understood as translation of B by the vector x. Erosion reduces the size of an image by removing a layer of pixels from the inner and outer boundaries of regions. Dilation, on the other hand, has the reverse effect of erosion in that it adds a layer of pixels to both the inner and outer boundaries of regions. Many functions, such as opening and closing, are derived from these operators. When a picture is opened, it undergoes erosion and then dilation, and when it is closed, it undergoes dilation and then erosion (34).
Adaptive median filter, mean filter and median filter were included in this research. The performance of filter was assessed according to Peak Signal to Noise Ratio (PSNR) and Mean Square Error (MSE). PSNR value is closely linked with MSE as it is computed based on MSE values, as in Equation (10).
MAXf is the maximum signal value that exists in the original image. Lower MSE indicates better filtration as MSE is the squared average of the “errors” between the actual image and the noisy image. The best filter will be selected based on the highest PSNR and lowest MSE value. The pseudocode of calculating MSE and PSNR value is shown in Figure 2.

Figure 2. Code section for computing PSNR and MSE values based on filtered image and original image. “output” represents the finalized filtered image that will be used to compare with the original image, in this case is img_new1.
Upon identifying the best performing filter, the filter will be applied to the images which has undergone artifacts removal process to further remove the noises of the image for clarity enhancement of the images, therefore completing the two-stages of optimization. The enhanced images will replace the original images to store the image in the same file location for machine learning. Before finalizing the two-stages of optimization process, the enhanced images will be inspected again to make sure the artifacts have been removed completely before proceeding to the next stage.
Prior training, valid_pct () splits the dataset into training and testing sets at a particular ratio of 0.80 testing sets and 0.20 validation set. In total, there are 5,288 training images and 1,323 validation images. Data augmentation technique was implemented on the training set to avoid over-fitting by including get_transforms () function to increase the volume of the dataset by artificially producing new training data from the current data. Parameters of data augmentation is tabulated in Table 3.
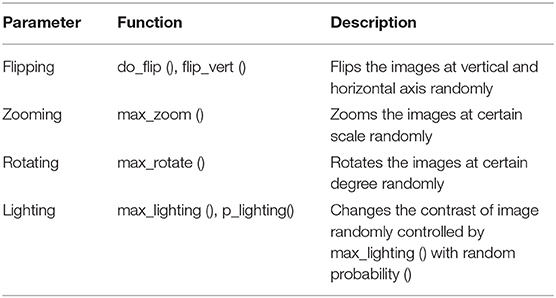
Table 3. Parameters of data augmentation.
Hyperparameters were chosen manually in each set of tests to identify the best possible accuracy on binary classification. Hyperparameters that is tuned involves number of layers, learning rate, batch size as well as epoch. ADAM optimization algorithm was included to enhance the effectiveness of the model in to computing adaptive learning rate in complicated network architectures. In addition to that, ReLu is activated to prevent the computation required to run the neural network from growing exponentially. Batch Normalization is also activated to enable each layer of the network to conduct learning more independently by re-centering and re-scaling the layers' inputs to improve the speed and stability of the network.
Pretrained network was downloaded from the fastai library using create_cnn (). The first layer of the model was trained by using learn.fit_one_cycle (). Later, the learning rate for the model was determined with the aid of learn.lr_find () and learn.recorder. plot (), which illustrates the learning curve of the model after training the first layer and suggests the lowest gradient of the learning curve. The example of learning curve plotted by using learn.recorder. plot () is shown in Figure 3.
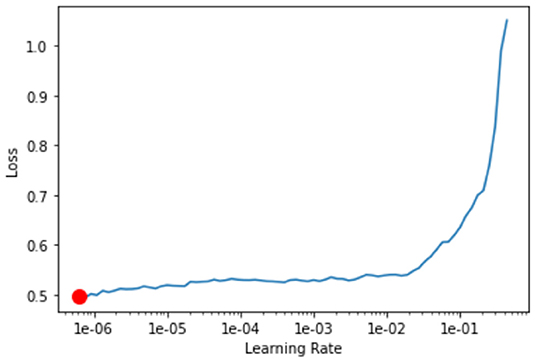
Figure 3. Learning curve plotted using learn.recorder.plot(). Y-axis depicts the learning loss while X-axis depicts the learning rate. Red dot shows the minimum gradient of the learning curve.
Moving on, all layers of the model were unfreeze using learn.unfreeze () to allow more parameters to be trainable. The model undergoes training again with Cylindrical Learning Rate (CLR) using learn.fit_one_cycle (), but restrained on a cyclic learning rate using max_lr (). CLR enables the learning rate to fluctuate between appropriate minimum and maximum boundaries and is computationally cheap and eliminates the need to identify the ideal learning rate.
Upon running the number of epochs predetermined, the confusion matrix of the model on the validation set was plotted. The top losses of images during training were plotted with labels of “Prediction/Actual/Loss/Probability.” By the end of the training, the value for training loss, validation loss, error rate and accuracy were recorded.
When it comes to evaluating the performance of the model, a confusion matrix is utilized. Four main parameters that are presented in a confusion matrix, which are: (i) True positive (TP) which shows the outcome of the model correctly predicts the benign cases, (ii) True negative (TN) which shows the outcome where the model correctly predicts the malignant cases, (iii) False positive (FP) which indicates the number of benign cases that are recognized as malignant cases by the model, and (iv) False negative (FN) which indicates the number of malignant case that are recognized as benign case by the model.
The values obtained from the confusion matrix will be further analyzed to compute additional parameters such as Recall, Precision, Specificity, Accuracy, F-1 score and Matthew Correlation Coefficient (MCC). MCC measures the performance of the parameters in the confusion matrix. The classifier produces a more accurate classifier if the MCC values trend more towards +1, and the reverse situation occurs if the MCC values trend more towards −1.
Wedges and labels in the raw mammography picture may cause needless disruptions during the mass detection procedure (35). By manually looking at each ROI images of breast calcification downloaded from the TCIA database, the images were found to be free labelling artefacts. However, the algorithms for removal of artifacts were still conducted just in case there is hidden or unobvious artifact. In order to ensure that this section of coding works properly, a sample image of whole breast mammogram with obvious artifacts were imported and tested. The test result in Figure 4 shows successful removal of labelling artifacts with the whole breast mammogram image. Upon confirming the workability of the coding, the algorithm is then implemented to the ROI images in this study.
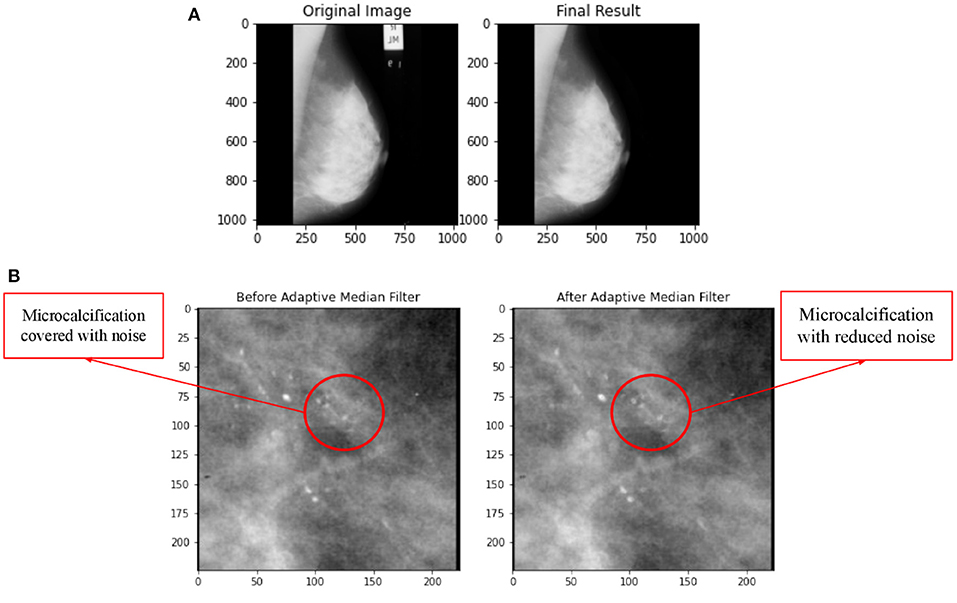
Figure 4. (A) Comparison on application of artifacts removal with implementation of Otsu Segmentation Method and MorphologicalEx Method for a sample of full breast mammogram image. (B) Comparison on before and after application of adaptive median filter.
In this research, three types of filters, namely adaptive median filter, mean filter, and median filter were applied on the same image and the MSE and PSNR value for each filter was computed to identify the best filter. Figure 4B shows a comparison of before and after application of adaptive median filter on breast mammogram image. The PSNR and MSE values for adaptive median filter, median filter and mean filter is tabulated in Table 4.
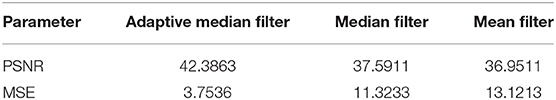
Table 4. PSNR and MSE values for adaptive median filter, median filter and mean filter.
By referring to Table 4, value for MSE is lowest for adaptive median filter, indicating that the error difference between the original image's values and the degraded image's values for adaptive median filter is the least among all three types of filters. Similar to (36, 37), comparison for adaptive median, mean and median filter for breast mammogram images were reported and the authors had concluded that adaptive median filter is the best filter for noise reduction since the quality of the image produced is much superior. Hence, this research utilizes adaptive median filter for image enhancement of breast microcalcification images.
Tables 5–8 show the output of VGG16, ResNet34, AlexNet and Resnet50 models respectively. Identifying ideal batch size for CNNs is important as it helps the network to reach maximum accuracy in the quickest possible time, particularly for complicated datasets, such as a medical picture dataset (38). Results obtained from this study demonstrates that with learning rate and epochs remains, the accuracy of the model increases when the number of batch sizes increases from 32 to 64. In Table 7, the increase in batch size from 32 to 64 in Test 10 and Test 11 has resulted in increase in accuracy with an additional value of 4.67%. Findings from this research also implies that the larger the batch size, the greater the network accuracy, implying that batch size has a significant influence on CNN performance.
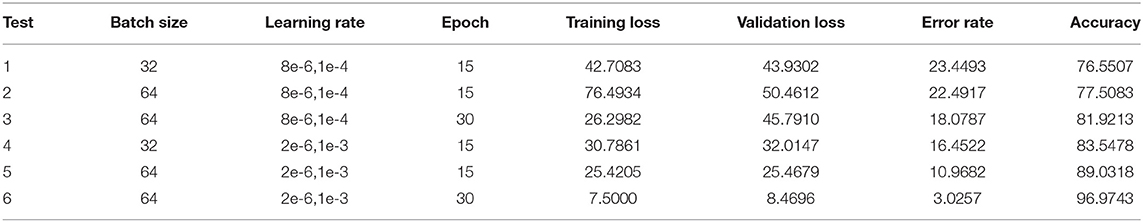
Table 5. Output of VGG16 model.
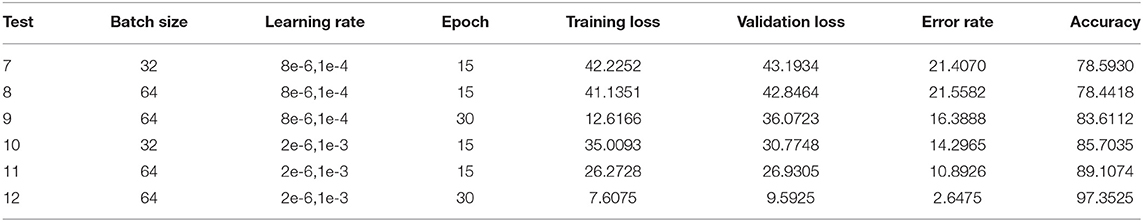
Table 6. Output of ResNet34 model.
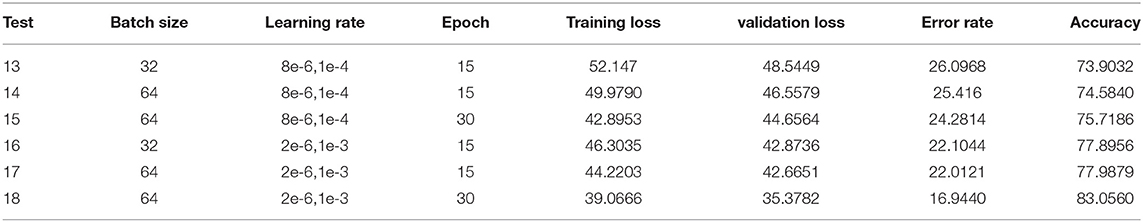
Table 7. Output of AlexNet model.
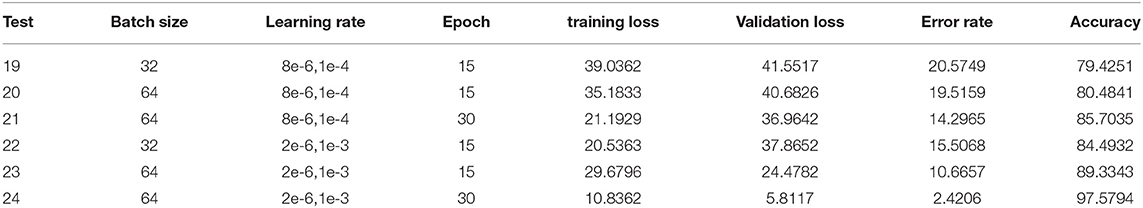
Table 8. Output of ResNet50 model.
Figure 5 depicts the graphical illustration of CNN models in terms of Training Loss, Validation Loss and Accuracy for different models. Graphs obtained from this study suggests better accuracy was achieved with smaller learning rates of 2e-6,1e-3 as compared to 8e-6,1e-4. With number of epochs increases, the accuracy tends to increase as well. In Table 5 Test 5 and 6, with learning rate of 2e-6,1e-3, the accuracy of VGG16 has managed to reach 96.9743% for 30 epochs as compared to 89.0318% for 15 epochs. Test 17 and 18 also demonstrates the same characteristic with an increase of accuracy from 77.99 to 83.06%, about a 6.50% difference with increase of 15 to 30 epochs.
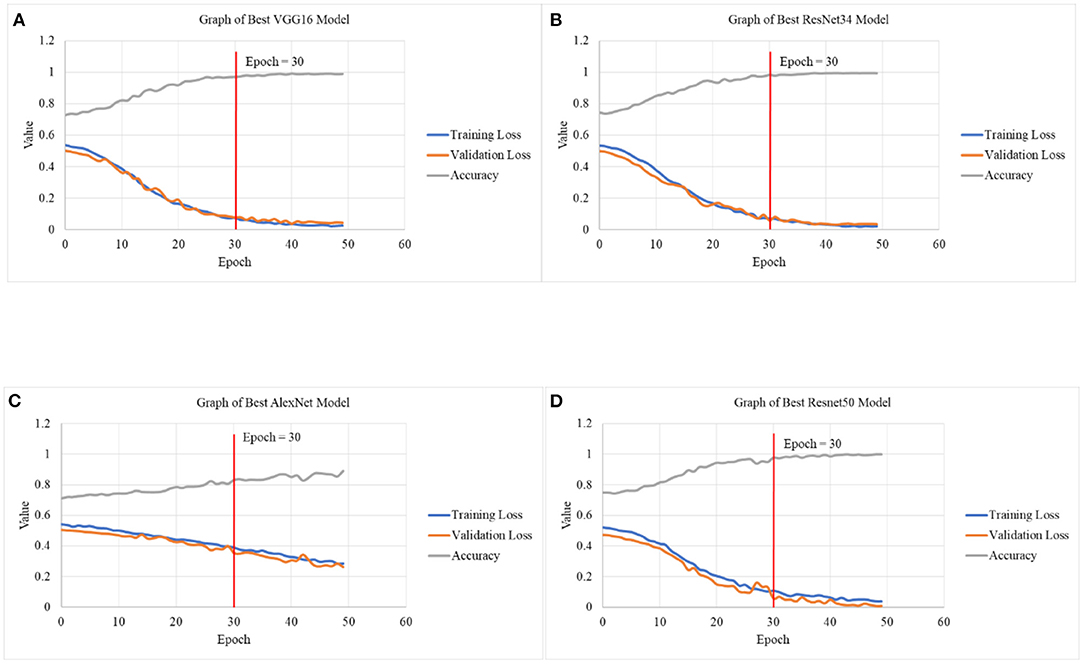
Figure 5. Graphical illustration of CNN models in terms of Training Loss, Validation Loss and Accuracy in (A) graph of best VGG16 model, (B) graph of best ResNet34 model, (C) graph of best AlexNet model, and (D) graph of best ResNet50 model.
By referring to Figure 5, upon reaching 30 epochs, the losses and accuracy starts to flatten out, suggesting overfitting. Overfitting occurs when the network begins to overfit the data and the error on the validation set will soon begin to rise on a regular basis. This is where training should be terminated (39, 40). Therefore, the number of epochs for all the models is fixed at 30. In addition to that, the training and validation loss at 30 epochs is not increasing nor achieving linearity before minimal loss is achieved, suggesting that the result is not overfitting.
As deep learning becomes more popular, more researchers created new architectures with deeper CNN in radiomics of mammographic imaging to improve breast cancer diagnosis (41). VGG net requires much more parameters to thoroughly evaluate its performance. In (30, 31), the use of VGG16 was modified to classify microcalcification images into benign or malignant cases from the DDSM database and obtained accuracy of 94.3 and 87.0%, respectively. Study of (33) utilized AlexNet and managed to achieve an accuracy of 79.1% upon utilizing 10-fold cross validation technique with 300 epochs and learning rate of 0.01 based on 900 images from SYUCC and NAHSMU database. In this research, the technique of cross validation was not performed, but the accuracy achieved in AlexNet is much higher, reaching 83.1% with just 30 epochs. The difference in the result might be due to the different database of images that was used. For instance, this research utilizes ROI calcification images of CIBS-DDSM database which provides higher resolution. Also, the learning rate that was used in this study is much smaller. Study of (42) highlights that smaller learning rate can frequently increase generalization of accuracy substantially. A slower learning rate may allow the model to learn a set of weights that is more optimum or even globally optimal. This might explain why smaller learning rates may also be able to produce models with higher accuracy.
Study of (34) classified 1,852 calcification images of CIDB-DDSM database into CNN pretrained models of modified AlexNet and ResNet50, of which the FC8 layer in AlexNet or FC1000 layer in ResNet50 is replaced with a shallow classifier (SVM). With 20 epochs, the accuracy for breast microcalcification for Resnet50 has managed to reach 91% while AlexNet has reached 90%. Although the accuracy for the AlexNet model in this study was lower (83.1%), the accuracy for Resnet50 managed surpassed with a value of 97.6%. Modified ResNet50 was also observed in (26, 32, 43), with (43) achieving the highest accuracy of 90.3% upon utilizing 354 images from Inbreast dataset. The Resnet50 model in this study is able to surpass existing work with accuracy value of 97.6%. The main difference between the models is the image that is fed to the machine for training. For instance, this research directly utilizes ROI calcification images of CIBS-DDSM database, which enables the machine to learn the features of malignant and benign calcified cases accurately.
The use of Resnet34 in breast microcalcification can be observed in the study of (23), where the authors utilized 2D Resnet34 together with anisotropic 3D Resnet to classify 495 Digital Breast Tomosynthesis (DBT) microcalcification images and reached an accuracy value of 76.0%. The model of Resnet34 in this study is able to provide a significantly higher accuracy value, which is 97.4%, probably due to the large number of images (6,611 images) utilized for machine learning, of which is 13 times larger than the study of (23).
Figure 6 depicts the confusion matrix of CNN models. Overall, the AlexNet model has the highest percentage of both falsely classified benign and falsely classified malignant cases, which is 11.37% and 15.48%, respectively. The performance of the Resnet50 is considered as the best because it only has 1 misclassified image over 1,322 images, while Resnet34 has a total of nine misclassified images. For the case of VGG, it has a total of 13 misclassified images. Based on the values obtained in the confusion matrix, calculation for additional performance measurement was performed and tabulated in Table 9.
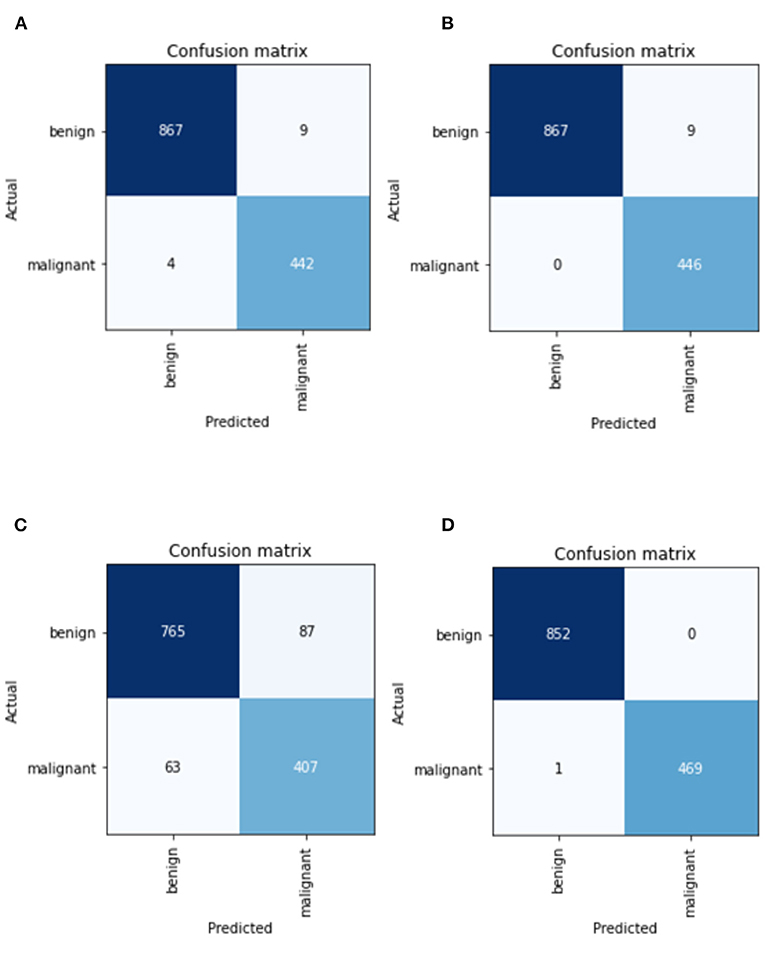
Figure 6. Confusion matrix of CNN models in (A) best VGG16 model, (B) best ResNet34 model, (C) best AlexNet model, and (D) best ResNet50 model.
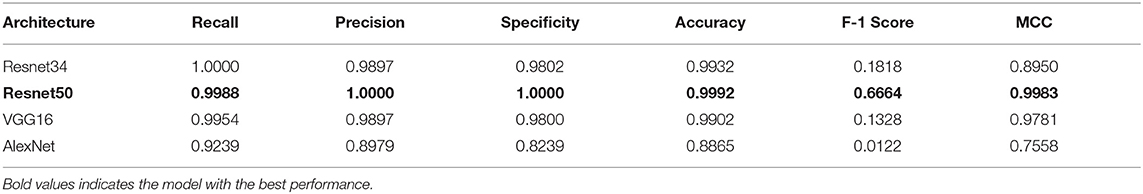
Table 9. Additional performance measurement for best Resnet34, Resnet50, VGG16 and AlexNet model.
Based on Table 9, Resnet50 has the highest precision, specificity, and accuracy, while ResNet 34 model has the highest Recall, which is also referred to as True Positive Rate or Sensitivity. Result from this study suggests that the performance by ResNet model outperforms VGG and AlexNet models. ResNet50 also has the highest F1-score (0.6664), which indicates how accurate a model is on a given dataset. MCC, can be considered as the most credible statistical metric since it is only high if all four confusion matrix categories are correctly predicted. From this study, Resnet50 is able to achieve the highest score of MCC with a value of 0.9983.
In a summary, an automated microcalcification detection in mammography for early breast cancer diagnosis using deep learning techniques has been successfully developed. Collected greyscale mammogram images had undergone pre-processing operations which includes conversion of images from DICOM to *.jpeg format, resizing to 224 × 224 pixels, removal of artifacts, and image enhancement by application of adaptive median filter. Transfer learning technique for CNN architectures was employed and result shows that ResNet50 achieves the highest accuracy with a value of 97.58%, followed by ResNet34 of 97.35%, VGG16 of 96.97% and finally AlexNet of 83.06%. The main limitation with current work is the possibility of the machine to remember the repeated patterning of the dataset for classification into benign or malignant cases via implementation of data augmentation. Resizing of ROI images might also result in data compression and loss of useful features or information of the image.
Our proposed work has built an end-to-end novel adaptive transfer learning convolutional neural network that has shown ability to discriminate microcalcifications of breast mammograms into benign or malignant cases. ROI breast images were acquired from CIBS-DDSM database to obtain a higher resolution image of breast mammogram. The selection of quality datasets, abundancy of images for training, as well as tuning of hyperparameters are all important in improving the accuracy of the models. We have also shown a quantitative analysis on the effectiveness of three filters, namely adaptive median, median and mean filter in noise removal of breast microcalcification mammogram images by calculating the MSE and PSNR value. As compared to traditional method of feature extraction which uses coordinates to identify the location of microcalcification, we have successfully automize the model to identify the characterization of benign and malignant microcalcification patterns. All CNN models that were trained shows powerful ability to discriminate benign and malignant microcalcification, with ResNet50 achieving the highest accuracy of 97.58%.
Breast cancer is a significant threat to women or men all over the world and improving the existing state of breast cancer detection systems is definitely a critical challenge. Findings from this study will be able narrow the gap of findings for CNNs models which were mostly tailored for binary classifier that focuses solely on breast microcalcification classification by providing a comparative comparison beginning from datasets that is utilized, pre-processing algorithms that are included, up to the algorithms utilized during machine learning. In addition, this study will also be able to aid research in developing a competent binary classification model by providing a comprehensive approach to the recent results on different CNN models in breast microcalcification detection. In future, different sources of breast images could be incorporated, such as 3D mammogram images, in order to identify and compare the effectiveness of the model in classifying different sources of microcalcification images. K-fold cross validation could also be incorporated in the algorithm to combine metrics of prediction fitness to get a more accurate estimate of model prediction performance.
Publicly available datasets were analyzed in this study. This data can be found at: https://www.cancerimagingarchive.net.
YL and KH designed and developed the algorithm as well as major contributors to the article writing. KL, NM, and MA performed the comparison analysis and checked all the synthesized data. All authors approved the final version to be submitted for publication.
The project was funded by University Malaya Research Grant Faculty Programme (RF010-2018A).
The authors declare that the research was conducted in the absence of any commercial or financial relationships that could be construed as a potential conflict of interest.
All claims expressed in this article are solely those of the authors and do not necessarily represent those of their affiliated organizations, or those of the publisher, the editors and the reviewers. Any product that may be evaluated in this article, or claim that may be made by its manufacturer, is not guaranteed or endorsed by the publisher.
1. Kashif M, Malik KR, Jabbar S, Chaudhry J. Application of machine learning and image processing for detection of breast cancer. In: Lytras MD, Sarirete A, editors. Innovation in Health Informatics. Cambridge, MA: Academic Press (2020), p. 145–62. doi: 10.1016/B978-0-12-819043-2.00006-X
2. Litjens G, Kooi T, Bejnordi BE, Setio AA, Ciompi F, Ghafoorian M, et al. survey on deep learning in medical image analysis. Med Image Anal. (2017) 42:60–88. doi: 10.1016/j.media.2017.07.005
3. Nelson HD. O'meara ES, Kerlikowske K, Balch S, Miglioretti D. Factors associated with rates of false-positive and false-negative results from digital mammography screening: an analysis of registry data. Ann Inern Med. (2016) 164:226–35. doi: 10.7326/M15-0971
4. Sun YS, Zhao Z, Yang ZN, Xu F, Lu HJ, Zhu ZY, et al. Risk factors and preventions of breast cancer. Int J Biol Sci. (2017) 13:1387. doi: 10.7150/ijbs.21635
5. Koo MM, von Wagner C, Abel GA, McPhail S, Rubin GP, Lyratzopoulos G. Typical and atypical presenting symptoms of breast cancer and their associations with diagnostic intervals: evidence from a national audit of cancer diagnosis. Cancer Epidemiol. (2017) 48:140–6. doi: 10.1016/j.canep.2017.04.010
6. Redaniel MT, Martin RM, Ridd MJ, Wade J, Jeffreys M. Diagnostic intervals and its association with breast, prostate, lung and colorectal cancer survival in England: historical cohort study using the Clinical Practice Research Datalink. PLoS ONE. (2015) 10:e0126608. doi: 10.1371/journal.pone.0126608
7. Baker R, Rogers KD, Shepherd N, Stone N. New relationships between breast microcalcifications and cancer. Br J Cancer. (2010) 103:1034–9. doi: 10.1038/sj.bjc.6605873
8. Mordang JJ, Gubern-Mérida A, Bria A, Tortorella F, Mann RM, Broeders MJ, et al. The importance of early detection of calcifications associated with breast cancer in screening. Breast Cancer Res Treat. (2018) 167:451–8. doi: 10.1007/s10549-017-4527-7
9. Nayak T, Bhat N, Bhat V, Shetty S, Javed M, Nagabhushan P. Automatic segmentation and breast density estimation for cancer detection using an efficient watershed algorithm. In: Nagabhushan P, Guru DS, Shekar BH, Sharath Kuma, YH, editors. Data Analytics and Learning. Singapore: Springer (2019), p. 347–58. doi: 10.1007/978-981-13-2514-4_29
10. Beeravolu AR, Azam S, Jonkman M, Shanmugam B, Kannoorpatti K, Anwar A. Preprocessing of breast cancer images to create datasets for deep-cnn. IEEE Access. (2021) 9:33438–63. doi: 10.1109/ACCESS.2021.3058773
11. Alkhaleefah M, Wu CC. A hybrid CNN and RBF-based SVM approach for breast cancer classification in mammograms. In: 2018 IEEE International Conference on Systems, Man, and Cybernetics (SMC). Miyazaki: IEEE (2018), p. 894–9. doi: 10.1109/SMC.2018.00159
12. Spruit M, Lytras M. Applied data science in patient-centric healthcare: Adaptive analytic systems for empowering physicians and patients. Telemat Inform. (2018) 35:643–53. doi: 10.1016/j.tele.2018.04.002
13. Jusman Y, Ng SC, Hasikin K, Kurnia R, Osman NAA, Teoh KH. A system for detection of cervical precancerous in field emission scanning electron microscope images using texture features. J Innov Opt Health Sci. (2017) 10:1650045. doi: 10.1142/S1793545816500450
14. Avanzo M, Porzio M, Lorenzon L, Milan L, Sghedoni R, Russo G, et al. Artificial intelligence applications in medical imaging: A review of the medical physics research in Italy. Physica Medica. (2021) 83:221–41. doi: 10.1016/j.ejmp.2021.04.010
15. Amoroso N, Rocca ML, Bellotti R, Fanizzi A, Monaco A, Tangaro S. Alzheimer's disease diagnosis based on the hippocampal unified multi-atlas network (HUMAN) algorithm. Biomed Eng Online. (2018) 17:6. doi: 10.1186/s12938-018-0439-y
16. Comes MC, Fanizzi A, Bove S, Didonna V, Diotaiuti S, La Forgia D, et al. Early prediction of neoadjuvant chemotherapy response by exploiting a transfer learning approach on breast DCE-MRIs. Sci Rep. (2021) 11:1–2. doi: 10.1038/s41598-021-93592-z
17. Abdelhafiz D, Yang C, Ammar R, Nabavi S. Deep convolutional neural networks for mammography: advances, challenges and applications. BMC Bioinformatics. (2019) 20:1–20. doi: 10.1186/s12859-019-2823-4
18. Lee JG, Jun S, Cho YW, Lee H, Kim GB, Seo JB, et al. Deep learning in medical imaging: general overview. Korean J Radiol. (2017) 18:570–84. doi: 10.3348/kjr.2017.18.4.570
19. Kooi T, Gubern-Merida A, Mordang JJ, Mann R, Pijnappel R, Schuur K, Heeten AD, Karssemeijer N. A comparison between a deep convolutional neural network and radiologists for classifying regions of interest in mammography. In: Tingberg A, Lång K, Timberg P, editors. International Workshop on Breast Imaging. Cham: Springer (2016), p. 51–6. doi: 10.1007/978-3-319-41546-8_7
20. Wang J, Yang X, Cai H, Tan W, Jin C, Li L. Discrimination of breast cancer with microcalcifications on mammography by deep learning. Sci Rep. (2016) 6:1–9. doi: 10.1038/srep27327
21. Fadil R, Jackson A, Abou El Majd B, El Ghazi H, Kaabouch N. Classification of microcalcifications in mammograms using 2D discrete wavelet transform and random forest. In: 2020 IEEE International Conference on Electro Information Technology (EIT). Chicago, IL: IEEE (2020), p. 353–9. doi: 10.1109/EIT48999.2020.9208290
22. Tsochatzidis L, Costaridou L, Pratikakis I. Deep learning for breast cancer diagnosis from mammograms—a comparative study. J Imaging. (2019) 5:37. doi: 10.3390/jimaging5030037
23. Xiao B, Sun H, Meng Y, Peng Y, Yang X, Chen S, et al. Classification of microcalcification clusters in digital breast tomosynthesis using ensemble convolutional neural network. Biomed Eng Online. (2021) 20:1–20. doi: 10.1186/s12938-021-00908-1
24. Li J, Pei Y, Yasin A, Ali S, Mahmood T. Computer vision-based microcalcification detection in digital mammograms using fully connected depthwise separable Convolutional Neural Network. Sensors. (2021) 21:4854. doi: 10.3390/s21144854
25. Khamparia A, Bharati S, Podder P, Gupta D, Khanna A, Phung TK, et al. Diagnosis of breast cancer based on modern mammography using hybrid transfer learning. Multidimens Syst Signal Process. (2021) 32:747–65. doi: 10.1007/s11045-020-00756-7
26. Heenaye-Mamode Khan M, Boodoo-Jahangeer N, Dullull W, Nathire S, Gao X, Sinha GR, et al. Multi-class classification of breast cancer abnormalities using Deep Convolutional Neural Network (CNN). PLoS ONE. (2021) 16:e0256500. doi: 10.1371/journal.pone.0256500
27. Cai H, Huang Q, Rong W, Song Y, Li J, Wang J, Chen J, Li L. Breast microcalcification diagnosis using deep convolutional neural network from digital mammograms. Comput Math Methods Med. (2019) 2019:2717454. doi: 10.1155/2019/2717454
28. Hekal AA, Elnakib A, Moustafa HE. Automated early breast cancer detection and classification system. Signal Image Video Process. (2021) 15:1497–505. doi: 10.1007/s11760-021-01882-w
29. Xi P, Shu C, Goubran R. Abnormality detection in mammography using deep convolutional neural networks. In: 2018 IEEE International Symposium on Medical Measurements and Applications (MeMeA). Istanbul: IEEE (2018), p. 1–6.
30. Thanh DN, Erkan U, Prasath VS, Kumar V, Hien NN. A skin lesion segmentation method for dermoscopic images based on adaptive thresholding with normalization of color models. In: 2019 6th International Conference on Electrical and Electronics Engineering (ICEEE). Patna: IEEE (2019), p. 116–20. doi: 10.1109/ICEEE2019.2019.00030
31. Suradi SH, Abdullah KA, Isa NA. Breast lesions detection using FADHECAL and Multilevel Otsu Thresholding Segmentation in digital mammograms. In: Badnjevic A, Pokvić LG, editors. International Conference on Medical and Biological Engineering. Cham: Springer (2021), p. 751–9. doi: 10.1007/978-3-030-73909-6_85
32. Bhandari AK, Maurya S, Meena AK. Social spider optimization based optimally weighted Otsu thresholding for image enhancement. In: IEEE Journal of Selected Topics in Applied Earth Observations and Remote Sensing. Washington, DC (2018). doi: 10.1109/JSTARS.2018.2870157
33. Khairnar S, Thepade SD, Gite S. Effect of image binarization thresholds on breast cancer identification in mammography images using OTSU, Niblack, Burnsen, Thepade's SBTC. Intell Syst Appl. (2021) 10:200046. doi: 10.1016/j.iswa.2021.200046
34. Nixon M, Aguado A. Feature Extraction and Image Processing for Computer Vision. Cambridge, MA: Academic Press (2019). doi: 10.1016/B978-0-12-814976-8.00003-8
35. Boss R, Thangavel K, Daniel D. Automatic mammogram image breast region extraction and removal of pectoral muscle. arXiv preprint arXiv:1307.7474. (2013). doi: 10.48550/arXiv.1307.7474
36. Cashmi AJ, Chehelamirani MAJ. Using adaptive median filter for noise removal from image to diagnose breast cancer. Merit Res J Eng Pure Appl Sci. (2019) 5:14–8. doi: 10.5281/zenodo.3374916
37. Ramani R, Vanitha NS, Valarmathy S. The pre-processing techniques for breast cancer detection in mammography images. Int J Image Graph Signal Process. (2013) 5:47. doi: 10.5815/ijigsp.2013.05.06
38. Kandel I, Castelli M. The effect of batch size on the generalizability of the convolutional neural networks on a histopathology dataset. ICT Express. (2020) 6:312–5. doi: 10.1016/j.icte.2020.04.010
39. Afaq S, Rao S. Significance of epochs on training a neural network. Int J Sci Technol Res. (2020) 19:485–8. Available online at: https://www.ijstr.org/final-print/jun2020/Significance-Of-Epochs-On-Training-A-Neural-Network.pdf
40. Swathi P. Analysis on solutions for over-fitting and under-fitting in machine learning algorithms. Int J Innov Res Sci Eng Technol. (2018). 7:12404. doi: 10.15680/IJIRSET.2018.0712086
41. Pang T, Wong JH, Ng WL, Chan CS. Deep learning radiomics in breast cancer with different modalities: overview and future. Expert Syst Appl. (2020) 158:113501. doi: 10.1016/j.eswa.2020.113501
42. Wilson DR, Martinez TR. The need for small learning rates on large problems. In: IJCNN'01. International Joint Conference on Neural Networks. Proceedings (Cat. No. 01CH37222). Vol. 1. IEEE (2001), p. 115–9.
Keywords: transfer learning, region of interest (ROI), intervention, machine learning, artificial intelligence
Citation: Leong YS, Hasikin K, Lai KW, Mohd Zain N and Azizan MM (2022) Microcalcification Discrimination in Mammography Using Deep Convolutional Neural Network: Towards Rapid and Early Breast Cancer Diagnosis. Front. Public Health 10:875305. doi: 10.3389/fpubh.2022.875305
Received: 14 February 2022; Accepted: 04 April 2022;
Published: 28 April 2022.
Edited by:
Yu-Hsiu Lin, National Chung Cheng University, TaiwanReviewed by:
Raffaella Massafra, National Cancer Institute Foundation (IRCCS), ItalyCopyright © 2022 Leong, Hasikin, Lai, Mohd Zain and Azizan. This is an open-access article distributed under the terms of the Creative Commons Attribution License (CC BY). The use, distribution or reproduction in other forums is permitted, provided the original author(s) and the copyright owner(s) are credited and that the original publication in this journal is cited, in accordance with accepted academic practice. No use, distribution or reproduction is permitted which does not comply with these terms.
*Correspondence: Khairunnisa Hasikin, a2hhaXJ1bm5pc2FAdW0uZWR1Lm15; Muhammad Mokhzaini Azizan, bW9raHphaW5pYXppemFuQHVzaW0uZWR1Lm15
Disclaimer: All claims expressed in this article are solely those of the authors and do not necessarily represent those of their affiliated organizations, or those of the publisher, the editors and the reviewers. Any product that may be evaluated in this article or claim that may be made by its manufacturer is not guaranteed or endorsed by the publisher.
Research integrity at Frontiers
Learn more about the work of our research integrity team to safeguard the quality of each article we publish.