- 1Department of Cardiology, Chengdu Second People's Hospital, Chengdu, China
- 2Department of Epidemiology and Health Statistics, West China School of Public Health and West China Fourth Hospital, Sichuan University, Chengdu, China
- 3School of Health Policy and Management, Nanjing Medical University, Nanjing, China
- 4Institute of Healthy Jiangsu Development, Nanjing Medical University, Nanjing, China
- 5Stroke Center, Chengdu Second People's Hospital, Chengdu, China
- 6Division of Cardiology, Department of Internal Medicine, National Taiwan University Hospital, Taipei City, Taiwan
Objective: The aim of our study was to assess the prevalence and geographic variation of obesity-related hypertension in China among adults aged 45 years or older.
Methods: Data were derived from the China Health and Retirement Longitudinal Study (CHARLS) conducted in 2015. Stratified sample households covered 150 counties/districts and 450 villages/urban communities from 28 provinces by using household questionnaires, clinical measurements, and blood-based bioassays. A multivariable non-conditional logistic regression model was used to analyze the risk factors correlated with obesity-related hypertension.
Results: The prevalence of obesity-related hypertension was 22.7%, ~120 million people, among adults aged 45 years or older in China. For people in the age ranges of 45–54, 55–64, 65–74, and ≥75 years, the prevalence of obesity-related hypertension was 16.7, 24.3, 27, and 26.7%, respectively, and the prevalence of obesity-related hypertension among hypertensive participants was 66.0, 60.9, 54.2, and 47.3%, respectively. Compared with non-obesity-related hypertension, the obesity-related hypertensive patients had a higher prevalence of diabetes mellitus, dyslipidemia, and hyperuricemia (all P < 0.0001). The prevalence of obesity-related hypertension showed a decreasing gradient from north to south and from east to west. Multivariate logistic regression analysis showed that female gender, living in urban areas, diabetes mellitus, dyslipidemia, and hyperuricemia were positively correlated with obesity-related hypertension.
Conclusion: The prevalence of obesity-related hypertension among adults aged 45 years or older was high in China. Among hypertensive participants, older age was negatively correlated with obesity-related hypertension. Obesity-related hypertensive participants are more prone to aggregation of risk factors of atherosclerotic cardiovascular disease.
Introduction
Hypertension and obesity are independent risk factors for cardiovascular diseases and all-cause mortality (1–4), and they often co-existed (5, 6). In the past few decades, China has seen rapid economic development and urbanization, which have led to lifestyle changes such as increased unhealthy nutrition and reduced physical activity, which in turn have led to an increase in hypertension and obesity prevalence (1, 7, 8). The prevalence of hypertension increased from 18% in 2002 (9) to 29.6% in 2010 (10) among Chinese adults. The prevalence of general obesity (body mass index, BMI ≥ 28 kg/m2) increased from 4.0 in 2002 to 10.7% in 2009 (11). In the 2011 China Health and Nutrition Survey, the prevalence of general obesity (BMI ≥ 28 kg/m2) increased to 11.3% (12). From 1993 to 2015, mean waist circumference (WC) increased from 76.0 to 83.4 cm and the prevalence increased from 20.2 to 46.9% for abdominal obesity (WC ≥90 cm for men and ≥80 cm for women) (13). In the China Health and Nutrition Survey (CHNS) conducted from 1993 to 2009, the trend in the prevalence of abdominal (central) obesity among participants with normal BMI (BMI < 25 kg/m2) increased from 11.9 to 21.1% (14).
Previous studies revealed that the prevalence of hypertension was more than two times higher in general obesity than in non-obese individuals (15), and abdominal obesity patients had a 2–3-fold higher risk of developing hypertension than non-obese individuals (16). Hypertensive patients with obesity are prone to requiring more antihypertensive medications and have a higher risk of developing treatment-resistant hypertension (6). Furthermore, they are more likely to be exposed to metabolic and cardiovascular risk factors (17). From 2009 to 2012, the European Society of Hypertension Working Group on Obesity published a series of articles about the pathophysiology, cardiovascular risk, target organ damage, and treatment of obesity-related hypertension (6, 18–20). In 2013, the Obesity Society and the American Society of Hypertension agreed to jointly sponsor a position paper: Obesity-related hypertension: pathogenesis, cardiovascular risk, and treatment (21). In 2016, China published the “Chinese expert consensus on obesity-related hypertension management” to provide definitions and guidelines regarding the treatment of obesity-related hypertension (22). More and more attention has been paid to the diagnosis and treatment of obesity-related hypertension. However, there has been no national epidemiological investigation into it. Our study aimed at reporting the prevalence and regional distribution of obesity-related hypertension and its characteristics among adults aged 45 years or older in China.
Methods
Participants
China Health and Retirement Longitudinal Study (CHARLS) is a nationally representative survey of adults aged 45 years or older, including household questionnaires, clinical measurements, and blood-based bioassays. CHARLS samples covered 150 counties/districts and 450 villages/urban communities based on probability proportional to size random sampling procedures. In the study, 13,013 respondents provided venous blood samples, of which the shipping temperature was strictly controlled. Blood sample analysis was carried out in two stages. Blood samples were analyzed by whole blood cell count in the local county health centers immediately. Then the samples were transported to the headquarters, where they were analyzed for hsCRP, HbA1c, blood lipids, blood glucose, blood urea nitrogen, creatinine, and uric acid. Before the blood pressure test, respondents were relaxed and kept sitting. The blood pressure was measured using an Omron hem-7,200 every 5 min, and the blood pressure was measured three times. We selected 11,364 participants who donated fasting blood samples, assayed on a whole range of indicators, and were interviewed in the 2015 follow-up wave of CHARLS. We excluded individuals if they did not complete clinical measurements and blood-based bioassays; or they had missing values for sex, birth date, residence, marital status, weight, height, waist circumference, and blood pressure; or they had unreliable values for weight, height, waist circumference; or they were < 45 years old. A total of 10,108 participants were included in the final analysis. All bioassays were performed at KingMed Laboratory. The biomarker sample collection study protocol was approved by the Ethical Review Committee (Institutional Review Board) of Peking University (IRB 00001052-11014). Written informed consent was obtained from all study participants.
Definition of obesity-related hypertension
We defined obesity-related hypertension as (1) body mass index (BMI) ≥ 28 kg/m2 and/or waist circumstance (WC) ≥ 90 cm (male) or 85 cm (female) and (2) systolic blood pressure (SBP) ≥ 140 mmHg and/or diastolic blood pressure (DBP) ≥ 90 mmHg or a self-reported diagnosis of hypertension, according to Chinese expert consensus on the obesity-related hypertension management (22).
Definition of independent variable
Married or cohabitated was defined as any one of the following: (1) married with spouse present, (2) married but not living with spouse temporarily for reasons such as work, and (3) cohabitated. Singles included those who were separated, divorced, widowed, or never married. Urban areas included (1) main city zone, (2) combination zone between urban and rural areas, (3) the town center, (4) ZhenXiang area, and (5) special area. Rural areas included (1) township central and (2) village. The Qinling Mountains and Huaihe River line are considered the natural dividing line between north and south China (23), in this study. Northern provinces included Beijing, Gansu, Hebei, Henan, Heilongjiang, Jilin, Liaoning, Inner Mongolia autonomous region, Qinghai, Shandong, Shaanxi, Shanxi, Tianjin, and Xinjiang Uygur Autonomous Region. Southern provinces included Anhui, Fujian, Guangdong, Guangxi Zhuang Autonomous Region, Guizhou, Hubei, Hunan, Jiangsu, Jiangxi, Shanghai, Sichuan, Yunnan, Zhejiang, and Chongqing. In combination with the seventh five-year plan adopted at the sixth session of the National People's Congress and the western development policy formulated by the state, China is divided into three belts: the central, the east, and the west. In this study, Central provinces included Anhui, Henan, Heilongjiang, Hubei, Hunan, Jilin, Jiangxi, and Shanxi. Eastern provinces included Beijing, Fujian, Guangdong, Hebei, Jiangsu, Liaoning, Shandong, Shanghai, Tianjin, and Zhejiang. Western provinces included Gansu, Guangxi Zhuang Autonomous Region, Guizhou, Inner Mongolia autonomous region, Qinghai, Shaanxi, Sichuan, Xinjiang Uygur Autonomous Region, Yunnan, and Chongqing.
Smoking was defined as any one of the following: (1) having ever chewed tobacco, (2) smoked a pipe, (3) smoked self-rolled cigarettes, or (4) smoked cigarettes/cigars. Drinking was defined as any alcoholic beverage consumed in the past year. Diabetes mellitus was defined as any one of the following: (1) a self-reported diagnosis of diabetes mellitus, (2) fasting plasma glucose ≥ 126 mg/dl (7.0 mmol/L), and (3) glycated hemoglobin (HbA1c) ≥ 6.5% (24). Dyslipidemia was defined as any one of the following: (1) a self-reported diagnosis of dyslipidemia, (2) total cholesterol (TC) ≥ 240 mg/dl (6.2 mmol/L), (3) low-density lipoprotein cholesterol (LDL-C) ≥ 160 mg/dl (4.1 mmol/L), (4) high-density lipoprotein cholesterol (HDL-C) < 40 mg/dl (1.0 mmol/L), or (5) triglyceride (TG) ≥ 200 mg/dl (2.3 mmol/L) (25). Hyperuricemia was defined as male serum uric acid (SUA) > 7 mg/dl (420 μmol/L) and female SUA > 6 mg/dL (360 μmol/L) (26).
Statistical analysis
Quantitative data with a normal distribution were presented as a mean with the standard deviation (SD), and the Student's t-test was used to detect the difference across the groups. Quantitative data with the skewed distribution were presented as medians with the interquartile range, and the Wilcoxon rank sum test was used to detect the difference across the groups. Qualitative data were presented as absolute numbers with the percentage (%), Pearson's chi-square test was used to assess the statistical significance of differences, and the Cochran-Armitage trend test was performed to support the trend hypothesis. We estimated the prevalence of hypertension and obesity-related hypertension for both men and women in four age groups (45–54, 55–64, 65–74, and ≥75 years) in rural and urban settings. Furthermore, we created a dump variable for missing values. A multivariable non-conditional logistic regression model was used to estimate the odds ratios and 95% confidence interval (95% CI) to explore the associated risk factors of obesity-related hypertension. We performed all the statistical analyses using SAS version 9.4 (SAS Institute, Cary, NC, USA). A P < 0.05 was considered significant.
Results
The prevalence of obesity, hypertension, and obesity-related hypertension in different populations
All participants
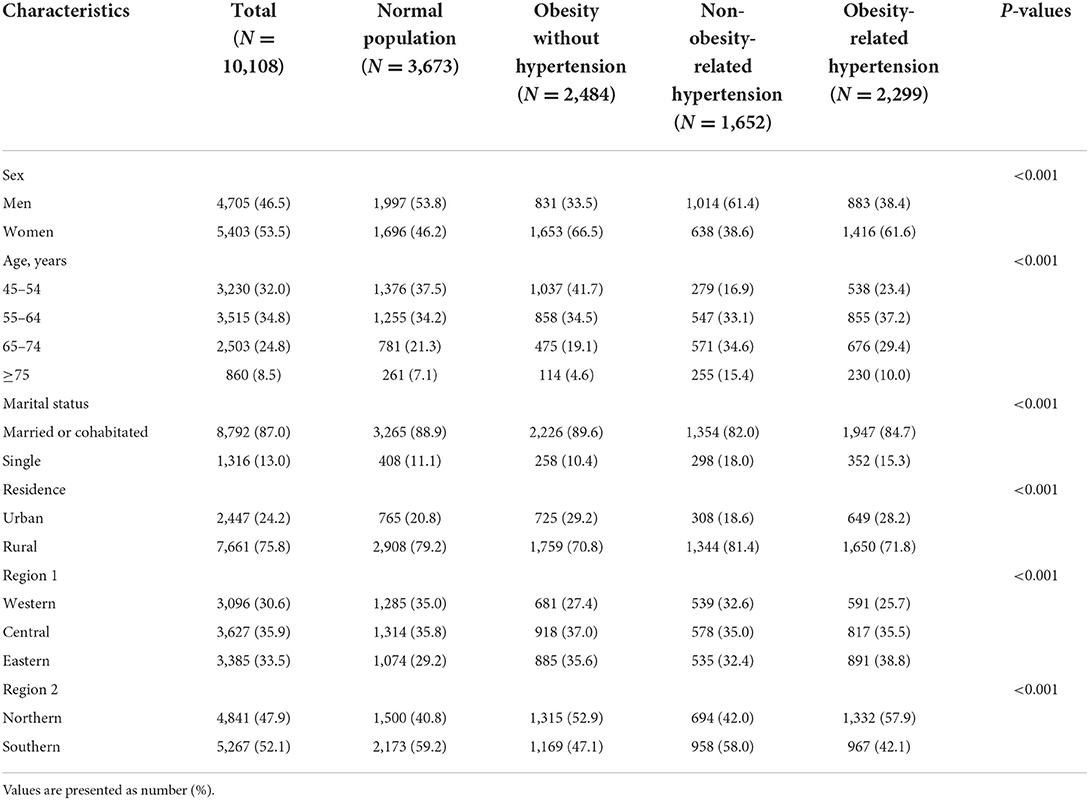
A total of 10,108 participants aged 45 years or older were included in the final analysis, among whom 4,705 were men (46.5%) and 5,403 were women (53.5%). From the western provinces to the central provinces to the eastern provinces, the participants were 3,096 (30.6%), 3,627 (35.9%), 3,385 (33.5%), respectively. From the northern provinces to the southern provinces, the participants were 4,841 (47.9%) vs. 5,267 (52.1%). The prevalence of hypertension, obesity, and obesity-related hypertension among all participants was 39.1% (3,951/10,108), 47.3% (4,783/10,108), and 22.7% (2,299/10,108), respectively. The prevalence of obesity-related hypertension among obese and hypertensive participants was 48.1% (2,299/4,783) and 58.2% (2,299/3,951), respectively. The prevalence of hypertension increased with age (P < 0.001). The prevalence of obesity-related hypertension increased with age (P < 0.001), but it peaked at ages 65–74 years. The prevalence of obesity-related hypertension among hypertensive participants decreased with age (Figures 1, 2, Tables 1–3).
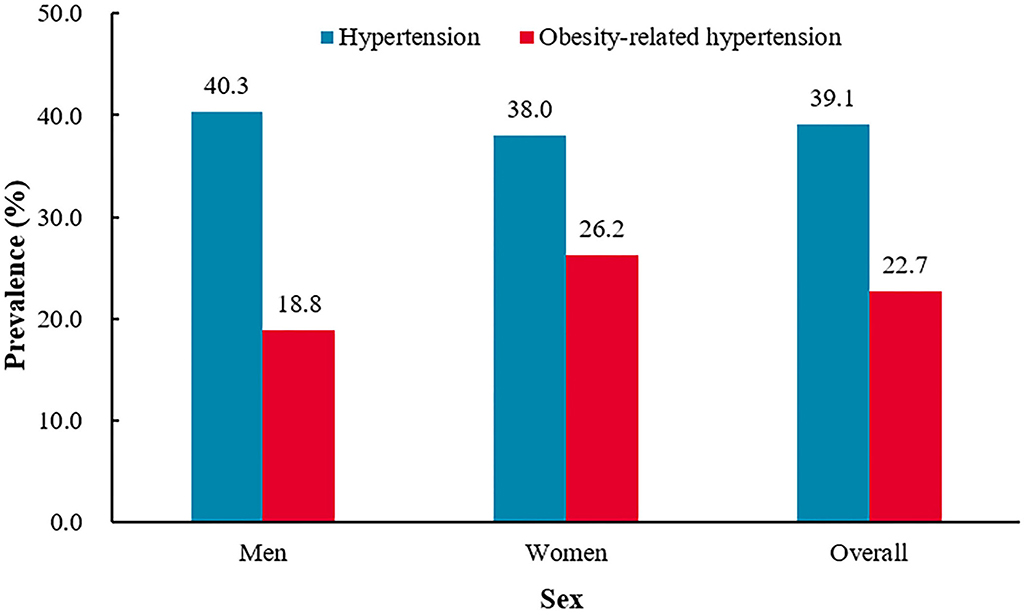
Figure 1. The prevalence of hypertension and obesity-related hypertension among China adults aged 45 years or older.†P = 0.0179 for sex difference in the prevalence of hypertension.‡P = 0.0001 for sex difference in the prevalence of obesity-related hypertension.
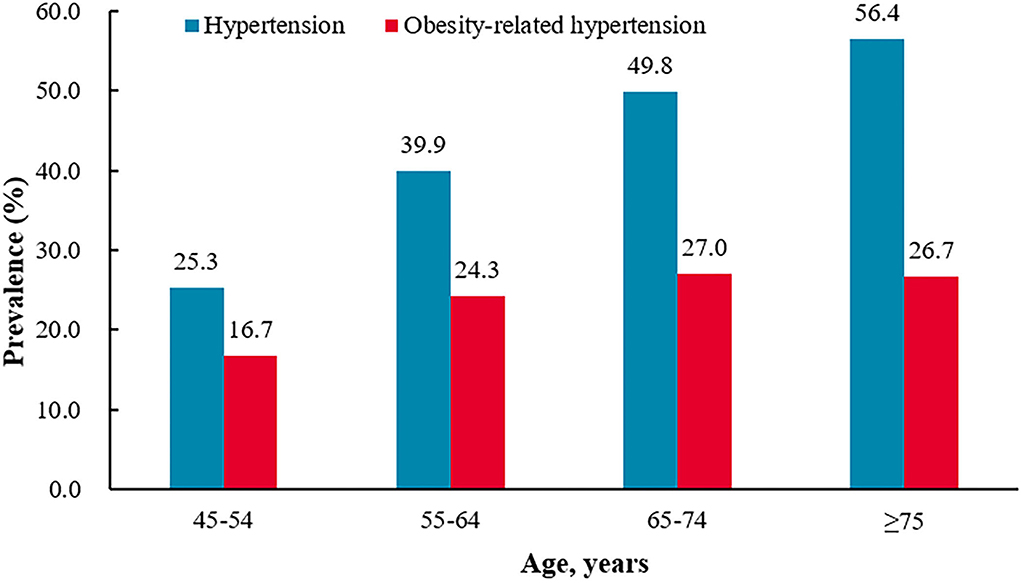
Figure 2. The prevalence of hypertension and obesity-related hypertension different age groups.†P-trend<0.0001 for the trend in the prevalence of hypertension by age groups.‡P-trend<0.0001 for the trend in the prevalence of obesity-related hypertension by age groups. *P = 0.8806 for the difference in the prevalence of obesity-related hypertension between 65–74 age group and >75 age group.

Table 2. The prevalence of obesity, hypertension, obesity-related of hypertension among men, women, urban and rural.
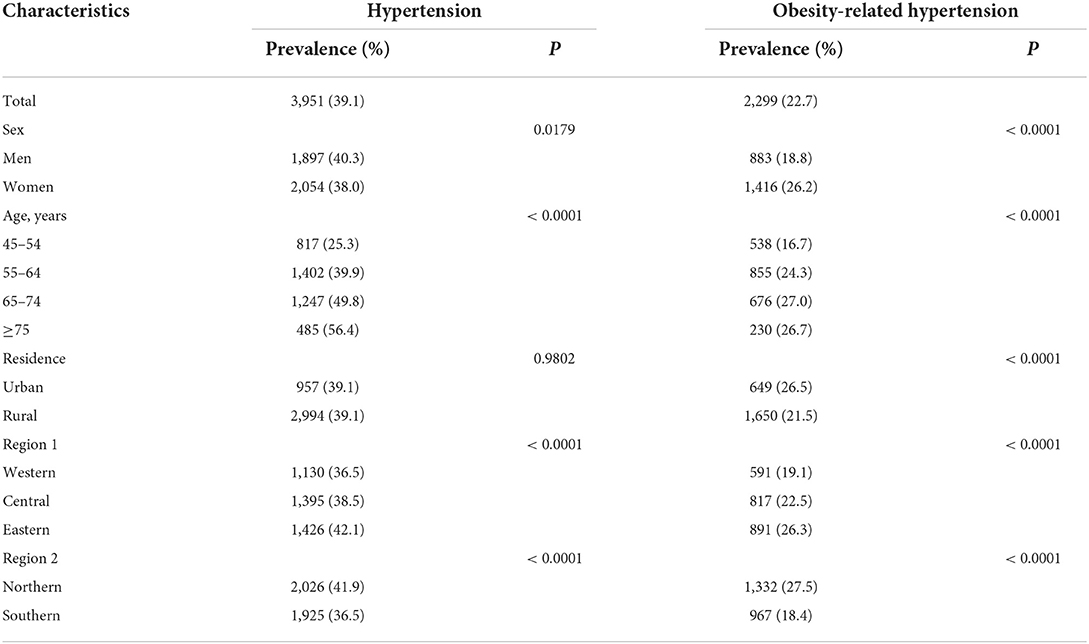
Table 3. The prevalence of hypertension and obesity-related of hypertension among different sex, age, residence, region.
Men vs. women
The prevalence of hypertension was higher in men (men 40.3% vs. women 38.0%, P = 0.0179). Women had a higher prevalence of obesity (men 36.4% vs. women 56.8%, P < 0.0001) and obesity-related hypertension (men 18.8% vs. women 26.2%, P < 0.0001). The prevalence of obesity-related hypertension was higher in women among hypertensive participants (men 46.5% vs. women 68.9%, P < 0.0001), but among the obese participants, the prevalence was higher in men (men 51.5% vs. women 46.1%, P = 0.0004) (Figure 1 and Table 2).
Urban areas vs. rural areas
The prevalence of hypertension was similar between urban residents and rural residents (urban 39.1% vs. rural 39.1%, P = 0.9802). Compared with rural residents, urban residents had a higher prevalence of obesity (urban 56.2% vs. rural 44.5%, P < 0.0001) and obesity-related hypertension (urban 26.5% vs. rural 21.5%, P < 0.0001). The prevalence of obesity-related hypertension was higher in urban residents among hypertensive participants (urban 67.8% vs. rural 55.1%, P < 0.0001), but among obesity participants, the prevalence was similar between urban residents and rural residents (urban 47.2% vs. women 48.4%, P = 0.4648) (Figure 3 and Table 2).
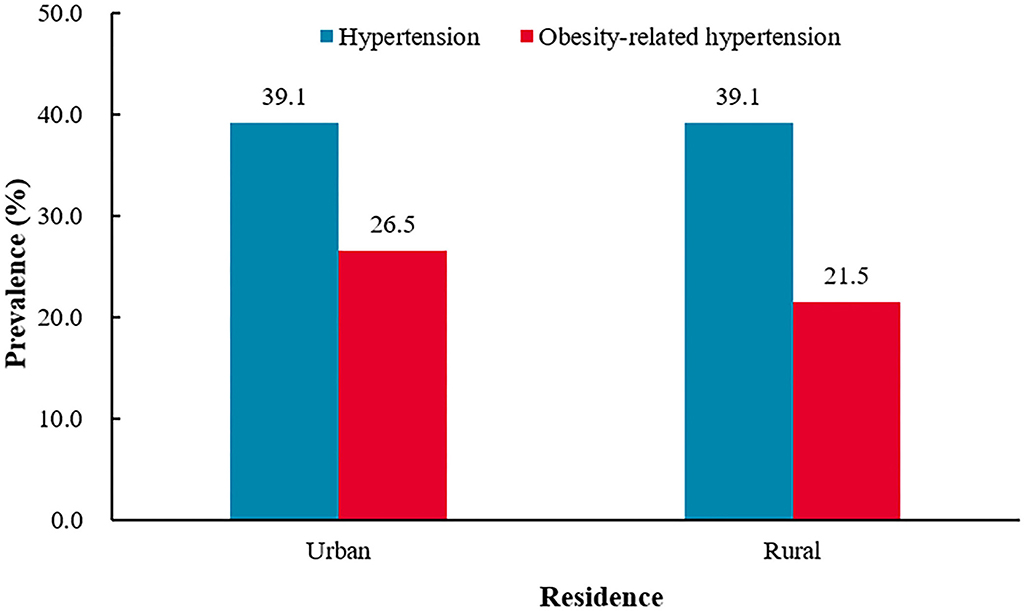
Figure 3. The prevalence of hypertension and obesity-related hypertension among urban and rural areas.†P = 0.9802 for the difference in the prevalence of hypertension between urban and rural.‡P < 0.0001 for the difference in the prevalence of obesity-related hypertension between urban and rural.
Western provinces vs. central provinces vs. eastern provinces
From the western provinces to the central provinces to the eastern provinces, the prevalence of hypertension was 36.5, 38.5, and 42.1% (P < 0.0001), and the prevalence of obesity was 41.1, 47.8, and 52.5% (P < 0.0001), and the prevalence of obesity-related hypertension was 19.1, 22.5, and 26.3% (P < 0.0001), respectively. From western to eastern provinces, there was an increasing trend for the prevalence of hypertension, obesity, and obesity-related hypertension. From the western provinces to the central provinces to the eastern provinces, the prevalence of obesity-related hypertension among hypertensive participants was 52.3, 58.6, and 62.5% (P < 0.0001), and among obesity participants were 46.5, 47.1, and 50.2% (P = 0.0347), respectively (Figure 4 and Table 4).
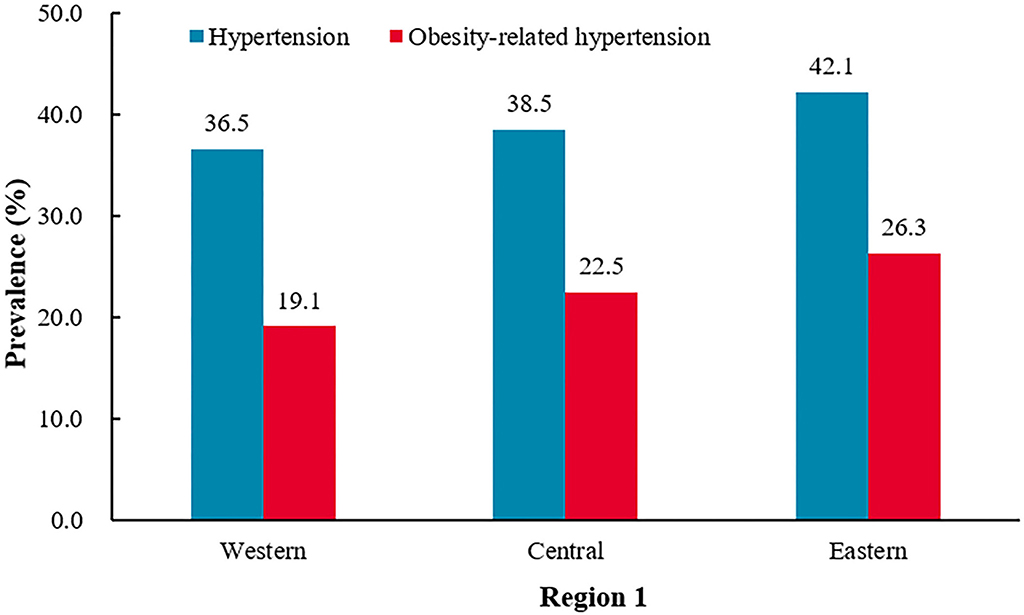
Figure 4. The prevalence of hypertension and obesity-related hypertension among Western, Central, and Eastern provinces.†P < 0.0001 for the difference in the prevalence of hypertension between Western, Central, and Eastern provinces.‡P < 0.0001 for the difference in the prevalence of obesity-related hypertension between Western, Central, and Eastern provinces.

Table 4. The prevalence of obesity, hypertension, obesity-related of hypertension among different regions.
Northern provinces vs. southern provinces
Compared with the southern province residents, the northern province residents had higher prevalence of hypertension (northern 41.9% vs. southern 36.5%, P < 0.0001), obesity (northern 54.7% vs. southern 40.6%, P < 0.0001), and obesity-related hypertension (northern 27.5% vs. southern 18.4%, P < 0.0001). The prevalence of obesity-related hypertension was higher in northern provinces residents among the hypertensive participants (northern 65.7% vs. southern 50.2%, P < 0.0001), and it was also higher in northern provinces residents among the obesity participant (northern 50.3% vs. southern 45.3%, P = 0.0005) (Figure 5 and Table 4).
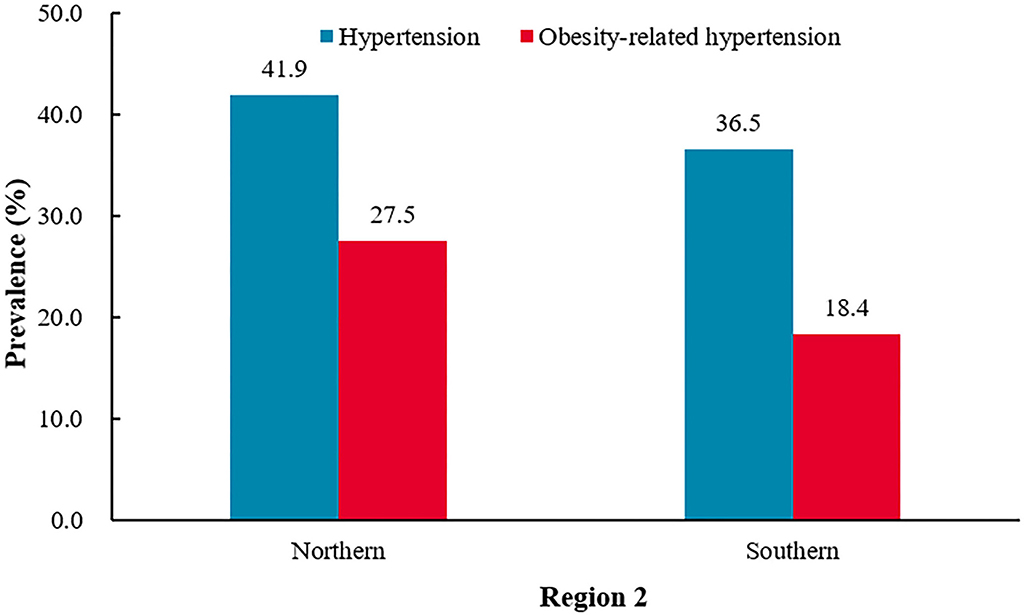
Figure 5. The prevalence of hypertension and obesity-related hypertension among Northern and Southern provinces.†P < 0.0001 for the difference in the prevalence of hypertension between Northern and Southern provinces.‡P < 0.0001 for the difference in the prevalence of hypertension obesity-related hypertension between Northern and Southern provinces.
Baseline characteristics of the non-obesity-related hypertensive and obesity-related hypertensive patients
The obesity-related hypertensive patients had a higher level of DBP, weight, WC, FBG, HbA1, TC, TG, LDL-C, and SUA and had lower level of age and HDL-C (all P < 0.0001, Table 5). The obesity-related hypertensive patients had a higher prevalence of diabetes mellitus, dyslipidemia, and hyperuricemia (all P < 0.0001, Table 6).
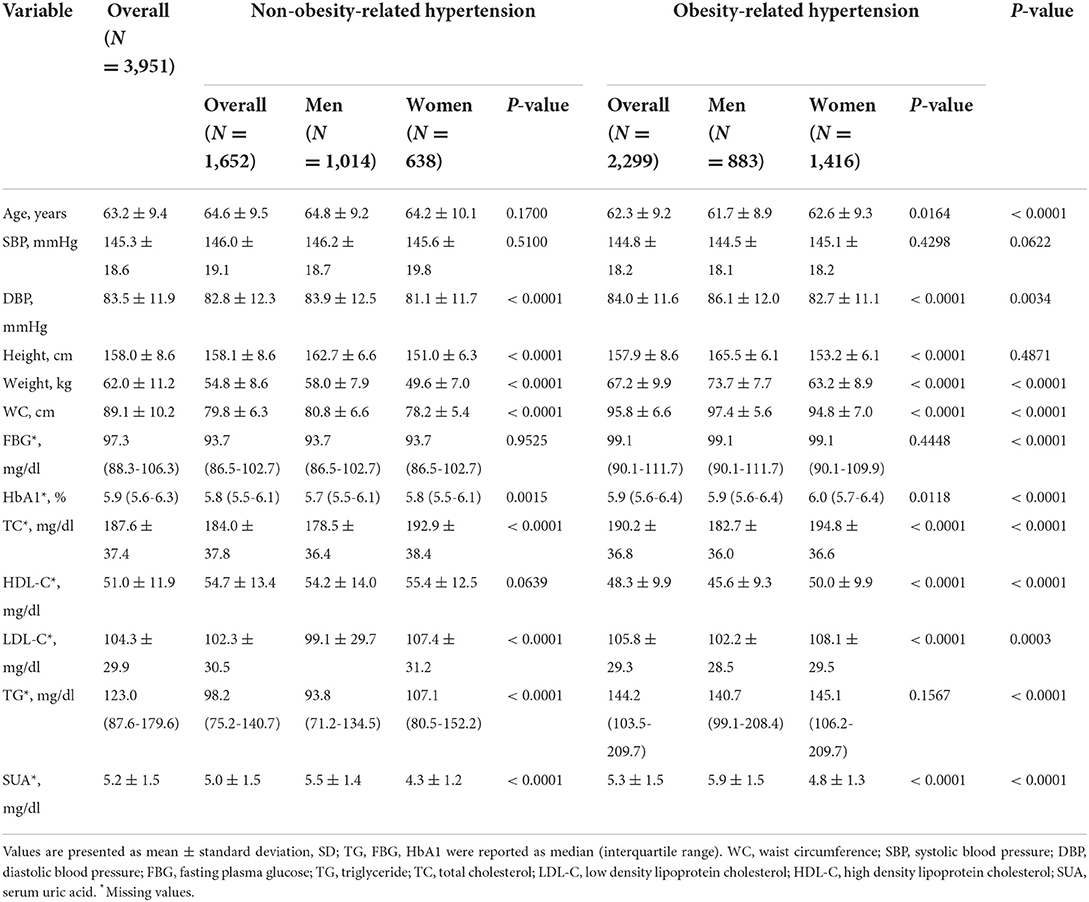
Table 5. Basic characteristics of the non-obesity-related hypertensive and obesity-related hypertensive patients.

Table 6. Comorbidities in the obesity-related hypertensive and non-obesity-related hypertensive patients.
Multiple logistic regression
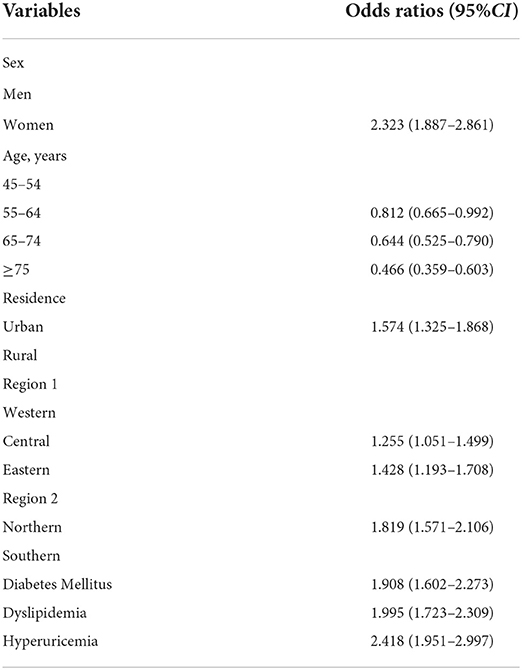
Multiple logistic regression analysis was used to determine the factors associated with obesity-related hypertension. The analysis showed that female gender, living in urban areas, diabetes mellitus, dyslipidemia, and hyperuricemia were positively correlated with obesity-related hypertension. Compared with the southern province residents, the northern province residents were positively correlated with obesity-related hypertension. Compared with the western province residents, the central and eastern provinces residents were positively correlated with obesity-related hypertension. Among hypertensive patients, the higher age levels were negatively correlated with obesity-related hypertension (Table 7).
Discussion
This is the first national epidemiological investigation about the prevalence of obesity-related hypertension among Chinese adults according to the definitions set by the 2016 Chinese expert consensus on obesity-related hypertension management. From the 2015 CHARLS, we found that the prevalence of hypertension and obesity-related hypertension were 39.1 and 22.7%, respectively, among adults aged 45 years or older in China. This cross-sectional study revealed that 58.2% of hypertensive patients had obesity-related hypertension. Nearly 2 in 5 adults aged 45 years or older had hypertension, and nearly 3 in 5 hypertensive patients had obesity-related hypertension.
The prevalence of hypertension was higher in men (men 40.3% vs. women 38.0%, P = 0.0179). This result is similar to previous studies (9, 27). However, women had a higher prevalence of obesity-related hypertension (men 18.8% vs. women 26.2%, P < 0.0001), which is similar to our previous observation among people in the southwest China (5). The prevalence of obesity-related hypertension was higher in women among the hypertensive participants (men 46.5% vs. women 68.9%, P < 0.0001), this could be explained by the fact that women had 1.6 times higher prevalence of obesity than men (men 36.4% vs. women 56.8%, P < 0.0001).
Compared to rural areas, previous studies have shown that urban areas had significantly higher prevalence of hypertension (9, 10), but the gap was gradually shrinking (28). In this study, the prevalence of hypertension was similar between urban residents and rural residents (urban 39.1% vs. rural 39.1%, P = 0.9802), this is similar to a nationwide survey conducted from October 2012 to December 2015 in China, from which there was no significant difference of hypertension prevalence between urban and rural areas (27). But the prevalence of obesity-related hypertension was higher among urban areas (urban 26.5% vs. rural 21.5%, P < 0.0001), this may be explained by urban residents had higher prevalence of obesity (urban 56.2% vs. rural 44.5%, P < 0.0001). People living in cites were more likely to have less physical activity, more sedentary activities, occupational stress, and other social pressures.
There was north-south gradient in both obesity and hypertension in previous studies (27, 29–31), as well as in this study. Compared with the southern province residents, the northern province residents had a higher prevalence of obesity-related hypertension. This phenomenon may be due to lack of fresh vegetables and fruits, longer winter, lower outdoor temperature, less physical activity, and genome changes related to the climatic adaption in northern provinces (32–36).
The prevalence of obesity and hypertension increasing from the west to the east had been shown in previous studies (28–31). Our study also showed the same trend. From western provinces to the central provinces to eastern provinces, there was an increasing trend in prevalence of hypertension, obesity, and obesity-related hypertension. China is a developing country with rapid economic development and urbanization, but the economic development has regional differences. From the west to the east, the state of economic development is gradually improving. Accompanying with economic development, the psychosocial stress and bad living habits were accumulated, which may cause hypertension and obesity (28, 37–40). Besides, both urbanization and migration from rural to urban areas are correlated with an increase in hypertension and obesity prevalence (41–46).
Age is a dominant risk factor for hypertension, as shown in previous studies (9, 47). In our previous study among adults aged 40–79 years in southwest China, the obesity-related hypertension increased with age (5). But in this study, it peaked at ages 65–74 years and the prevalence of obesity-related hypertension among hypertensive participants decreased with age. Compared with non-obesity-related hypertension, the obesity-related hypertensive patients had a higher prevalence of diabetes mellitus, dyslipidemia, and hyperuricemia (all P < 0.0001), and both hypertension and obesity were risk factors for atherosclerotic cardiovascular disease (ASCVD) and premature death (48, 49). This may explain why the prevalence of obesity-related hypertension among hypertensive participants was decreased with age. The prevalence of diabetes mellitus, dyslipidemia, and hyperuricemia among obesity-related hypertensive participants were nearly two times compared with non-obesity-related hypertensive participants (30.8 vs. 16.4%, 53.5 vs. 32%, and 19.0 vs. 10.3% all P < 0.0001) and all of which were leading causes of ASCVD among developing countries (50–52). This reminds us to strengthen the screening and control of DM, lipids, and uric acid in obesity-related hypertension. In contrast to the rapid economic development and living standards improvement, there is a lack of knowledge of healthy behaviors and management in people (27), which may lead to the increased hypertension, obesity, and obesity-related hypertension burden in China. Chinese government has carried out a series of reforms to improve this situation, such as universal access to basic medical insurance, promoting physical activities, medical staff supporting in the rural areas, and so on. Some effective actions, such as dietary salt reductions, improved public awareness programs, free blood pressure screening, integration of hypertension management into routine primary care practices, were recommended by previous studies (53–55).
This study has some limitations. First, our study encompassed 28 provinces, but not Tibet, Ningxia, Hainan, Hongkong, Macao, or Taiwan. Second, since this is a cross-sectional study, the results cannot be used to conclude cause-and-effect relationship between the risk factors and obesity-related hypertension. Third, we did not use the 24-h ambulatory blood pressure monitoring and did not exclude secondary hypertension, which are too costly in a national survey. Fourth, we defined the obesity-related hypertension on only two surrogate variables, BMI, and WC. There might be some hypertensive patients with normal BMI or WC, but high fat mass or visceral fat mass.
Perspectives
The burden of obesity-related hypertension in China among adults aged 45 years or older was substantial, involving ~120 million people, and it was higher in women than in men. The prevalence of obesity-related hypertension among all participants showed a north-south and east-west descending gradient. The prevalence of hypertension was similar between urban residents and rural residents, but the prevalence of obesity-related hypertension was higher among urban areas than rural areas. The prevalence of obesity-related hypertension among all participants was increased with age (P < 0.001), and peaked at ages 65–74 years, whereas in hypertensive participants, it was decreased with age. Compared to non-obesity-related hypertensive patients, the obesity-related hypertensive patients had higher prevalence of dyslipidemia, diabetes mellitus, and hyperuricemia. Aggressive strategies should be carried out to prevent and manage obesity-related hypertension.
Data availability statement
The raw data supporting the conclusions of this article will be made available by the authors, without undue reservation.
Ethics statement
The protocol of the blood-based biomarker sample collection study was approved by the Ethical Review Committee (IRB) of Peking University (IRB 00001052-11014). Email: Y2hhcmxzX2luZm9AcGt1LmVkdS5jbg==. The patients/participants provided their written informed consent to participate in this study.
Author contributions
YZ and X-BH conceived, designed the study, and drafted the manuscript. W-QZ designed the study, analyzed the data, and critically revised the manuscript. W-WT, J-XL, and R-HX advised on the interpretation of results. T-DW and X-BH critically revised the manuscript and were responsible for the research. All authors contributed to the article and approved the submitted version.
Funding
This study was supported by the Natural Science foundation of China (grants 91746205).
Acknowledgments
We are grateful to the China Health and Retirement Longitudinal Study (CHARLS) team for providing data.
Conflict of interest
The authors declare that the research was conducted in the absence of any commercial or financial relationships that could be construed as a potential conflict of interest.
Publisher's note
All claims expressed in this article are solely those of the authors and do not necessarily represent those of their affiliated organizations, or those of the publisher, the editors and the reviewers. Any product that may be evaluated in this article, or claim that may be made by its manufacturer, is not guaranteed or endorsed by the publisher.
Abbreviations
BMI, body mass index; WC, waist circumference; CHNS, China Health and Nutrition Survey; CHARLS, China Health and Retirement Longitudinal Study; SBP, systolic blood pressure; DBP, diastolic blood pressure; HbA1c, glycated hemoglobin; TC, total cholesterol; LDL-C, low-density lipoprotein cholesterol; HDL-C, high-density lipoprotein cholesterol; TG, triglyceride; SUA, serum uric acid; SD, standard deviation; CI, confidence interval.
References
1. Kearney PM, Whelton M, Reynolds K, Muntner P, Whelton PK, He J. Global burden of hypertension: analysis of worldwide data. Lancet. (2005) 365:217–23. doi: 10.1016/S0140-6736(05)17741-1
2. James PA, Oparil S, Carter BL, Cushman WC, Dennison-Himmelfarb C, Handler J, et al. 2014 Evidence-based guideline for the management of high blood pressure in adults: report from the panel members appointed to the Eighth Joint National Committee (JNC 8). JAMA. (2014) 311:507–20. doi: 10.1001/jama.2013.284427
3. Whitlock G, Lewington S, Sherliker P, Clarke R, Emberson J, Halsey J, et al. Body-mass index and cause-specific mortality in 900 000 adults: collaborative analyses of 57 prospective studies. Lancet. (2009) 373:1083–96. doi: 10.1016/S0140-6736(09)60318-4
4. Jensen MD, Ryan DH, Apovian CM, Ard JD, Comuzzie AG, Donato KA, et al. 2013 AHA/ACC/TOS guideline for the management of overweight and obesity in adults: a report of the American College of Cardiology/American heart association task force on practice guidelines and the obesity society. Circulation. (2014) 129:S102–38. doi: 10.1161/01.cir.0000437739.71477.ee
5. Zhang Y, Hou LS, Tang WW, Xu F, Xu RH, Liu X, et al. High prevalence of obesity-related hypertension among adults aged 40 to 79 years in Southwest China. Sci Rep. (2019) 9:15838. doi: 10.1038/s41598-019-52132-6
6. Jordan J, Yumuk V, Schlaich M, Nilsson PM, Zahorska-Markiewicz B, Grassi G, et al. Joint statement of the European association for the study of obesity and the European society of hypertension: obesity and difficult to treat arterial hypertension. J Hypertens. (2012) 30:1047–55. doi: 10.1097/HJH.0b013e3283537347
7. Kotchen TA. Obesity-related hypertension: epidemiology, pathophysiology, and clinical management. Am J Hypertens. (2010) 23:1170–8. doi: 10.1038/ajh.2010.172
8. Misra A, Khurana L. Obesity and the metabolic syndrome in developing countries. J Clin Endocrinol Metab. (2008) 93:S9–30. doi: 10.1210/jc.2008-1595
9. Wu Y, Huxley R, Li L, Anna V, Xie G, Yao C, et al. Prevalence, awareness, treatment, and control of hypertension in China: data from the China National Nutrition and Health Survey 2002. Circulation. (2008) 118:2679–86. doi: 10.1161/CIRCULATIONAHA.108.788166
10. Wang J, Zhang L, Wang F, Liu L, Wang H. Prevalence, awareness, treatment, and control of hypertension in China: results from a national survey. Am J Hypertens. (2014) 27:1355–61. doi: 10.1093/ajh/hpu053
11. Xi B, Liang Y, He T, Reilly KH, Hu Y, Wang Q, et al. Secular trends in the prevalence of general and abdominal obesity among Chinese adults, 1993-2009. Obes Rev. (2012) 13:287–96. doi: 10.1111/j.1467-789X.2011.00944.x
12. Mi YJ, Zhang B, Wang HJ, Yan J, Han W, Zhao J, et al. Prevalence and secular trends in obesity among Chinese adults, 1991-2011. Am J Prev Med. (2015) 49:661–9. doi: 10.1016/j.amepre.2015.05.005
13. Ma S, Xi B, Yang L, Sun J, Zhao M, Bovet P. Trends in the prevalence of overweight, obesity, and abdominal obesity among Chinese adults between 1993 and 2015. Int J Obes. (2021) 45:427–37. doi: 10.1038/s41366-020-00698-x
14. Du T, Sun X, Yin P, Huo R, Ni C, Yu X. Increasing trends in central obesity among Chinese adults with normal body mass index, 1993-2009. BMC Public Health. (2013) 13:327. doi: 10.1186/1471-2458-13-327
15. Cutler JA, Sorlie PD, Wolz M, Thom T, Fields LE, Roccella EJ. Trends in hypertension prevalence, awareness, treatment, and control rates in United States adults between 1988-1994 and 1999-2004. Hypertension. (2008) 52:818–27. doi: 10.1161/HYPERTENSIONAHA.108.113357
16. Okosun IS, Prewitt TE, Cooper RS. Abdominal obesity in the United States: prevalence and attributable risk of hypertension. J Hum Hypertens. (1999) 13:425–30. doi: 10.1038/sj.jhh.1000862
17. Kotsis V, Jordan J, Micic D, Finer N, Leitner DR, Toplak H, et al. Obesity and cardiovascular risk: a call for action from the European society of hypertension working group of obesity, diabetes and the high-risk patient and European association for the study of obesity: part A: mechanisms of obesity induced hypertension, diabetes and dyslipidemia and practice guidelines for treatment. J Hypertens. (2018) 36:1427–40. doi: 10.1097/HJH.0000000000001730
18. Schlaich MP, Grassi G, Lambert GW, Straznicky N, Esler MD, Dixon J, et al. European society of hypertension working group on obesity obesity-induced hypertension and target organ damage: current knowledge and future directions. J Hypertens. (2009) 27:207–11. doi: 10.1097/HJH.0b013e32831dafaf
19. Straznicky N, Grassi G, Esler M, Lambert G, Dixon J, Lambert E, et al. European society of hypertension working group on obesity antihypertensive effects of weight loss: myth or reality? J Hypertens. (2010) 28:637–43. doi: 10.1097/HJH.0b013e32833778e1
20. Jordan J, Schlaich M, Redon J, Narkiewicz K, Luft FC, Grassi G, et al. European society of hypertension working group on obesity: obesity drugs and cardiovascular outcomes. J Hypertens. (2011) 29:189–93. doi: 10.1097/HJH.0b013e3283427c8b
21. Landsberg L, Aronne LJ, Beilin LJ, Burke V, Igel LI, Lloyd-Jones D, et al. Obesity-related hypertension: pathogenesis, cardiovascular risk, and treatment: a position paper of the obesity society and the American society of hypertension. J Clin Hypertens. (2013) 15:14–33. doi: 10.1111/jch.12049
22. Cai J, Chen LY, Chen XP, Chen XS, Chen YD, Chen W, et al. [Chinese expert consensus on obesity-related hypertension management]. Zhonghua Xin Xue Guan Bing Za Zhi. (2016) 44:212–9. doi: 10.3760/cma.j.issn.0253-3758.2016.03.006
23. Zhang J, Liu XN, Tan ZH, et al. Mapping of the north-south demarcation zone in China based OH GIS. J Lanzhou Univ. (2012) 48:28–33. doi: 10.3969/j.issn.0455-2059.2012.03.006
24. Joshua JN, George B, William TC, Jill C, D'Alessio D, Jennifer G. Classification and diagnosis of diabetes: standards of medical care in diabetes-2020. Diabetes Care. (2020) 43:S14–31.
25. Claude L, James IC, Theodore GG, Gary G, Ronald EK, Pamela H, et al. Executive summary of the third report of the national cholesterol education program (NCEP) expert panel on detection, evaluation, and treatment of high blood cholesterol in adults (Adult treatment panel III). JAMA. (2001) 285:2486–97. doi: 10.1001/jama.285.19.2486
26. Borghi C, Domienik-Karłowicz J, Tykarski A, Widecka K, Filipiak KJ, Jaguszewski MJ, et al. Expert consensus for the diagnosis and treatment of patient with hyperuricemia and high cardiovascular risk: 2021 update. Cardiol J. (2021) 28:1–14. doi: 10.5603/CJ.a2021.0001
27. Wang Z, Chen Z, Zhang L, Wang X, Hao G, Zhang Z, et al. Status of hypertension in china: results from the China hypertension survey, 2012-2015. Circulation. (2018) 137:2344–56. doi: 10.1161/CIRCULATIONAHA.117.032380
28. Bao M, Wang L. The longitudinal trend of hypertension prevalence in Chinese adults from 1959 to 2018: a systematic review and meta-analysis. Ann Palliat Med. (2020) 9:2485–97. doi: 10.21037/apm-19-377
29. Zhang L, Wang Z, Wang X, Chen Z, Shao L, Tian Y, et al. Prevalence of overweight and obesity in China: results from a cross-sectional study of 441 thousand adults, 2012-2015. Obes Res Clin Pract. (2020) 14:119–26. doi: 10.1016/j.orcp.2020.02.005
30. Zhang X, Zhang M, Zhao Z, Huang Z, Deng Q, Li Y, et al. Geographic variation in prevalence of adult obesity in China: results from the 2013-2014 national chronic disease and risk factor surveillance. Ann Intern Med. (2020) 172:291–3. doi: 10.7326/M19-0477
31. Li Y, Wang L, Feng X, Zhang M, Huang Z, Deng Q, et al. Geographical variations in hypertension prevalence, awareness, treatment and control in China: findings from a nationwide and provincially representative survey. J Hypertens. (2018) 36:178–87. doi: 10.1097/HJH.0000000000001531
32. Fumagalli M, Moltke I, Grarup N, Racimo F, Bjerregaard P, Jørgensen ME, et al. Greenlandic inuit show genetic signatures of diet and climate adaptation. Science. (2015) 349:1343–7. doi: 10.1126/science.aab2319
33. Cardona A, Pagani L, Antao T, Lawson DJ, Eichstaedt CA, Yngvadottir B, et al. Genome-wide analysis of cold adaptation in indigenous Siberian populations. PLoS ONE. (2014) 9:e98076. doi: 10.1371/journal.pone.0098076
34. Tucker P, Gilliland J. The effect of season and weather on physical activity: a systematic review. Public Health. (2007) 121:909–22. doi: 10.1016/j.puhe.2007.04.009
35. Zhao L, Stamler J, Yan LL, Zhou B, Wu Y, Liu K, et al. Blood pressure differences between northern and southern Chinese: role of dietary factors: the international study on macronutrients and blood pressure. Hypertension. (2004) 43:1332–7. doi: 10.1161/01.HYP.0000128243.06502.bc
36. Kotchen TA, Kotchen JM. Regional variations of blood pressure: environment or genes? Circulation. (1997) 96:1071–3. doi: 10.1161/01.CIR.96.4.1071
37. Liu MY, Li N, Li WA, Khan H. Association between psychosocial stress and hypertension: a systematic review and meta-analysis. Neurol Res. (2017) 39:573–80. doi: 10.1080/01616412.2017.1317904
38. Ford ND, Patel SA, Narayan KM. Obesity in low- and middle-income countries: burden, drivers, and emerging challenges. Annu Rev Public Health. (2017) 38:145–64. doi: 10.1146/annurev-publhealth-031816-044604
39. Scott KA, Melhorn SJ, Sakai RR. Effects of chronic social stress on obesity. Curr Obes Rep. (2012) 1:16–25. doi: 10.1007/s13679-011-0006-3
40. Apovian CM. Obesity: definition, comorbidities, causes, and burden. Am J Manag Care. (2016) 22:s176–85.
41. Ibrahim MM, Damasceno A. Hypertension in developing countries. Lancet. (2012) 380:611–9. doi: 10.1016/S0140-6736(12)60861-7
42. BeLue R, Okoror TA, Iwelunmor J, Taylor KD, Degboe AN, Agyemang C, et al. An overview of cardiovascular risk factor burden in sub-Saharan African countries: a socio-cultural perspective. Global Health. (2009) 5:10. doi: 10.1186/1744-8603-5-10
43. Poulter NR, Khaw KT, Hopwood BE, Mugambi M, Peart WS, Rose G, et al. The Kenyan Luo migration study: observations on the initiation of a rise in blood pressure. BMJ. (1990) 300:967–72. doi: 10.1136/bmj.300.6730.967
44. Peters R, Amugsi DA, Mberu B, Ensor T, Hill AJ, Newell JN, et al. Nutrition transition, overweight and obesity among rural-to-urban migrant women in Kenya. Public Health Nutr. (2019) 22:3200–10. doi: 10.1017/S1368980019001204
45. Hu L, Huang X, You C, Li J, Hong K, Li P, et al. Prevalence of overweight, obesity, abdominal obesity and obesity-related risk factors in southern China. PLoS ONE. (2017) 12:e183934. doi: 10.1371/journal.pone.0183934
46. Gong P, Liang S, Carlton EJ, Jiang Q, Wu J, Wang L, et al. Urbanisation and health in China. Lancet. (2012) 379:843–52. doi: 10.1016/S0140-6736(11)61878-3
47. Wang Z, Wang X, Hao G, Chen Z, Zhang L, Shao L, et al. A national study of the prevalence and risk factors associated with peripheral arterial disease from China: the China hypertension survey, 2012-2015. Int J Cardiol. (2019) 275:165–70. doi: 10.1016/j.ijcard.2018.10.047
48. Mills KT, Stefanescu A, He J. The global epidemiology of hypertension. Nat Rev Nephrol. (2020) 16:223–37. doi: 10.1038/s41581-019-0244-2
49. Hruby A, Manson JE Qi L, Malik VS, Rimm EB, Sun Q, et al. Determinants and consequences of obesity. Am J Public Health. (2016) 106:1656–62. doi: 10.2105/AJPH.2016.303326
50. He J, Gu D, Wu X, Reynolds K, Duan X, Yao C, et al. Major causes of death among men and women in China. N Engl J Med. (2005) 353:1124–34. doi: 10.1056/NEJMsa050467
51. Reddy KS. Cardiovascular disease in non-Western countries. N Engl J Med. (2004) 350:2438–40. doi: 10.1056/NEJMp048024
52. Reddy KS, Yusuf S. Emerging epidemic of cardiovascular disease in developing countries. Circulation. (1998) 97:596–601. doi: 10.1161/01.CIR.97.6.596
53. Huang XB, Zhang Y, Wang TD, Liu JX, Yi YJ, Liu Y, et al. Prevalence, awareness, treatment, and control of hypertension in southwestern China. Sci Rep. (2019) 9:19098. doi: 10.1038/s41598-019-55438-7
54. He FJ, Pombo-Rodrigues S, Macgregor GA. Salt reduction in England from 2003 to 2011: its relationship to blood pressure, stroke and ischaemic heart disease mortality. BMJ Open. (2014) 4:e4549. doi: 10.1136/bmjopen-2013-004549
55. Joffres M, Falaschetti E, Gillespie C, Robitaille C, Loustalot F, Poulter N, et al. Hypertension prevalence, awareness, treatment and control in national surveys from England, the USA and Canada, and correlation with stroke and ischaemic heart disease mortality: a cross-sectional study. BMJ Open. (2013) 3:e3423. doi: 10.1136/bmjopen-2013-003423
Keywords: prevalence, obesity-related hypertension, hypertension, obesity, China, risk factors
Citation: Zhang Y, Zhang W-Q, Tang W-W, Zhang W-Y, Liu J-X, Xu R-H, Wang T-D and Huang X-B (2022) The prevalence of obesity-related hypertension among middle-aged and older adults in China. Front. Public Health 10:865870. doi: 10.3389/fpubh.2022.865870
Received: 30 January 2022; Accepted: 23 September 2022;
Published: 24 November 2022.
Edited by:
Yiqin Shi, Fudan University, ChinaReviewed by:
Liu Junting, Capital Institute of Pediatrics, ChinaDaniel Seifu Melka, University of Global Health Equity, Rwanda
Copyright © 2022 Zhang, Zhang, Tang, Zhang, Liu, Xu, Wang and Huang. This is an open-access article distributed under the terms of the Creative Commons Attribution License (CC BY). The use, distribution or reproduction in other forums is permitted, provided the original author(s) and the copyright owner(s) are credited and that the original publication in this journal is cited, in accordance with accepted academic practice. No use, distribution or reproduction is permitted which does not comply with these terms.
*Correspondence: Tzung-Dau Wang, dGR3YW5nQG50dS5lZHUudHc=; Xiao-Bo Huang, ZHJodWFuZ3hpYW9ib0AxMjYuY29t
†These authors have contributed equally to this work
 Yang Zhang
 Wen-Qiang Zhang2†
 Wei-Wei Tang
 Tzung-Dau Wang
 Xiao-Bo Huang