 Fahui Yang1,2†
 Bing Cao
 Xiao Gao
95% of researchers rate our articles as excellent or good
Learn more about the work of our research integrity team to safeguard the quality of each article we publish.
Find out more
ORIGINAL RESEARCH article
Front. Public Health , 25 March 2022
Sec. Public Mental Health
Volume 10 - 2022 | https://doi.org/10.3389/fpubh.2022.850411
This article is part of the Research Topic Digital strategies to reduce salt consumption View all 13 articles
Objective: Stress is a major public health challenge and is associated with undesirable eating behavior. This cross-sectional study aimed to explore whether there is an association between perceived level of stress and food preference among Chinese adults.
Study Design: Perceived level of stress was measured using the Chinese version of the 14-item Perceived Stress Scale, whereas self-reported food preferences were investigated by means of five food classification questions, including questions regarding the consumption of fast food, salty snacks, fruit, vegetables, and soft/sugary drinks.
Methods: The data were collected from the 2015 China Health and Nutrition Survey. Information of 8,216 adults (≥18 years) on perceived level of stress, self-reported food preferences, and other important covariates was available and analyzed.
Results: Perceived level of stress was negatively associated with a preference for fruit (β = −0.58, 95% CI: −0.81 to −0.34, p < 0.0001) and vegetables (β = −1.13, 95% CI: −1.41 to −0.85, p < 0.0001), while it was positively associated with a preference for fast food (β = 0.36, 95% CI: 0.08–0.64, p = 0.011) and soft/sugary drinks (β = 0.48, 95% CI: 0.30–0.66, p < 0.0001) after adjusting for potential confounders. No association between a preference for salty snacks and perceived level of stress was found in either men or women.
Conclusions: The present population-based study reported strong associations between perceived level of stress and self-reported food preferences among Chinese adults. Sex differences related to this association were also worthy of attention.
Stress is considered a major public health challenge in modern society; it increases the risk of obesity, metabolic syndrome, and various other chronic diseases (1, 2). Simultaneously, stress-related eating is a potential factor in the obesity pandemic (3, 4). Food preferences are influenced by a myriad of environmental and internal factors, which include the availability and rewarding properties of food (5, 6). Consuming highly tasty foods stimulates the food reward system, and the pleasurable experience increases the likelihood of repeat consumption, potentially leading to overweight and obesity (7).
Previous studies have indicated that exposure to stress disrupts eating patterns; individuals may attempt to relieve stress by engaging in unhealthy—although often pleasurable—behaviors, including undesirable eating behavior (8). The association between the emotions related to stress and undesirable eating behavior, such as emotional eating, restrained eating, and external eating, has been reported in several studies (9–11). Both men and women perceive stress as leading to unhealthy changes in eating patterns (12). Evidence from animal studies have shown an increased intake of palatable foods in rats with chronic stress, which may assist in ameliorating anxiety—the alteration of the function of the hypothalamic–pituitary–adrenal axis may be the mediating factor in this association (13). A randomized controlled trial examined the effects of stress on food preferences and obesogenic behavior; however, the findings from this study do not support the hypothesis that perceived stress increases the preference for highly palatable foods (14). Although there is accumulating evidence of a possible association between perceived stress and food preferences and selection, some studies have found that stress suppresses appetite, whereas other studies report that persistent stress promotes the motivation to eat, especially foods with a high energy, sugar, and fat content (15, 16). Therefore, the primary aim of the present study was to determine whether there is an association between perceived level of stress and food preference.
Furthermore, literature indicates that the influence of perceived stress on food choice varies based on sex (17, 18). An epidemiological study found that women with high levels of stress have an increased preference for sweet and high-fat foods compared to their counterparts with low levels of stress (19). However, another study found that men with no perceived stress consume more unhealthy foods than their counterparts with low levels of stress (20). The preference to adopt more indulgent eating behavior in response to stress is especially evident in women, while stress is not associated with indulgent eating behavior in men, regardless of the level of stress (21). Women, more often than men, employ indulgent eating as a stress management strategy, while men tend to follow a problem-focused approach to cope with stress (22). Accordingly, this study proposed to further explore sex differences in stress-induced dietary preferences.
To date, most research on the relationship between stress and food preferences has been conducted in Western countries; few studies focus on this association among China's large population. Chinese eating patterns and food preferences vastly differ from those of Western populations. Additionally, findings from previous studies are inconsistent. Herein, by using the database of the China Health and Nutrition Survey (CHNS), the main objective was to explore the underlying relationship between perceived level of stress and food preferences among males and females in Chinese adults, and to verify whether this association also exists after adjusting for potential confounders.
The CHNS comprises a series of population-based longitudinal household surveys conducted by the National Institute for Nutrition and Health of the Chinese Center for Disease Control and Prevention and the University of North Carolina at Chapel Hill in the United States (23). The household surveys cover nine provinces in China that vary substantially in geography, economic development, public resources, and health indicators, which was given to participants by paper questionnaires. The de-identified survey data are publicly available. The survey commenced in 1989 following a multistage, random cluster sampling method. To date, individual-level information on health, socioeconomic status, and social and family networks has been collected in 11 waves (i.e., in 1989, 1991, 1993, 1997, 2000, 2004, 2006, 2009, 2011, 2015, and 2018). The questionnaire was originally in Chinese, which included questions that related to individual activities, lifestyle, health status, marriage and birth history, body shape, and mass media exposure. Our study only selected the variables that we are interested in. The first survey to include the Perceived Stress Scale (PSS) was that conducted in 2015. The results of the 2018 wave were not yet available at the time of the present study; therefore, we used the data of the 2015 wave. In total, 12,863 individuals completed the 2015 CHNS interview. We excluded individuals with an age <18 years, missing PSS data (n = 1,795), missing age, height, weight, or education level data, and those with incorrect data concerning any of the abovementioned variables (n = 2,852). In total, 8,216 participants were included in the present analysis. Figure 1 presents a detailed flowchart of participant selection. Further information regarding the CHNS project is available at the following URL: https://www.cpc.unc.edu/projects/china.
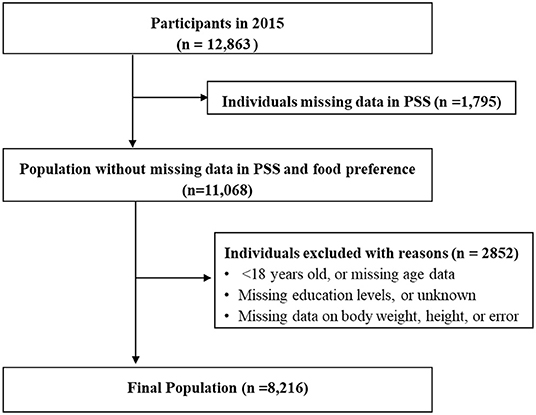
Figure 1. Flow chart of the selection process of study participants from the China Health and Nutrition Survey.
Data on all demographic variables, including age, sex, education level, weight (kg), height (m), daily sleep duration (hours), urban status, smoking status, and alcohol consumption status, were extracted from the original CHNS files. Weight and height measurements were obtained by means of detailed physical examinations, and the remaining variables by means of objective questionnaires.
The Chinese version of the 14-item PSS (PSS-14) was used to measure perceived level of stress, with the total score ranging from 0 to 56 (23). The original PSS consists of 14 items; it was translated from English to Chinese and subsequently back to English to ensure the accuracy of translation. Among the 8,216 included participants, we calculated the Cronbach's alpha of the PSS-14 as 0.829, which is similar to the scale reliability findings of Huang et al. calculated among 9,507 individuals from the same database (i.e., 0.830) (23). The scale is divided into two subscales: items 1, 2, 3, 8, 11, 12, and 14 constitute the negative subscale, focusing on the feeling of tension, whereas items 4, 5, 6, 7, 9, 10, and 13 constitute the positive subscale, focusing on the sense of feeling out of control. The negative subscale included questions regarding the frequency of negative incidents or feelings, such as ‘In the last month, how often have you felt that you were unable to control important things in your life?' The positive subscale included positively stated items, e.g., “In the last month, how often have you felt confident about your ability to handle your personal problems?” A 5-point Likert scale was used to assess each item, ranging from 0 = “never” to 4 = “very often”. To obtain meaningful odds ratios, perceived level of stress was rescaled based on the median total PSS-14 score (i.e., a low level and high level of perceived stress).
Self-reported food preferences were investigated by means of five food classification questions, including questions regarding the consumption of fast food (e.g., pizza and hamburgers), salty snacks (e.g., pretzels and potato chips), fruit, vegetables, and soft/sugary drinks (including fruit drinks and soft drinks) (24). For each question, the answer options were: “dislike very much”, “dislike somewhat”, “neutral”, “like somewhat”, or “like very much”.
According to the Chinese Working Group on Obesity (25), body mass index (BMI) was divided into the following groups: underweight, normal, overweight, and obese representing a BMI <18.5, 18.5–23.99, 24–27.99, and ≥28 kg/m2, respectively. Data are presented as mean (standard deviation [SD]) or median (interquartile range) for continuous variables, and as percentages for categorical variables. For continuous variables, independent sample t-tests or one-way analysis of variance were used for comparisons between two or more independent groups. For categorical variables, the χ2-test was used to assess the statistical significance of differences between various groups. The Bonferroni correction was used to reduce the chances of obtaining false-positive results (type I errors) when multiple pairwise tests were performed on a single set of data. Linear regression models were used to investigate the association between food preferences and PSS scores. Regression coefficients (β) and their 95% confidence intervals (CIs) were estimated. The association between the risk of high levels of perceived stress and food preferences was assessed using logistic regression models. The maximum likelihood method was used to estimate odds ratios and their 95% CIs (26). We adjusted for the confounders of basic characteristics (i.e., age, sex, education, and urban status) and physical conditions (i.e., BMI, smoking status, alcohol consumption status, and the presence of diabetes or hypertension) in the linear and logistic regression models; these were selected based on previous studies following a similar study design (27, 28). Most potential confounders are dichotomous or continuous variables. Only education is multicategorical variable, the first level (i.e., Grad from primary) is considered as reference. We used the variance inflation factor to detect potential multicollinearity in the regression models. A two-tailed p < 0.05 was considered statistically significant. All statistical tests were performed using Stata Statistical Software Release 15 (Stata Corp LLC, College Station, TX, USA).
Table 1 presents the basic characteristics of the sample population, stratified by sex. The 2015 CHNS wave included 8,216 adults (≥18 years) with information on perceived level of stress, self-reported food preferences, and the remaining relevant covariates (Figure 1). In total, 4,197 (51.1%) participants were women and the mean age was 50.8 years (SD = 14.2). The education level of more than two-thirds of the participants was lower than high-school level education, and most (64.7%) were from urban areas. Approximately half of the participants were overweight (36.1%) or obese (14.4%), while the prevalence of diabetes and hypertension was 4.9 and 16.0%, respectively. Apart from the prevalence of diabetes, all variables differed significantly between men and women (p < 0.05).
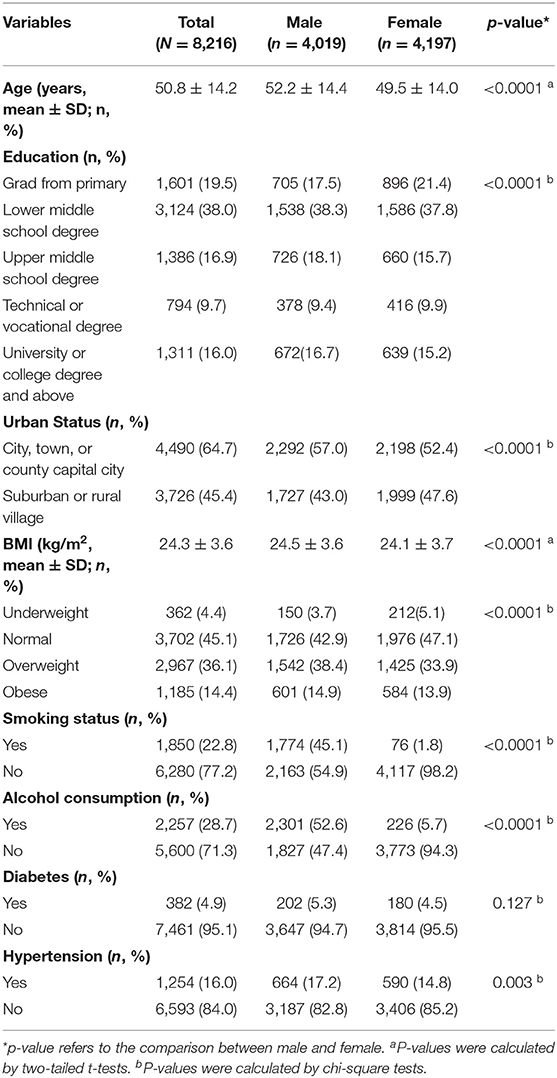
Table 1. The basic characteristics of selected participants.
The associations between perceived level of stress and basic participant characteristics are presented in Table 2. Participants who differed in age group, education level, and weight category had different levels of perceived stress (p < 0.05). Additionally, those who resided in cities, towns, or county capital cities experienced higher levels of perceived stress than those who resided in suburban or rural villages (PSS-14 score: 22.9 vs. 22.3). Unexpectedly, participants who consumed alcohol and had hypertension experienced reported lower levels of perceived stress (both p < 0.05). We did not find differences in perceived stress levels between participants with or without diabetes (p = 0.071). The comparison of low and high levels of perceived stress based on the basic characteristics of the participants is presented in Supplementary Table 1. The details of original results are shown in Supplemental Table 2.
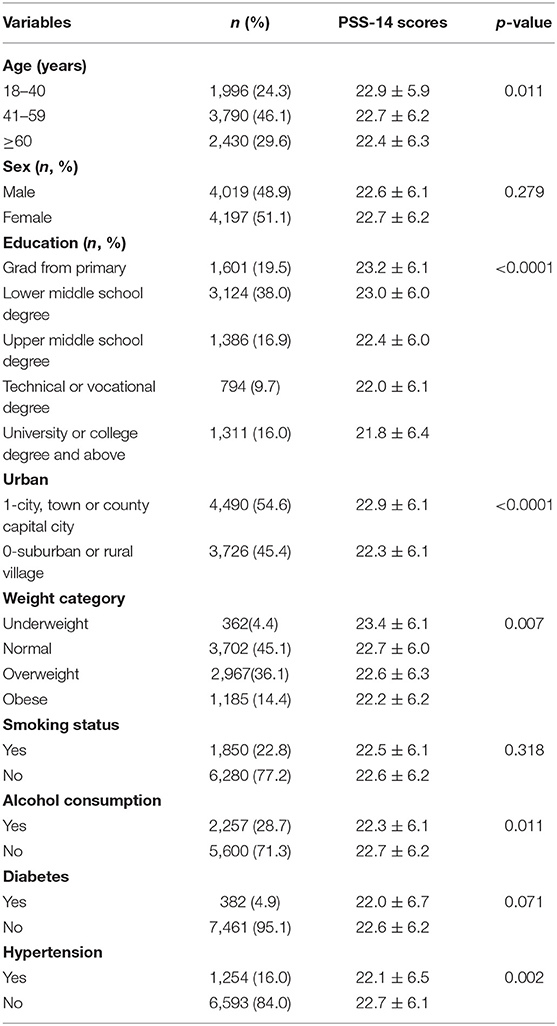
Table 2. The comparison of perceived stress with different basic characteristics of participants.
No potential multicollinearity was detected in the regression models. From the non-adjusted models, it was found that the PSS-14 score was negatively associated with a preference for fruit (β = −0.61, 95% CI: −0.83 to −0.38, p < 0.0001) and vegetables (β = −1.18, 95% CI: −1.45 to −0.91, p < 0.0001), while it was positively associated with a preference for soft/sugary drinks (β = 0.52, 95% CI: 0.35–0.69, p < 0.0001). The results remained similar for the abovementioned food preferences (fruit, vegetables, and soft/sugary drinks) after adjusting for confounders of basic characteristics (i.e., age, sex, education, and urban status) in Model 1, and those of basic characteristics and physical conditions (i.e., BMI, smoking status, alcohol consumption status, and presence of diabetes or hypertension) in Model 2. A preference for fast food was positively associated with the PSS-14 score in Model 1 (β = 0.31, 95% CI: 0.04–0.58, p = 0.026) and Model 2 (β = 0.36, 95% CI: 0.08–0.64, p = 0.011). The details are presented in Table 3. The logistic regression results, reflecting the association between a high level of perceived stress and food preferences, are presented in Supplementary Table 3. We found that a high level of perceived stress was associated with a preference for fast food, salty snacks, and soft/sugary drinks after adjusting for the abovementioned confounders. Moreover, a low level of perceived stress was associated with a preference for fruit and vegetables in the adjusted model.
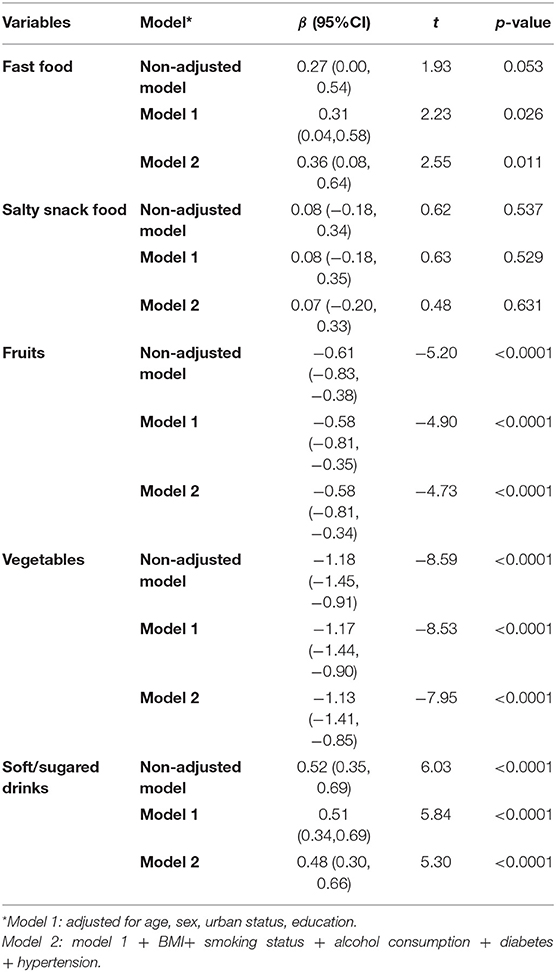
Table 3. The associations between PSS-14 scores and each variable of food preference.
The results regarding the association between the PSS-14 score and food preferences in men compared with women are presented in Table 4. No association was found between a preference for salty snacks and perceived levels of stress in either men or women. A preference for fast food was positively associated with perceived level of stress in women after adjusting for potential confounders, including age, sex, education level, urban status, BMI, smoking status, alcohol consumption status, and presence of diabetes or hypertension (β = 0.46, 95% CI: 0.08–0.85, p = 0.019). The association between a preference for fruit and perceived level of stress was also significant in women (β = −0.93, 95% CI: −1.30 to −0.57, p < 0.0001), although it was not significant in men (p > 0.05), after adjusting for the abovementioned confounders. Moreover, perceived level of stress showed a significant negative association with a preference for vegetables, and a significant positive association with a preference for soft/sugary drinks, in both men and women before and after adjusting for potential confounders (all p < 0.05).
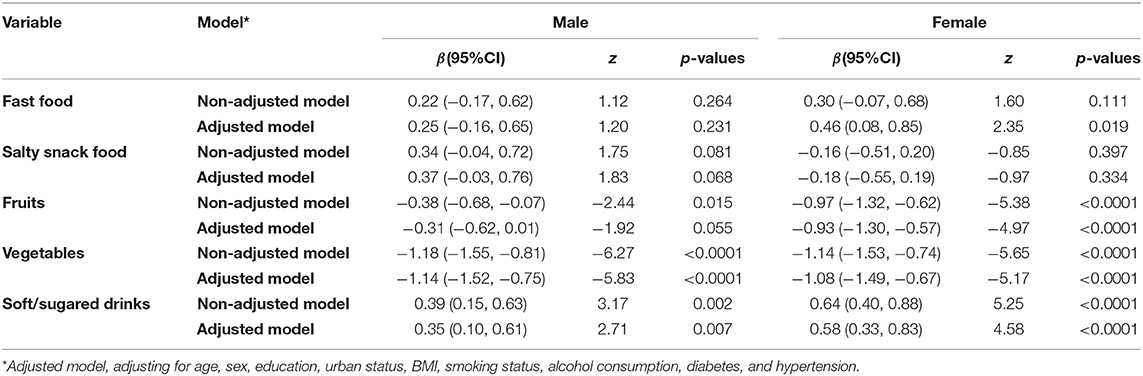
Table 4. Associations between PSS-14 scores and Each Variable of Food Preference in Male and Female.
Using the large database of the 2015 CHNS, our study provides valuable evidence regarding the association between food preferences and perceived levels of stress among the Chinese population. Moreover, sex differences related to this association were also explored in this study. We found that perceived levels of stress were associated with unhealthy food preferences, including increased intake of fast food and soft/sugary drinks and decreased intake of fruit and vegetables. Perceived levels of stress were positively associated with a preference for fast food and negatively associated with a preference for fruit in women, but not men, in the adjusted models.
Our findings are similar to those from previous Western studies in that a higher perceived level of stress is associated with a preference for highly tasty foods (14). Various studies have reported that perceived levels of stress influence specific food preferences and alter food choices (29, 30). For example, some researchers suggest that stress induces people to eat in the absence of hunger and to choose higher energy foods, which may be related to the food reward system (29–31). Consistent with our findings, several original studies exploring the foods that individuals tend to consume under stress have confirmed that highly caloric fatty snacks, sweets, and foods are preferred (32–34). Accumulating evidence suggests that increased stress levels are associated with decreased consumption of fruit and vegetables (35–37). Similarly, we found that perceived levels of stress were negatively associated with a preference for a healthy dietary taste (i.e., fruit and vegetables). Overall, both our current findings and those of multiple previous studies demonstrated that chronic stress is positively associated with the frequency of emotional eating, snacking, and consuming tasty foods, and negatively associated with consuming fruit and vegetables (35–37). However, not all opinions support our findings. For example, a cross-sectional study among university students revealed that students who are not stressed consume more energy and fatty foods compared with those who are stressed when comparing the differences in nutritional intake (38).
Perceived stress has been related to unhealthy eating patterns in both men and women, with reports indicating that women have an increased preference for snacks, biscuits, and sweets, while men have an increased preference for fast food and meat (12). Another original study found that women are more likely than men to increase their food intake when stressed, and experimentally demonstrated that stress causes food choices to shift from healthy low-fat foods to less healthy high-fat foods (39). In the present study, we also demonstrated sex differences related to food choices when under stress. Previous studies found that eating healthy foods such as vegetables and fresh fruit is negatively associated with perceived levels of stress in both men and women (40), which is slightly different from our findings. In our study, the association between a preference for fruit and perceived levels of stress was not significant after adjusting confounders in men, indicating the need for further exploration in different populations. Compared to men, women are more health-conscious and consume a larger variety of foods; therefore, they are more prone to lack of restraint when stress eating (41). Accordingly, when stress reduces the inhibitory effect induced by unhealthy high-energy foods, women are inclined to allow themselves to consume them (39). Women are more sensitive to emotion-centered coping methods, distracting themselves from feelings of stress through emotional eating, while men tend to cope with stress in a problem-centered way (22). Interestingly, the current analysis showed that alcohol use was associated with lower perceived levels of stress. A study illustrated that moderate alcohol consumption reduces stress-related neural activity; however, the chronic neurobiological effects of alcohol on stress are uncertain (42).
Overall, our study provides preliminary evidence of the association between perceived levels of stress and self-reported food preference. Further longitudinal studies are required to elucidate the effects of self-reported food preferences on changes in perceived levels of stress. In future research, individuals should be provided more information on the effects of stress on food intake and on foods that may alleviate stress to help them to adopt suitable eating behaviors to combat stress.
Our study has several strengths. First, the large sample size increases the generalizability of our findings. Second, all the data used in this study are based on highly reliable CHNS records. Moreover, we controlled for a variety of potential confounders during data analyses. However, the results of our study should be interpreted considering certain limitations. First, causality cannot be inferred owing to the cross-sectional design. Second, the large excluded sample also should be noted. Third, the PSS-14 is a self-report scale and the CHNS only assessed perceived stress levels once, which may have introduced measurement errors and cannot reflect long-term conditions. Moreover, differences may exist between eating preferences and eating behaviors. Finally, the dietary information of the included participants—gathered for the 2015 CHNS—was not publicly available, which limited the exploration of the relationship between perceived level of stress and dietary behavior.
The present population-based study reported strong associations between perceived level of stress and self-reported food preferences among Chinese adults. Further exploration of these associations using a longitudinal design in different populations is warranted. Dietary behavior should be considered in future studies. Moreover, the current findings provide valuable evidence inform that the future researches should consider the effects of stress on food intake and on foods, which may alleviate stress to help them to adopt suitable eating behaviors to combat stress.
The datasets presented in this study can be found in online repositories. The names of the repository/repositories and accession number(s) can be found below: https://www.cpc.unc.edu/projects/china.
The studies involving human participants were reviewed and approved by University of North Carolina at Chapel Hill and the Chinese Center for Disease Control and Prevention. The patients/participants provided their written informed consent to participate in this study.
BC and XG had full access to all the data in the study and take responsibility for the integrity of the data. BC, FY, and RL: study concept and design. RL and BC: acquisition or interpretation of data and drafting of the manuscript. All authors: critical revision of the manuscript for important intellectual content.
This work was sponsored by National Natural Science Foundation of China (No. 32071046) and Chongqing Natural Science Foundation (No. cstc2020jcyj-msxmX1065). The funding agents had no role in the design and conduct of the study; collection, management, analysis, interpretation of the data; preparation, review, or approval of the manuscript.
The authors declare that the research was conducted in the absence of any commercial or financial relationships that could be construed as a potential conflict of interest.
All claims expressed in this article are solely those of the authors and do not necessarily represent those of their affiliated organizations, or those of the publisher, the editors and the reviewers. Any product that may be evaluated in this article, or claim that may be made by its manufacturer, is not guaranteed or endorsed by the publisher.
This research uses data from the China Health and Nutrition Survey (CHNS). We thank the National Institute of Nutrition and Food Safety (China Center for Disease Control and Prevention), Carolina Population Center (University of North Carolina at Chapel Hill), and the US National Institutes of Health (Fogarty International Center, and R01-HD30880, DK056350, and R01-HD38700) for financial support for the CHNS data collection and analysis files from 1989 to 2006. We also thank the China-Japan Friendship Hospital and the Chinese Ministry of Health for support for the CHNS 2009 and later surveys.
The Supplementary Material for this article can be found online at: https://www.frontiersin.org/articles/10.3389/fpubh.2022.850411/full#supplementary-material
1. Slavich GM. Social safety theory: a biologically based evolutionary perspective on life stress, health, and behavior. Annu Rev Clin Psychol. (2020) 16:265–95. doi: 10.1146/annurev-clinpsy-032816-045159
2. Tavolacci MP, Ladner J, Grigioni S, Richard L, Villet H, Dechelotte P. Prevalence and association of perceived stress, substance use and behavioral addictions: a cross-sectional study among university students in France, 2009-2011. BMC Public Health. (2013) 13:724. doi: 10.1186/1471-2458-13-724
3. Jarvela-Reijonen E, Karhunen L, Sairanen E, Rantala S, Laitinen J, et al. High perceived stress is associated with unfavorable eating behavior in overweight and obese Finns of working age. Appetite. (2016) 103:249–58. doi: 10.1016/j.appet.2016.04.023
4. Laitinen J, Ek E, Sovio U. Stress-related eating and drinking behavior and body mass index and predictors of this behavior. Prev Med. (2002) 34:29–39. doi: 10.1006/pmed.2001.0948
5. Pallister T, Sharafi M, Lachance G, Pirastu N, Mohney RP, MacGregor A, et al. Food preference patterns in a UK Twin Cohort. Twin Res Hum Genet. (2015) 18:793–805. doi: 10.1017/thg.2015.69
6. Tarragon E, Moreno JJ. Role of endocannabinoids on sweet taste perception, food preference, and obesity-related disorders. Chem Senses. (2017) 43:3–16. doi: 10.1093/chemse/bjx062
7. Lutter M, Nestler EJ. Homeostatic and hedonic signals interact in the regulation of food intake. J Nutr. (2009) 139:629–32. doi: 10.3945/jn.108.097618
8. Krueger PM, Chang VW. Being poor and coping with stress: health behaviors and the risk of death. Am J Public Health. (2008) 98:889–96. doi: 10.2105/AJPH.2007.114454
9. Bennett J, Greene G, Schwartz-Barcott D. Perceptions of emotional eating behavior. A qualitative study of college students. Appetite. (2013) 60:187–92. doi: 10.1016/j.appet.2012.09.023
10. Ohara K, Mase T, Kouda K, Miyawaki C, Momoi K, Fujitani T, et al. Association of anthropometric status, perceived stress, and personality traits with eating behavior in university students. Eat Weight Disord. (2019) 24:521–31. doi: 10.1007/s40519-018-00637-w
11. Finch LE, Tomiyama AJ. Comfort eating, psychological stress, and depressive symptoms in young adult women. Appetite. (2015) 95:239–44. doi: 10.1016/j.appet.2015.07.017
12. Mohamed BA, Mahfouz MS, Badr MF. Food selection under stress among undergraduate students in Riyadh, Saudi Arabia. Psychol Res Behav Manag. (2020) 13:211–21. doi: 10.2147/PRBM.S236953
13. Machado TD, Dalle Molle R, Laureano DP, Portella AK, Werlang IC, Benetti Cda S, et al. Early life stress is associated with anxiety, increased stress responsivity and preference for “comfort foods” in adult female rats. Stress. (2013) 16:549–56. doi: 10.3109/10253890.2013.816841
14. Berg Schmidt J, Johanneson Bertolt C, Sjodin A, Ackermann F, Vibeke Schmedes A, Lynge Thomsen H, et al. Does stress affect food preferences?—a randomized controlled trial investigating the effect of examination stress on measures of food preferences and obesogenic behavior. Stress. (2018) 21:556–63. doi: 10.1080/10253890.2018.1494149
15. Rodgers RF, Lombardo C, Cerolini S, Franko DL, Omori M, Fuller-Tyszkiewicz M, et al. The impact of the COVID-19 pandemic on eating disorder risk and symptoms. Int J Eat Disord. (2020) 53:1166–70. doi: 10.1002/eat.23318
16. Ulrich-Lai YM, Fulton S, Wilson M, Petrovich G, Rinaman L. Stress exposure, food intake and emotional state. Stress. (2015) 18:381–99.
17. Matud MP. Gender differences in stress and coping styles. Pers Individ Dif. (2004) 37:1401–15. doi: 10.1016/j.paid.2004.01.010
18. Heiman A, Lowengart O. Calorie information effects on consumers' food choices: sources of observed gender heterogeneity. J Bus Res. (2014) 67:964–73. doi: 10.1016/j.jbusres.2013.08.002
19. Habhab S, Sheldon JP, Loeb RC. The relationship between stress, dietary restraint, and food preferences in women. Appetite. (2009) 52:437–44. doi: 10.1016/j.appet.2008.12.006
20. Zellner DA, Saito S, Gonzalez J. The effect of stress on men's food selection. Appetite. (2007) 49:696–9. doi: 10.1016/j.appet.2007.06.013
21. Kim D, Jang S. Stress and food choices: Examining gender differences and the time horizon framing effect. Int J Hospital Manag. (2017) 67:134–42. doi: 10.1016/j.ijhm.2017.08.012
22. Kandiah J, Yake M, Jones J, Meyer M. Stress influences appetite and comfort food preferences in college women. Nutr Res. (2006) 26:118–23. doi: 10.1016/j.nutres.2005.11.010
23. Huang F, Wang H, Wang Z, Zhang J, Du W, Su C, et al. Psychometric properties of the perceived stress scale in a community sample of Chinese. BMC Psychiatry. (2020) 20:130. doi: 10.1186/s12888-020-02520-4
24. Wu T, Hou X, Zhang F, Sharma M, Zhao Y, Shi Z. Association between self-reported food preferences and psychological well-being during perimenopausal period among Chinese women. Front Psychol. (2020) 11:1196. doi: 10.3389/fpsyg.2020.01196
25. Zhou BF. Effect of body mass index on all-cause mortality and incidence of cardiovascular diseases–report for meta-analysis of prospective studies open optimal cut-off points of body mass index in Chinese adults. Biomed Environ Sci. (2002) 15:245–52.
26. Cao B, Wang DF, Yan LL, McIntyre RS, Rosenblat JD, Musial N, et al. Parental characteristics and the risk of schizophrenia in a Chinese population: a case-control study. Nord J Psychiatry. (2019) 73:90–5. doi: 10.1080/08039488.2018.1529196
27. He D, Qiao Y, Xiong S, Liu S, Ke C, Shen Y. Association between dietary quality and prediabetes based on the diet balance index. Sci Rep. (2020) 10:3190. doi: 10.1038/s41598-020-60153-9
28. Gauci S, Young LM, Arnoldy L, Lassemillante AC, Scholey A, Pipingas A. Dietary patterns in middle age: effects on concurrent neurocognition and risk of age-related cognitive decline. Nutr Rev. (2021) nuab047 doi: 10.1093/nutrit/nuab047
29. Born JM, Lemmens SG, Rutters F, Nieuwenhuizen AG, Formisano E, Goebel R, et al. Acute stress and food-related reward activation in the brain during food choice during eating in the absence of hunger. Int J Obes (Lond). (2010) 34:172–81. doi: 10.1038/ijo.2009.221
30. Tariq S, Tariq S, Tariq S. Association of perceived stress with healthy and unhealthy food consumption among teenagers. J Pak Med Assoc. (2019) 69:1817–21. doi: 10.5455/JPMA.302642278
31. Ha J, Kim J. Factors influencing perceived health status among elderly workers: occupational stress, frailty, sleep quality, and motives for food choices. Clin Interv Aging. (2019) 14:1493–501. doi: 10.2147/CIA.S210205
32. Oliver G, Wardle J. Perceived effects of stress on food choice. Physiol Behav. (1999) 66:511–5. doi: 10.1016/S0031-9384(98)00322-9
33. Cartwright M, Wardle J, Steggles N, Simon AE, Croker H, Jarvis MJ. Stress and dietary practices in adolescents. Health Psychol. (2003) 22:362–9. doi: 10.1037/0278-6133.22.4.362
34. Wardle J, Steptoe A, Oliver G, Lipsey Z. Stress, dietary restraint and food intake. Psychosom Res. (2000) 48:195–202. doi: 10.1016/S0022-3999(00)00076-3
35. Almajwal AM. Stress, shift duty, and eating behavior among nurses in Central Saudi Arabia. Saudi Med J. (2016) 37:191–8. doi: 10.15537/smj.2016.2.13060
36. Roberts CJ, Campbell IC, Troop N. Increases in weight during chronic stress are partially associated with a switch in food choice towards increased carbohydrate and saturated fat intake. Eur Eat Disord Rev. (2014) 22:77–82. doi: 10.1002/erv.2264
37. Tryon MS, Carter CS, Decant R, Laugero KD. Chronic stress exposure may affect the brain's response to high calorie food cues and predispose to obesogenic eating habits. Physiol Behav. (2013) 120:233–42. doi: 10.1016/j.physbeh.2013.08.010
38. Cheng SH, Kamil MKM. Stress and Food Intake among University Students - Is There a Relationship? Sains Malays. (2020) 49:121–8. doi: 10.17576/jsm-2020-4901-14
39. Zellner DA, Loaiza S, Gonzalez Z, Pita J, Morales J, Pecora D, et al. Food selection changes under stress. Physiol Behav. (2006) 87:789–93. doi: 10.1016/j.physbeh.2006.01.014
40. El Ansari W, Adetunji H, Oskrochi R. Food and mental health: relationship between food and perceived stress and depressive symptoms among university students in the United Kingdom. Cent Eur J Public Health. (2014) 22:90–7. doi: 10.21101/cejph.a3941
41. Davis C, Shapiro CM, Elliott S, Dionne M. Personality and other correlates of dietary restraint: An age by sex comparison. Pers Individ Dif. (1993) 14:297–305. doi: 10.1016/0191-8869(93)90127-O
Keywords: perceived stress, food preference, eating behavior, population-based study, dietary
Citation: Yang F, Li R, Ren X, Cao B and Gao X (2022) Association Between Perceived Levels of Stress and Self-Reported Food Preferences Among Males and Females: A Stated Preference Approach Based on the China Health and Nutrition Survey. Front. Public Health 10:850411. doi: 10.3389/fpubh.2022.850411
Received: 07 January 2022; Accepted: 04 March 2022;
Published: 25 March 2022.
Edited by:
Noriko Cable, University College London, United KingdomReviewed by:
Francisco E. Ramirez, Weimar Institute, United StatesCopyright © 2022 Yang, Li, Ren, Cao and Gao. This is an open-access article distributed under the terms of the Creative Commons Attribution License (CC BY). The use, distribution or reproduction in other forums is permitted, provided the original author(s) and the copyright owner(s) are credited and that the original publication in this journal is cited, in accordance with accepted academic practice. No use, distribution or reproduction is permitted which does not comply with these terms.
*Correspondence: Bing Cao, YmluZ2Nhb0Bzd3UuZWR1LmNu; Xiao Gao, Z2FveGlhb3hAc3d1LmVkdS5jbg==
†These authors have contributed equally to this work
Disclaimer: All claims expressed in this article are solely those of the authors and do not necessarily represent those of their affiliated organizations, or those of the publisher, the editors and the reviewers. Any product that may be evaluated in this article or claim that may be made by its manufacturer is not guaranteed or endorsed by the publisher.
Research integrity at Frontiers
Learn more about the work of our research integrity team to safeguard the quality of each article we publish.