 Hyo Lee
 Miyoung Lee
95% of researchers rate our articles as excellent or good
Learn more about the work of our research integrity team to safeguard the quality of each article we publish.
Find out more
ORIGINAL RESEARCH article
Front. Public Health , 10 May 2022
Sec. Public Health Education and Promotion
Volume 10 - 2022 | https://doi.org/10.3389/fpubh.2022.846542
The purpose of this study was to investigate daily amounts of time spent sitting and frequency of breaks from sitting and to identify their sociodemographic, environmental, and health behavioral correlates for Korean adults (age = 19–65). This study analyzed accelerometer subdata from the 2014–2015 Korea National Health and Nutrition Examination Survey (n = 1,768). Ordinary least squares regression models stratified by weekday and weekend were tested to identify correlates of time spent sitting and number of sitting breaks. The average daily amounts of sitting time during weekdays and weekends were 500.63 min (95% confidence interval [CI] = 495.20–506.06) and 488.10 min (95% CI = 481.72–494.49), respectively. On weekdays and weekends, the average numbers of breaks from sitting per hour were 6.62 (95% CI = 6.57–6.68) and 6.60 (95% CI = 6.54–6.66), respectively. The participants with the greatest daily sitting time tended to be male, middle-aged, never married, office workers, and residents of a metropolis; tended to have a high school educational level or higher; and had never smoked, were underweight, were physically inactive, and slept <6 h a day. Fewer breaks from sitting was associated with being male, never married, middle-aged, an office worker, an apartment resident, never having smoked, and underweight. Higher education level and physical inactivity were associated with more frequent breaks from sitting. To reduce sedentary behavior, this study helps identify at-risk populations and their characteristics. Future studies should incorporate longitudinal data and measure domain-specific sedentary behavior.
The benefits of physical activity are well-documented (1). Research has also shown that excessive and prolonged sitting time, independent of the level of physical activity, is associated with premature death, cardiovascular disease, type 2 diabetes, and cancer (2, 3). According to the updated physical activity and sitting time guidelines from the World Health Organization (WHO), sedentary behaviors should be replaced with physical activity of any intensity, which includes light-intensity physical activity, and people should perform more than the recommended levels of moderate- to vigorous-intensity physical activity (MVPA) to reduce the detrimental effects of excessive sedentary behavior (4).
In Korea, as in other developed countries, physical inactivity and excessive sitting time are prevalent, despite well-known risks. According to the Korea Disease Control and Prevention Agency (5), the estimated proportion of the population that adheres to the WHO guidelines on aerobic physical activity decreased from 58.3% in 2014 to 47.8% in 2019, when MVPA was measured with the Global Physical Activity Questionnaire (GPAQ). Furthermore, the sitting time (i.e., average number of minutes spent sitting on a typical day, measured with a single-item questionnaire) increased from 469 min in 2014 to 512 min in 2018.
To reduce sedentary behavior, the factors associated with excessive sitting must be understood so that at-risk populations can be identified, and intervention programs can be planned. Sedentary behaviors, as much as physical activity, have complex causes and patterns. Research has shown that social and physical components such as socioeconomic status and built environment have direct and indirect effects on individuals' choice of active or inactive lifestyle (6, 7). In a survey of Australian adults, for example, Hadgraft et al. (8) found that in addition to health-related factors, socioeconomic status, represented by income and occupation, was associated with prolonged sitting time. Meanwhile, previous studies on European and Singaporean multiethnic samples reported that cross-cultural variation exists in relation to the amounts and correlates of sedentary and physical activity behavior (9–11). However, studies of the determinants of sedentary behaviors in the Korean population, which could allow for international comparisons, have been lacking.
Moreover, the validity evidence of recall-based self-report questionnaires as measures of sitting time are not well-established. For example, Urda et al. (12) reported that self-reported sitting time was weakly correlated with data recorded by the activPAL3 device (PAL Technologies Ltd, Glasgow, UK) and was significantly underestimated by 44 office workers. In addition, the Global Physical Activity Questionnaire, which is widely used in national studies, has repeatedly demonstrated insufficient validity as a measure of sedentary behavior and light-intensity physical activity (13).
In summary, a study addressing sedentary behaviors in Koreans using objective physical activity monitors seems timely. We therefore investigated correlates of sitting time, measured with accelerometers, in Korean adults. Using the physical activity monitoring component of the Korea National Health and Nutrition Examination Survey (KNHANES) 2014–2015, we explored the associations between individuals' socioenvironmental and behavioral characteristics and their daily sitting time and frequency of breaks from sitting during weekdays and weekends.
We obtained physical activity monitor subdata (N = 1,768) from the KNHANES 2014–2015 database. This database reflects the non-institutionalized South Korean population according to a complex probability-sampling design. In that surveillance period, physical activity monitors were distributed to adults aged 19 to 65 years.
Daily amounts of time spent sitting, number of breaks from sitting, and information about physical activity were extracted from raw data recorded by the ActiGraph GT3X+ (ActiGraph Corp, Pensacola, FL, USA), which is a physical activity monitor. To summarize the raw data, we used 1-minute epochs in an algorithm suggested by Troiano et al. (14). Cut points of ≤99, ≥2,020, and ≥5,999 counts per minute were applied to classify sitting time, moderate-intensity physical activity, and vigorous-intensity physical activity, respectively. According to minimum daily wear-time criterion for Koreans suggested by Lee and Lee (15), data were deemed valid when participants wore the device 10 or more hours per day. Average wear time was 11.87 and 11.03 h per day during weekdays and weekends, respectively. All missing values, including day-level data from the physical activity monitor, were imputed according to multivariate normal distribution to generate 20 complete datasets (16, 17).
Sociodemographic variables included in this study were age, marital status, household income, education, type of occupation, hours of work per week, type of housing, and area of residence. Health behavioral variables were cigarette smoking, alcohol drinking, body mass index (BMI), adherence to aerobic physical activity recommendation, and hours of sleep. All variables except for age, BMI, and physical activity adherence were self-reported. Specific classification criteria are listed the far-left column of Table 1.
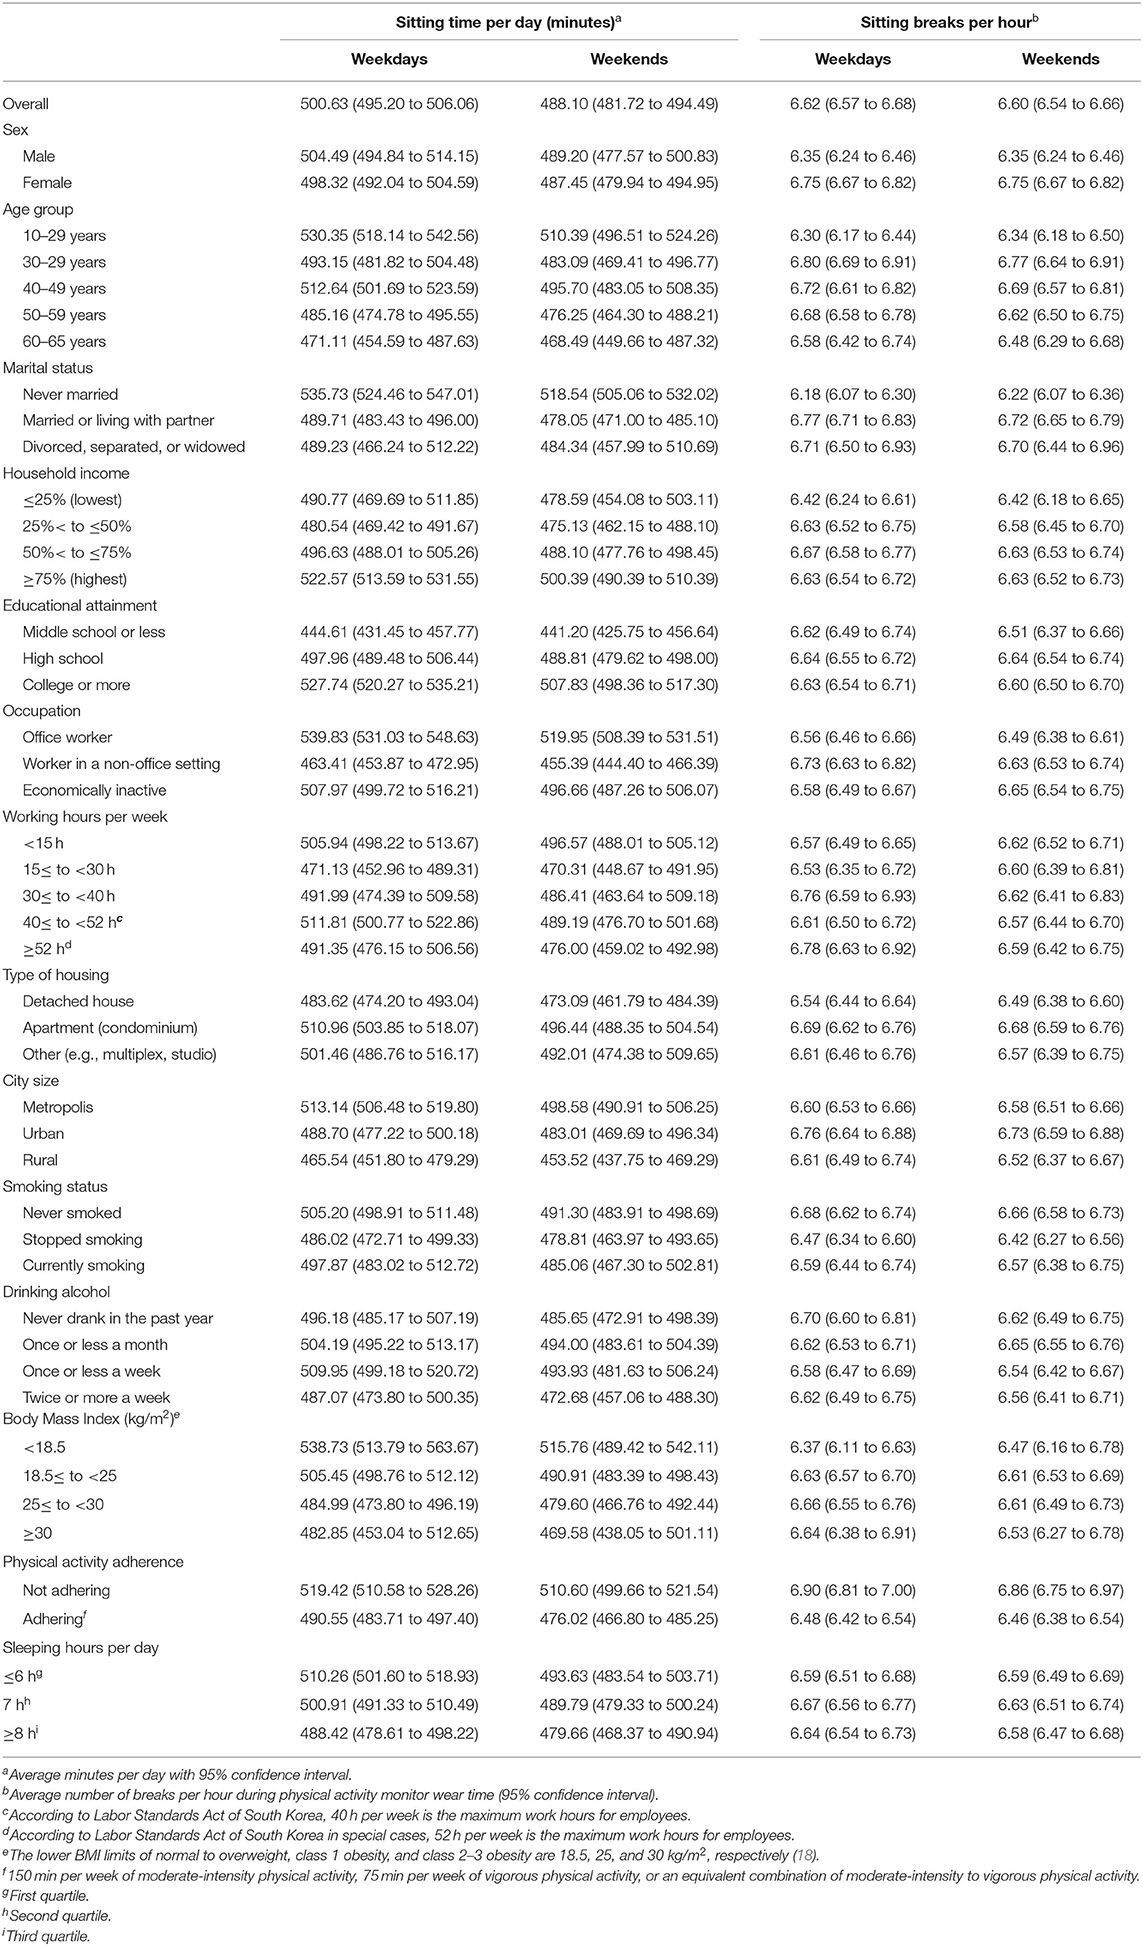
Table 1. Average sitting time per day and breaks from sitting per hour on weekdays and weekends.
Average daily time spent sitting and sitting breaks per hour on weekdays and weekends were estimated. Ordinary least squares regression models were fitted to the data to test sociodemographic and behavioral correlates of sitting time per day and sitting breaks per hour. All estimates were pooled from the multiple-imputation datasets. To process data from the physical activity monitors, we used SAS 9.2 (IBM Corporation, Armonk, NY, USA). Stata 12.0 (StataCorp LLC, College Station, TX, USA) was used to perform all other analyses.
Average daily sitting time (minutes) and number of breaks from sitting (per hour) are listed in Table 1. On average, participants sat for 500.63 min on weekdays (95% confidence interval [CI] = 495.20–506.06) and 488.10 min on weekends (95% CI = 481.72–494.49). The average numbers of breaks from sitting per hour were 6.62 times on weekdays (95% CI = 6.57–6.68) and 6.60 times on weekends (95% CI = 6.54–6.66), respectively.
Table 2 shows data from unadjusted and adjusted least squares regression models used to test correlates of sitting time. According to the adjusted model, longer sitting time during the week was associated significantly more with being male than with being female (B = 22.67, p < 0.01); with never being married than with either being married or living with a partner (B = 41.58, p < 0.001); with graduation from high school (B = 34.12, p < 0.001) or higher education levels (B = 45.53, p < 0.001) than with less than a high-school education; with being an office worker than working in a non-office setting (B = 52.30, p < 0.001); with living in a metropolis than living in urban areas (B = 17.89, p < 0.01) and rural areas (B = 27.38, p < 0.001); with being underweight than class 1 obesity (B = 27.01, p < 0.05) or class 2–3 obesity (B = 33.40, p < 0.05); with never having smoked than having quit smoking (B = 17.12, p < 0.05); with being physically inactive than being active (B = 36.17, p < 0.001); and with sleeping 6 h or less a night than sleeping 7 h (B = 12.00, p < 0.05) or 8 h or more a night (B = 21.41, p < 0.01). The adjusted model also showed that during weekends, people aged 40–49 (B = 28.43, p < 0.05) and 50–59 years (B = 30.66, p < 0.05) sat significantly longer than those aged 19–29 years; those who had never married sat significantly longer than did those who were married or living with a partner (B = 47.33, p < 0.001); high school graduates (B = 33.91, p < 0.001) and those with more than college education attainment (B = 36.93, p < 0.01) sat significantly longer than those with less than a high-school education; office workers sat significantly longer than did those who worked in non-office settings (B = 49.15, p < 0.001); and those who lived in a metropolis sat significantly longer than did those living in a rural area (B = 29.54, p < 0.01). Among health behaviors, only physical activity (physically inactive vs. active) was significantly associated with weekend sitting time (B = 41.99, p < 0.001).
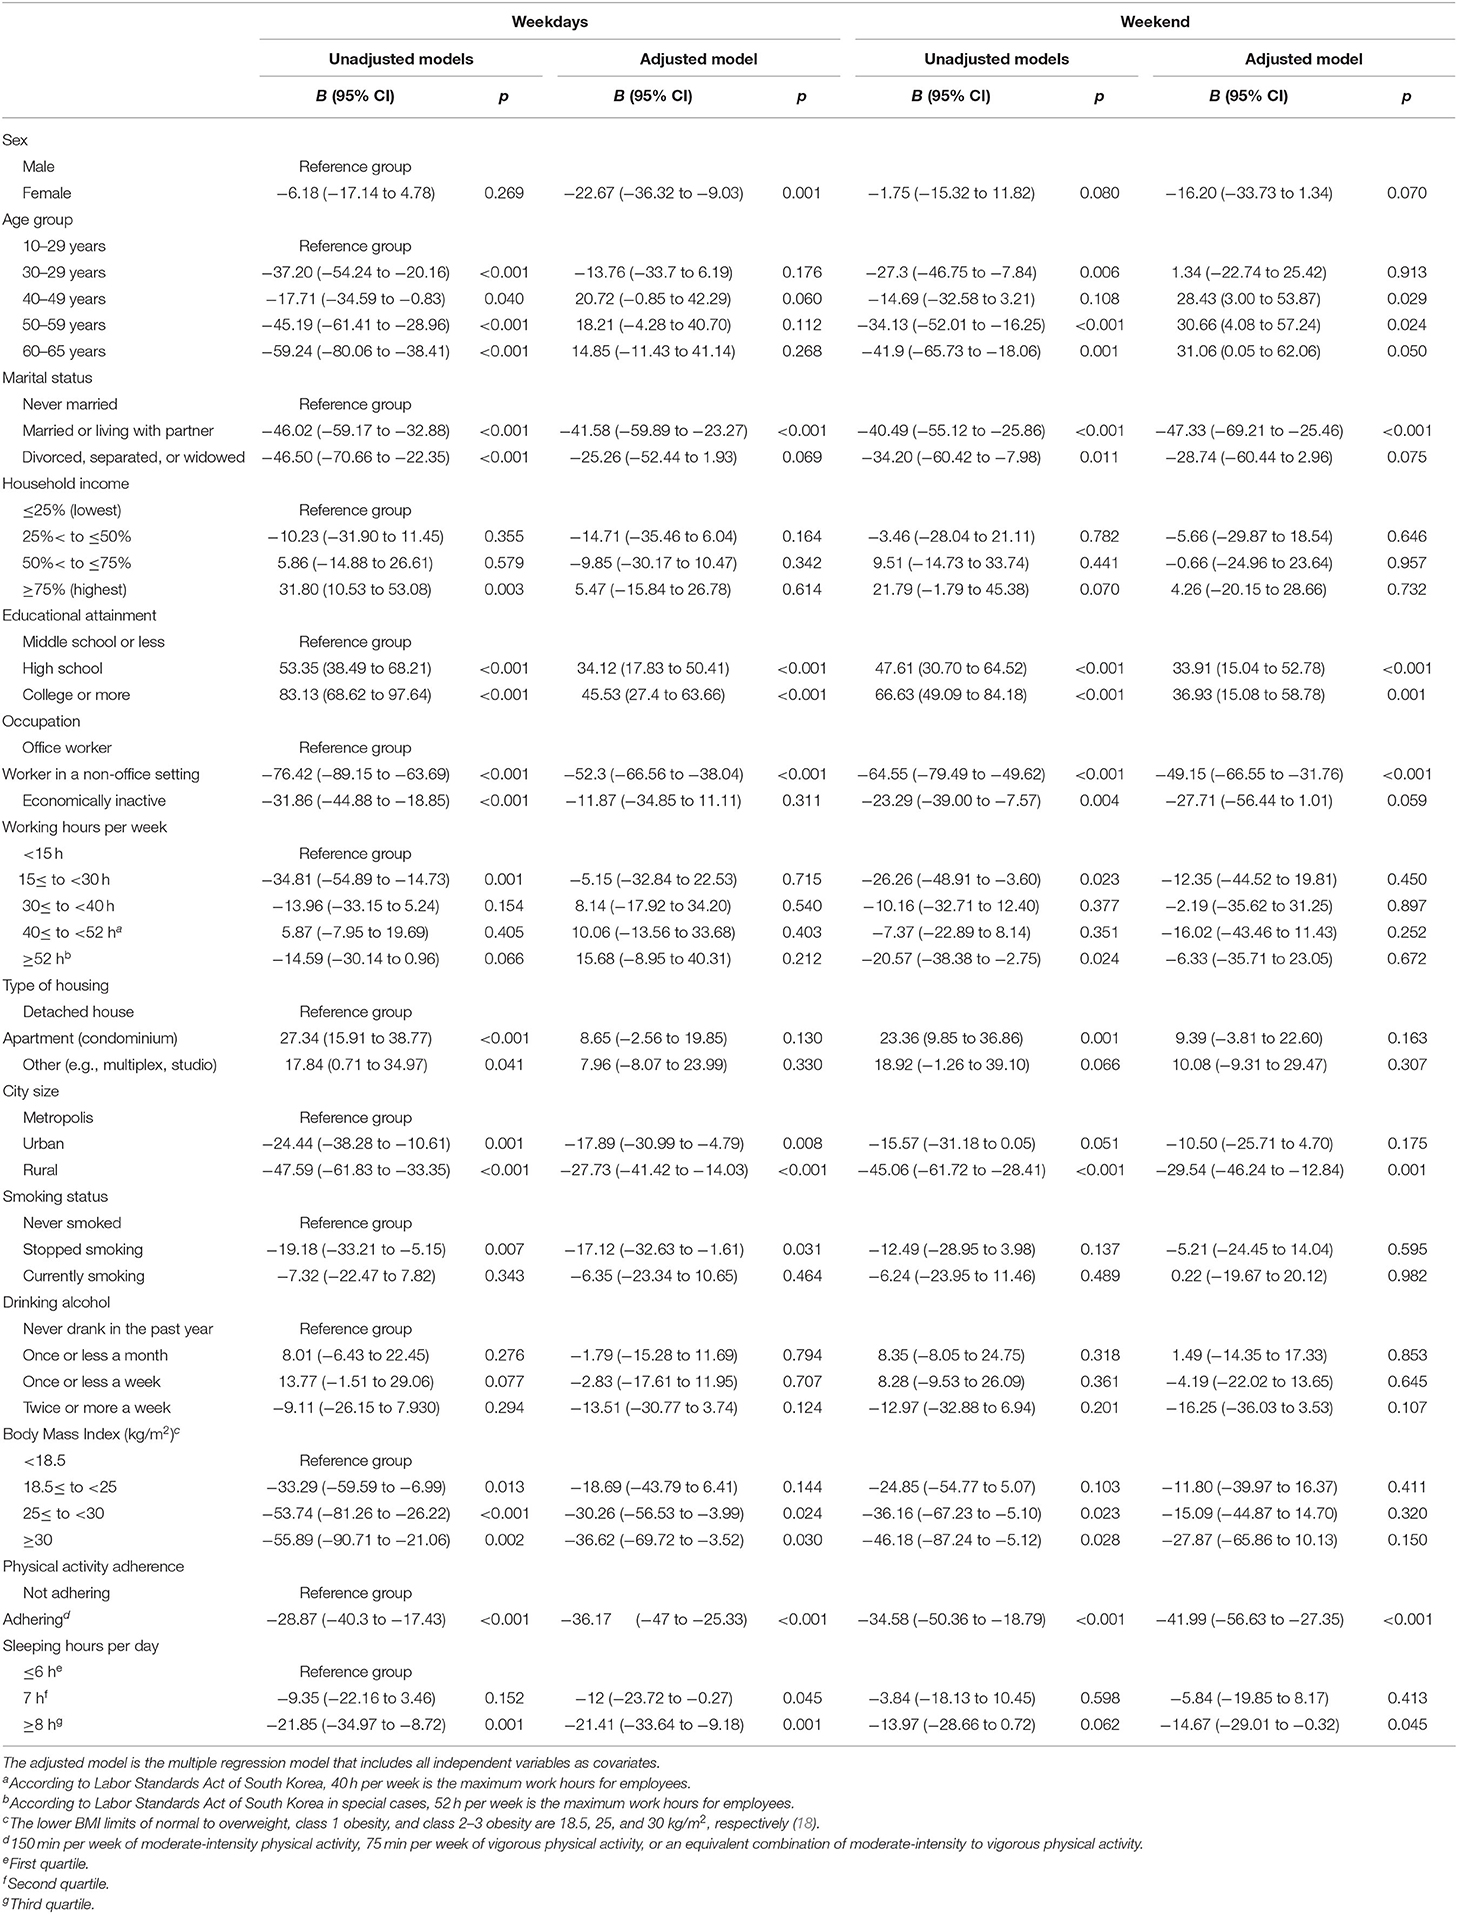
Table 2. Ordinary least squares regression models testing correlates of daily sitting time.
Results from unadjusted and adjusted least squares regression models to test correlates of breaks from sitting are listed in Table 3. The adjusted model showed that during weekdays, the following participants tended have fewer sitting breaks: those who were male, in comparison with those who were female (B = −0.54, p < 0.001); those aged 40–49 years (B = −0.27, p < 0.05) and 50–59 years (B = −0.26, p < 0.05), in comparison with those aged 19–29; those never married, in comparison with those married or living with a partner (B = −0.66, p < 0.001) and with those who were divorced, separated, or widowed (B= −0.58, p < 0.001); those who worked in an office, in comparison with those who worked in non-office settings (B = −0.16, p < 0.05); those who lived in a detached home, in comparison with those who lived in apartments or condominiums (B = −0.14, p < 0.05); those who had never smoked, in comparison with those currently smoking (B = −0.21, p < 0.05); those who were underweight, in comparison with those who were normal to overweight (B = −0.27, p < 0.05) and obese (class 1; B = −0.32, p < 0.05); and those who were physically active, in comparison with those who were inactive (B = −0.33, p < 0.001). During weekends, the following participants took less breaks from sitting: individuals who were male, in comparison with those who were female (B = −0.43, p < 0.001); those who had never married, in comparison with both those who were married or living with a partner (B = −0.62, p < 0.001) and those who were divorced, separated, or widowed (B = −0.61, p < 0.001); those with a middle school education or less, in comparison with high school graduates (B = −0.20, p < 0.05); those who worked in an office, in comparison with those who worked in non-office settings (B = −0.19, p < 0.05); and those who were physically active, in comparison with those who were inactive (B = −0.32, p < 0.001).
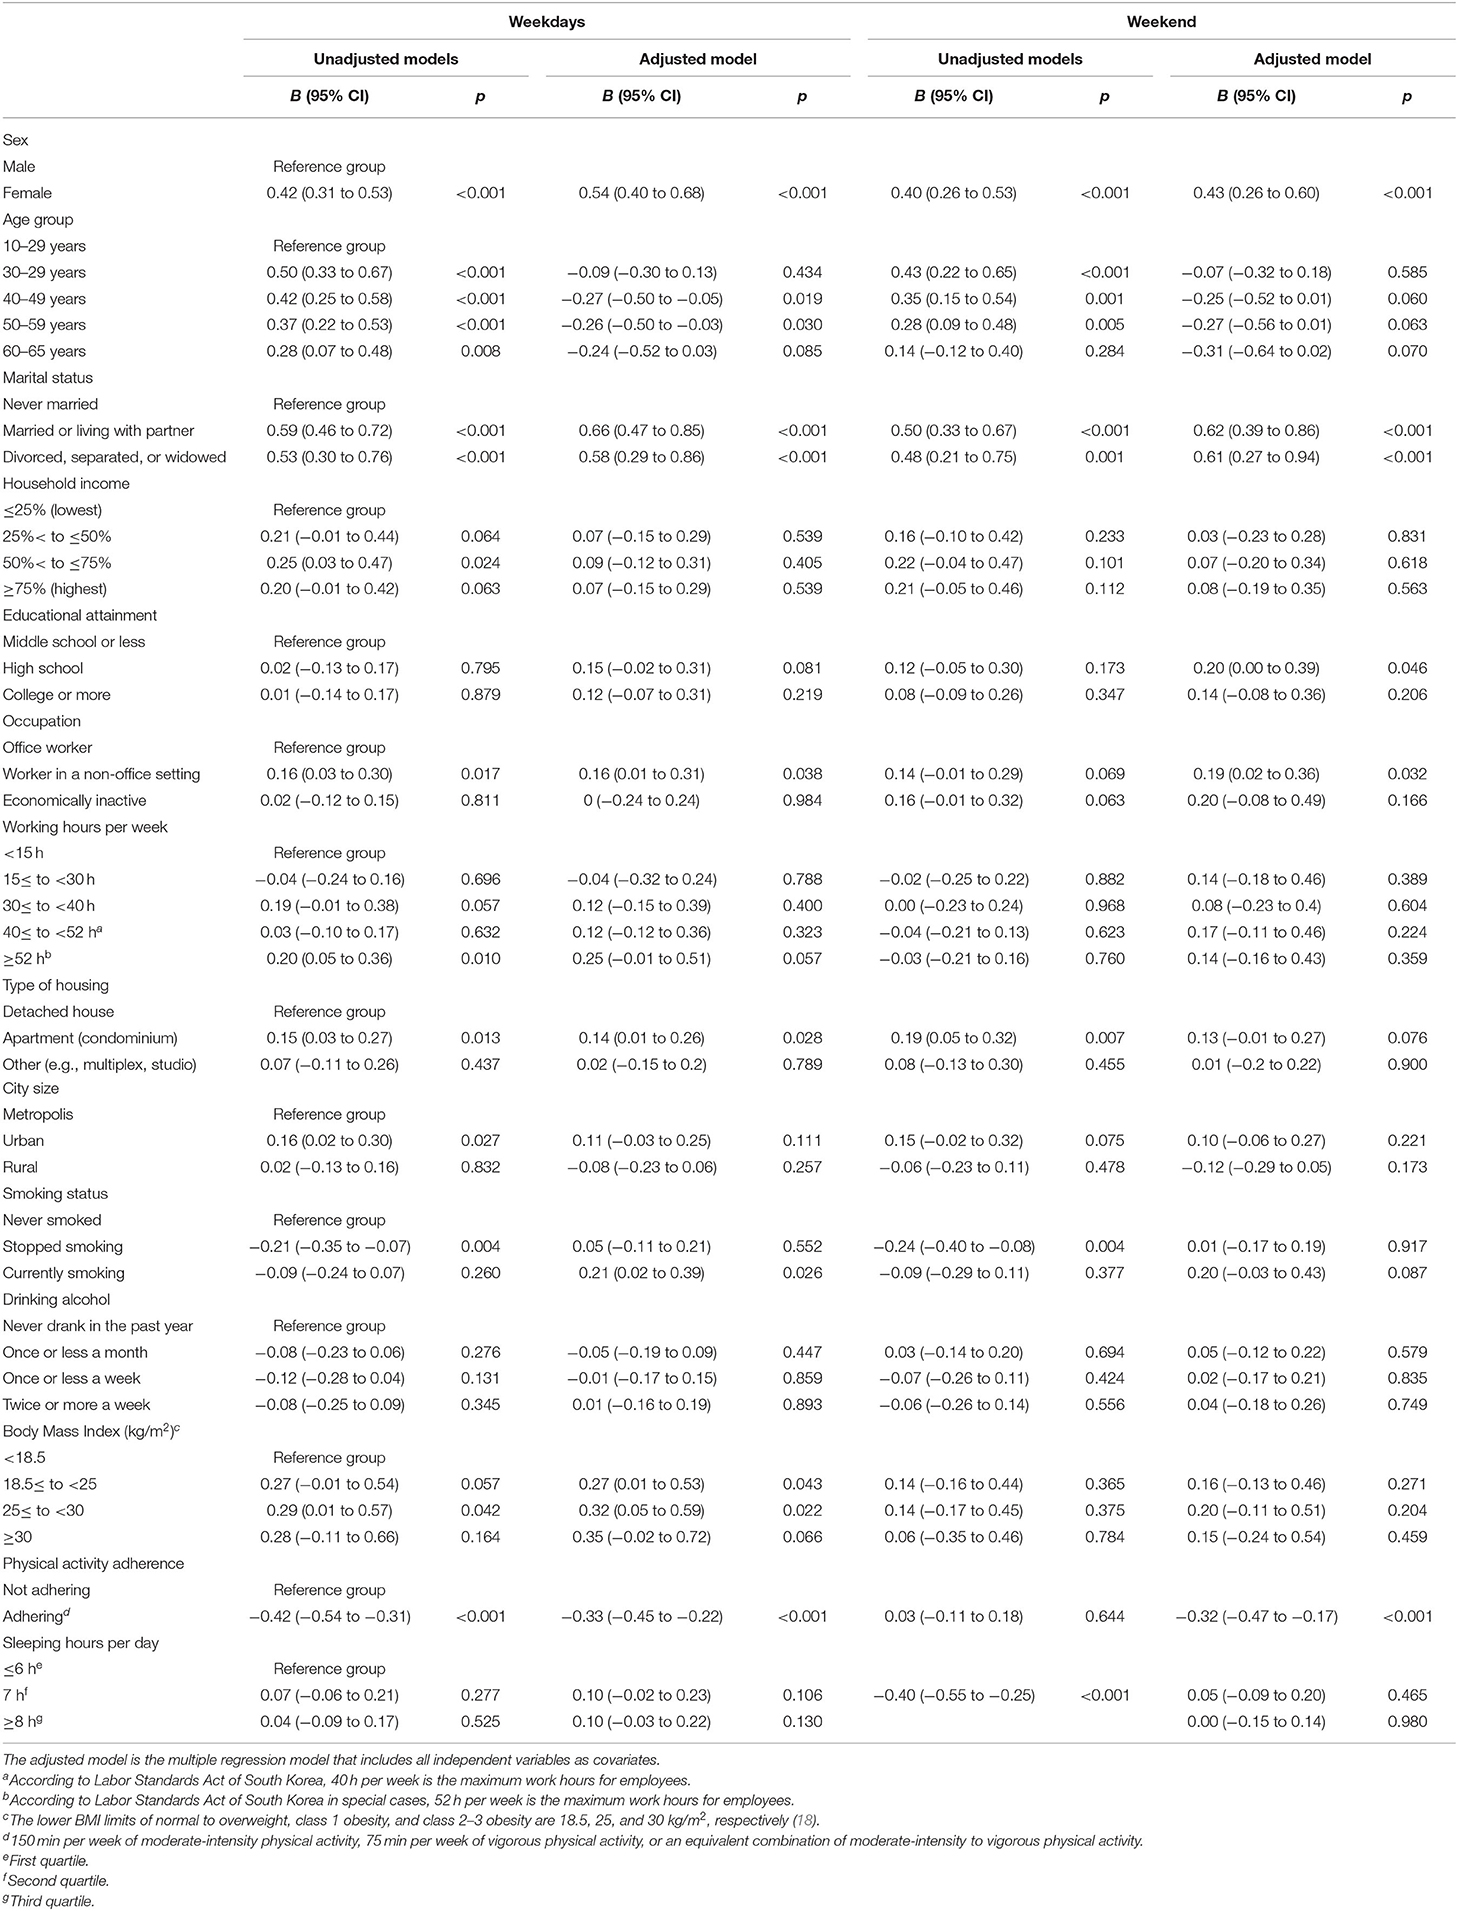
Table 3. Ordinary least squares regression models testing correlates of breaks from sitting per hour.
This study, to the best of our knowledge, was the first to analyze sociodemographic and health behavior correlates of objectively measured sitting time using Korean national surveillance data. In view of the growing evidence of the adverse effects of excessive sitting, it is important to identify factors associated with sedentary behavior in South Korean adults; these factors can help identify at-risk groups and inform intervention programs.
We found that Korean adults spent 500.63 min per weekday and 488.10 min per day on the weekend sitting (being sedentary). The difference between weekdays and weekends may not be meaningful; however, as participants wore the monitor substantially longer on weekdays (11.87 h) than on weekends (11.03 h). The numbers of breaks from sitting were 6.62 and 6.60 times per hour on weekdays and weekends, respectively. Among national surveillance data from other countries, those of the National Health and Nutrition Examination Survey (NHANES) 2004–2005 in the United States (19) are comparable with ours, despite the 10-year gap. The single-axis accelerometric data of 3,725 participants indicated that, on average, adults in the United States were sedentary for 478.9 min per day and took 6.54 breaks from sitting per hour in 2004 and 2005. Considering that the average amount of time that the NHANES participants wore the monitor was 14.0 h per day, Korean adults in 2014–2015 seem to have spent more time sitting than did American adults in 2004–2005. To calculate how much the Korean adults would have sat if they had worn the device for 14.0 h a day, we divided their average sitting time by wear time and then multiplied the answer by wear time recorded for the US adults (500.6 × 14.0/11.9 = 588.9 min on weekdays and 488.1 × 14.0/11.0 = 621.2 min on weekends). Meanwhile, the results from previous studies in East Asian countries were not directly comparable with ours because those studies involved different measurement modes (i.e., objective vs. subjective) (9) or different domains of sedentary behavior (e.g., all domains vs. occupational sitting time) (20).
In the univariate (unadjusted) models, all independent variables except for sex and alcohol drinking were significantly associated with weekday sitting time. On weekends, in addition to sex and alcohol drinking, household income, smoking status, and number of hours of sleep were not significantly associated with sitting time. According to the multiple regression models, never having been married, having a high school or higher education level, being an office worker, residing in a metropolis, and physical inactivity (i.e., not adhering to MVPA guidelines) were significant risk factors for excessive sitting during both weekdays and weekends when other variables were adjusted. Being male, never having smoked, being underweight, and sleeping 6 h or less at night were the factors that were significantly and positively associated sitting time during weekdays only. People in their 40s and 50s spent significantly more time sitting during weekends than those in their 20s.
Previous studies have shown that being male, being older, being single, higher BMI, higher education, being an office worker, living in an urban or metropolitan area, smoking, drinking alcohol, shorter sleep hours, and less physical activity were associated with longer sitting time in adults (8–10, 20–25). It was reported that prolonged sitting combined with physical inactivity is associated with an increased risk of mortality (26). Our study shows that prolonged sitting is associated not only with physical inactivity but also with other unhealthy behaviors. Future studies should identify at-risk populations and the health effects of these combinations. Meanwhile, most of our findings were consistent with previous studies; the exceptions were those for smoking and BMI.
In our study, individuals who had stopped smoking sat longer on weekdays than those who had never smoked. This finding does not necessarily contradict the results of the studies previously mentioned because smoking cessation is considered as much a health-enhancing and purposeful behavior as never smoking. Further, in our study, participants who were underweight sat significantly longer on weekdays than did their counterparts who were obese. A few studies of adolescents produced findings that may be instructive in understanding these somewhat counterintuitive findings; for example, Polish adolescents who were underweight were less physically active than those of normal weight (27). Similarly, Artero et al. (28) found that physical fitness level was poorer among underweight Spanish adolescents than among their normal-weight counterparts. These findings suggest that less sedentary behavior and more physical activity can be beneficial for maintaining a healthy weight; but being underweight may also hinder an active lifestyle because of the lack of physical fitness.
An association between an independent variable and a dependent variable that is significant in an unadjusted model might not be significant in an adjusted model; for example, age was significantly correlated with weekday sitting time in our unadjusted model but not in our adjusted model. This suggests that in young people who are sedentary, their inactivity is not attributable to age (spurious association); rather, they are more likely to never have been married, to be recipients of higher education, and to be white-collar workers, among other variables. Associations between weekday sitting time and age, household income, working hours per week, and type of housing appeared spurious. Moreover, on weekends, the associations between sitting time and both working hours per week and BMI seemed spurious, too.
In the univariate regression models, sex, age, marital status, household income, occupation, working hours per week, type of housing, city size, smoking status, and adherence to MVPA guidelines were significantly associated with number of breaks from sitting per hour on weekdays. On weekends, among these, however, household income and occupation were not significantly correlated with the number sitting breaks. The multivariate regression models showed that participants who were male, had never married, were office workers (vs. working in non-office settings), and were physically active (i.e., adhering to MVPA guidelines) took fewer breaks from sitting than did their counterparts during both weekdays and weekends. Age in the 40s and 50s (vs. 20s), residing in apartments (vs. detached houses), never having smoked (vs. currently smoking), and being underweight (vs. obese) were risk factors for fewer sitting breaks during weekdays. Lastly, lower education attainment (completion of middle school or less vs. high school) was associated with less frequent sitting breaks during weekends.
Associations that are significant only when potential confounding factors were not accounted for can be considered spurious. Such associations were found between sitting breaks and household income, working hours per week, and city size on weekdays; and age, type of housing, and smoking status on weekends.
Because self-report questionnaires have shown limited validity evidence in measuring the number of breaks from sitting, only a handful of studies have examined its correlates using objective measures. In a study of 227 Japanese office-based workers, Kurita et al. (20) reported that being male, residing in a metropolitan area, being overweight or obese, and physical inactivity were risk factors for taking fewer breaks from sitting. Further, in a cross-sectional study of 205 Danish blue-collar workers, Gupta et al. (29) found that BMI was negatively associated with short-term sitting (<5 min) and positively associated with long-term sitting (>30 min). In a longitudinal study of 1,536 older English adults, Yerrakalva et al. (30) reported that higher BMI, more television viewing, and less physical activity were associated with a higher number of prolonged sedentary periods (fewer breaks from sitting).
These results are consistent with our findings, except those for BMI and physical activity. Rather than contradicting results of previous studies, our findings suggest that sedentary behavior may be attributed to health status, including BMI, and the opposite direction of influences may be true as well (i.e., a reciprocal relationship that engaging in less physical activity and more sedentary behavior results in poor health status such as overweight/obesity; but also being underweight that may involve lack of physical fitness may result in fewer sitting breaks). Nevertheless, it is hard to reason why physically active participants did not take as many breaks from sitting as their physically inactive counterparts. In contrast, total sitting time was shorter among physically active participants than among inactive ones. With regards to this, the readers should remind that sitting, light-intensity physical activity, and MVPA represent a continuum of movement intensity (31). Therefore, sitting less means being more physically active. Our findings suggest that having fewer sitting breaks may have different etiology compared to total sitting time. Otherwise, physically active individuals may have not broken sitting time simply because they sat less than inactive ones. Future study needs to address this issue by incorporating motivational components and different measurement approaches to sitting break (e.g., counting the number of prolonged sedentary periods of certain criterion and/or sitting break per “sitting” hour).
We also found that age in the 40s and 50s (vs. 20s), never being married, being a current smoker, and living in an apartment are risk factors for fewer sitting breaks. In Korea, middle-aged adults are the subpopulation that is economically most active but also a group whose risk for chronic diseases and premature death has increased steeply over the past 10 years (32). In addition, studies have consistently demonstrated that the physical activity adherence among people in their 40s to 60s is higher than that among people in their 30s (17, 33); thus middle-aged adults in Korea are both physically active but also the most sedentary age group.
With regard to the associations between marital status and daily sitting time and breaks from sitting, previous studies showed that unmarried women tended to have longer workplace sitting time and to watch more TV than did their married counterparts (8, 34); the reason may be that unmarried adults may have fewer family obligations than do married adults. A related finding is that a high burden of family support was associated with less sedentary behavior (10, 35). Workers who smoke presumably need to interrupt sitting more often to smoke outdoors because indoor smoking is prohibited, but our results indicate the opposite. Future studies should address how the frequency of smoking is related to taking breaks from sitting.
Living in an apartment in Korea means having many conveniences, including home automation and well-designed neighborhoods. Many new apartment complexes include high-quality sports facilities, parks, and safe walking environments. According to Lee et al. (36), an apartment complex was indeed one of the favorite places for older adults to walk.
In sum, our study results confirmed that the total amount of sitting and breaking up long-lasting sitting have different correlates, although they also have some degree of commonality. Previous research showed that short- and long-term physiological responses to too much daily sitting time and fewer breaks from sitting are interrelated but different (3, 18, 29, 37, 38). In view of these findings, these two behaviors must be differentiated to identify at-risk populations and to design intervention programs.
A strength of this study was that accelerometers were used to objectively measure total sitting time, number of breaks from sitting per hour, and MVPA. In addition, the participants of this study were recruited as part of a national surveillance system. Although the subsample of this study was not randomly selected, the KNHANES is a random and representative sample of the non-institutionalized Korean population. However, this study had some limitations. First, the KNHANES is a cross-sectional surveillance system, and so cause and effect association could not be confirmed in the current study. Second, we did not differentiate domains of sedentary behaviors, i.e., we were not able to identify whether sitting time and breaks from sitting took place at home, in the workplace, at school, during leisure time, and in other situations, which could have informed further on etiology of sedentary behaviors and domain-specific intervention programs.
In summary, we found that in the period 2014–2015, South Korean adults spent 500.63 and 488.10 min a day sitting on weekdays and weekends, respectively. In addition, they took 6.62 and 6.60 breaks from sitting per hour on weekdays and weekends, respectively. The people who spent the most time sitting were male, middle-aged, and never married; had a high school or higher level of education; were office workers and residents of metropolises; never smoked; were underweight and physically inactive; and slept less than 6 h a day. The people who sat for prolonged periods (i.e., least frequent sitting breaks) group were predominantly male, never married, middle-aged, office workers, apartment residents, and had never smoked and were underweight. Higher education and physical inactivity were associated with more breaks from sitting. In future studies, investigators should consider the contexts of sedentary behaviors (e.g., work, leisure, screen time, and transportation) and use a longitudinal study design.
The datasets presented in this study can be found in online repositories. The names of the repository/repositories and accession number(s) can be found at: https://knhanes.kdca.go.kr/knhanes/sub03/sub03_01.do.
The KNHANES 2014 was approved by the Research Ethics Review Committee of the Korea Centers for Disease Control and Prevention. The approval for the KNHANES 2015 was exempted according to Article 2 Paragraph 1 of the Bioethics Act and Article 2 Paragraph 2 Subparagraph 1 of the Enforcement Rules. The participants provided their informed consent prior to the survey and examinations.
HL led the overall study, handled and analyzed KNHANES data, and wrote the manuscript. ML contributed to writing discussion section and edited the manuscript. Both authors read and approved the final manuscript.
The authors declare that the research was conducted in the absence of any commercial or financial relationships that could be construed as a potential conflict of interest.
All claims expressed in this article are solely those of the authors and do not necessarily represent those of their affiliated organizations, or those of the publisher, the editors and the reviewers. Any product that may be evaluated in this article, or claim that may be made by its manufacturer, is not guaranteed or endorsed by the publisher.
HL conducted this research while he was a visiting scholar at the Institut des Sciences du Sport Santé de Paris, Université de Paris.
1. Powell KE, King AC, Buchner DM, Campbell WW, DiPietro L, Erickson KI, et al. The scientific foundation for the physical activity guidelines for Americans. J Phys Act Health. (2018) 16:1–11. doi: 10.1123/jpah.2018-0618
2. Katzmarzyk PT, Powell KE, Jakicic JM, Troiano RP, Piercy K, Tennant B, et al. Sedentary behavior and health: update from the 2018 physical activity guidelines advisory committee. Med Sci Sports Exerc. (2019) 51:1227–41. doi: 10.1249/MSS.0000000000001935
3. Saunders TJ, McIsaac T, Douillette K, Gaulton N, Hunter S, Rhodes RE, et al. Sedentary behaviour and health in adults: an overview of systematic reviews. Appl Physiol Nutr Metab. (2020) 45(Suppl. 2):S197–217. doi: 10.1139/apnm-2020-0272
4. Bull FC, Al-Ansari SS, Biddle S, Borodulin K, Buman MP, Cardon G, et al. World Health Organization 2020 guidelines on physical activity and sedentary behaviour. Br J Sports Med. (2020) 54:1451–62. doi: 10.1136/bjsports-2020-102955
5. Korea Disease Control and Prevention Agency. Korea Health Statistics 2019: Korea National Health and Nutrition Examination Survey (KNHANES VIII-1) (2020).
6. Lee C, Lee S. Analysis of the impacts of neighborhood environment on physical activity and health status in Seoul, Korea-application of multilevel analysis with the Korea National Health and Nutrition Examination Survey (2007-2012). J Korea Plan Assoc. (2016) 51:217–39. doi: 10.17208/jkpa.2016.06.51.3.217
7. Stappers NEH, Van Kann DHH, Ettema D, De Vries NK, Kremers SPJ. The effect of infrastructural changes in the built environment on physical activity, active transportation and sedentary behavior - a systematic review. Health Place. (2018) 53:135–49. doi: 10.1016/j.healthplace.2018.08.002
8. Hadgraft NT, Lynch BM, Clark BK, Healy GN, Owen N, Dunstan DW. Excessive sitting at work and at home: correlates of occupational sitting and TV viewing time in working adults. BMC Public Health. (2015) 15:1–13. doi: 10.1186/s12889-015-2243-y
9. Uijtdewilligen L, Yin JD, van der Ploeg HP, Muller-Riemenschneider F. Correlates of occupational, leisure and total sitting time in working adults: results from the Singapore multi-ethnic cohort. Int J Behav Nutr Phys Act. (2017) 14:169. doi: 10.1186/s12966-017-0626-4
10. Loyen A, van der Ploeg HP, Bauman A, Brug J, Lakerveld J. European sitting championship: prevalence and correlates of self-reported sitting time in the 28 European Union Member States. PLoS ONE. (2016) 11:e0149320. doi: 10.1371/journal.pone.0149320
11. Loyen A, Verloigne M, Van Hecke L, Hendriksen I, Lakerveld J, Steene-Johannessen J, et al. Variation in population levels of sedentary time in European adults according to cross-European studies: a systematic literature review within DEDIPAC. Int J Behav Nutr Phys Act. (2016) 13:71. doi: 10.1186/s12966-016-0397-3
12. Urda JL, Larouere B, Verba SD, Lynn JS. Comparison of subjective and objective measures of office workers' sedentary time. Prev Med Rep. (2017) 8:163–8. doi: 10.1016/j.pmedr.2017.10.004
13. Cleland CL, Hunter RF, Kee F, Cupples ME, Sallis JF, Tully MA. Validity of the global physical activity questionnaire (GPAQ) in assessing levels and change in moderate-vigorous physical activity and sedentary behaviour. BMC Public Health. (2014) 14:1–11. doi: 10.1186/1471-2458-14-1255
14. Troiano RP, Berrigan D, Dodd KW, Masse LC, Tilert T, McDowell M. Physical activity in the United States measured by accelerometer. Med Sci Sports Exerc. (2008) 40:181. doi: 10.1249/mss.0b013e31815a51b3
15. Lee H, Lee M. Estimates of Accelerometry-measured sedentary behavior: validity and reliability evidences based on different wear-time and day criteria. Korea J Meas Eval Phys Educ Sport Sci. (2016) 18:69–82. doi: 10.21797/ksme.2016.18.1.006
17. Lee H, Lee M, Choi JY, Oh KK, Kim Y, Kim S. KNHANES actigraph raw data processing. Korea J Meas Eval Phys Educ Sport Sci. (2018) 20:83–94. doi: 10.21797/ksme.2018.20.2.008
18. World Health Organization International Obesity Task Force. The Asian-Pacific Perspective: Redefining Obesity and Its Treatment. Geneva: WHO Western Pacific Region (2000).
19. Schuna JM, Johnson WD, Tudor-Locke C. Adult self-reported and objectively monitored physical activity and sedentary behavior: NHANES 2005–2006. Int J Behav Nutri Phys Act. (2013) 10:1–12. doi: 10.1186/1479-5868-10-126
20. Kurita S, Shibata A, Ishii K, Koohsari MJ, Owen N, Oka K. Patterns of objectively assessed sedentary time and physical activity among Japanese workers: a cross-sectional observational study. BMJ Open. (2019) 9:e021690. doi: 10.1136/bmjopen-2018-021690
21. Wallmann-Sperlich B, Bucksch J, Schneider S, Froboese I. Socio-demographic, behavioural and cognitive correlates of work-related sitting time in German men and women. BMC Public Health. (2014) 14:1259. doi: 10.1186/1471-2458-14-1259
22. Yang Y, Shin JC, Li D, An R. Sedentary behavior and sleep problems: a systematic review and meta-analysis. Int J Behav Med. (2017) 24:481–92. doi: 10.1007/s12529-016-9609-0
23. Van Dyk TR, Krietsch KN, Saelens BE, Whitacre C, McAlister S, Beebe DW. Inducing more sleep on school nights reduces sedentary behavior without affecting physical activity in short-sleeping adolescents. Sleep Med. (2018) 47:7–10. doi: 10.1016/j.sleep.2018.03.007
24. Van Uffelen JG, Heesch KC, Brown W. Correlates of sitting time in working age Australian women: who should be targeted with interventions to decrease sitting time? J Phys Act Health. (2012) 9:270–87. doi: 10.1123/jpah.9.2.270
25. Yang L, Cao C, Kantor ED. Trends in sedentary behavior among the US Population, 2001-2016. JAMA. (2019) 321:1587–97. doi: 10.1001/jama.2019.3636
26. Cao C, Friedenreich CM, Yang L. Association of daily sitting time and leisure-time physical activity with survival among US cancer survivors. JAMA Oncol. (2022) 8:395–403. doi: 10.1001/jamaoncol.2021.6590
27. Kantanista A, Osiński W, Bronikowski M, Tomczak M. Physical activity of underweight, normal weight and overweight Polish adolescents: the role of classmate and teacher support in physical education. Eur Phys Educ Rev. (2013) 19:347–59. doi: 10.1177/1356336X13505188
28. Artero EG, España-Romero V, Ortega F, Jiménez-Pavón D, Ruiz J, Vicente-Rodríguez G, et al. Health-related fitness in adolescents: underweight, and not only overweight, as an influencing factor. The AVENA study. Scand J Med Sci Sports. (2010) 20:418–27. doi: 10.1111/j.1600-0838.2009.00959.x
29. Gupta N, Heiden M, Aadahl M, Korshøj M, Jørgensen MB, Holtermann A. What is the effect on obesity indicators from replacing prolonged sedentary time with brief sedentary bouts, standing and different types of physical activity during working days? A cross-sectional accelerometer-based study among blue-collar workers. PloS ONE. (2016) 11:e0154935. doi: 10.1371/journal.pone.0154935
30. Yerrakalva D, Hajna S, Wijndaele K, Westgate K, Khaw K-T, Wareham N, et al. Correlates of change in accelerometer-assessed total sedentary time and prolonged sedentary bouts among older English adults: results from five-year follow-up in the EPIC-Norfolk cohort. Aging. (2021) 13:134–49. doi: 10.18632/aging.202497
31. Owen N. Sedentary behavior: understanding and influencing adults' prolonged sitting time. Prev Med. (2012) 55:535–9. doi: 10.1016/j.ypmed.2012.08.024
32. Rhee E-J. Prevalence and current management of cardiovascular risk factors in Korean adults based on fact sheets. Endocrinol Metab. (2020) 35:85–94. doi: 10.3803/EnM.2020.35.1.85
33. Korean Statistical Information Service. Aerobic Physical Activity Adherence Rate: Korean Statistical Information Service. (2020). Available online at: https://kosis.kr/statHtml/statHtml.do?orgId=117&tblId=DT_11702_N236.
34. Hadgraft NT, Healy GN, Owen N, Winkler EA, Lynch BM, Sethi P, et al. Office workers' objectively assessed total and prolonged sitting time: individual-level correlates and worksite variations. Prev Med Rep. (2016) 4:184–91. doi: 10.1016/j.pmedr.2016.06.011
35. Rhodes RE, Mark RS, Temmel CP. Adult sedentary behavior: a systematic review. Am J Prev Med. (2012) 42:e3–28. doi: 10.1016/j.amepre.2011.10.020
36. Lee H-S, Ahn J-S, Chun S-H. Analysis of environmental correlates with walking among older urban adults. J Korea Inst Landscape Archit. (2011) 39:65–72. doi: 10.9715/KILA.2011.39.2.065
37. Benatti FB, Ried-Larsen M. The effects of breaking up prolonged sitting time: a review of experimental studies. Med Sci Sports Exerc. (2015) 47:2053–61. doi: 10.1249/MSS.0000000000000654
Keywords: sedentary lifestyle, prolonged sitting, breaks from sitting, KNHANES, national health surveillance, accelerometer, physical activity monitor
Citation: Lee H and Lee M (2022) Correlates of Objectively Measured Sitting Time in South Korean Adults: 2014–2015 Korea National Health and Nutrition Examination Survey. Front. Public Health 10:846542. doi: 10.3389/fpubh.2022.846542
Received: 31 December 2021; Accepted: 05 April 2022;
Published: 10 May 2022.
Edited by:
Víctor Arufe Giráldez, University of A Coruña, SpainReviewed by:
Birute Strukcinskiene, Klaipeda University, LithuaniaCopyright © 2022 Lee and Lee. This is an open-access article distributed under the terms of the Creative Commons Attribution License (CC BY). The use, distribution or reproduction in other forums is permitted, provided the original author(s) and the copyright owner(s) are credited and that the original publication in this journal is cited, in accordance with accepted academic practice. No use, distribution or reproduction is permitted which does not comply with these terms.
*Correspondence: Miyoung Lee, bXlsZWVAa29va21pbi5hYy5rcg==
Disclaimer: All claims expressed in this article are solely those of the authors and do not necessarily represent those of their affiliated organizations, or those of the publisher, the editors and the reviewers. Any product that may be evaluated in this article or claim that may be made by its manufacturer is not guaranteed or endorsed by the publisher.
Research integrity at Frontiers
Learn more about the work of our research integrity team to safeguard the quality of each article we publish.