 Lin Shi
 Leilei Zheng
 Danni Jin1,2,3
 Zheng Lin
 Mao Zhang
- 1Department of Emergency Medicine, Second Affiliated Hospital, Zhejiang University School of Medicine, Hangzhou, China
- 2Key Laboratory of the Diagnosis and Treatment of Severe Trauma and Burn of Zhejiang Province, Hangzhou, China
- 3Zhejiang Province Clinical Research Center for Emergency and Critical Care Medicine, Hangzhou, China
- 4Department of Psychiatry, Second Affiliated Hospital, Zhejiang University School of Medicine, Hangzhou, China
Objectives: Approximately 20~30% of all traffic accidents are caused by fatigue driving. However, limited practicability remains a barrier for the real application of available techniques to detect driving fatigue. Use of pupillary light reflex (PLR) may be potentially effective for driving fatigue detection.
Methods: A 90 min monotonous simulated driving task was utilized to induce driving fatigue. During the task, PLR measurements were performed at baseline and at an interval of 30 min. Subjective rating scales, heart rate variability (HRV) were monitored simultaneously.
Results: Thirty-two healthy volunteers in China participated in our study. Based on the results of subjective evaluation and behavioral performances, driving fatigue was verified to be successfully induced by a simulated driving task. Significant variations of PLR and HRV parameters were observed, which also showed significant relevance with the change in Karolinska Sleepiness Scale at several timepoints (|r| = 0.55 ~ 0.72, P < 0.001). Furthermore, PLR variations had excellent ability to detect driving fatigue with high sensitivity and specificity, of which maximum constriction velocity variations achieved a sensitivity of 85.00% and specificity of 72.34% for driving fatigue detection, vs. 82.50 and 78.72% with a combination of HRV variations, a nonsignificant difference (AUC = 0.835, 0.872, P > 0.05).
Conclusions: Pupillary light reflex variation may be a potential indicator in the detection of driving fatigue, achieving a comparative performance compared with the combination with heart rate variability. Further work may be involved in developing a commercialized driving fatigue detection system based on pupillary parameters.
Introduction
Road traffic accidents has become the eighth leading cause of death worldwide (1). They killed nearly 1.35 million people every year, and caused up to 50 million injuries (1), resulting in huge losses for societies with regard to population health and economic matters. However, ~20~30% of all traffic accidents are caused by fatigue driving, which is in fact preventable (2). Driving fatigue is often induced by prolonged driving without due rest, being presented with deteriorated concentration, low alertness, slow reaction to emergencies, etc., all of which can lead to road traffic crashes (3). Continuous efforts have been made to develop reliable indicators of driving fatigue to warn drivers of their fatigue status promptly and thus preventing possible accidents from occurring (4–10).
Among these exploratory studies, the detection systems incorporating physiological signals of drivers, which mainly involves extracting and analyzing characteristics of electroencephalogram (EEG) (6, 11–13), heart rate variability (HRV) (5, 14, 15), electromyogram (EMG) (7, 16), etc., are considered as the most accurate and reliable ones to reflect the mental states. However, due to the inconvenience to wear, and various complicated algorithms, the real application of these techniques still remains a challenge. In contrast, eye metrics also offers a promising method for monitoring fatigue (17), including the percentage of eyelid closure (8, 18), blink-based (19) and pupil-based features (10, 20, 21) in an eyewear system. These eye-tracking data provide additional evidence for motivational disengagement, describing the effect of fatigue on attention and task performance (22). However, detection systems using a camera-based approach has a limitation of illumination, and most of those need computers, image processing algorithms and feature extraction techniques to extract drowsy symptoms (19). The effectiveness of pupillary light reflex (PLR) on the assessment of sleep deprivation was recently explored (23), suggesting that PLR variables might also be able to indicate fatigue. Automated pupillometry, which has been utilized in different clinical settings (24, 25), enables to provide several accurate and reliable parameters with respect to pupil size and PLR (26, 27). To date, no study has been conducted to analyze the association between PLR variations with driving fatigue.
Our aim was to investigate the effectiveness of quantitative PLR on driving fatigue detection, as well as the possible detection performances of a combination of PLR and HRV, which may very likely promote the further development of a driving fatigue detection system in the future.
Materials and Methods
Study Population
We conducted a single center, prospective, observational diagnostic study using a volunteer sample between November, 2020, to April, 2021. Thirty-two healthy postgraduate students from Zhejiang University School of Medicine in China voluntarily participated in our study, among whom 20 were male. All participants held valid driving license of more than 2 years, with at least half of a year driving experience, had regular sleep pattern, normal or corrected to normal vision and no history of any psychiatric disorder. All participants were asked to follow the below requirements before the tests: (1) refrain from alcohol, caffeine and tea within 12 h; (2) adequate sleep (almost 6~8 h) the day before the experiment; (3) wash the hair within 24 h. The study was approved by the ethics committee of Second Affiliated Hospital of Zhejiang University School of Medicine (approval number: 2020-893). Informed written consent and training were provided prior to entering the experiment.
Driving Fatigue Induction
Among all recruited participants, a 90 min monotonous simulated driving task was conducted in a darkened room, involving in a simple driving simulator (Nanjing Shengguan Jinbang Electronic Technology, China). A straight and monotonous route with low traffic density was designed in advance. The performance method in the simulator was the same as that in a real car. The visual display of the driving simulated environment was a 14-inch liquid crystal display at 80 cm in the front of the subjects' eyes. Current speed and car gear were showed on the screen, and the engine noises as well as nearby traffic noises were provided. During the driving task, the subjects were asked to restrict all unnecessary movements and drive in the center of the road, maintaining a constant speed between 70 and 90 km/h.
The experiment started between 9:00 and 11:00 a. m. or 3:00 and 5:00 p. m. for every subject to minimize the effect of circadian variance. After 10 min of rest, 3 min of HRV were recorded, which was regarded as the baseline data (T0). Meanwhile, subjective assessments and pupillary measurements were taken. In order to evaluate fatigue level over the course of the experiment, the task was divided into three 30-min sections. When each section was completed, the HRV and PLR data were recorded. Meanwhile, subjective ratings were performed. The flowchart of the study was shown in Figure 1.
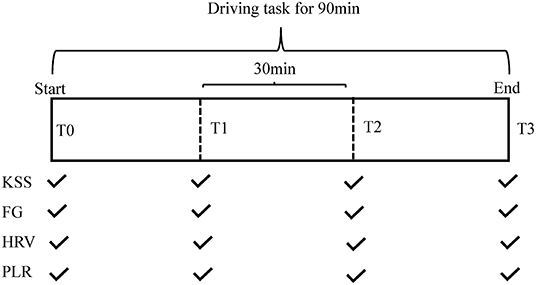
Figure 1. Schematic diagram for the entire experimental framework. FG, fatigue grade; HRV, heart rate variability; KSS, Karolinska Sleepiness Scale; PLR, pupillary light reflex.
Subjective Assessments
Subjects completed the Karolinska Sleepiness Scale (KSS) (28), which is a nine-point scale for assessing sleepiness with responses ranging from extremely alert (1) to very sleepy (9). Driving fatigue was defined as KSS ≥ 7. Fatigue Grade (FG) scale, which is a five-point scale designed by our team with responses ranging from no fatigue (0) to severe fatigue (5), was also completed.
Heart Rate Variability Data Acquisition
HRV was assessed with a protocol of 3 min sampling using the SA-3000P (Medi-core, Korea). Subjects were instructed to stay with eyes open, be silent, and breath normally during measurement. Standard deviation of the NN intervals (SDNN) and frequency domain indicators including low frequency (LF, 0.04~0.15 Hz), high frequency (HF, 0.15~0.4 Hz), normalized LF (LFnu), normalized HF (HFnu), LF/HF ratio were measured and showed automatically on the screen. The SDNN, LFnu, HFnu, and LF/HF were collected for further analysis.
Pupillary Light Reflex Data Acquisition
PLR were measured using the PLR-3000 pupillometer (NeurOptics, CA, USA). It was performed with a rubber cup covering the measured eye and the subject's hand covering the non-measured eye. A flash of visible white light with a duration of 0.8 s and a pulse intensity of 120 μW was delivered to induce a pupillary reflex, and repeated video images at more than 30 frames/s were stored for 3.21 s. The device provided with maximum and minimum pupil size (Max and Min), constriction percentage (%PLR), latency (LAT), constriction and dilation velocity (CV and DV), and T75. PLR measurement was performed on each eye for a series of three stimuli, then the data was averaged, producing one PLR data point for each subject. Maintaining eye opening during the recording was encouraged, but if interrupted, the test would be repeated after 5 s rest.
Statistical Analysis
Normal distribution was confirmed with the Kolmogorov–Smirnov test. For normally or non-normally distributed continuous variables, results are given as mean ± SD or median (IQR), respectively. Repeated measures analysis of variance or Friedman test was used to test the variability of different approaches. When the main effect was significant, a post-hoc analysis with Bonferroni correction was conducted. Correlations were determined by Spearman analysis. Considering the between-subject differences at baseline, differences between the baseline and the measurement at each time point were utilized to conduct the Spearman's correlation. Due to there are a total of 24 correlational analyses and the P-values have to be adjusted for the number of tests, P < 0.002 (0.05/24) of two-sided was considered to be significant. Detective performances of each indicator and the combination of two indicators were analyzed by calculating specificity, sensitivity, and the area under the receiver operating characteristic curve (AUC). P < 0.05 of two-sided was considered to be significant. All analyses were performed using Prism software (version 7.0; GraphPad, USA) and Medcalc software (version 19.0; Belgium).
Results
Subjective Rating Results and Behavioral Performances
The subjects' mean ± SD age was 25.5 ± 3.1 years, sleeping hours in the past 24 h were 7.4 ± 0.9 h, driving experience was 4.3 ± 1.9 years. To test whether our fatigue model was successful, we analyzed the subjective fatigue ratings and behavioral performances. Compared to the beginning of the experiment, we found significantly higher fatigue scores after the experiment [KSS: T0: 3 (2–4), T1: 5 (4–6) a, T2: 6 (5.25–7) ab vs. T3: 7 (6–8) ab, P < 0.001; FG scale: T0: 0, T1: 0 (0–1) a, T2: 2 (1.25–3) a vs. T3: 3 (2.25–4) abc, P < 0.001]. Additionally, the number of accidents increased significantly from the beginning to the end of the driving task [T0: 0, T1: 1 (0–1), T2: 1 a vs. T3: 2 (2, 3) abc, P < 0.001], indicating that the manipulation was successful (note: aP < 0.05 vs. T0; bP < 0.05 vs. T1; cP < 0.05 vs. T2).
Fluctuations of Heart Rate Variability
Significant differences in HRV indicators between the first and last section of driving task were observed. Mean SDNN increased across long-term driving (T0: 39.04 ± 12.33 ms, T1: 50.60 ± 16.63 ms a, T2: 56.43 ± 17.41 ms ab vs. T3: 63.34 ± 19.00 ms abc, P < 0.001, Figure 2A). The mean power of HRV in LFnu and LF/HF also significantly increased in a linear fashion [LFnu: T0: 51.96 ± 16.25 μV2, T1: 61.63 ± 17.51 μV2a, T2: 68.58 ± 19.24 μV2ab vs. T3: 72.12 ± 18.16 μV2abc; LF/HF: T0: 1.23 (0.68–1.70), T1: 1.91 (0.97–3.19) a, T2: 2.63 (1.06–4.66) a vs. T3: 3.29 (1.49–7.57) ab; both P < 0.001, Figures 2B,C], while there was a mild decline in the mean power of HRV in HFnu, from T0: 44.99 (37.06–59.92) μV2, T1: 35.68 (23.81–51.24) μV2, T2: 29.05 (16.24–49.71) μV2a to T3: 22.94 (11.46–44.15) μV2a (P < 0.001, see Figure 2D) (note: aP < 0.05 vs. T0; bP < 0.05 vs. T1; cP < 0.05 vs. T2).
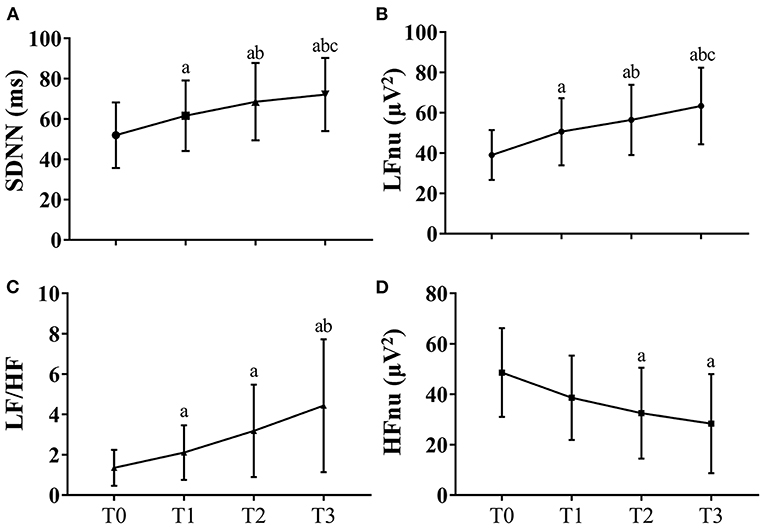
Figure 2. HRV fluctuations during the driving task for all participants. Due to missing data of HRV of two participants, the data at these two timepoints were the results of data analysis of 30 participants. The error bars in this figure represent mean ± SD. (A) The variations of SDNN for HRV. (B) The variations of LFnu for HRV results. (C) The variations of LF/HF for HRV results. (D) The variations of HFnu for HRV. HF indicates high frequency; HFnu, normalization of HF power by the formula: HF / (LF + HF) * 100; HRV, heart rate variability; KSS, Karolinska Sleepiness Scale; LF, low frequency; LFnu, normalization of LF power by the formula: LF / (LF + HF) * 100; SDNN, standard deviation of the NN intervals. aP < 0.05 vs. T0; bP < 0.05 vs. T1; cP < 0.05 vs. T2.
Variations of Quantitative Pupillary Light Reflex
With the increase of driving hours, Min significantly decreased and %PLR increased (Min: T0: 4.40 ± 0.7 mm, T1: 4.20 ± 0.7 mm a, T2: 4.08 ± 0.7 ab vs. T3: 3.99 ± 0.6 mm ab; %PLR: T0: 36.1 ± 4.6 %, T1: 37.4 ± 4.2 % a, T2: 38.9 ± 4.6 % ab vs. T3: 39.7 ± 3.8 % ab; both P < 0.001, Table 1). Similarly, significant increases in ACV and MCV were also observed with the increase of the driving hours (ACV: T0: 3.20 ± 0.43 mm/s, T1: 3.34 ± 0.46 mm/s a, T2: 3.50 ± 0.44 mm/s ab vs. T3: 3.68 ± 0.47 mm/s abc; MCV: T0: 5.19 ± 0.74 mm/s, T1: 5.53 ± 0.75 mm/s a, T2: 5.72 ± 0.74 mm/s ab vs. T3: 5.90 ± 0.71 mm/s ab; both P < 0.001, Table 1). However, the differences in Max, Lat, ADV and T75 were not statistically significant at different timepoints (note: aP < 0.05 vs. T0; bP < 0.05 vs. T1; cP < 0.05 vs. T2).
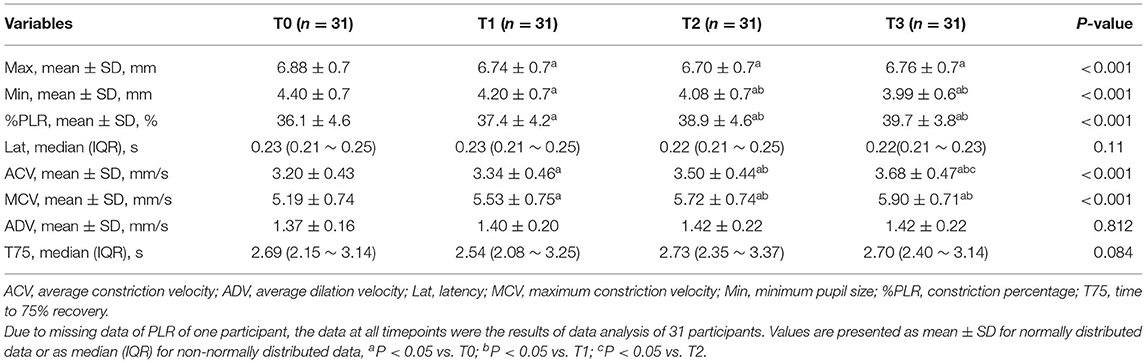
Table 1. The results of PLR for both eyes through the whole process of driving task.
Correlation Analysis Between Different Methods
Due to the missing data of PLR of one participant and missing data of HRV of two participants, there were a total of 31 and 30 values for deprived PLR and HRV parameters for correlation analysis at each timepoint. Change in KSS (ΔKSS) were not correlated with the change in PLR parameters at T1 and T2 (all P > 0.002, Figures 3A–H). Change in KSS (ΔKSS) was moderately correlated with the change in Min (ΔMin), %PLR (Δ%PLR) and ACV(ΔACV) (r = −0.66, 0.60, 0.55, all P < 0.001, Figures 3I–K) at T3. Similarly, ΔKSS was highly correlated with the change in SDNN (ΔSDNN) at T1 and T2 (r = 0.71 and 0.72, both P < 0.001, Figures 4A,E), and moderately correlated with change in LFnu (ΔLF) at T1 (r = 0.65, P < 0.001, Figure 4B). However, ΔKSS was not correlated with change in LF/HF (ΔLF/HF) and HF (ΔHF) at T1 (Figures 4C,D), ΔLF, ΔLF/HF and ΔHF at T2 (Figures 4F–H), change in all HRV parameters at T3 (Figures 4I–L)
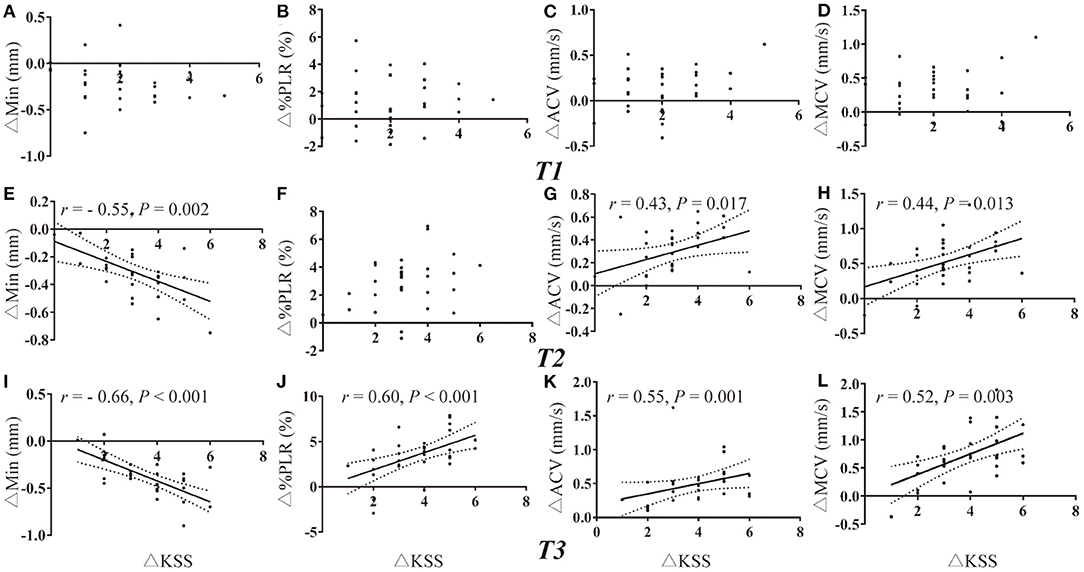
Figure 3. Correlations of PLR variations with the change in KSS. (A–D) Correlation of ΔKSS with the change in PLR parameters at T1. (E–H) Correlation of ΔKSS with the change in PLR parameters at T2. (I–L) Correlation of ΔKSS with the change in PLR parameters at T3. ACV, average constriction velocity; KSS, Karolinska Sleepiness Scale; MCV, maximum constriction velocity; Min, minimum pupil size; %PLR, constriction percentage; Δ, differences in all variables from baseline to the measurement at each timepoint.
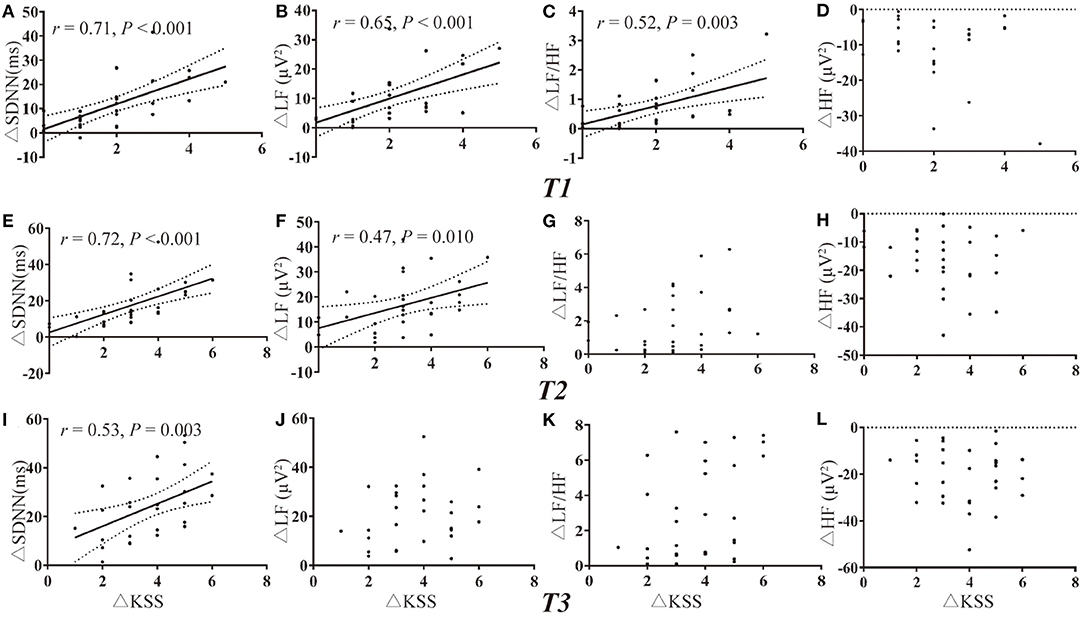
Figure 4. Correlations of HRV variations with the change in KSS. (A–D) Correlation of ΔKSS with the change in HRV parameters at T1. (E–H) Correlation of ΔKSS with the change in HRV parameters at T2. (I–L) Correlation of ΔKSS with the change in HRV parameters at T3. HF indicates high frequency; HFnu, normalization of HF power by the formula: HF / (LF + HF) * 100; HRV, heart rate variability; KSS, Karolinska Sleepiness Scale; LF, low frequency; LFnu, normalization of LF power by the formula: LF / (LF + HF) * 100; SDNN, standard deviation of the NN intervals; Δ, differences in all variables from baseline to the measurement at each timepoint.
Performance of Pupil Light Reflex and Heart Rate Variability Variations in Driver Fatigue Detection
ROC analysis showed that both PLR and HRV variations had a significant discriminatory power to detect driver fatigue (Table 2), which was defined as KSS more than seven in the present study. The Youden index identified a ΔMCV cut-off of 0.43 mm/s for driving fatigue detection with a sensitivity of 85.00% and a specificity of 72.34% (AUC = 0.835, P < 0.001, Figure 5A). Similarly, best cut-off of ΔSDNN was > 13.01 ms, with an AUC of 0.805 (P < 0.001, sensitivity 85.00%, specificity 63.83%, Figure 5B). A combination of ΔMCV and ΔSDNN achieved an AUC of 0.872 (P < 0.001, sensitivity 82.50%, specificity 78.72%), yet no significant differences were found among the performances of ΔMCV, ΔSDNN and their combination (all P > 0.05, Delong test).
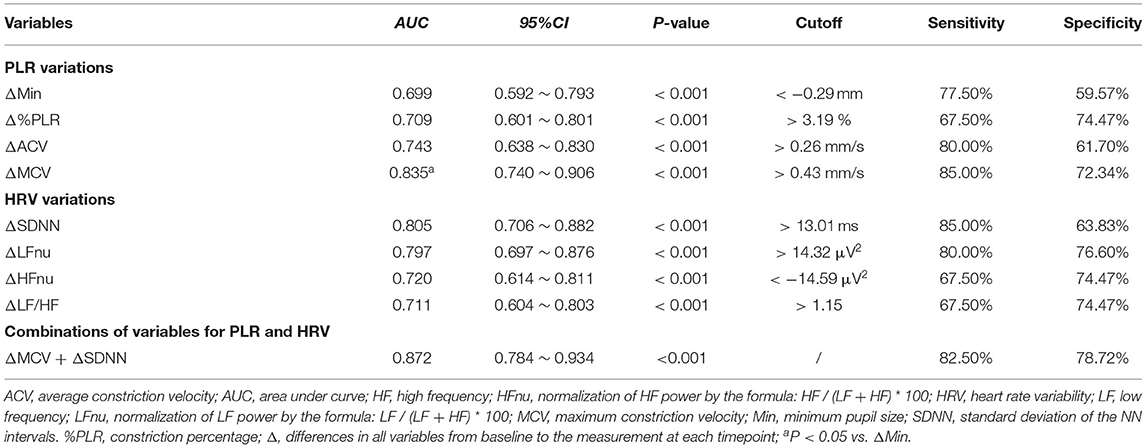
Table 2. The characteristics of ROC curves.
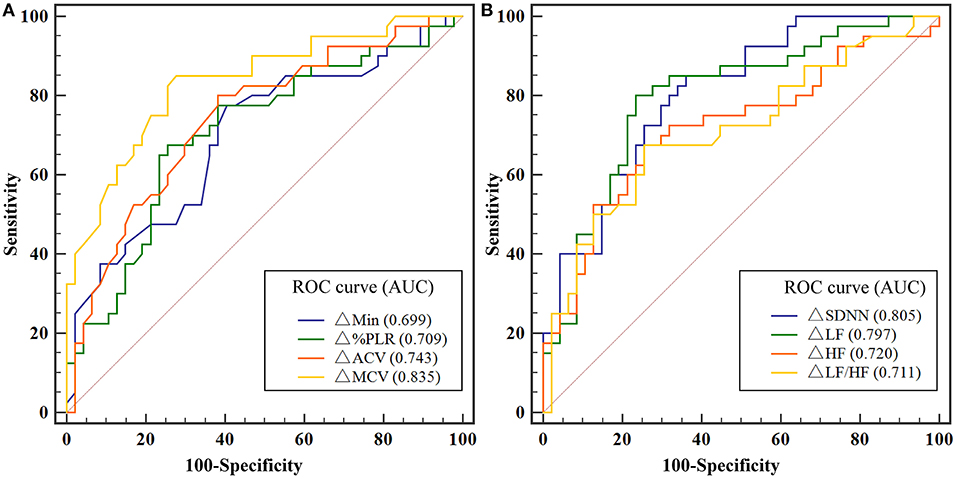
Figure 5. (A) ROC analysis for the detection of driving fatigue with PLR variations. (B) ROC analysis for the detection of driving fatigue with HRV variations. Due to missing data of HRV of two participants, and missing data of PLR of one participant, the data of 29 participants were used for ROC analysis. ACV, average constriction velocity; AUC, area under the curve; Min, minimum pupil size; HF indicates high frequency; HFnu, normalization of HF power by the formula: HF / (LF + HF) * 100; HRV, heart rate variability; KSS, Karolinska Sleepiness Scale; LF, low frequency; LFnu, normalization of LF power by the formula: LF / (LF + HF) * 100; MCV, maximum constriction velocity; ROC, receiver operating characteristic curve; SDNN, standard deviation of the NN intervals; %PLR, constriction percentage; Δ, differences in all variables from baseline to the measurement at each timepoint.
Discussion
This study investigated the effectiveness of pupillary light reflex and heart rate variability in driving fatigue detection. The findings are as follows: (1) significant increases in several variables of PLR and HRV were observed at fatigue state; (2) the variations of PLR and HRV showed significant relevance with the change in KSS; (3) PLR variations had excellent ability to detect driving fatigue, with a comparative performance with HRV or a combination of PLR and HRV.
In our study, a simple driving simulator was applied to induce driving fatigue. For safety reasons, experimental tests for the fatigue detection are often conducted on driving simulators in a controlled environment. Previous literature suggested that driving fatigue could occur in a monotonous driving environment with a duration of 90 min (3, 13, 14). Among many endogenous factors, time-on-task and high workload accumulate mental fatigue, while the sleep-related causal factors worsen sleepiness (29). In our study, all participants were asked to refrain from alcohol, caffeine and tea within 12 h and obtain adequate sleep (almost 6~8 h) the day before the experiment to avoid the sleep-related causal factors. Then, based on the increased scores of subjective ratings and deteriorated driving performances of subjects, a conclusion could be drawn that a 90-min driving task successfully induced driving fatigue.
It has been indicated that HRV is the most sensitive index assessing the regulation between sympathetic and parasympathetic nervous systems (15). An increase in SDNN, LFnu, LF/HF ratio, and a decrease in HFnu in this study corroborates earlier findings (14). The results implied that the dominating activity turned from parasympathetic to sympathetic activity. In the first section, without obvious fatigue, sympathetic activity increased due to the task of simulated driving. With fatigue increased and performance deteriorated, participants counteracted the sleep demand by trying to stay awake to complete the task, resulting in consistent sympathetic activation.
Most importantly, significant differences of pupillary parameters between different periods of task were found. For the automated pupillometer, %PLR depends on the intensity and duration of the stimulus (30), while CV are related to reflex amplitude except in cases of unusual pupillary syndromes (30). With identical intensities and durations of all stimuli in our study, the PLR variations were associated with the occurrence of fatigue. Sympathetic and parasympathetic fibers dictate the pupil diameter to contract or dilate by balanced activation of the dilator and sphincter pupillae muscles in changing the light exposures toward the eyes (17). When fatigued, sympathetic activity would increase, with greater contraction in a shorter time to respond to the light stimulus, which might explain the variations of PLR. In addition, the measurements reported were not independent. As the parameters of Max and Lat were unchanged across the four measurements, the increase in the %PLR would result in an increase in velocity.
To validate the effectiveness of HRV and PLR variations on driving fatigue detection, significant correlations were found between these two methods with KSS. ROC analysis also showed PLR variations achieved high AUCs for driver fatigue detection, with high sensitivities and specificities, a comparative performance with HRV variations. However, a combination of PLR and HRV variations did not significantly increase the performance, suggesting that PLR variations, especially ΔMCV, could be potential indicators of driving fatigue in the future.
So far, no reliable commercialized driving fatigue detection system has been developed. The technology used in the present study lays a good foundation for the later development of such a detection system. It is expected that the system will be reliable, portable, sensitive and convenient to control, and can be applied to a variety of scenarios.
This study also has several limitations. As a preliminary study to determine the effectiveness of automated pupillometry to detect driving fatigue, a uniform sample who were all medical postgraduates with a fixed age, and a small sample size recruited from a single institution, are potential limitations. Then, limited degree of fatigue existed in the present fatigue model, the results in a more fatigued state remain unknown. Thirdly, an intervention outcome is not compared to a suitable control group that undergoes a different experience to assess effects of passage of time. Last, considering individual differences in pupil measures, thresholds for pupillary variables should be further validated through a large-scale, randomized, controlled trial in the future.
Pupillary light reflex variation may be a potential indicator in the detection of driving fatigue, achieving a comparative performance compared with the combination with heart rate variability. Further work may be involved in developing a commercialized driving fatigue detection system based on pupillary parameters.
Data Availability Statement
The raw data supporting the conclusions of this article will be made available by the authors, without undue reservation.
Ethics Statement
Approval for the study was obtained from the Ethics Committee of Second Affiliated Hospital of Zhejiang University School of Medicine (approval number: 2020-893). The patients/participants provided their written informed consent to participate in this study.
Author Contributions
MZ and ZL designed the study. LS, LZ, DJ, and QZ performed the experiment. LS carried out statistical analyses and drafted the manuscript. MZ and LZ revised the manuscript for important intellectual content. All authors interpreted the study results and contributed with manuscript revisions.
Funding
This research was supported by the Zhejiang Provincial Key Research and Development Program of China (2021C03073).
Conflict of Interest
The authors declare that the research was conducted in the absence of any commercial or financial relationships that could be construed as a potential conflict of interest.
Publisher's Note
All claims expressed in this article are solely those of the authors and do not necessarily represent those of their affiliated organizations, or those of the publisher, the editors and the reviewers. Any product that may be evaluated in this article, or claim that may be made by its manufacturer, is not guaranteed or endorsed by the publisher.
Abbreviations
ACV, average constriction velocity; ADV, average dilation velocity; AUC, area under curve; HF, high frequency; HFnu, normalization of HF power by the formula: HF / (LF + HF) * 100; HRV, heart rate variability; LF, low frequency; LFnu, normalization of LF power by the formula: LF / (LF + HF) * 100; Lat, latency; Max, maximum pupil size; MCV, maximum constriction velocity; Min, minimum pupil size; %PLR, constriction percentage; SDNN, standard deviation of the NN intervals; T75, time to 75% recovery; Δ, differences in all variables from baseline to the measurement at each timepoint.
References
1. Organization WH. Global Status Report on Road Safety 2018. (2018). Available online at: https://www.who.int/publications/i/item/9789241565684 (accessed June 17, 2018).
2. Zhang GN, Yau KKW, Zhang X, Li YY. Traffic accidents involving fatigue driving and their extent of casualties. Accident Anal Prev. (2016) 87:34–42. doi: 10.1016/j.aap.2015.10.033
3. Gharagozlou F, Nasl Saraji G, Mazloumi A, Nahvi A, Motie Nasrabadi A, Rahimi Foroushani A, et al. Detecting driver mental fatigue based on EEG alpha power changes during simulated driving. Iran J Public Health. (2015) 44:1693–700.
4. Li ZJ, Li SE, Li RJ, Cheng B, Shi JL. Online detection of driver fatigue using steering wheel angles for real driving conditions. Sensors-Basel. (2017) 17:495. doi: 10.3390/s17030495
5. Fujiwara K, Abe E, Kamata K, Nakayama C, Suzuki Y, Yamakawa T, et al. Heart rate variability-based driver drowsiness detection and its validation with EEG. IEEE Trans Biomed Eng. (2019) 66:1769–78. doi: 10.1109/TBME.2018.2879346
6. Stancin I, Cifrek M, Jovic A. A review of EEG signal features and their application in driver drowsiness detection systems. Sensors-Basel. (2021) 21:3786. doi: 10.3390/s21113786
7. Fu RR, Wang H. Detection of driving fatigue by using noncontact EMG and ECG signals measurement system. Int J Neural Syst. (2014) 24:1450006. doi: 10.1142/S0129065714500063
8. Lin L, Huang C, Ni X, Wang J, Zhang H, Li X, et al. Driver fatigue detection based on eye state. Technol Health Care. (2015) 23(Suppl 2):S453–63. doi: 10.3233/THC-150982
9. Michail E, Kokonozi A, Chouvarda I, Maglaveras N. EEG and HRV markers of sleepiness and loss of control during car driving. Conf Proc IEEE Eng Med Biol Soc. (2008) 2008:2566–9. doi: 10.1109/IEMBS.2008.4649724
10. Xu J, Min J, Hu J. Real-time eye tracking for the assessment of driver fatigue. Healthc Technol Lett. (2018) 5:54–8. doi: 10.1049/htl.2017.0020
11. Ma YL, Chen B, Li RH, Wang CS, Wang J, She QS, et al. Driving fatigue detection from EEG using a modified PCANet method. Comput Intel Neurosc. (2019) 2019:4721863. doi: 10.1155/2019/4721863
12. Liu XC, Li G, Wang SJ, Wan F, Sun Y, Wang HT, et al. Toward practical driving fatigue detection using three frontal EEG channels: a proof-of-concept study. Physiol Meas. (2021) 42:044003. doi: 10.1088/1361-6579/abf336
13. Craig A, Tran Y, Wijesuriya N, Nguyen H. Regional brain wave activity changes associated with fatigue. Psychophysiology. (2012) 49:574–82. doi: 10.1111/j.1469-8986.2011.01329.x
14. Zhao C, Zhao M, Liu J, Zheng C. Electroencephalogram and electrocardiograph assessment of mental fatigue in a driving simulator. Accid Anal Prev. (2012) 45:83–90. doi: 10.1016/j.aap.2011.11.019
15. Vicente J, Laguna P, Bartra A, Bailon R. Drowsiness detection using heart rate variability. Med Biol Eng Comput. (2016) 54:927–37. doi: 10.1007/s11517-015-1448-7
16. Khushaba RN, Kodagoda S, Liu D, Dissanayake G. Muscle computer interfaces for driver distraction reduction. Comput Methods Programs Biomed. (2013) 110:137–49. doi: 10.1016/j.cmpb.2012.11.002
17. Marandi RZ, Madeleine P, Omland O, Vuillerme N, Samani A. Reliability of oculometrics during a mentally demanding task in young and old adults. IEEE Access. (2018) 6:17500–17. doi: 10.1109/ACCESS.2018.2819211
18. Mckinley RA, Mcintire LK, Schmidt R, Repperger DW, Caldwell JA. Evaluation of eye metrics as a detector of fatigue. Hum Factors. (2011) 53:403–14. doi: 10.1177/0018720811411297
19. Ma'touq J, Al-Nabulsi J, Al-Kazwini A, Baniyassien A, Al-Haj Issa G, Mohammad H. Eye blinking-based method for detecting driver drowsiness. J Med Eng Technol. (2014) 38:416–9. doi: 10.3109/03091902.2014.968679
20. Hopstaken JF, Van Der Linden D, Bakker AB, Kompier MA. The window of my eyes: Task disengagement and mental fatigue covary with pupil dynamics. Biol Psychol. (2015) 110:100–6. doi: 10.1016/j.biopsycho.2015.06.013
21. Van Den Brink RL, Murphy PR, Nieuwenhuis S. Pupil diameter tracks lapses of attention. PLoS ONE. (2016) 11:e0165274. doi: 10.1371/journal.pone.0165274
22. Hopstaken JF, Van Der Linden D, Bakker AB, Kompier MaJ, Leung YK. Shifts in attention during mental fatigue: evidence from subjective, behavioral, physiological, and eye-tracking data. J Exp Psychol Hum Percept Perform. (2016) 42:878–89. doi: 10.1037/xhp0000189
23. Rozanowski K, Bernat M, Kaminska A. Estimation of operators' fatigue using optical methods for determination of pupil activity. Int J Occup Med Environ Health. (2015) 28:263–81. doi: 10.13075/ijomeh.1896.00274
24. Phillips SS, Mueller CM, Nogueira RG, Khalifa YM. A systematic review assessing the current state of automated pupillometry in the NeuroICU. Neurocrit Care. (2019) 31:142–61. doi: 10.1007/s12028-018-0645-2
25. Morelli P, Oddo M, Ben-Hamouda N. Role of automated pupillometry in critically ill patients. Minerva Anestesiol. (2019) 85:995–1002. doi: 10.23736/S0375-9393.19.13437-2
26. Zhao W, Stutzman S, Daiwai O, Saju C, Wilson M, Aiyagari V. Inter-device reliability of the NPi-100 pupillometer. J Clin Neurosci. (2016) 33:79–82. doi: 10.1016/j.jocn.2016.01.039
27. Olson DM, Stutzman S, Saju C, Wilson M, Zhao W, Aiyagari V. Interrater reliability of pupillary assessments. Neurocrit Care. (2016) 24:251–7. doi: 10.1007/s12028-015-0182-1
28. Knauss M, Bonner CL, Patka J, Abraham P. Evaluation of pharmacy resident alertness in an overnight on-call program. Am J Health Syst Pharm. (2015) 72:1215–20. doi: 10.2146/ajhp140338
29. Hu X, Lodewijks G. Detecting fatigue in car drivers and aircraft pilots by using non-invasive measures: the value of differentiation of sleepiness and mental fatigue. J Safety Res. (2020) 72:173–87. doi: 10.1016/j.jsr.2019.12.015
Keywords: driving fatigue, traffic safety, pupillary light reflex (PLR), heart rate variability, automated pupillometry
Citation: Shi L, Zheng L, Jin D, Lin Z, Zhang Q and Zhang M (2022) Assessment of Combination of Automated Pupillometry and Heart Rate Variability to Detect Driving Fatigue. Front. Public Health 10:828428. doi: 10.3389/fpubh.2022.828428
Received: 03 December 2021; Accepted: 24 January 2022;
Published: 21 February 2022.
Edited by:
Somayeh Farhang Dehghan, Shahid Beheshti University of Medical Sciences, IranReviewed by:
Yonggang Wang, Chang'an University, ChinaScott O. Murray, University of Washington, United States
Copyright © 2022 Shi, Zheng, Jin, Lin, Zhang and Zhang. This is an open-access article distributed under the terms of the Creative Commons Attribution License (CC BY). The use, distribution or reproduction in other forums is permitted, provided the original author(s) and the copyright owner(s) are credited and that the original publication in this journal is cited, in accordance with accepted academic practice. No use, distribution or reproduction is permitted which does not comply with these terms.
*Correspondence: Mao Zhang, ejJqemtAemp1LmVkdS5jbg==