 Lu Yang
 Song Hong1*
 Chao He
94% of researchers rate our articles as excellent or good
Learn more about the work of our research integrity team to safeguard the quality of each article we publish.
Find out more
ORIGINAL RESEARCH article
Front. Public Health , 11 April 2022
Sec. Environmental Health and Exposome
Volume 10 - 2022 | https://doi.org/10.3389/fpubh.2022.810098
Fine particulate matter (PM2.5) poses threat to human health in China, particularly in winter. The pandemic of coronavirus disease 2019 (COVID-19) led to a series of strict control measures in Chinese cities, resulting in a short-term significant improvement in air quality. This is a perfect case to explore driving factors affecting the PM2.5 distributions in Chinese cities, thus helping form better policies for future PM2.5 mitigation. Based on panel data of 332 cities, we analyzed the function of natural and anthropogenic factors to PM2.5 pollution by applying the geographically and temporally weighted regression (GTWR) model. We found that the PM2.5 concentration of 84.3% of cities decreased after lockdown. Spatially, in the winter of 2020, cities with high PM2.5 concentrations were mainly distributed in Northeast China, the North China Plain and the Tarim Basin. Higher temperature, wind speed and relative humidity were easier to promote haze pollution in northwest of the country, where enhanced surface pressure decreased PM2.5 concentrations. Furthermore, the intensity of trip activities (ITAs) had a significant positive effect on PM2.5 pollution in Northwest and Central China. The number of daily pollutant operating vents of key polluting enterprises in the industrial sector (VOI) in northern cities was positively correlated with the PM2.5 concentration; inversely, the number of daily pollutant operating vents of key polluting enterprises in the power sector (VOP) imposed a negative effect on the PM2.5 concentration in these regions. This work provides some implications for regional air quality improvement policies of Chinese cities in wintertime.
At the end of 2019, with the sudden outbreak of COVID-19 in China, a series of containment measures were implemented by the government to limit the spread of infection. On 25 January 2020, the first day of the Chinese New Year, all cities in mainland China except cities in Tibet launched the highest level of emergency response (http://www.nhc.gov.cn/). These measures brought a temporary halt on human activities (1), e.g., transportation (2), industrial production (3) and energy consumption (4). The air quality during COVID-19 in China became much better than that in the same period of previous years (5). Particularly, the concentration of fine particulate matter (PM2.5) decreased by 10.5% (6). Thus, the stagnation caused by this epidemic provides a typical case study for exploring the important driving factors of haze pollution in Chinese cities in winter. The government can use this information to take more effective policy intervention in the future, specifically when addressing air quality improvement (7).
Numerous papers have studied the key factors influencing PM2.5 concentrations, including anthropogenic and natural factors (8). Anthropogenic factors include vehicle usage (9), industrial production (10), energy consumption (11), and household activities (12). In particular, the transportation sector is recognized as the largest contributor to the emissions of anthropogenic pollutants in urban air quality (13, 14), as this sector consumes a considerable amount of primary and secondary energy sources (15, 16). Previous studies have found that reasonable control measures policies for public transit improvement could effectively reduce PM2.5 concentrations (17). Industrial pollution has been found to be another major cause of the regional high PM2.5 concentrations in China (18). Massive fossil fuel combustion in industrial production is a notable source of PM2.5 emissions in Chinese cities (19). In terms of natural factors, meteorological conditions can influence the secondary formation of particulate matter by changing the atmospheric diffusion dilution conditions and material transformation process, thus affecting the regional haze pollution (20). Therefore, it is necessary to consider meteorological factors when studying the influencing factors of haze pollution (21, 22), particularly in a short time (23).
A large and growing number of research is devoted to analyzing air quality dynamics and its underlying driving factors after the COVID-19 outbreak (24). Many studies have mainly combined observations of air pollutant concentrations by remote sensing (1, 25) and numerical weather prediction models (5, 26) to reflect real-time changes in air quality. The contributions from various emission sources or changes in weather conditions have been common focuses of previous studies. For instance, Wang et al. (27) and He et al. (28) employed statistical models to evaluate the influence of different driving factors on air quality during the epidemic period, which emphasized the significant influence of restrictive measures. Yin et al. (29) and Shen et al. (30) both emphasized the exceptional importance of climate variability in regional air quality in China and noted that unfavorable meteorological conditions greatly contributed to the increase in the local PM2.5 concentration. However, the impacts of natural and anthropogenic factors on PM2.5 concentrations are dynamic and comprehensive (31, 32). Remote sensing data cannot directly represent human activities. As the lack of real-time socioeconomic data, the contribution of anthropogenic factors to pollutant changes is hard to quantify in such a short time. Although some papers have explored the contributions of travel restrictions to atmospheric environmental change during this epidemic with meteorological factors as control variables (7, 33), these studies have ignored the dynamic effects of natural factors and other human-induced emission sources on the PM2.5 concentration. In addition, because the PM2.5 concentration varies with space and time (6), an analysis of spatiotemporal heterogeneities on the impacts of different factors is needed.
Thus, in this paper, we collected higher temporal resolution data that could reflect human activities, that is, PM2.5 observations, natural factors data and anthropogenic factors data were matched at the same spatial and temporal scale. By using daily monitoring data of PM2.5 concentrations, mobility, and operating vents in prefecture-level cities across China during the COVID-19 epidemic, we could comprehensively analyse the real-time impact of human activities and natural conditions on haze pollution. In addition, the geographically and temporally weighted regression (GTWR) model was adopted to quantitatively evaluate the spatiotemporal heterogeneous in the relevance between driving factors and PM2.5 in the short term. Therefore, we could distinguish the main driving factors that dominate the temporal and spatial distribution of PM2.5 concentration in different cities in winter, the season with the most severe haze. That could provide a reference for the local government to put forward more effective haze control policies.
In the winter from 2019 to 2020, COVID-19 broke out in China. On January 23 of 2020, Wuhan, as the first city where COVID-19 cases appeared, announced that the city would lockdown to stop virus transmission. People in this city were not allowed to leave and advocated to stay at home. With the spread of the virus, other cities in China have gradually taken lockdown measures. Under this measure, human activities were greatly restricted, including the slowdown in the production of enterprises and the significant reduction in the travel of residents. This special period provides an unprecedented case for studying the impact of human activities on air pollutants.
The univariate local Moran's I test was needed to assess spatial autocorrelation before we detected local agglomeration. The univariate local Moran's I index has been proven to be an effective tool for distinguishing the local spatial clusters, and it is calculated as shown in Equation (1):
Where Yi is the value of the target variable (PM2.5 concentration) of the i-th city, Yj represents the value of the PM2.5 concentration in other cities (j≠i), and denotes the average of the target variable. σ2 is the variance of the target variable. ωij is the spatial weight displaying the neighboring relations among the geographical units. In this research, we used GeoDa software to obtain the LISA for cities' PM2.5 concentrations before and after the COVID-19 outbreak.
Differentiated from the traditional time series model and spatial econometric model, the GTWR model can comprehensively consider the temporal correlation and the spatial characteristics (34), better capturing the spatial and temporal heterogeneity of statistical correlations among regression variables. The PM2.5 concentration may accompany spatial heterogeneity (35) and time-series relevance, particularly in the short term (36). We used this model to analyse the spatiotemporal heterogeneity of impacts of natural and anthropogenic factors on PM2.5 pollution.
Where Yi is the PM2.5 concentration of the i-th city, and Xik is the influencing factor of the i-th city on the k-th day, including natural and anthropogenic factors. (ui, vi, ti) denotes the i-th city's geographical position (ui, vi) and time location (ti). βk(ui, vi, ti) represent the coefficients of space-time observation sample i, which can be explained as the percentage of dependent variable (Y) change with 1% variation of the independent variable (X). εi is the random error term.
βk(ui, vi, ti) for variable k and spatiotemporal location i is examined by the following equation:
Where W(ui, vi, ti) is the spatiotemporal weight matrix estimated by the temporal and spatial distances and the decay functions. Therefore, the spatiotemporal weight for independent variable needs to be calculated before conducting this model analysis. The spatiotemporal distance dST could be split into spatial distance (dS) and temporal distance (dT), as shown in Equation (4):
Where λ and μ are scale factors to measure the impacts of the spatial and temporal distance in their respective metric systems. Then, the spatiotemporal distance dij between cities i and j is calculated by Equation (5):
Thus, the spatiotemporal weight (αij) can be obtained by using Equation (6):
Where bST represents the non-negative parameter of the spatiotemporal bandwidth. In this work, cross-validation via the minimum sum of the squared error [CVRSS(h)] was used to find the optimal spatiotemporal bandwidth (37).
Where ŷi(b) denotes the predicted value from the GTWR model, and the function is the sum of squared errors.
We applied the Kernel function to assess the stability of the correlation coefficients (18). The density function of the variable x is shown in Equation (8):
Where Xi is the coefficients subordinated to independent and identical distributions. n denotes the number of X. h is the bandwidth, and is mean value. The Epanechnikov function widely used by previous studies was adopted as the kernel function for estimation in this work.
Hourly observations of the PM2.5 concentrations at 1,672 monitoring sites in our study period were collected from the real-time monitoring data system of the China National Environmental Monitoring Center (CNEMC) (https://air.cnemc.cn:18007/). To ensure the continuity and reliability of the original data, we conducted strict data quality control on the hourly PM2.5 concentration data before analysis according to the provisions on the validity of air pollutant concentration data (GB 3095-2012) (https://www.mee.gov.cn/), and we removed abnormal data. The daily average of each site and then averaged these daily averages of sites in each city was calculated as the daily PM2.5 concentration of the city. Based on the data pre-processing, 332 cities were selected in this study to discuss regional changes in PM2.5 concentrations.
Four essential meteorological factors were selected to report the natural impacts on PM2.5, including surface pressure (sp, KPa), temperature (tem, K), relative humidity (rh, %), and wind speed (ws, m/s). In this work, rh was calculated by the dewpoint temperature (d2m) and temperature (t2m) based on the Clapeyron-Clausius equation. ws is the square root of the sum of the squares of the eastward component of the 10 m wind (u10) and the northward component of the 10 m wind (v10). The reanalysis dataset (ERA5-Land hourly data) for these data was obtained from the European Centre for Medium-Range Weather Forecasts (ECWMF) (https://www.ecmwf.int/). This reanalysis dataset is hourly 0.1 × 0.1 grid data. The city-scale meteorological data processing method is similar to that used for the PM2.5 concentrations.
In this study, we used the intensity of trip activities as an indicator to assess traffic flow at each site during the COVID-19 epidemic (7, 33, 38). This intensity of trip activities (ITAs), an exponential result of the ratio calculated by the number of people who travel in the city divided by the resident population in the city, can be used to measure the daily passenger traffic pressure on the urban transport system (https://qianxi.baidu.com/). Therefore, we applied this index to indirectly reflect the impact of human travel and lifestyle changes on PM2.5 concentration (39, 40).
Changes in industrial production affected by COVID-19 were characterized by the numbers of daily pollutant operating vents of key polluting enterprises in the industrial sector (VOI), which could reflect the dynamic change in industrial pollution intensity. The numbers of daily pollutant operating vents of key polluting enterprises in the power sector (VOP) were used to report the variation in energy consumption. The pollutant operating vents were the sum of the vent numbers of dust, nitrogen oxide (NOx) and sulphur dioxide (SO2). After the Spring Festival in 2020, under the strict implementation of epidemic control measures, the Chinese government announced that some essential enterprises could resume production with restrictions. We thus collected the daily pollutant operating vent numbers of more than 9,000 key polluting enterprises in China from January to February 2020 (http://www.ipe.org.cn/). These enterprises usually pose great environmental risks, such as a great quantity these air pollutants, and they are therefore screened by the environmental protection department of the local government based on the environmental quality improvement requirements of their respective administrative areas and other specified conditions (41). The key polluting enterprises in the power sector was screened according to the national economic industry classification (GB/T4754-2017). We searched each enterprise name and check the industry classification of the enterprise one by one. Moreover, combined with Google Maps, we have verified the spatial coordinates of enterprises point by point to ensure the accuracy of the number of enterprise vents in each city.
The descriptive statistics for each variable are presented in Table 1.
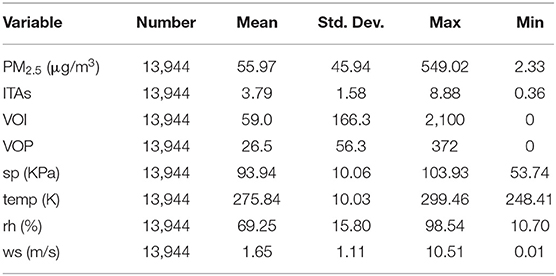
Table 1. The descriptive statistics for each variable.
The time-variation of daily PM2.5 concentrations in Chinese cities before and after lockdown measures were implemented are shown in Figure 1. Before the measures were taken, the daily average PM2.5 concentration reaching its minimum value (32.7 μg/m3) on Jan 8, rapidly returned to 60 μg/m3, and continued to fluctuate upward. In contrast, as cities in China gradually locked down, the daily average national PM2.5 concentrations showed a clear trend of first increasing and then decreasing, with the value declining to 30.9 μg/m3 on February 14. This tendency was consistent with the findings of Wang et al. (42).
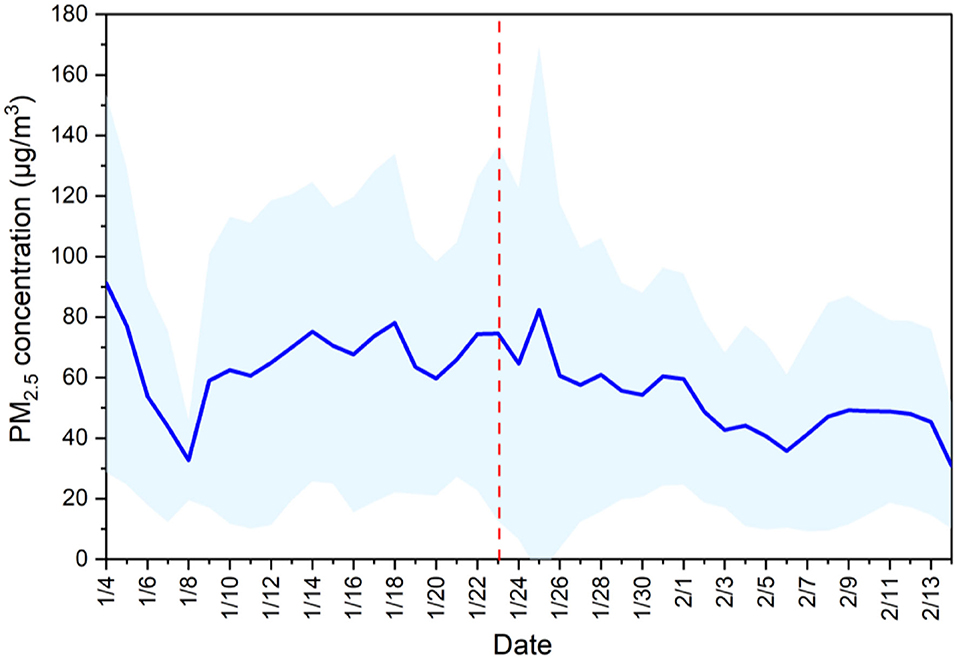
Figure 1. Time-variation in daily PM2.5 concentrations Chinese cities before and after lockdown measures were implemented in response to the outbreak of COVID-19. The red line represents the day that lockdown measures began in Wuhan, and shaded blue denote the standard deviations.
The daily average PM2.5 concentrations for cities before and after lockdown measures were taken presented diverse spatial distribution characteristics (Figure 2). In the absence of any measures to limit human activities, the 105 cities with higher PM2.5 concentrations, more than 75 μg/m3, were concentrated in Northeast China (Heilongjiang, Jilin and Liaoning Provinces), the North China Plain (Tianjin, Hebei, Shanxi, Henan, Shandong Provinces and northern Anhui Province), and the Tarim Basin (Xinjiang Province). Other areas with high PM2.5 concentrations (50–75μg/m3) were distributed around the regions with the highest concentrations. However, after cities gradually locked down, 84.3% of cities experienced a decline in PM2.5 concentration. The number of cities characterized by PM2.5 concentrations higher than 75 μg/m3 was significantly reduced, decreasing by 34.2%. Similar to the period before measures were taken, cities with high PM2.5 concentrations were concentrated in Northeast China, the North China Plain and Xinjiang Province. Moreover, haze pollution was improved in 30 cities, with PM2.5 concentrations <37.5 μg/m3. These cities were mainly distributed in the southern coastal areas.
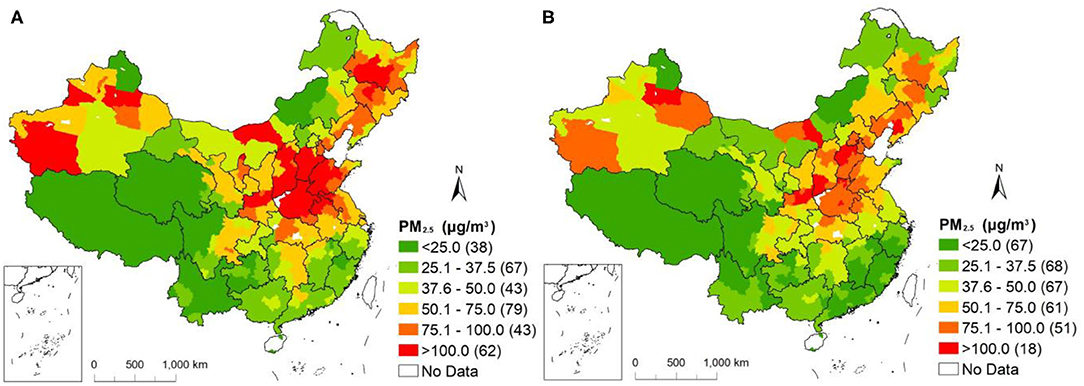
Figure 2. Distributions of daily PM2.5 concentrations in Chinese cities before (A) and after (B) lockdown measures taken in response to the outbreak of COVID-19.
We further conducted a local Moran's I test (Figure 3) to identify the spatial clustering characteristics of the PM2.5 concentration. During our study period, cities' daily PM2.5 concentrations presented an appearance of regional convergence, mainly marked by a high-high group and a low-low group. When human activities were not limited, the high-high group occurred in Northeast China, the North China Plain, and the Tarim Basin, which indicated that the PM2.5 pollution in these regions was more serious and that the positive local spatial autocorrelation of PM2.5 existed in these cities. Cities with low PM2.5 concentrations were mainly distributed in Xizang, Qinghai, Sichuan, Yunnan, Guizhou, and Fujian Provinces, suggesting that the haze pollution in these areas was relatively light. The local spatial autocorrelation of haze pollution also existed in these places but the correlation was weak. However, after lockdown measures were taken, the club-convergence phenomenon became more obvious, with the high-high cluster in Northeast China shifting to the south. The regions characterized by the low-low cluster in Northwest China shrank, while the regions in Southwest China expanded to Guangdong Province.
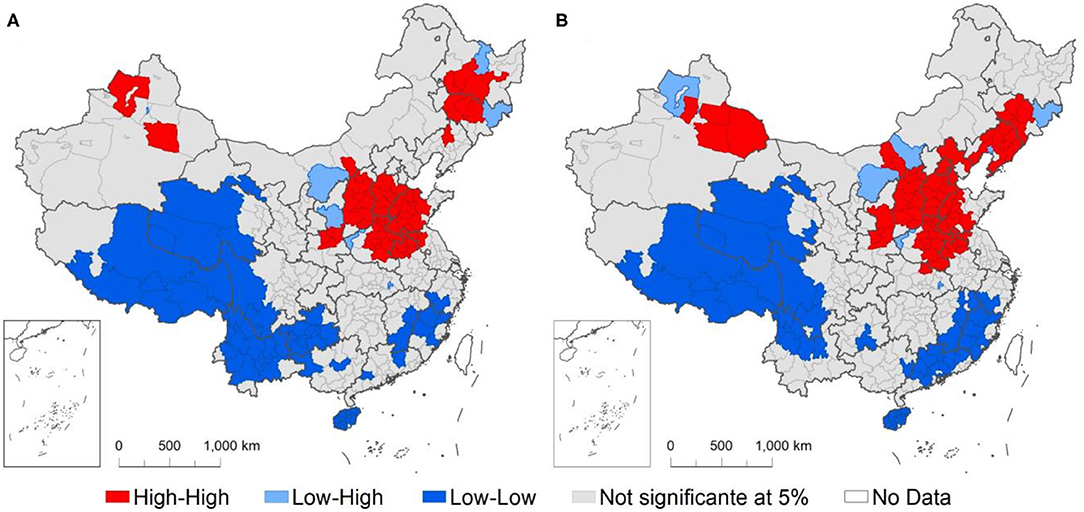
Figure 3. The univariate Local Moran's I for PM2.5 concentrations in Chinese cities before (A) and after (B) lockdown measures were taken in response to the outbreak of COVID-19.
The GTWR model was employed to calculated the influence of selected factors on cities' haze pollution in this study, and the parameters of the model are displayed in Table 2. In the simulation results of the model, the R2 value was 0.403, the adjusted R2 was 0.402, the bandwidth value was 0.115, the sigma value was 0.259, the CV value was 808.202 and the spatiotemporal distance ratio was 1.000.
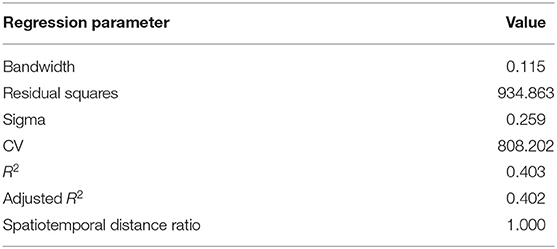
Table 2. Regression parameters of the GTWR model.
From the Kernel distribution of coefficients of different variables (Figure 4), we can see that the coefficients of ITAs, VOI and VOP were concentrated at approximately 0.50,−0.01, and 1.40, respectively. This result indicates that in most cities, the increase in ITAs and VOP had a promotion effect on haze pollution in the winter of 2020, while the increase in VOI had the opposite effect. Among the four natural factors we analyzed, the largest density of coefficients of sp was distributed at 0.25, which illustrates that with the increase in sp, PM2.5 concentrations in most cities were promoted. In contrast, the coefficients of rh, tem and ws were left-distributed, and the peaks emerged at approximately−0.08,−1.25, and−0.25, respectively, revealing that the increase in rh, tem and wind would restrain the raise of PM2.5 concentration in most cities during our study period.
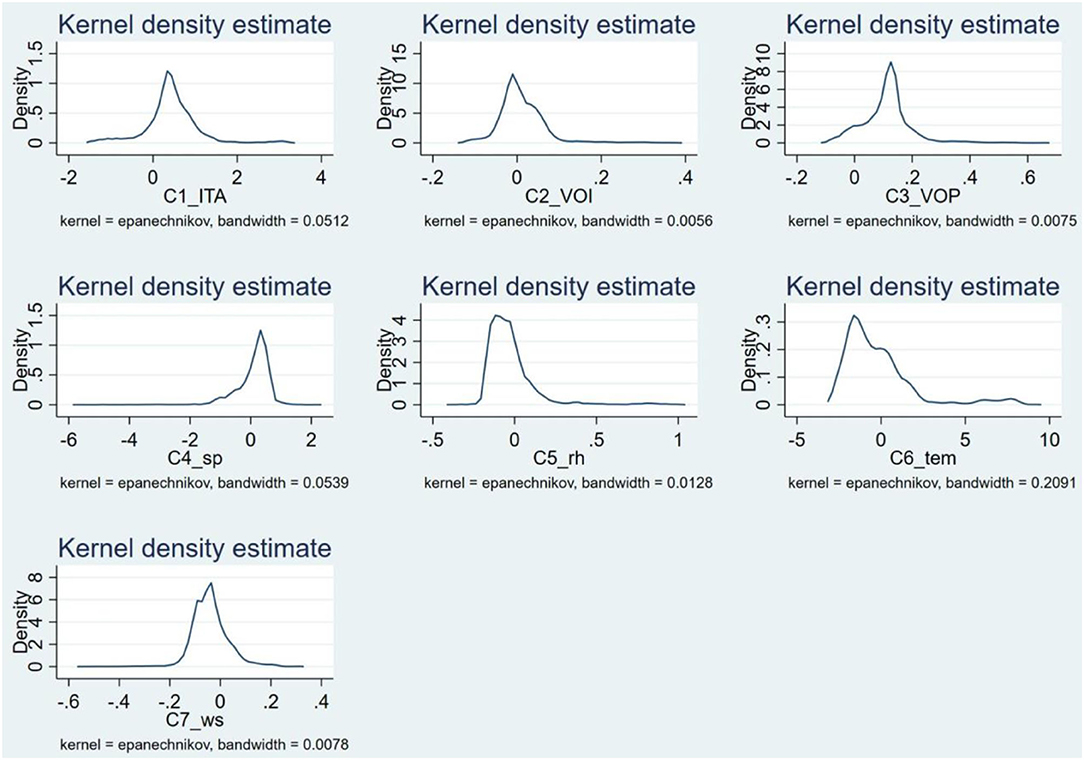
Figure 4. Kernel density distribution of each variable coefficient.
The surface pressure (sp) coefficients for the 332 Chinese cites during our study period (Figure 5A) showed an increasing trend of coefficients of the sp, with city moving from the north to the southwest of the country. Cities in South China experienced a positive relationship between the sp and PM2.5 concentrations, that the increased sp in the south aggravated the PM2.5 concentrations, with Fangchengganng (0.609), Haikou (0.608) and Chongzuo (0.608) ranking among the top three cities. This is mainly because increased sp hindered the diffusion of pollutants in the vertical direction (43). However, an increased sp would limit PM2.5 pollution in northern cities, and the lowest coefficients appeared in the Ali (-3.568). Decreases of PM2.5 concentration in these cities was resulted from specific meteorological conditions formed by sp and other meteorological factors (44).
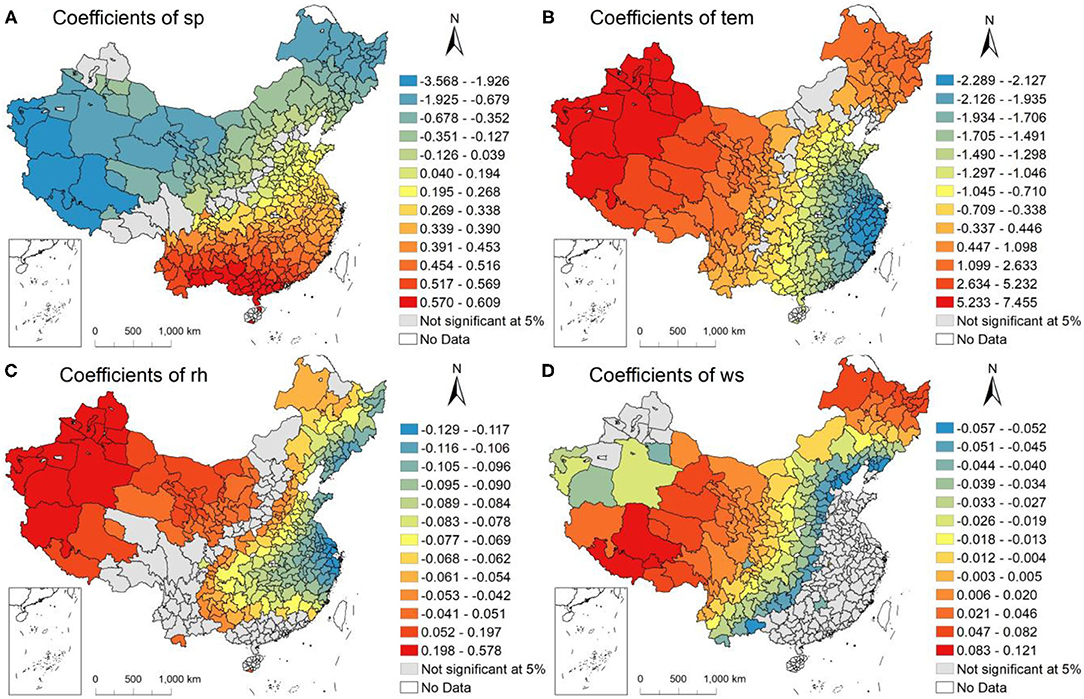
Figure 5. Results of natural factors from the GTWR in 332 Chinese cities. (A) Coefficients of surface pressure (sp), (B) coefficients of temperature (tem), (C) coefficients of relative humidity (rh), and (D) coefficients of wind speed (ws).
The coefficient of temperature (Figure 5B) shown a negative association with the PM2.5 concentrations in southeast and middle regions of the country, which revealed that the increased temperature in these areas would bring with a reduction in PM2.5 levels. Among the cities, Wenzhou was found to preserve the most significant negative correlation between temperature and PM2.5 concentration, a related coefficient being−2.289. As higher surface temperature would intensify atmospheric convection, PM2.5 concentration in these cities reduced. In contrast, positive correlations between temperature and PM2.5 concentration was exhibited in north regions. The temperature in the Ali exerted the most positive impact on the PM2.5 concentration, with the correlation coefficient being 7.455. The winter temperature in northern cities was low (Supplementary Figure 1), although it increased during the study period, resulting in an inversion layer in the atmosphere, which made PM2.5 difficult to diffuse (32).
From the spatial distribution of relative humidity (rh) coefficients (Figure 5C), we can see those regions with the most remarkable linkage between rh and PM2.5 were mostly situated in northwest regions, including Yili Kazak (0.578), Aksu (0.577), and Bortala Mongolia (0.572), among others. In the environment with high rh, water vapor in the air was easy to condense water-droplets, which would lead to the growth of moisture absorption of particles and aggravate haze pollution (45). Zhoushan (- 0.129), Karamay (- 0.124) and other cities in eastern areas displayed negative associations between rh and haze pollution. Whereas, the absolute value of these negative correlation coefficient was small, indicating that the reduction of rh in these areas had limited effect on the increase of PM2.5 concentration in this study period.
The spatial distribution of wind speed (ws) coefficients (Figure 5D) showed that the relations between ws and PM2.5 concentrations were not significant in the eastern and southern regions during our study period. Among the cities with a significant relation, the ws coefficients of several cities located in West and Northeast China were positive, but the coefficients were found to be negative in other cities. Specifically, the wind speed in Shigatse had the greatest promotion of haze pollution, with a coefficient of 0.121. The lowest ws coefficient emerged in Yingkou (- 0.057). As one of the important functions of wind was to transport air pollutants, a high wind speed contributed to the air pollutants' dilution and diffusion process, resulting in decreased regional PM2.5 concentrations (46).
Distribution of the correlation coefficient of three anthropogenic factors considered in this work is shown in Figure 6. The correlation of the ITAs and PM2.5 concentrations (Figure 6A) was not significant in approximately half of the cities located in the eastern regions during our study period. This result was in accordance with previous studies conducted by Zeng and Bao (47) and Bao and Zhang (33). In addition, the correlation parameters for ITAs were found to be significantly positive in other cities, and the coefficients in the western and north-eastern regions were higher than those in the northern and central areas. The ITAs in Kashgar was found to enforce the greatest promotion impact on the PM2.5, and every 1% raise in ITAs would cause a 1.703% decrease in PM2.5 concentration, followed by Kizilsu Kirgiz, Ali and Hotan.
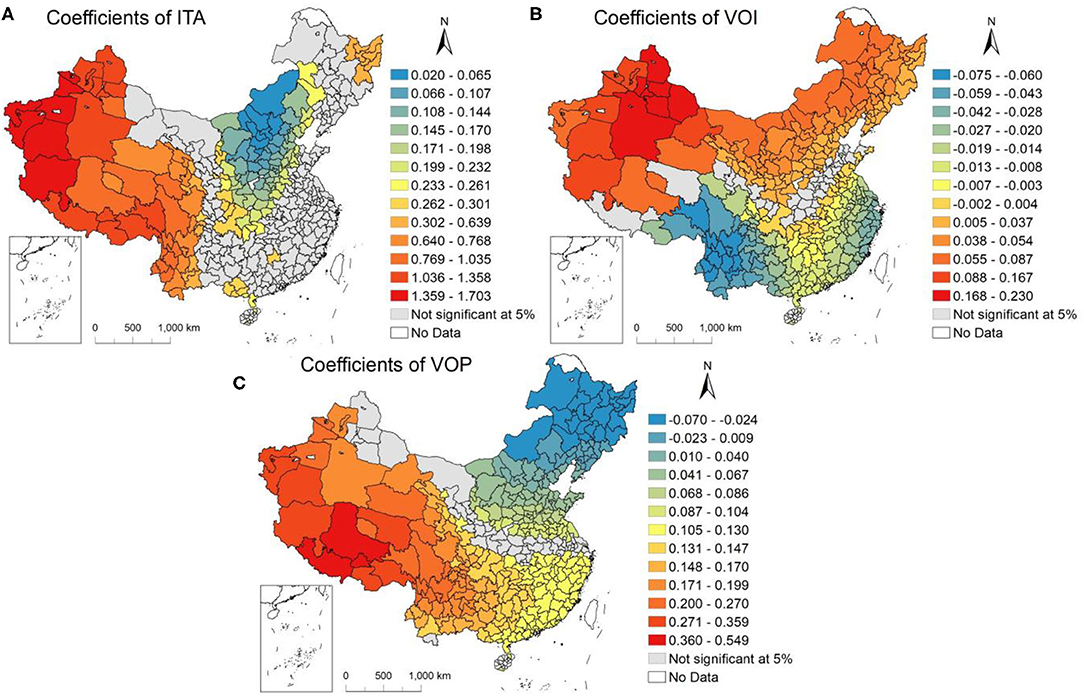
Figure 6. Results of anthropogenic factors from the GTWR in 332 Chinese cities. (A) Coefficients of the intensity of trip activities (ITA), (B) coefficients of the numbers of daily pollutant operating vents of key polluting enterprises in the industrial sector (VOI), and (C) coefficients of the numbers of daily pollutant operating vents of key polluting enterprises in the power sector (VOP).
As seen from Figure 6B, the correlation between the VOI and PM2.5 concentrations was gradually increase as area shifted from north-eastern and north-western parts to eastern and southwestern region (excepted for some cities in Shandong, Henan, Hubei, Shanxi, Ningxia, Qinghai and Tibet Provinces). Correlation coefficients in the southwestern and south-eastern coastal cities were less than zero, suggesting that raise of the VOI were accompanied by the decline of PM2.5 concentrations. Cities in northern China, the PM2.5 concentration was shown increase with grow in VOI. The VOI in Diqing Tibetan played a particularly substantial role in decreasing the PM2.5 concentration, with the coefficient of−0.075, then, the Nujiang Lisu Nationality Autonomous region (- 0.074), Lijiang (- 0.074), and Dali (- 0.071). The VOI in Turpan exhibited the greatest promoting influence on the PM2.5 concentration, having the coefficient of 0.230.
Contrary to the VOI results, the coefficient of VOP demonstrated an upward trend as cities shifted from the northeast to the southwest of China (Figure 6C). In north-eastern cities, the VOP was shown to more obviously restrain PM2.5 concentrations than in other cities. Hulun Buir (-0.070) had the lowest coefficient, followed by Heihe (-0.056) and Qiqihar (-0.053). The significance of the positive influence of VOP on PM2.5 concentrations in Shigatse, Lhasa, and Nagqu ranked as the top three among cities, with coefficients of 0.549, 0.443, and 0.419, respectively.
During the study period, the areas with serious haze pollution in China were mainly concentrated in the North China Plain (NCP), the north of the Yangtze River Delta (YRD), Northeast China (NEC) and some cities in Xinjiang. The specific area is shown in Supplementary Figure 1, and relative change rates of 7 driving factors in these areas before and after city closure are displayed in Supplementary Table 1. According to the analysis results, the spatial heterogeneity of the relationship between natural factors and PM2.5 concentration was obvious. The decrease of PM2.5 concentration in NCP was mainly caused by the increase of temperature and wind speed under the meteorological conditions at that time. Compared with other natural factors, the rise of temperature was the main reason for the mitigation of haze pollution in the YRD. In most cities in NEC, the reduction of relative humidity was the most important natural factor to reduce haze pollution. In addition, the main natural factor causing the decrease of PM2.5 concentration in some cities in Xinjiang was the increase of wind speed.
We also analyzed the spatiotemporal heterogeneity of the impacts of human activities on the PM2.5 concentration during our study period. The intensity of trip activities (ITAs) presented a positive effect on haze pollution, denoting that the limitation of travel intensity would generally reduce the PM2.5 concentration (33, 42). The coefficient distribution suggested that the aggravating effects of ITAs on haze pollution in western areas were more significant than those in central regions. Regions with significantly positive correlation coefficients in VOI were distributed in northern China, in which the PM2.5 concentrations were generally high. By contrast, the of VOP with PM2.5 concentrations showed an uptrend, as areas shifted from the northeast to the southwest. It is worth noting that the low VOP coefficients were concentrated in areas with winter heating (48). This result means that in China, some achievements have been made in using clean energy heating to improve air quality in winter (49).
In our study, we selected the period of COVID-19 outbreak in China as a case and calculated the relevance between city-level PM2.5 concentration and its driving forces during that short time, exploring variation characteristics of these correlations in time and space dimensions. According to the results, we found that it is possible to propose regional targeted air quality improvement suggestions for winter by considering spatiotemporal heterogeneity in the interactivities of PM2.5 concentrations and human activities. Although the travel restrictions implemented after the COVID-19 outbreak cannot be applied to air pollution management and control, it is feasible to improve haze pollution by declining unnecessary individual movements and increasing people's awareness of green commuting (50). When planning to improve air quality in northern areas in winter (with positive VOI correlation coefficients), the operating vent number of enterprises in the industrial sector with emission levels more than the regional standard limits should be strictly restrained or even eliminated. However, cities located in the west and south of the country, where the correlation of the VOP with PM2.5 concentrations is positive, must pay more attention to the reduction in pollutant emissions of polluting enterprises in the power sector (51). In addition, although the recession has caused a temporary decrease in air pollution, it would be difficult to preserve this decline after national labor force gradually went back to work. Therefore, in the future, green production and consumption will be a good way to improve air pollution without reducing people's normal production and living needs (52, 53).
This study has limitations. The available daily dynamic data of anthropogenic factors influencing PM2.5 distribution during this epidemic period were limited. The indicators we selected did not cover the influences of all anthropogenic factors. Because of absence of pollutants emissions data, some uncertainty existed in the process of evaluating the contributions of different sectors to the PM2.5 distributions by using indirect indicators. However, we used these indicators to reflect the dynamic changes in human activities, and the contribution of pollutant emissions to the PM2.5 concentration distribution was not discussed in this paper.
After the strict implementation of epidemic control measures gradually taken in Chinese cities, 84.3% of cities' PM2.5 concentrations decreased. Spatially, in the winter of 2020, cities with higher PM2.5 concentrations (>75 μg/m3) were mostly situated in Northeast China, the North China Plain and the Tarim Basin. As the problem of haze pollution was suppressed, the spatial aggregation of PM2.5 concentration was more prominent. The surface pressure coefficients for Chinese cities increased from the north to the southwest of China. The coefficient of temperature exhibited negative correlations with PM2.5 concentrations in southeast and middle cities; inversely, positive relationships were found in the northeast and northwest regions. Cities with higher relevance of PM2.5 concentrations with relative humidity were mainly situated in Northwest China. Regions in western and north-eastern China witnessed a significant positive influence of wind speed on PM2.5 concentrations. Among the three anthropogenic factors we considered, the ITAs exhibited significant positive influence on haze pollution, and the correlation maintained a high intensity during the study period. The VOI coefficients in northern cities were positive, while those in south-western and south-eastern coastal cities shown significantly negative. In addition, the VOP coefficients demonstrated an uptrend as region shifted from the northeast to the southwest of the country. Based on the spatiotemporal heterogeneity of coefficients for each factor, policy for controlling haze pollution need to be pointed out by considering the distinct meteorological and human activities at regional scales. Reasonable restrictions on people's travel intensity can effectively prevent haze pollution. In winter, cities in the north could focus on eliminating the operating vents of enterprises in the industrial sector with emission levels exceeding the regional standard limits, while cities in the west and south could pay more attention to the reduction of unnecessary pollutant emissions of polluting enterprises in the power sector.
Publicly available datasets were analyzed in this study. Data of intensity of trip activities can be found here: https://qianxi.baidu.com/. The numbers of daily pollutant operating vents of key polluting enterprises can be found here: http://www.ipe.org.cn/. Meteorological data can be found here: https://www.ecmwf.int/, and observations of PM2.5 concentrations can be found here: https://air.cnemc.cn:18007/.
LY: formal analysis, data curation, writing-original draft, and writing-review and editing. SH, SY and ZW: writing-review and editing. CH: writing-review and editing and resources. JH: data curation. ZY: data curation and validation. BC: resources. YW: writing-original draft. All authors contributed to the article and approved the submitted version.
The authors declare that the research was conducted in the absence of any commercial or financial relationships that could be construed as a potential conflict of interest.
All claims expressed in this article are solely those of the authors and do not necessarily represent those of their affiliated organizations, or those of the publisher, the editors and the reviewers. Any product that may be evaluated in this article, or claim that may be made by its manufacturer, is not guaranteed or endorsed by the publisher.
The Supplementary Material for this article can be found online at: https://www.frontiersin.org/articles/10.3389/fpubh.2022.810098/full#supplementary-material
1. Liu Q, Sha D, Liu W, Houser P, Zhang L, Hou R, et al. Spatiotemporal patterns of COVID-19 impact on human activities and environment in Mainland China using nighttime light and air quality data. Remote Sens. (2020) 12:1576. doi: 10.3390/rs,12101576
2. Shen J, Duan H, Zhang B, Wang J, Ji JS, Wang J, et al. Prevention and control of COVID-19 in public transportation: experience from China. Environ Pollut. (2020) 266:115291. doi: 10.1016/j.envpol.2020.115291
3. He C, Yang L, Cai B, Ruan Q, Hong S, Wang Z. Impacts of the COVID-19 event on the NOx emissions of key polluting enterprises in China. Appl Energy. (2021) 281:116042. doi: 10.1016/j.apenergy.2020.116042
4. Huang L, Liao Q, Qiu R, Liang Y, Long Y. Prediction-based analysis on power consumption gap under long- term emergency: a case in China under COVID-19. Appl Energy. (2020) 283:116339. doi: 10.1016/j.apenergy.2020.116339
5. Le T, Wang Y, Liu L, Yang J, Yung YL, Li G, et al. Unexpected air pollution with marked emission reductions during the COVID-19 outbreak in China. Science. (2020) 369:702–6. doi: 10.1126/science.abb7431
6. Silver B, He X, Arnold SR, Spracklen DV. The impact of COVID-19 control measures on air quality in China. Environ Res Lett. (2020) 15:084021. doi: 10.1088/1748-9326/aba3a2
7. Wang J, Lei Y, Chen Y, Wu Y, Ge X, Shen F, et al. Comparison of air pollutants and their health effects in two developed regions in China during the COVID-19 pandemic. J Environ Manage. (2021) 287:112296. doi: 10.1016/j.jenvman.2021.112296
8. Chen J, Wang S, Zhou C, Li M. Does the path of technological progress matter in mitigating China' s PM2.5 concentrations? evidence from three urban agglomerations in China. Environ Pollut. (2019) 254:113012. doi: 10.1016/j.envpol.2019.113012
9. Caplan AJ, Acharya R. Optimal vehicle use in the presence of episodic mobile-source air pollution. Resour Energy Econ. (2019) 57:185–204. doi: 10.1016/j.reseneeco.2019.06.001
10. Lin YC, Lai CY, Chu CP. Air pollution diffusion simulation and seasonal spatial risk analysis for industrial areas. Environ Res. (2021) 194:110693. doi: 10.1016/j.envres.2020.110693
11. Chen J, Zhou C, Wang S, Li S. Impacts of energy consumption structure, energy intensity, economic growth, urbanization on PM2.5 concentrations in countries globally. Appl Energy. (2018) 230:94–105. doi: 10.1016/j.apenergy.2018.08.089
12. Liu J, Mauzerall DL, Chen Q, Zhang Q, Song Y, Peng W, et al. Air pollutant emissions from Chinese households: a major and underappreciated ambient pollution source. Proc Natl Acad Sci United States. (2016) 113:7756–61. doi: 10.1073/pnas.1604537113
13. Colvile RN, Hutchinson EJ, Mindell JS, Warren RF. The transport sector as a source of air pollution. Atmos Environ. (2001) 35:1537–65. doi: 10.1016/S1352-2310(00)00551-3
14. Progiou AG, Ziomas IC. Road traffic emissions impact on air quality of the Greater athens area based on a 20year emissions inventory. Sci Total Environ. (2011) 410–1:1–7. doi: 10.1016/j.scitotenv.2011.09.050
15. Lin B, Du Z. Can urban rail transit curb automobile energy consumption? Energy Policy. (2017) 105:120–7. doi: 10.1016/j.enpol.2017.02.038
16. Sun C, Zhang W, Luo Y, Xu Y. The improvement and substitution effect of transportation infrastructure on air quality: an empirical evidence from China's rail transit construction. Energy Policy. (2019) 129:949–57. doi: 10.1016/j.enpol.2019.03.005
17. Velasco E, Retama A, Segovia E, Ramos R. Particle exposure and inhaled dose while commuting by public transport in Mexico City. Atmos Environ. (2019) 219:117044. doi: 10.1016/j.atmosenv.2019.117044
18. Shi T, Zhang W, Zhou Q, Wang K. Industrial structure, urban governance and haze pollution: Spatiotemporal evidence from China. Sci Total Environ. (2020) 742:139228. doi: 10.1016/j.scitotenv.2020.139228
19. Carter E, Shan M, Zhong Y, Ding W, Zhang Y, Baumgartner J, et al. Development of renewable, densified biomass for household energy in China. Energy Sustain Dev. (2018) 46:42–52. doi: 10.1016/j.esd.2018.06.004
20. Gong K, Li L, Li J, Qin M, Wang X, Ying Q, et al. Quantifying the impacts of inter-city transport on air quality in the yangtze river delta urban agglomeration, china: implications for regional cooperative controls of PM2.5 and O3. Sci Total Environ. (2021) 779:146619. doi: 10.1016/j.scitotenv.2021.146619
21. Liu N, Zou B, Feng H, Wang W, Tang Y, Liang Y. Evaluation and comparison of multiangle implementation of the atmospheric correction algorithm, dark target, and deep blue aerosol products over China. Atmos Chem Phys. (2019) 19:8243–68. doi: 10.5194/acp-19-8243-2019
22. Habeebullah TM, Abd El-Rahim IHA, Morsy EA. Impact of outdoor and indoor meteorological conditions on the COVID-19 transmission in the western region of Saudi Arabia. J Environ Manage. (2021) 288:112392. doi: 10.1016/j.jenvman.2021.112392
23. Xiao F, Yang M, Fan H, Fan G, Al MAA. An improved deep learning model for predicting daily PM25 concentration. Sci Rep. (2020) 10:20988. doi: 10.1038/s41598-020-77757-w
24. Venter ZS, Aunan K, Chowdhury S, Lelieveld J. COVID-19 lockdowns cause global air pollution declines. Proc Natl Acad Sci United States. (2020) 117:18984–90. doi: 10.1073/PNAS.2006853117
25. Fan C, Li Y, Guang J, Li Z, Elnashar A, Allam M, et al. The impact of the control measures during the COVID-19 outbreak on air pollution in China. Remote Sens. (2020) 12:1613. doi: 10.3390/rs12101613
26. Li L, Li Q, Huang L, Wang Q, Zhu A, Xu J, et al. Air quality changes during the COVID-19 lockdown over the yangtze river delta region: an insight into the impact of human activity pattern changes on air pollution variation. Sci Total Environ. (2020) 732:139282. doi: 10.1016/j.scitotenv.2020.139282
27. Wang Y, Wen Y, Wang Y, Zhang S, Zhang KM, Zheng H, et al. Four-month changes in air quality during and after the COVID-19 lockdown in six megacities in China. Environ Sci Technol. (2020) 7:802–8. doi: 10.1021/acs.estlett.0c00605
28. He G, Pan Y, Tanaka T. The short-term impacts of COVID-19 lockdown on urban air pollution in China. Nat Sustain. (2020) 3:1005–11. doi: 10.1038/s41893-020-0581-y
29. Yin Z, Zhang Y, Wang H, Li Y. Evident PM2.5 drops in the east of China due to the COVID-19 quarantine measures in February. Atmos Chem Phys. (2021) 21:1581–92. doi: 10.5194/acp-21-1581-2021
30. Shen L, Zhao T, Wang H, Liu J, Bai Y, Kong S, et al. Importance of meteorology in air pollution events during the city lockdown for COVID-19 in Hubei Province, Central China. Sci Total Environ. (2021) 754:142227. doi: 10.1016/j.scitotenv.2020.142227
31. Corpus-Mendoza AN, Ruiz-Segoviano HS, Rodríguez-Contreras SF, Yañez-Dávila D, Hernández-Granados A. Decrease of mobility, electricity demand, and NO2 emissions on COVID-19 times and their feedback on prevention measures. Sci Total Environ. (2020) 2:143382. doi: 10.1016/j.scitotenv.2020.143382
32. Song Y, Lin C, Li Y, Lau AKH, Fung JCH, Lu X, et al. An improved decomposition method to differentiate meteorological and anthropogenic effects on air pollution: a national study in China during the COVID-19 lockdown period. Atmos Environ. (2021) 250:118270. doi: 10.1016/j.atmosenv.2021.118270
33. Bao R, Zhang A. Does lockdown reduce air pollution? evidence from 44 cities in northern China. Sci Total Environ. (2020) 731:139052. doi: 10.1016/j.scitotenv.2020.139052
34. Huang B, Wu B, Barry M. Geographically and temporally weighted regression for modeling spatio-temporal variation in house prices. Int J Geogr Inf Sci. (2010) 8816:383–401. doi: 10.1080/13658810802672469
35. Yang F, Li K, Jin M, Shi W. Does financial deepening drive spatial heterogeneity of PM2.5 concentrations in China? new evidence from an eigenvector spatial filtering approach. J Clean Prod. (2021) 291:125945. doi: 10.1016/j.jclepro.2021.125945
36. Ni XY, Huang H, Du WP. Relevance analysis and short-term prediction of PM2.5 concentrations in Beijing based on multi-source data. Atmos Environ. (2017) 150:146–61. doi: 10.1016/j.atmosenv.2016.11.054
37. Fotheringham AS, Charlton M, Brunsdon C. The geography of parameter space: an investigation of spatial non-stationarity. Int J Geogr Inf Sci. (1996) 3798:605–27. doi: 10.1080/02693799608902100
38. Wei Y, Wang J, Song W, Xiu C, Ma L, Pei T. Spread of COVID-19 in China: analysis from a city-based epidemic and mobility model. Cities. (2021) 110:103010. doi: 10.1016/j.cities.2020.103010
39. Cui Y, Ji D, Maenhaut W, Gao W, Zhang R, Wang Y. Levels and sources of hourly PM2.5-related elements during the control period of the COVID-19 pandemic at a rural site between Beijing and Tianjin. Sci Total Environ. (2020) 744:140840. doi: 10.1016/j.scitotenv.2020.140840
40. Wang L, Li M, Yu S, Chen X, Seinfeld JH. Unexpected rise of ozone in urban and rural areas, and sulfur dioxide in rural areas during the coronavirus city lockdown in Hangzhou, China: implications for air quality. Environ Chem Lett. (2020) 18:1713–23. doi: 10.1007/s10311-020-01028-3
41. MEEPRC Ministry Ministry of Ecology and Environment of the People's Republic of China. Provisions on Administration the of Key Polluting Enterprises Directory (Trial Implementation). (2017). Available online at: http://www.mee.gov.cn/gkml/hbb/bgt/201712/t20171201_427287.htm (accessed April 30, 2021)
42. Wang Y, Yuan Y, Wang Q, Liu CG, Zhi Q, Cao J. Changes in air quality related to the control of coronavirus in China: implications for traffic and industrial emissions. Sci Total Environ. (2020) 731:139133. doi: 10.1016/j.scitotenv.2020.139133
43. Xian T, Li Z, Wei J. Changes in air pollution following the COVID-19 epidemic in Northern China: the role of meteorology. Front Environ Sci. (2021) 9:654651. doi: 10.3389/fenvs.2021.654651
44. He Q, Huang B. Satellite-based high-resolution PM2.5 estimation over the Beijing-Tianjin-Hebei region of China using an improved geographically and temporally weighted regression model *. Environ Pollut. (2018) 236:1027–37. doi: 10.1016/j.envpol.2018.01.053
45. Liu F, Tan Q, Jiang X, Yang F, Jiang W. Effects of relative humidity and PM[[sb]]2.5[[/s]] chemical compositions on visibility impairment in Chengdu, China. J Environ Sci. (2019) 86:15-23. doi: 10.1016/j.jes.2019.05.004
46. Zhou L, Zhang J, Lu T, Bao M, Deng X, Hu X. Pollution patterns and their meteorological analysis all over China. Atmos Environ. (2021) 246:118108. doi: 10.1016/j.atmosenv.2020.118108
47. Zeng J, Bao R. The impacts of human migration and city lockdowns on specific air pollutants during the COVID-19 outbreak: a spatial perspective. J Environ Manage. (2021) 282:111907. doi: 10.1016/j.jenvman.2020.111907
48. Deng L, Bi C, Jia J, Zeng Y, Chen Z. Effects of heating activities in winter on characteristics of PM2.5 -bound Pb. Cd and lead isotopes in cities of China. J Clean Prod. (2020) 265:121826. doi: 10.1016/j.jclepro.2020.121826
49. Cai H, Nan Y, Zhao Y, Jiao W, Pan K. Impacts of winter heating on the atmospheric pollution of northern China' s prefectural cities: evidence from a regression discontinuity design. Ecol Indic. (2020) 118:106709. doi: 10.1016/j.ecolind.2020.106709
50. Cui C, Wang Z, He P, Yuan S, Niu B, Kang P, et al. Escaping from pollution: The effect of air quality on inter-city population mobility in China. Environ Res Lett. (2019) 14:124025. doi: 10.1088/1748-9326/ab5039
51. Yang C, Li T, Albitar K. Does energy efficiency affect ambient PM2.5? the moderating role of energy investment. Front Environ Sci. (2021) 9:707751. doi: 10.3389/fenvs.2021.707751
52. Ülkü MA, Hsuan J. Towards sustainable consumption and production: competitive pricing of modular products for green consumers. J Clean Prod. (2017) 142:4230–42. doi: 10.1016/j.jclepro.2016.11.050
Keywords: PM2.5, spatiotemporal heterogeneity, Chinese cities, COVID-19, GTWR
Citation: Yang L, Hong S, He C, Huang J, Ye Z, Cai B, Yu S, Wang Y and Wang Z (2022) Spatio-Temporal Heterogeneity of the Relationships Between PM2.5 and Its Determinants: A Case Study of Chinese Cities in Winter of 2020. Front. Public Health 10:810098. doi: 10.3389/fpubh.2022.810098
Received: 08 November 2021; Accepted: 21 March 2022;
Published: 11 April 2022.
Edited by:
Xinming Wang, Guangzhou Institute of Geochemistry (CAS), ChinaReviewed by:
Mindond Chen, Nanjing University of Information Science and Technology, ChinaCopyright © 2022 Yang, Hong, He, Huang, Ye, Cai, Yu, Wang and Wang. This is an open-access article distributed under the terms of the Creative Commons Attribution License (CC BY). The use, distribution or reproduction in other forums is permitted, provided the original author(s) and the copyright owner(s) are credited and that the original publication in this journal is cited, in accordance with accepted academic practice. No use, distribution or reproduction is permitted which does not comply with these terms.
*Correspondence: Song Hong, c29uZ2hvbmdwa3VAMTI2LmNvbQ==
Disclaimer: All claims expressed in this article are solely those of the authors and do not necessarily represent those of their affiliated organizations, or those of the publisher, the editors and the reviewers. Any product that may be evaluated in this article or claim that may be made by its manufacturer is not guaranteed or endorsed by the publisher.
Research integrity at Frontiers
Learn more about the work of our research integrity team to safeguard the quality of each article we publish.