 Habib Nawaz Khan
 Qamruz Zaman
 Fatima Azmi3
 Gulap Shahzada
 Mihajlo Jakovljevic
- 1Department of Statistics, University of Science and Technology (UST), Bannu, Pakistan
- 2Department of Statistics, University of Peshawar, Peshawar, Pakistan
- 3Department of Mathematics and Sciences, College of Humanities and Sciences, Prince Sultan University, Riyadh, Saudi Arabia
- 4Institute of Education and Research, University of Science and Technology, Bannu, Pakistan
- 5Institute of Advanced Manufacturing Technologies, Peter the Great St. Petersburg Polytechnic University, St. Petersburg, Russia
- 6Institute of Comparative Economic Studies, Hosei University, Tokyo, Japan
- 7Department of Global Health Economics and Policy, University of Kragujevac, Kragujevac, Serbia
In case of heavy and even moderate censoring, a common problem with the Greenwood and Peto variance estimators of the Kaplan–Meier survival function is that they can underestimate the true variance in the left and right tails of the survival distribution. Here, we introduce a variance estimator for the Kaplan–Meier survival function by assigning weight greater than zero to the censored observation. On the basis of this weight, a modification of the Kaplan–Meier survival function and its variance is proposed. An advantage of this approach is that it gives non-parametric estimates at each point whether the event occurred or not. The performance of the variance of this new method is compared with the Greenwood, Peto, regular, and adjusted hybrid variance estimators. Several combinations of these methods with the new method are examined and compared on three datasets, such as leukemia clinical trial data, thalassaemia data as well as cancer data. Thalassaemia is an inherited blood disease, very common in Pakistan, where our data are derived from.
Introduction
The main focus in survival analysis is usually based on the observed time until some event occurs. The event of interest may for instance be death or disease in medical science or component breakage in the area of engineering. In survival analysis, three approaches are used for fitting the models (1) Parametric approach, (2) Non-parametric approach, and (3) Semi-parametric approach. Each approach is based on different techniques. In this paper, we describe the work on the familiar non-parametric approach, i.e., the Kaplan–Meier. In case of no covariate, the Kaplan–Meier survival function may be constructed to estimate the true survival curve.
The Kaplan–Meier is based on the different assumptions and if the population from which the data for a Kaplan–Meier estimation are sampled violate one or more of the Kaplan–Meier assumptions, the results of the analysis may be incorrect or misleading (1). Apart from this, there are some other cases which may also affect the results. For example, in case of small censoring the Kaplan–Meier yields good results but heavy censoring and small sample size may affect the reliability of the Kaplan–Meier estimates. In their paper, Kaplan and Meier (2) adopted the Greenwood's variance estimator. In case of small sample size, the Greenwood's estimator underestimates the true variance. Instead of the Greenwood's formula (3), one may use the Peto et al. (4) variance estimator for the Kaplan–Meier survival function. But it also underestimates the true variance in case of small sample size and heavy censoring.
To overcome these difficulties, one may use a simple regular and adjusted hybrid variance estimator (5) for the Kaplan–Meier survival function. It gives the variance at the censoring time as well as the shrunken estimates of survival function greater than zero and variance even if the last observation is event, i.e., the curve of shrunken never touches the 0 and 1 probability. Just like the Kaplan–Meier, it has its own boundaries. But the problem of this method is that it always gives the variance larger than the Greenwood's and Peto's variance, even if we have no censoring time and it is only useful for a very small sample size.
With these concerns, we present a variance estimator for the Kaplan–Meier. The beginning of any study is very important and if there is heavy censoring at this stage before any event occurred, neither the estimates nor the variance can be found at this point. This means that if we apply the Kaplan–Meier survival function or the shrunken Survival function at these stages, they give constant values, e.g., KM gives 1 until the first event and similarly Shrunken KM also yield some constant value depending upon the n. At the first event, these values suddenly change which shows that these ignored censored observations carry some weight. This affects the estimates as well as the standard error (SE) too. In addition, when plotting the curves it is unclear, whether the Kaplan–Meier survival function or shrunken Kaplan–Meier function was applied, because both methods are unable to give estimates at the censoring time.
In the calculation of Kaplan–Meier, we considered the number of events and the number of persons at risk. The number of persons at risk also includes the censored observations, but gives no importance to it. This is incorrect because if a censoring occurred in stage one it would not be counted in the next stage and that would affect the number of persons at risk and ultimately also the estimates as well as the variance too. The number of persons at risk at each stage has its own importance.
Keeping these facts in mind here, we introduce a weight, which we assign to those numbers of persons at risk at time (ti) which include the censored observations. On the basis of this weight, we propose a modified cumulative hazard function, the plot of which gives more detailed information in case of heavy censoring in the initial stage as well as later stages.
Methods
The Modified Kaplan–Meier Estimator of the True Survival Curve
Let the survival times T1, T2,…, Tn be independently identically distributed and let C1, C2, …, Cn be independently identically distributed censoring times. The observed random variables Yi = min {Ti, Ci} and σi = I {Ii ≤ Ci}, is the indicator function, denotes whether the survival time is censored or uncensored.
Then the Kaplan–Meier product limit estimator is defined by
Where ri denotes the number of persons at risk at time Ti and di denotes the number of events.
In order to develop a procedure here, we considered the total number of observations, number of persons at risk, and serial number, which play the important role in the calculation of probabilities.
The n denotes the number of subjects in the sample and ri denotes the number of persons at risk at time ti. K is the serial number in reverse order of those times at which censoring occurred; e.g., if the first observation is censored then it has the highest serial number and if the second observation is censored it has the second highest number and so on. Then the weight is defined by
Where Ici is an indicator function and
Ici = 1 if the observation is censored
= 0 otherwise.
The Kaplan–Meier estimator of the survivor function for any value of t in the interval from t(i) to t(i+1) can be written as
Where
We assign the weight to it and say
Therefore,
So
With the variance, the proof of which is given in the appendix.
The SE is
Effect of on the Weighted Variance
In order to select the best method under different circumstances, i.e., to select the appropriate method, which is suitable in all circumstances, whether there are no censoring, moderate, or heavy censoring, we took the different combinations of , Greenwood's and Peto's variances with the new method. The combinations are given below:
We replace by the and , so the variances and SEs are
In Greenwood's and Peto's formula, we replace , to check the effect of each and every combination.
Case of Events Only or No Censoring Times
Here, we studied the behavior of these methods, if the dataset was free from censoring, then what will these methods behave, we studied here.
If the dataset comprises all the events, then all for i = 1,2,..,n
And thus
Moreover, in case of events only included in a dataset, is just the complement of the empirical distribution function (6), given by
So our function is also equal to the empirical survival function. And the variance is
Since
Wi = 1 and Ici = 0, in case of all events so
Which is reduced to the Greenwood's formula, but in case of events only, i.e., if there are no censored survival times, then ri − di = ri+1 (7), and so
Hence, the variance is reduced to the binomial variance, i.e.,
This means that the results will be same whether the Weighted, Greenwood, or Binomial formulas are used.
Relationship Among Variances in Case of No Censoring Times
As we know that in case of no censoring, our method and Greenwood's method are just reduced to binomial variance, we are now going to establish the relation among the binomial variance () and the variances of Peto and shrunken function. As
Since
, so
With the help of this formula, the variance of Peto can be calculated.
In case of no censoring, the adjusted hybrid variance formula is
Where
By simplifying the variance, we get
Which implies that
whether there are no, moderate, or heavy censoring.
So from eqs (1) and (2), we conclude that in case of no censoring time
(check it) something wrong peto is greater than greenwood.
This will be verified with the help of examples.
Notations
Since we use different combinations for the variances, we denote these in the following way:
SkM for the Kaplan–Meier survival function
SKM* for the shrunken Kaplan–Meier survival function
Sw for weighted Kaplan–Meier survival function
SEG for the greenwood SE
SEP for the Peto's SE
SEH for regular SE
SEH* for adjusted hybrid SE
SEW for weighted SE
SEKMW for SE of weighted method by taking the Kaplan–Meier survival probabilities.
SEKM*W for SE of weighted method by taking the shrunken Kaplan–Meier survival probabilities.
SEWG Greenwood's SE by taking the weighted survival probabilities.
SEWP Peto's SE by taking the weighted survival probabilities.
SEWH Adjusted hybrid SE by taking the weighted survival probabilities.
ri denotes the number of persons at risk at time Ti and di denotes the number of events.
Ici is an indicator function.
Simulation Study
Method of Simulations
For the simulation, we used the Borkowf method. A simulation study is designed to compare the average of the ten SEs with the simulated SD at three quartiles. We generated the survival times {ti} from the Weibull's and Gamma distribution with shape parameters <1 (we took 0.5), = 1, and > 1 (we took 1.5), the hazard function decreases, constant, and increases over time, respectively. Uniform distribution is selected for the censoring time {Ci} with density f (t/b) = 1/b for 0 ≤ t ≤ b and 0 otherwise. Where different values of b's are taken for different censoring percentages.
For each underlying distribution, i.e., Weibull and Gamma, we generated 500 datasets of survival times as well as the censoring times from uniform distribution with sample sizes 10, 15, 20, 25, 30, 35, 40, 45, 50, and 100. Then from the survival times and censoring times, we obtained the observed survival times {yi} and event indicator variables {σi} (see Table 1).
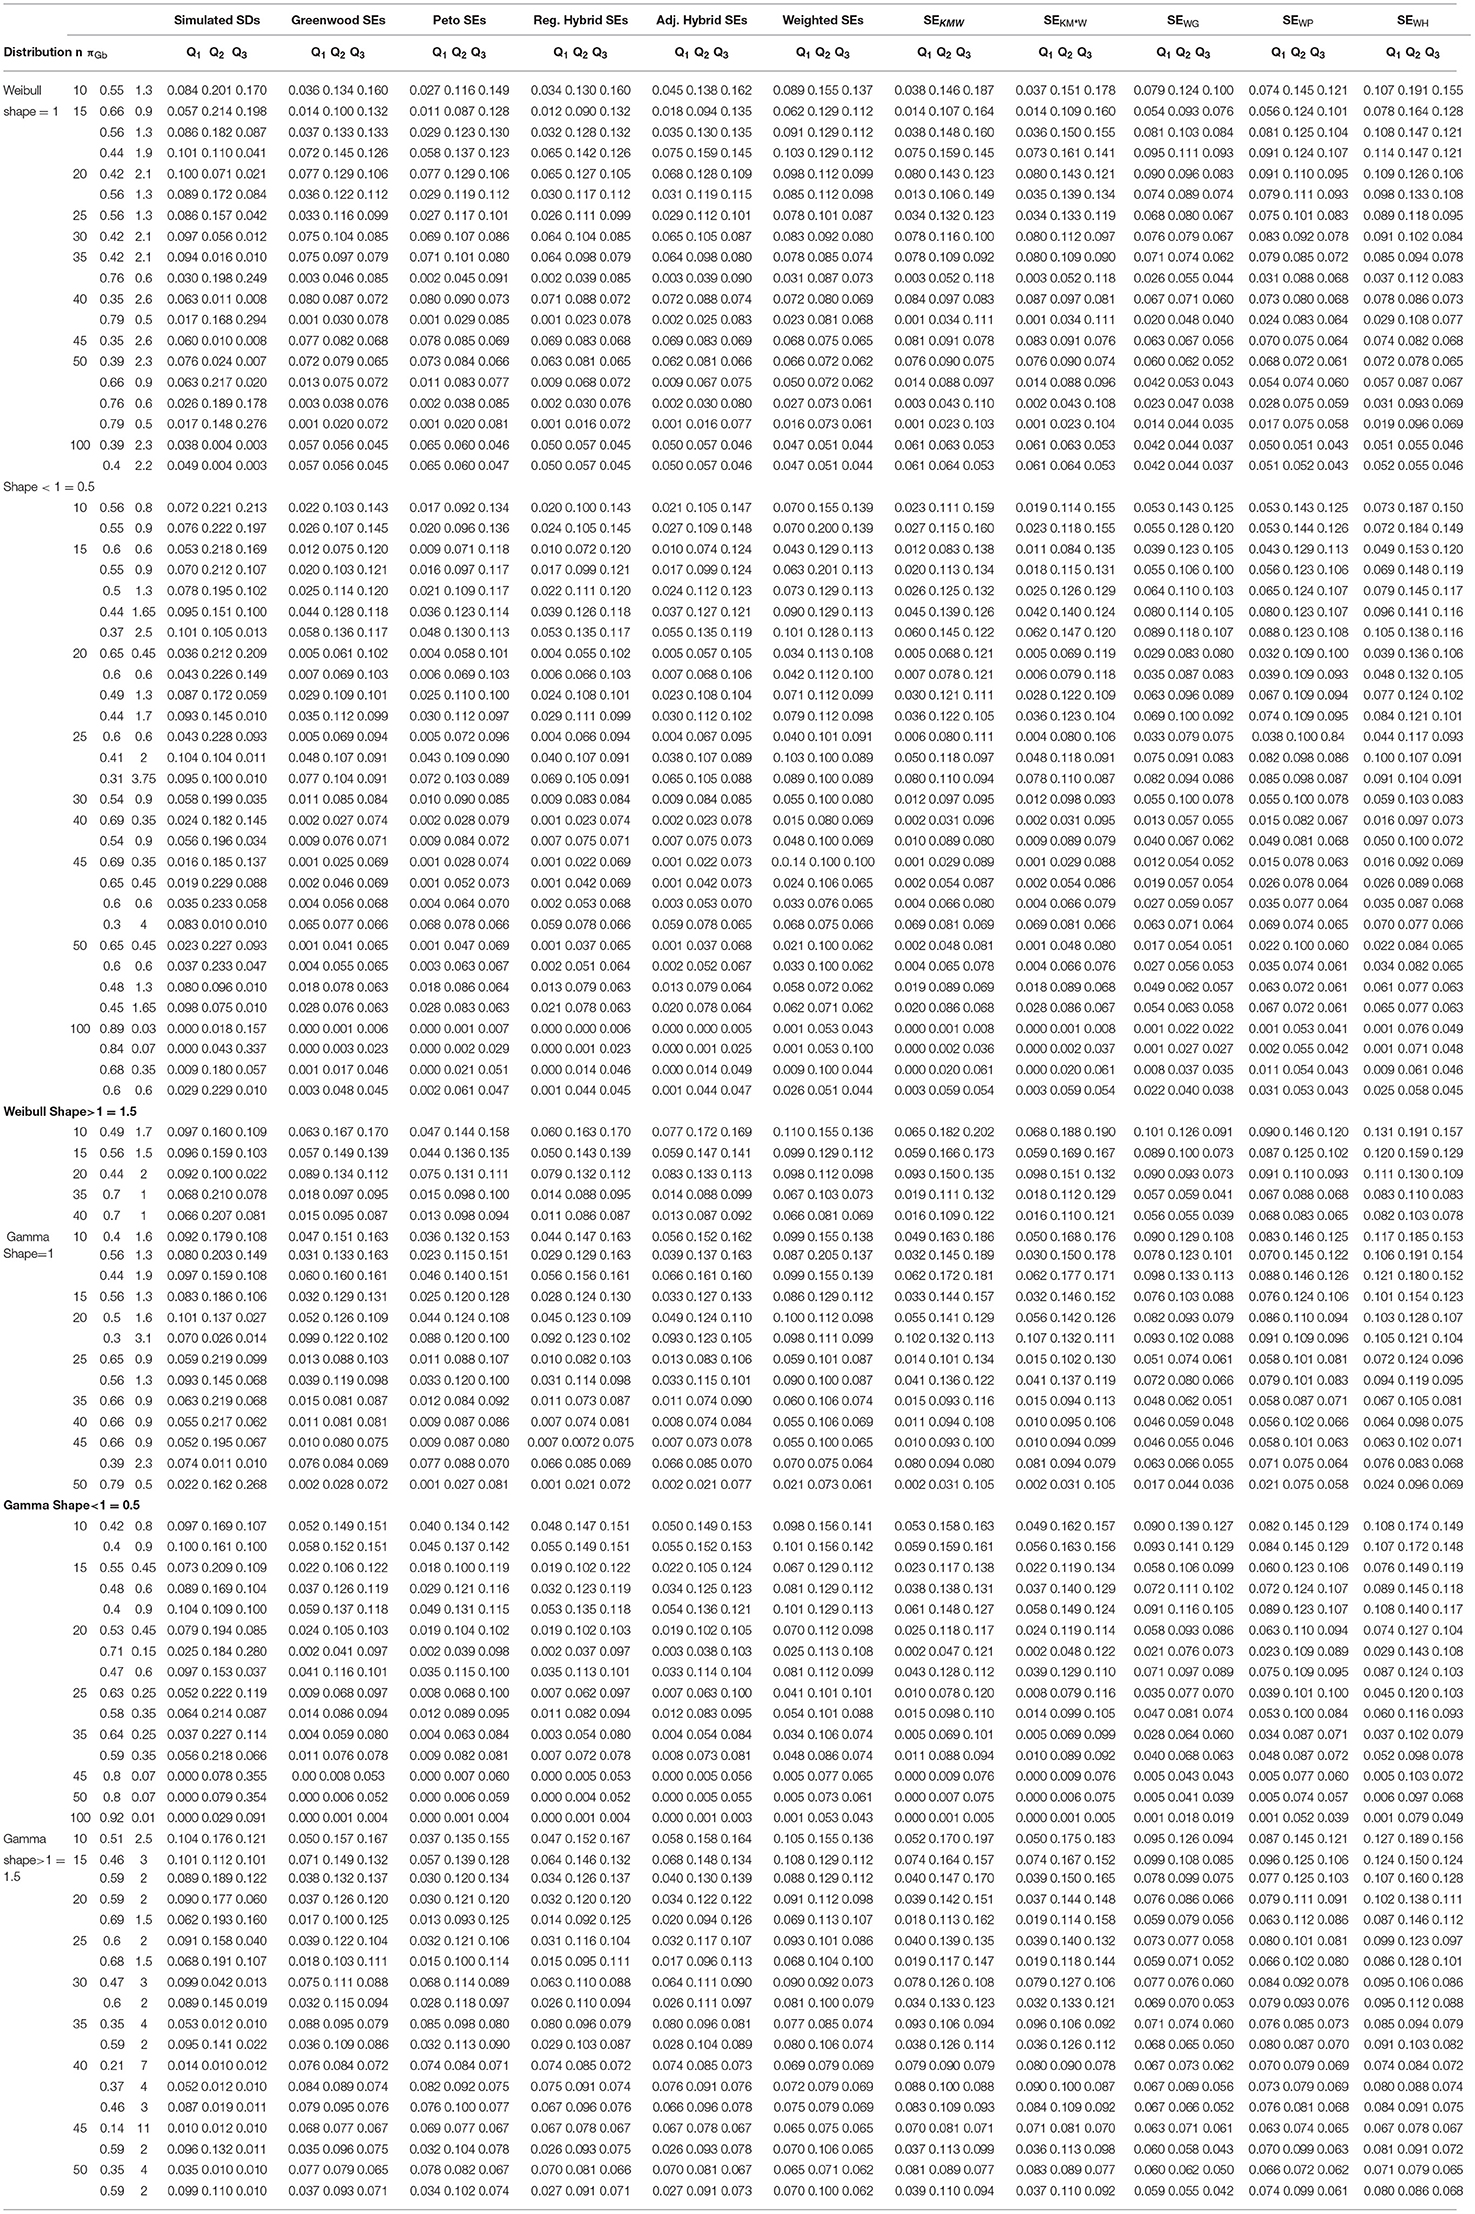
Table 1. Simulated SDs and mean standard errors (SEs) for ten variance estimators at three quartiles, with data generated from the Weibull and Gamma distribution with different shape parameters and with uniform censoring (based on b), based on 500 simulated trials.
Results of Simulation
We used the survival times {yi} and indicator variables {σi} and computed the Kaplan–Meier survival function, the Greenwood, Peto, regular, adjusted hybrid, weighted variance, and different combinations of weighted Kaplan–Meier functions. Also the simulated SD is calculated by the Borkowf method. The average of all ten SEs are compared with the values of simulated SD at three quartiles namely Q1, Q2, Q3. With different censoring percentages, average of the Greenwood's, Peto's, regular, and hybrid variances are smaller substantially in the first quartile, while the average weighted SEs are approximately equal to the stimulated SDs (target values). The combination of the Kaplan–Meier survival probability with variance of weighted Kaplan–Meier did not give as close results as obtained by the weighted Kaplan–Meier. Similar, results obtained from the combination of shrunken survival probabilities with the weighted variance factor. The efficiency of the Greenwood SE for a very small sample sizes is achieved by taking the weighted probabilities in the formula. Similarly, by taking the weighted probability, we got the better results of the Peto too. Improvement also occurred in the adjusted hybrid method by taking the weighted survival probabilities.
Also in the second and third quartiles, the results of the weighted method matches closer to the target values as compared to the Greenwood, Peto, regular, and hybrid methods, while in some cases, these four methods substantially over estimate the true values of these target values.
The combination of the weighted survival probabilities and variance factors gave the better results. Also for comparatively large sample sizes 45, 50, and 100, weighted variance gave the much better result. So it is and in some situations (moderate and heavy censoring), its combination with the hybrid and Peto's are the best methods.
Analysis of Datasets
We used different datasets from real life, in order to make it more practical and easy. The details of the datasets are described below:
Application on Thalassaemia Data
The data of 70 patients were collected from the Fatimid Foundation, Peshawar (Pakistan). Fatimid foundation, a non-profit charity organization, is the pioneer in voluntary blood transfusion services in Pakistan. Thalassaemia is an inherited disorder with an abnormality in one or more of the globin genes. The time is taken in months of the treatment.
Out of 70 patients, 56 were censored and 14 events occurred. This means there is heavy censoring in the data, which is also due to the fact that the treatment of the disease is a life-long. For this reason, most people stop the treatment. The data are given below indicating months of treatment.
3+, 3+, 5+, 5+, 15+, 15+, 16+, 27, 30+, 30+, 46+, 50+, 50+, 50+, 53+, 56+, 56+, 56+, 58+, 60+, 60+, 61+, 64, 64, 70+, 70+, 72+, 72+, 72+, 77+, 79+, 80+, 80+, 80+, 94+, 94+, 94+, 96+, 96+, 102, 102, 108+, 108+, 108+, 111, 111, 113+, 114+, 114+, 117+, 117+, 117+, 122, 122, 126+, 127+, 129, 138+, 138+, 142+, 145+, 155+, 156, 161+, 164+, 165, 165, 173, 173+, 175.
Where a plus sign denotes a censored observation. The results of the analysis are given in (Table 2).
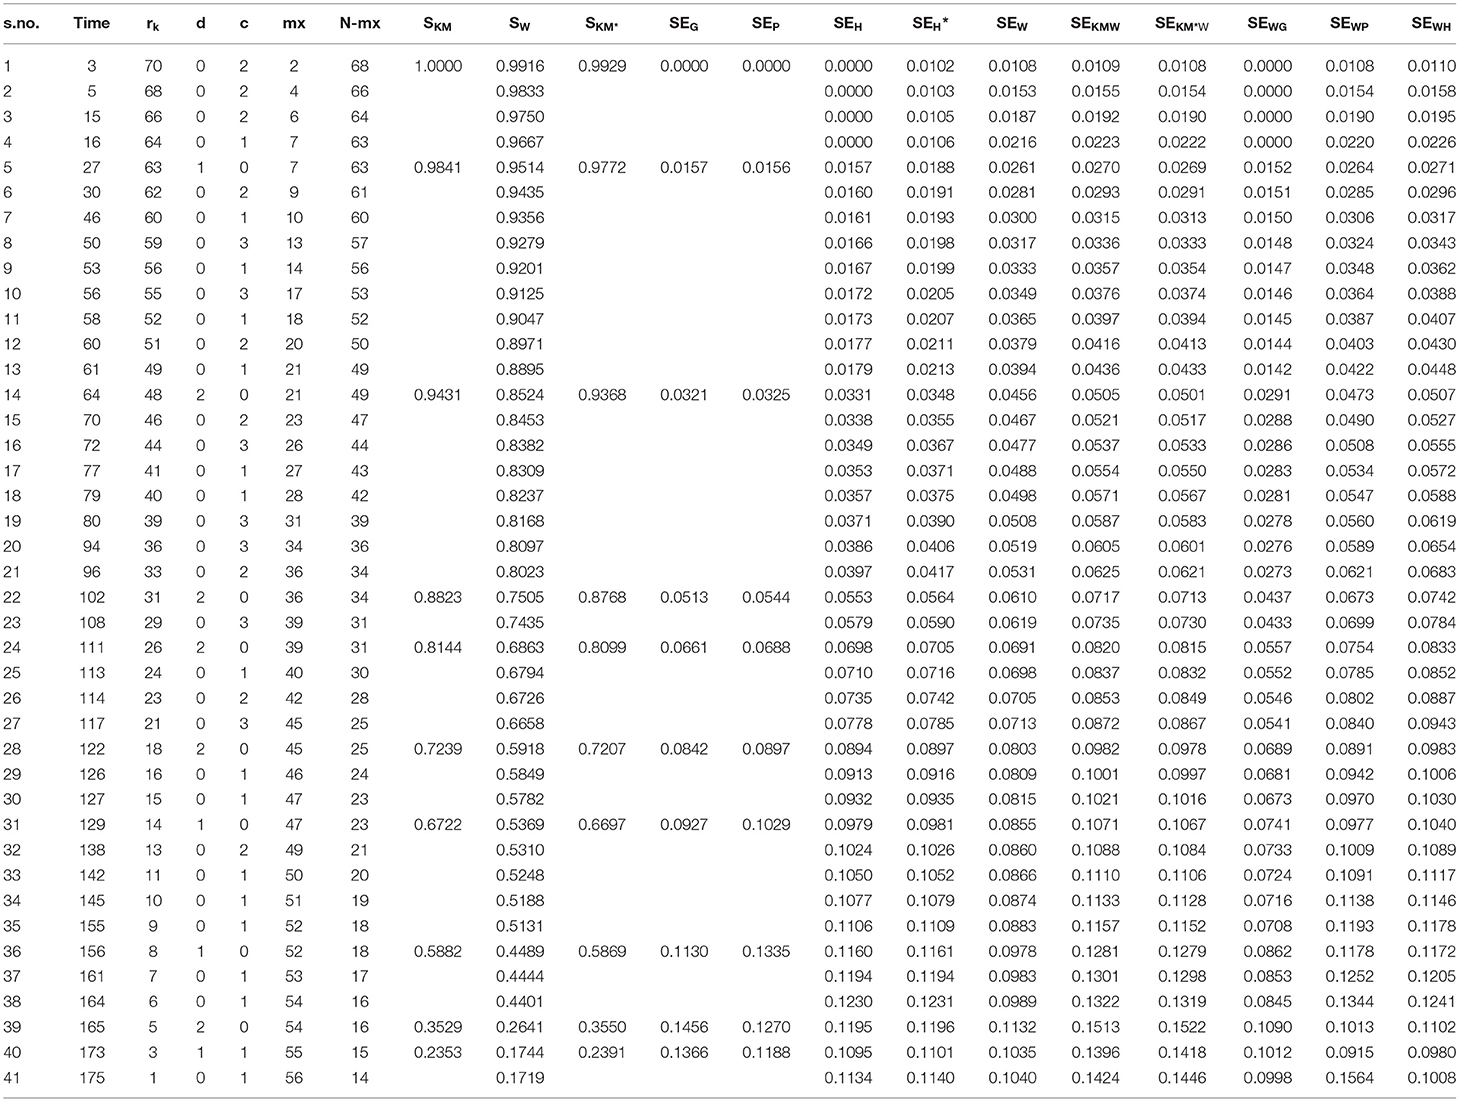
Table 2. Estimated survival functions and SEs using the five variance estimation methods and their combinations.
The first column gives the serial number which we used in the computation of the weighted formula, the second column is the time in months, and the third column is the number of persons at risk at different times. The following two columns denote the events and censoring at each time. mx denotes the cumulative sum of censoring; the next column is the subtraction of cumulative censoring from the total number of patients. The following three columns denote the Kaplan–Meier survival probabilities, survival probabilities based on weighted Kaplan–Meier, and survival probabilities based on shrunken Kaplan–Meier. After these three columns, the following ten columns show the ten different combinations of SEs.
If we look at the comparison of the new method with the others, then we see that our method gives the estimates as well as the SE at each point whether the event occurred or not. Its range is the same as that of Kaplan–Meier survival function, i.e., 0 and 1. Thus, unlike the shrunken survival function it starts from 1 for t ≤ t(1). If we compare it with the others, we see that from the start its SE is greater than the SE of adjusted hybrid SE, which is also due to the fact that it includes the probabilities of all points which affect it. On the other hand, the patterns of regular and adjusted hybrid SEs are the same as described by Borkowf (5), since the Greenwood's and Peto's variance estimators can substantially under estimate the true variance in the left and right tails of the survival distribution, in case of moderate or heavy censoring. In the extreme lower part, the SEs of regular and adjusted hybrid just like the weighted SEs are smaller than the Greenwood's and Peto's SEs, so they also underestimate the variance on the right tail. Therefore, we need to find such a method which yields the better results compared to these methods. Thus we take the probabilities instead of showing immediate effects on the results and giving much better results on both tails than the other methods discussed above.
For more substantial conclusions, we use instead of in our formula, which also gives the same pattern as by taking instead of. This enables another choice of using it.
In order to determine the effects of SW on the variances of Greenwood's, Peto's and regular variance, we replace SKM by Sw. Replacing it in the Greenwood's formula does not give a satisfactory result, as it actually underestimates the values at each point. This is due to the fact that . The case of Peto's variance is different from Greenwood's, yielding better results in the start but being smaller in the end than the Peto's based on SKM. It is the same case is repeated with the regular variance when using SW in the formula, i.e., it is smaller in the end. If we take the and , we get the best result.
Case of Events Only in Leukemia Dataset
To further elaborate more these methods, the second group of the same leukemia data is considered, which consists of events only. The leukemia data are taken from Freireich et al. (8). The dataset is given below:
1, 1, 2, 2, 3, 4, 4, 5, 5, 8, 8, 8, 8, 11, 11, 12, 12, 15, 17, 22, 23 The analysis is shown in (Table 3).
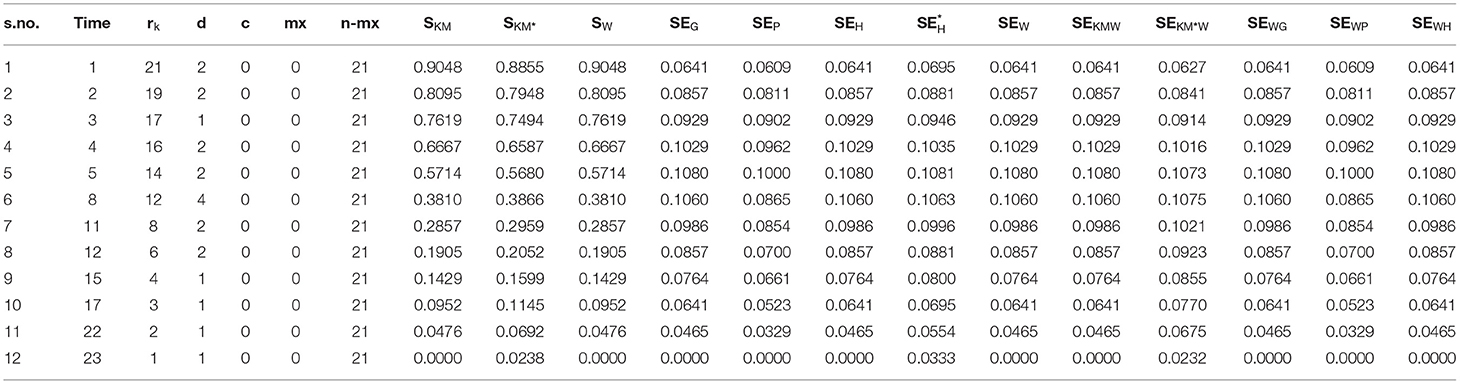
Table 3. Estimated survival functions and SEs using the ten different methods from leukemia data.
In case of events only, SKM = SW, while the shrunken Kaplan–Meier survival function () is different from these. Similarly, SEG= SEH = SEW = SEKMW = SEWG = SEWH and variance reduced to binomial variance. Also SEP = SEWP, because in case of no censoring time, SKM = SW, while SEH* and SEKM*W differ. SEH* is greater in all situations from SEG and SEP. While the comparison of SEH* and SEKM*W gives a mixed picture, in the start, the former is larger but in the later stages SEKM*W is larger. While in case of events only, binomial variance is considered to be the best choice, so it overestimates the variance and Peto's method under estimate.
Case of Censored Data Only
In order to check the performance of these methods in case of censored data only, we interchange the role of censoring and occurrence of events in the above example to get the Table 4.
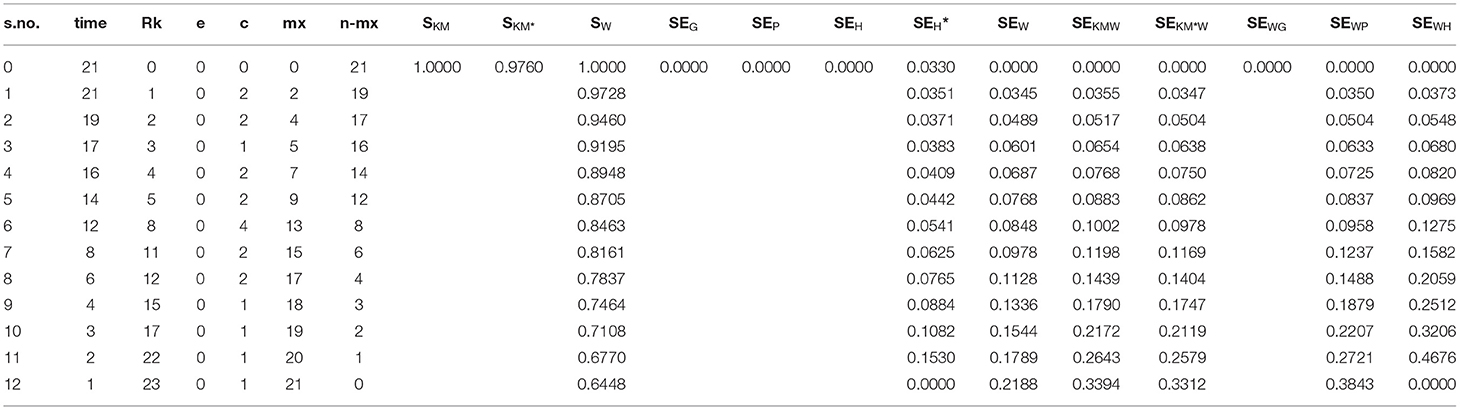
Table 4. Estimated survival functions and SEs of the leukemia data containing only censoring time.
As traditionally, the probabilities of Kaplan–Meier and shrunken are struck to one and 0.976, since n = 21, i.e., these are the probabilities at time t ≤ t(1). While the new method gives the estimate at each point affecting the SE too. SEW gives a smaller value at the start but then increases toward the end. The same is the case with the combination of this formula with the SKM and SKM*. SE of regular hybrid variance using the SW gives much bigger values than the all others, while SEG gives a value of zero for each case.
Cancer Dataset From 1,207 Patients With 94% Censoring
Here, we consider a bigger dataset containing 1,207 patients with very heavy censoring (94%) obtained from the SPSS (9) data. Some of the information regarding the analysis of this data are given in (Table 5).
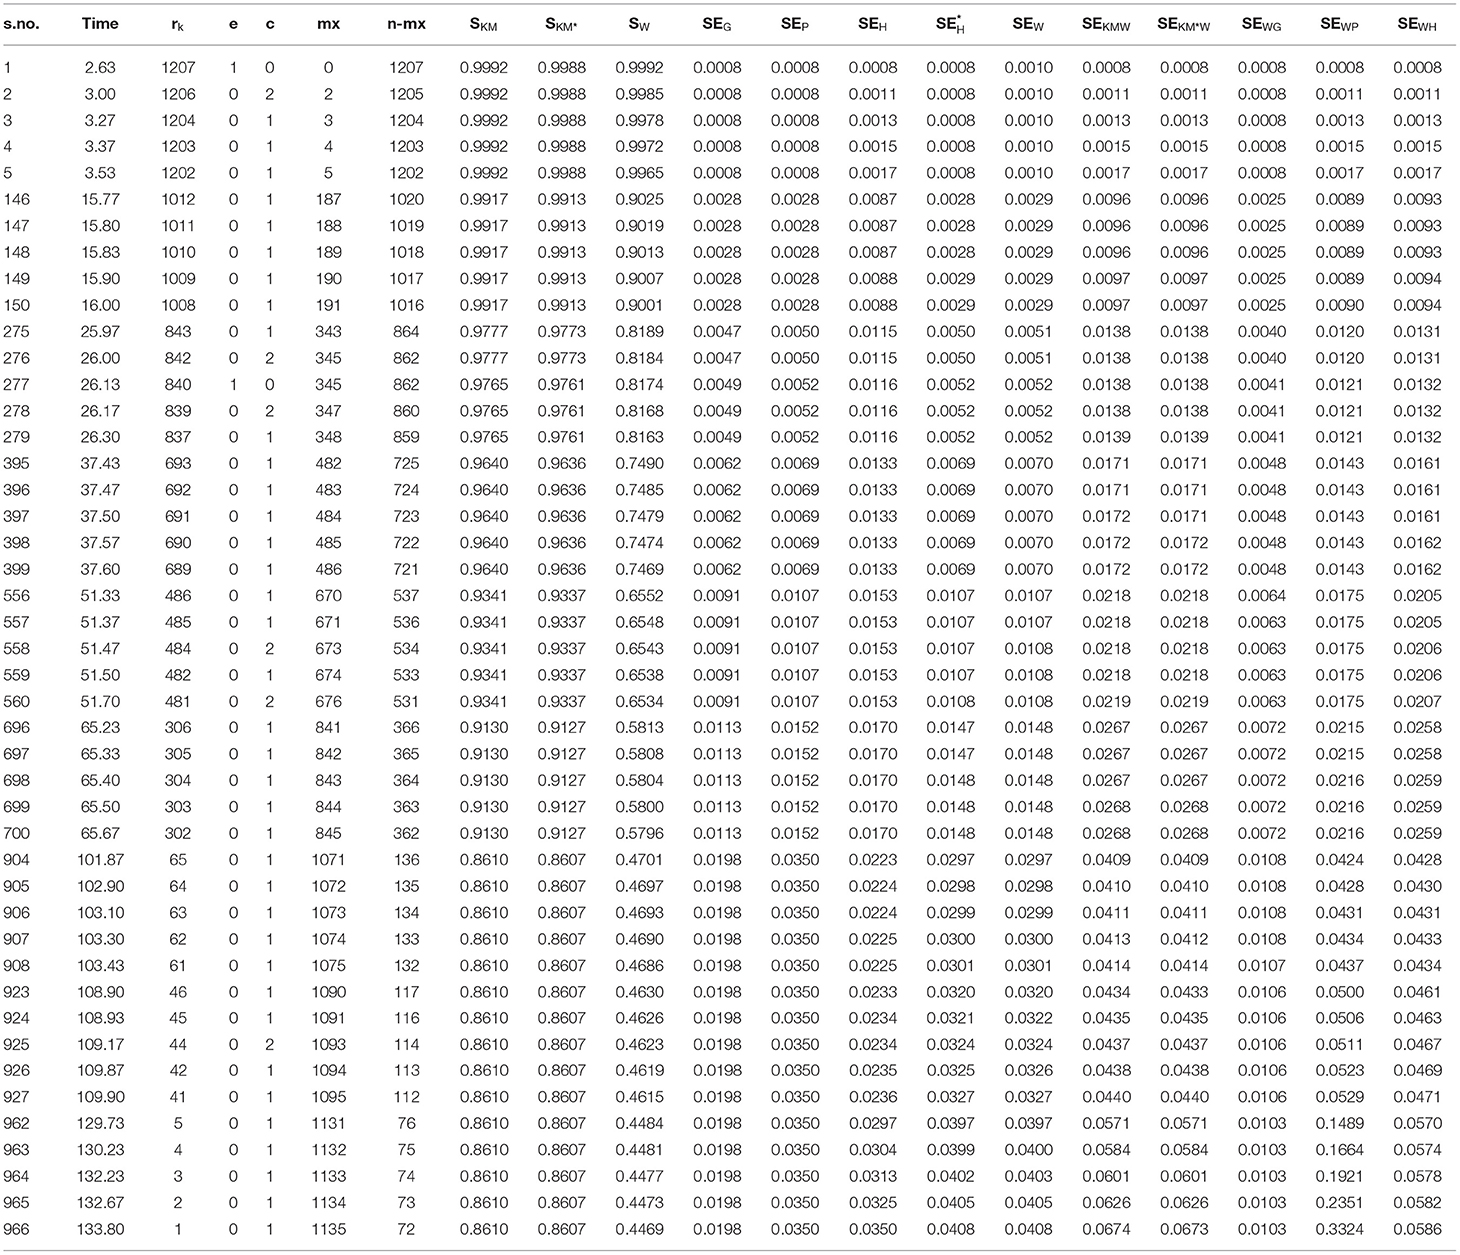
Table 5. Selected estimated survival functions and SEs of the cancer data.
In case of a large sample size results change to some extent, our method yields better results than the adjusted hybrid method. The regular method gives a much larger variance than the Peto's, Greenwood's, adjusted, and weighted variance, though decreasing in the end stages, i.e., it underestimates the variance at the end stages. The combination of the Kaplan–Meier and shrunken survival probabilities with the weighted SE gives the better results right from start to end. Also, the combination of weighted survival probabilities with the Peto's variance yields better results than the peto's variance based on the Kaplan–Meier survival probabilities. The same is the case with the weighted probabilities in the hybrid variance giving larger values than the hybrid variance based on both Kaplan–Meier and shrunken probabilities.
The performance of , , and in terms of graphical representation.
To obtain the more detailed results, we assume that the data follow some distribution and draw the graph for the thalassaemia data. Suppose, the data follow an exponential distribution and we draw the graph of the hazard function against time to observe the performance of the various methods.
By definition
Here, we assume that the data follow an exponential distribution and plot the three functions, i.e., , , and against time. Looking at the graph, we see that Figures 1A,B are smooth in the start, as the starting value of Kaplan–Meier survival function is 1 and that of hazard function is zero. In contrast, the starting value of shrunken function is not 1, so its starting point (in case if the initial value is censored) can never be zero. Nevertheless, it remains constant in the start, as it does not give any significance to the censored observations, only changing when an event occurred. Looking at the third figure, though, which is unlike the first two, more detailed information is given not only in the start, but also at each stage as it changes with the event as well as with the censoring.
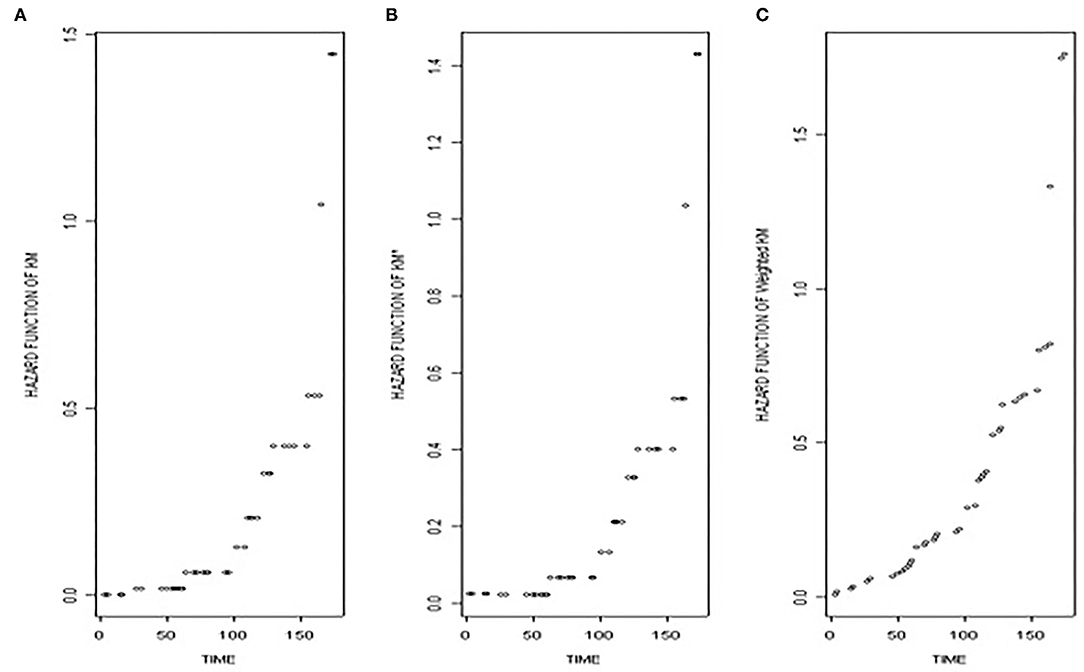
Figure 1. This figure shows the (A) the hazard function based on Kaplan–Meier survival function, (B) the hazard function based on the shrunken Kaplan–Meier survival function, and (C) the hazard function based on the weighted Kaplan–Meier survival function against time.
Discussion
The Kaplan–Meier product limit estimator has become an important tool in the analysis of censored survival data. It is easy to compute and understand. For the variance of the Kaplan–Meier, Greenwood's and Peto's estimators are used, in case of low censoring, these methods give good results although, in case of moderate or heavy censoring, though they underestimate the true variance in the tails. To overcome these deficiencies, Borkowf proposed the regular and adjusted hybrid variance estimators for the Kaplan–Meier survival function. These methods also give the variances in those times where no event occurred. But for a small sample, in most of the cases, they give the larger variance and also adjusted hybrid method gives a variance greater than the binomial variance in case of no censoring. Moreover, in cases of relatively large sample sizes, it gives the smaller variance than the standard Greenwood's and Peto's variance on the right tail.
To overcome these difficulties, a weighted Kaplan–Meier survival function and its variance are proposed, which unlike the Kaplan–Meier and shrunken Kaplan–Meier functions gives the estimate of each point as well as the variance. It possesses all the characteristics of Kaplan–Meier and in case of no censoring, it is equal to Kaplan–Meier and has a binomial variance.
In case of very heavy censoring or complete censoring, the new method performs better than the others. In the latter case, adjusted hybrid variance is unable to provide the variance of the last censored observation, while the new method is able to provide it, along with the survival probabilities at each point.
In case small sample size with moderate censoring, the performance of the weighted variance is the same as that of the regular and adjusted hybrid variances, while in case of large sample size and heavy censoring it performs better than the others.
If the initial times are censored then the weighted method describes the pattern of the curve in more detail compared to the curves based on the Kaplan–Meier survival function and shrunken Kaplan–Meier function, respectively.
If the dataset does not contain any censoring time then the weighted Kaplan–Meier and weighted variance reduced to the complement of empirical distribution and the variance becomes simply the binomial variance, as in the traditional method. Nonetheless, the variance of adjusted hybrid variance remains larger than the others.
The performance of Peto is also improved by using the weighted Kaplan–Meier survival function, while considering it in the Greenwood formula does not improve the results. In contrast, taking the Kaplan–Meier survival function and shrunken Kaplan–Meier function and combining them with the weighted variance, they perform much better in all situations. This combination behaves according to the situation, whether there is no censoring, moderate censoring, or heavy censoring. Moreover, it is suitable for all sample sizes.
In summary, the weighted Kaplan–Meier estimator gives more detailed information about the pattern of the data in case of low, moderate, and heavy censoring and also if the initial observations are censored. In case of small samples, the weighted, regular, and adjusted hybrid variances can be used depending on the circumstances and the pattern of censoring. In any situation whether there is no, low, moderate, or heavy censoring, the adjusted hybrid method gives a larger variance than the Greenwood's and Peto's for a very small sample. This is most marked on the left tail in case of censoring. When there is no censoring, though, the variance is always greater than the binomial variance. In contrast to this, the weighted method behaves accordingly to the situation.
Data Availability Statement
The raw data supporting the conclusions of this article will be made available by the authors, without undue reservation.
Author Contributions
All authors listed have made a substantial, direct, and intellectual contribution to the work and approved it for publication.
Conflict of Interest
The authors declare that the research was conducted in the absence of any commercial or financial relationships that could be construed as a potential conflict of interest.
Publisher's Note
All claims expressed in this article are solely those of the authors and do not necessarily represent those of their affiliated organizations, or those of the publisher, the editors and the reviewers. Any product that may be evaluated in this article, or claim that may be made by its manufacturer, is not guaranteed or endorsed by the publisher.
Acknowledgments
FZ would like to thank Prince Sultan University for paying publication charges and their support through the TAS Research Lab.
Supplementary Material
The Supplementary Material for this article can be found online at: https://www.frontiersin.org/articles/10.3389/fpubh.2022.793648/full#supplementary-material
References
1. PROPHET StatGuide: Do your Data Violate Kaplan-Meier Assumptions? Available online at: www.basic.nwu.edu/statguidefiles/kaplan_ass_viol.html (accessed february 20, 1997).
2. Kaplan EL, Meier P. Nonparametric estimation from incomplete observations. J Am Stat Assoc. (1958) 53:457–81. doi: 10.1080/01621459.1958.10501452
3. Greenwood Major. A report on the natural duration of cancer. In Reports on Public Health and Medical Subjects. London; His Majesty's Stationery Office (1926).
4. Peto R, Pike MC, Armitage P, Breslow NE, Cox DR, Howard SV, et al. Design and analysis of randomized clinical trials requiring prolonged observation of each patient. II Analysis and examples. Br J Cancer. (1977) 35:1–39. doi: 10.1038/bjc.1977.1
5. Borkowf CB. A simple hybrid variance estimator for the Kaplan-Meier survival function. Stat Med. (2005) 24:827–51. doi: 10.1002/sim.1960
6. Meier P, Karrison T, Chappell R, Xie H. The Price of Kaplan-Meier. J Am Stat Assoc. (2004) 99:890–6. doi: 10.1198/016214504000001259
7. Collet D. Modelling Survival Data in Medical Research 1st ed. Chapman & Hall/CRC: Boca Raton (1994).
Keywords: Kaplan-Meier, survival analysis, adjusted hybrid variance estimators, leukemia, thalassaemia, cancer, oncology
Citation: Khan HN, Zaman Q, Azmi F, Shahzada G and Jakovljevic M (2022) Methods for Improving the Variance Estimator of the Kaplan–Meier Survival Function, When There Is No, Moderate and Heavy Censoring-Applied in Oncological Datasets. Front. Public Health 10:793648. doi: 10.3389/fpubh.2022.793648
Received: 12 October 2021; Accepted: 05 January 2022;
Published: 26 May 2022.
Edited by:
Rumen Stefanov, Plovdiv Medical University, BulgariaReviewed by:
Sohail Akhtar, The University of Haripur, PakistanYousaf Hayat, The University of Agriculture, Pakistan
Copyright © 2022 Khan, Zaman, Azmi, Shahzada and Jakovljevic. This is an open-access article distributed under the terms of the Creative Commons Attribution License (CC BY). The use, distribution or reproduction in other forums is permitted, provided the original author(s) and the copyright owner(s) are credited and that the original publication in this journal is cited, in accordance with accepted academic practice. No use, distribution or reproduction is permitted which does not comply with these terms.
*Correspondence: Habib Nawaz Khan, aGFiaWJuYXdhemJudUBnbWFpbC5jb20=