 Xuecan Guo1†Ruiyu Chai1†
 Yan Yao1Yanbiao Mi2Yingshuang Wang1Tianyu Feng1Junwei Tian2Bocheng Shi2Jiwei Jia2,3*
 Siyu Liu1*
- 1Department of Epidemiology and Biostatistics, School of Public Health, Jilin University, Changchun, China
- 2Department of Computational Mathematics, School of Mathematics, Jilin University, Changchun, China
- 3Jilin National Applied Mathematical Center, Jilin University, Changchun, China
Background: The COVID-19 has been spreading globally since 2019 and causes serious damage to the whole society. A macro perspective study to explore the changes of some social-related indexes of different countries is meaningful.
Methods: We collected nine social-related indexes and the score of COVID-safety-assessment. Data analysis is carried out using three time series models. In particular, a prediction-correction procedure was employed to explore the impact of the pandemic on the indexes of developed and developing countries.
Results: It shows that COVID-19 epidemic has an impact on the life of residents in various aspects, specifically in quality of life, purchasing power, and safety. Cluster analysis and bivariate statistical analysis further indicate that indexes affected by the pandemic in developed and developing countries are different.
Conclusion: This pandemic has altered the lives of residents in many ways. Our further research shows that the impacts of social-related indexes in developed and developing countries are different, which is bounded up with their epidemic severity and control measures. On the other hand, the climate is crucial for the control of COVID-19. Consequently, exploring the changes of social-related indexes is significative, and it is conducive to provide targeted governance strategies for various countries. Our article will contribute to countries with different levels of development pay more attention to social changes and take timely and effective measures to adjust social changes while trying to control this pandemic.
Introduction
The outbreak of COVID-19 has been accompanied by an exponential increase of new infections and a growing death count. The WHO has reported over 440 million diagnosed infections, and more than 5.98 million patients lost their lives worldwide as of 6 March 2022 (1). This sudden pandemic has hit the medical assistance systems of many countries hard and has disrupted the normal public order (2).
Many countries made different containment and targeting strategies (3), and country-based mitigation measures will influence the occurrence and development of COVID-19 (4). When it comes to public hygiene interventions, Hong Kong, which is more liberal, trends to voluntary and stepwise action instead of implemented strict compulsory testing and isolation (5). Meanwhile, the Austrian government is revising and submitting a bill to force all residents to receive COVID-19 vaccine in order to reduce the risk of infection and the spread of the disease (6). The Changning District of Shanghai has mainly adopted some strategies to prevent and control COVID-19, such as focusing on key populations and key areas, standardizing the workflow, and investigation and closed-loop management to control new cases (7). The Ethiopian government made tremendous efforts to control COVID-19, such as limiting public gathering, closing borders, and restricting transportation (8). Certainly, the degrees of severity of the pandemic in different countries vary. It is mostly dependent on government policies, detection intensity, mass awareness of prevention, vaccination status, medical facilities, traffic propagation rate, and supervision (9–11).
As one of the most severe pandemics in the last eight decades, there is a link between the grave circumstances of COVID-19 and diverse societal levels. The impact of COVID-19 on the economy should be recognized. There is a drastic effect on the worldwide economy, with an estimated loss of more than 1 trillion dollars (12). Some researchers claimed that the effect of this pandemic on sector fluctuations was greater than the global financial crisis (13). In terms of quality of life, Chinese researchers confirmed that COVID-19 has aggravated mild stress, but improved social and family support for residents (14). Research on Korean adults shows that their lifestyle has changed and that their daily activities are restricted. In addition, the quality of life and mental health declined (15). The epidemic has a greater impact on children and adolescents in Germany, especially minors in families with difficult domestic life or immigrant background (16). The control of COVID-19 is also closely related to the medical supplies and treatment services. The rapid establishment of the Fire God Mountain hospital and the Thunder God Mountain hospital had provided patients with timely suitable rescue and treatment environments in Wuhan, China (17). The challenges and pressing actions for the United States especially highlights the problem of continuous improvement and optimization of the supply chain of health care in the United States (18). In addition to reducing disease transmission, COVID-19 mitigation strategies have also reduced urban road traffic, resulting in indirect benefits air quality, traffic noise, and accidents (19). To slow down the transition, most countries recommended that people reduced aggregation activities. Some countries even released prisoners by means of parole and probation. However, it would lead to a degree of destruction of social security and stability (20).
We select nine social-related indexes from NUMBEO. These indexes include quality of life index, climate index, health care index, safety index, cost of living index, and so forth. We utilize the time series model (21). The differences between the forecast and actual values of 2020 mid-year are predicted and compared. The D-value (the forecast of 2020 mid-year minus actual values of 2020 mid-year) of nine indexes are calculated. The cumulative incidence (CuI) and the score COVID-safety-assessment (SCSA) of selected country are collected. Correlation analyses between these two variables and the D-value are performed. It is valuable that we analyze the social conditions of many countries from a macro perspective about COVID-19. Countries with different development levels are facing diverse situations. No matter to what extent the COVID-19 is, the impacts of COVID-19 and the changes in social-related aspects should not be ignored. We aim to find out which index in countries is more affected by COVID-19. This will help countries with different levels of development pay more attention to social changes and take timely and effective measures to adjust social changes while trying to control this pandemic. Moreover, social stability is more conducive to the implementation of epidemic prevention and control work.
Materials and Methods
Nine Indexes of 52 Countries
We first searched for relevant social news and relevant social indicators through Google, Baidu, and other websites. After information screening, we initially selected the NUMBEO website. NUMBEO was quoted by numerous newspapers, magazines, and blogs [e.g., Time, BBC, People (China, in Chinese), and so on]. Then, after consulting relevant literature, we finally decided to select the NUMBEO website (22, 23). NUMBEO is the world's largest cost of living database. It is also a crowd-sourced global database of quality-of-life information that includes perceived crime rates, quality of health care, and pollution index, among many other statistics. The detailed introduction of each index was shown in Supplementary Table 1. It contributed data about cities and countries worldwide. The data provided by the website is public and can be downloaded directly without processing. We collected data published from 2014 to 2020 (24). After deleting countries with nine missing indexes and combining the national information provided in the data of SCSA, we finally selected 52 countries, including nine indexes, and SCCA data.
Cumulative Incidence
The cumulative confirmed number of COVID-19 cases of 52 countries were obtained from Netease website from the first reported case to 1 July 2020 (25). The data from the Netease website were from official and media reports of various countries and regions. We collected the total population of the selected countries (26) to calculate cumulative incidence that indicated the severity of the epidemic.
SCSA
The data of SCSA was from the COVID-19 Regional Safety Assessment. It included Big Data Analysis of 200 Countries, Regions, and Territories that were published by the Deep Knowledge Group (27). The SCSA was based on the analysis of 130 quantitative and qualitative parameters and 11,400 data from 200 COVID-19 endemic countries around the world in June by the deep knowledge group.
D-Value
The D-value of nine indexes is the forecast of 2020 mid-year minus actual values of 2020 mid-year.
D-value = (the forecast values of 2020 mid-year) - (the actual values of 2020 mid-year).
Statistical Methods
Time Series Models
The time series model tries to predict unknown data by modeling historical surveillance data (28–30). To solve the problem of data with a long time span and small quantity, several time series models, including the naive, simple average, and exponential smoothing, were employed in this study. The Naive method is suitable for data with high stability. The simple average method fits data with more stability. The exponential smoothing is suitable for forecasting data with no trend or seasonal pattern. A major advantage of these three methods was that they were suitable for processing simple and stable data in line with the characteristics of the data we collected (Supplementary Figure 1 and Supplementary Table 2). The mathematical formulas were expressed as follows:
where Ft1 is the forecast value at the t moment and At1−1 is the actual value at the moment of t1-1;
where Ft2 is the forecast value at the t2 moment, i is the corresponding moment, n is the number of data, and At2−1 is the actual value at the moment of t2-1;
where Ft3 is the forecast value at the t moment, At3−1 is the actual value at the moment of t3-1, Ft3−1 is the forecast value at the moment of t3-1, At3−1 is the actual value at the moment of t3-1, and α smoothing coefficient whose value is between 0 and 1.
Based on the data of nine indexes of 52 countries from 2014 to 2019, we used three methods to predict 2020 data. By comparing the actual and forecast value in 2020, we selected the optimal model according to the root mean squared error (RMSE) to forecast the corresponding value in mid-year of 2020. Through comparing the difference between forecast and actual values in mid-year 2020, we used a paired-sampled T-test to find the indexes that were affected during COVID-19 pandemic.
K-Means Clustering Algorithm
To cluster the 52 countries and further explore the impact of COVID-19 on social-related indexes, we used the k-means clustering algorithm. The variables used to create patterns were the differences among these nine indexes and whether the countries were developed.
Bivariate Statistical Analysis
We used the parametric test, Mann-Whitney U-test, and Pearson correlation analysis to find the indexes affected by COVID-19. All statistical analysis were performed by the Python (Version 3.7.9). The significance level set with p-value < 0.05.
Results
Forecasting the Nine Indexes Using the Naive Model
The RMSE values of different methods were compared to judge the error of prediction effect. The naive method showed the best RMSE value. Hence, the naive method was the best model among the three time series models for our data. The results of RMSE of three methods are shown in Table 1. We used the naive model to forecast the nine indexes of the 52 countries (Supplementary Figure 1 and Supplementary Table 2). It could be observed from Table 2 that there was no significance between the actual and forecast value in 2020 of Climate Index (CI), Cost of Living Index (CLI), Health Care Index (HCI), Pollution Index (PI), and Traffic Commute Time Index (TCTI). Therefore, it can be said that COVID-19 has little impact on these indexes. There was significance in Quality-of-Life Index (QLI), Property Price to Income Ratio Index (PPIRI), Purchasing Power Index (PPI), and Safety Index (SI), indicating that during the COVID-19 pandemic, QLI, PPI, and SI were decreased, while PPIPI was increased.
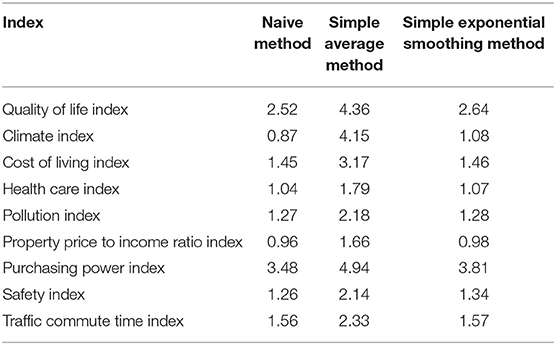
Table 1. Error measures obtained under the three time series models.
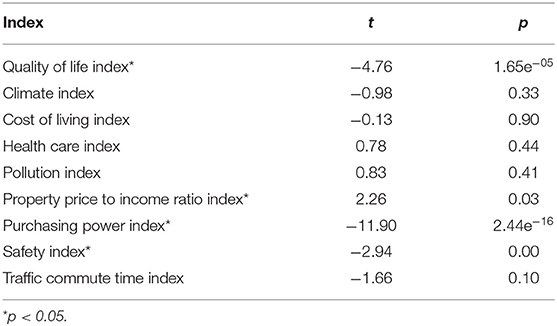
Table 2. The results of paired Student's T-test for each index.
K-Means Analysis of the Data
It could be noticed from the results that there were 24, 26, and two countries in Cluster, ClusterII, and Cluster III, respectively. The three Clusters showed different characteristics. In Cluster I, the characteristics of the 24 developing countries were the decline of CLI and CI, and the increase of PI. Except for Croatia, all 25 countries in Cluster II were developed. In addition, developed countries had characteristics of having an increase of HCL and a decline of QLI and SI. Cluster III only included Poland and Chile, which had a decline of PPI and an increase of PPIRI and PI (Table 3 and Figure 1).
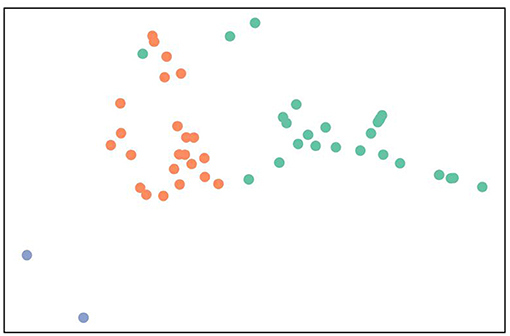
Figure 1. Visual clustering map of 52 countries. Cluster I, Cluster II, and Cluster III was indicated by soft orange dots, lime green, and slightly blue, respectively.
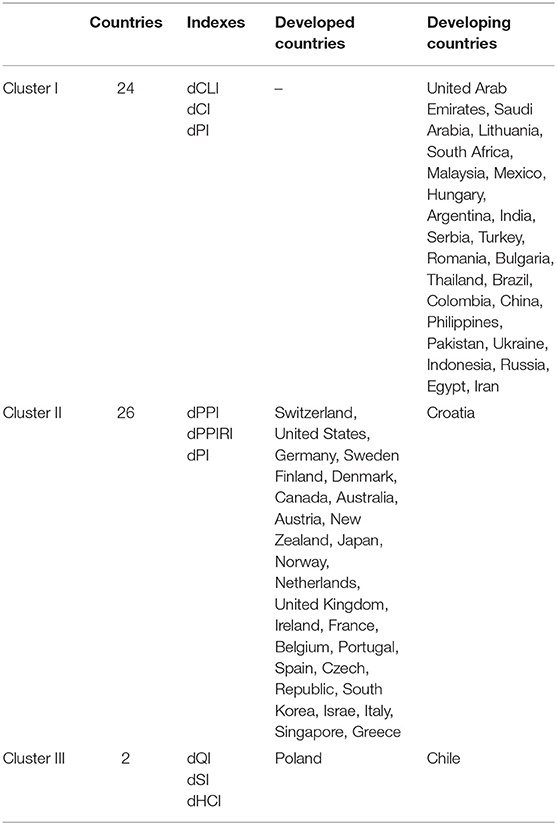
Table 3. Clustering of 52 countries.
Differences in Nine Indexes Between Developing and Developed Countries
Testing the normality of nine indexes, the distributions of the Difference of Climate Index (dCI) and the Difference of Property Price to Income Ratio Index (dPPIRI) is not normal. To analyze this problem, Mann-Whitney U test was used. The independent sample t-test was used to analyze the other seven indexes which were all subjected to normal distribution and variance homogeneity.
Compared with developed countries, under the influence of the COVID-19, the decline of QLI, PPI, and SI in developing countries were relatively small, while the decline of CLI in developing countries was large. The results showed that COVID-19 had a great impact on the QLI, PPI, and SI in developed countries, and a greater impact on CLI in developing countries (Table 4).
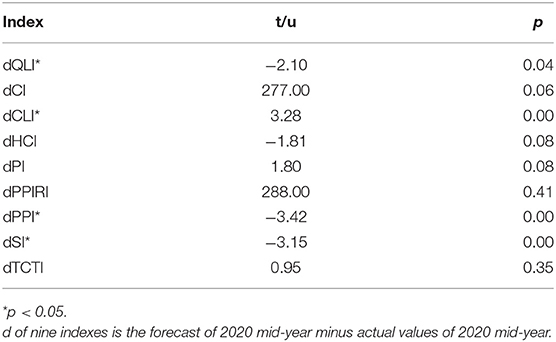
Table 4. Differences in nine indexes between developing and developed countries.
The Relationship of Nine Indexes Between Developing and Developed Countries
The severity of the pandemic was expressed by cumulative incidence. For developing countries, the hypothesis was tested with Pearson correlation statistics which showed that there was a significant relationship between the Difference of Cost-of-Living Index (dCLI) and cumulative incidence. The severity of the pandemic impacted on cost of living of residents. However, for developed countries, an inverse correlation between the Difference of Pollution Index (dPI) and cumulative incidence was observed (Table 5). Thus, it could be noted that climate conditions can affect the cumulative incidence.
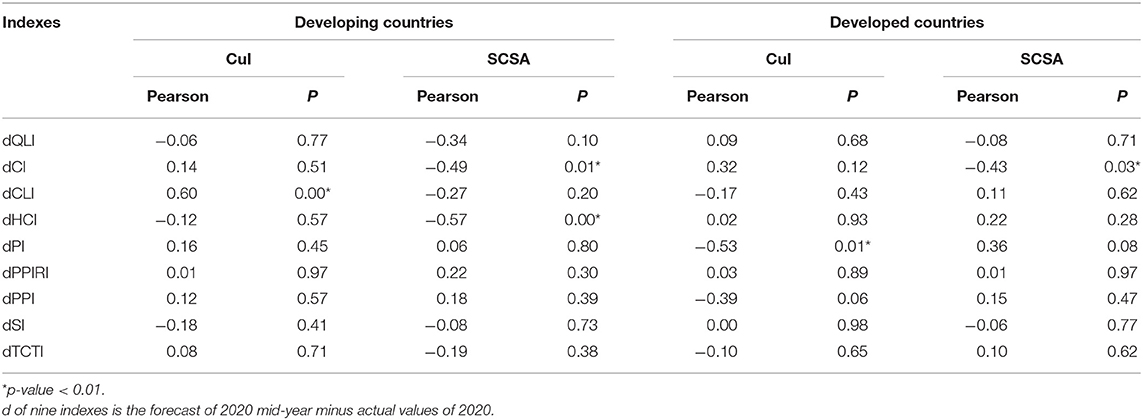
Table 5. The relationship between nine indexes, cumulative incidence, and the score COVID-safety assessment (SCSA) of countries.
The SCSA reflected the degree of control of the pandemic. For developing countries, there was a significant relationship between dCI, the Difference of Health Care Index (dHCI), and the SCSA. For developed countries, the link between dCI and the SCSA was statistically significant.
Discussion
Overall, in those countries affected by COVID-19, it can be considered that the quality of life of inhabitants has reduced, the purchasing power of residents of most countries has generally declined, and that the property price to income ratio has increased. Meanwhile, the safety of individuals is threatened (Table 2). From Figure 1 and Table 3, the outstanding feature of each cluster that we can find is the degree of national development. Developed and developing countries show different distribution. These features guide us to conduct further hierarchical analysis on the basis of the level of national development.
In this pandemic, developing countries are less affected in the quality of life, purchasing power, and safety than developed countries (Table 4). The quality of life of people in developed countries have reduced in such a large-scale pandemic. Research shows that young Americans expressed that there was a decline in the quality of life and an increase in psychiatric distress (31). In our results, the per capital purchasing power of developed countries has declined more significantly than that of developing countries. Of course, this is not the case for all developed countries. Another study stated that more support was urgently needed to alleviate the loss of COVID-19 on the more vulnerable people in consideration of the possible duration of social distancing measures and the associated economic impacts (32). This situation is worthy of the attention of the state aid agencies and psychological counseling departments. Contrary to our result, the safety of society in overall developed countries might be worse in these results (33, 34). The difference might be due to our overall comparative analysis of the selected developing and developed countries. Meanwhile, countries that are seriously affected by COVID-19 should pay more attention to social security. Residents should understand and cooperate with the relevant work of the government to put an end to social disorder and reactionary behavior. In our research, the cost of the living level of developing countries is more severely affected than in developed countries. It has been demonstrated that in developing countries, COVID-19 affected the food security status and the stability of food supply chains (35, 36). It is necessary for local governments to pay attention to the quality of living goods and materials with the aim of alleviate the cost of living of residents.
As shown in Table 5, we found that as of 1 July 2020, the COVID-19 notification information shows that in developing countries, the cumulative incidence is positively correlated with the difference of cost-of-living index. There is no doubt that the quality of life of residents have been affected, as it is reflected in medical services, life consumption, work, study, and so on. People in developing countries are faced with heavy loss of family income, affecting their living expenses and quality of life (37, 38). While trying to control the epidemic, relevant governments should also pay attention to the living conditions of all citizens and strive to provide appropriate help and psychological counseling for the people at the bottom of society. In our results, the SCSA is negatively correlated with the health care of residents in developing countries. SCSA is quantified by many aspects of assessment. Moreover, the level of health care could best reflect the SCSA. In India (39), hospital beds and medical equipment were overrun in the face of the huge number of patients infected with COVID-19. People at risk should have confidence and hope for more complete medical facilities. It is important to highlight that good weather conditions are particularly important for the governance and control of the pandemic in our results. Some researches for COVID-19 indicated that temperature, combined with humidity, were the vital risk factors (40, 41). This is consistent with our results. As for the relationship between the climatic conditions and the spread of the virus, it is obviously a huge problem, which is still worthy of further study.
The more developed countries do have better medical facilities and sufficient financial resources, but the degree of development does not mean that they have a faster response and better rational response attitude. In our research, developed countries with aggravated environmental pollution have a higher cumulative incidence (Table 5). There is reason to believe that air pollution has a negative effect of COVID-19 (42–44). Meanwhile, poorer climatic conditions often lead to poor control in countries affected by COVID-19 (45–47). Consequently, countries with better development have the reason to think highly of environmental sanitation in order to reply the diffuse of COVID-19.
Through this research direction and data characteristics, we aim to explore the impact of COVID-19 on social-related levels in lots of countries from a macro perspective. The purpose is not to find differences, but to find changes in types of social-related indexes to further guide the formulation of related strategies and measures. We hope that the pandemic can be triumphed as soon as possible worldwide.
Conclusion
We analyze the social conditions of many countries from a macro perspective. We utilize the three time series models to forecast values of 2020 mid-year. Then, by comparing the difference between the forecast and actual values, we aim to finding out which index in countries is more affected by COVID-19.
Our article will contribute to countries with different levels of development pay more attention to social changes and take timely and effective measures to adjust social changes while trying to control this pandemic. Moreover, it also will help countries to realize how social changes can emerge if measures regarding social changes and control pandemic crises are not effective and adjusted to the specific needs of the population.
Through our results, we find that COVID-19 has affected the lives of residents in many ways. On one hand, the quality of life, purchasing power, and safety of people have declined. On another, the property price to income ratio has risen. Our further research shows that the changes of social-related indexes in developed and developing countries are different, which is related to their epidemic control measures and severity. For developing countries, the higher CuI has a great impact on quality of life of residents, and the SCSA has a negative correlation with the health care situation. There is a correlation between CuI and environmental pollution during COVID-19. Last but not least, the influence of climate on the development and control of this pandemic deserves more detailed study. Consequently, exploring the changes of social-related indexes is significative, and it is conducive to provide targeted governance strategies for these countries affected by COVID-19.
There are limitations of this study to consider. First, in order to ensure the accuracy of the results and the reliability of the conclusions, the index data of some countries are relatively imperfect. We have to delete the countries where the data is missing and select 52 countries where the data is complete. Second, in this study, we find that climate index is related to the overall performance of epidemic control in both developed and developing countries. However, due to the different research focuses on this study, this important variable has not been further analyzed and discussed in detail. In the follow-up study, we hope to pay more attention to the influence of climate factors on the spread and control of COVID-19 and seek other databases and methods to specifically explore the economy, health care services, and other aspects of different countries are affected by COVID-19.
Data Availability Statement
The datasets presented in this study can be found in online repositories. The names of the repository/repositories and accession number(s) can be found in the article/Supplementary Material.
Author Contributions
XG, RC, JJ, and SL had the original idea for the study, and with all co-authors, carried out the design. YY provided valuable insight regarding the methodological approach and organization of the manuscript. YM carried out the statistical analysis. YW, TF, JT, and BS reviewed the consistency of data included in the article. XG and RC wrote the first draft of the manuscript, performed the interpretation of the results, and wrote the final version of article in collaboration with SL and JJ. All authors read and approved the final manuscript.
Funding
Our research was supported by National Natural Science Foundation of China (Grant No. 11901234), the Fundamental Research Funds for the Central Universities, JLU (Grant No. 93K172020K27), Natural Science Foundation of Jilin Province (Grant No. 20210101481JC), and Shanghai Municipal Science and Technology Major Project (Grant No. 2021SHZDZX0103).
Conflict of Interest
The authors declare that the research was conducted in the absence of any commercial or financial relationships that could be construed as a potential conflict of interest.
Publisher's Note
All claims expressed in this article are solely those of the authors and do not necessarily represent those of their affiliated organizations, or those of the publisher, the editors and the reviewers. Any product that may be evaluated in this article, or claim that may be made by its manufacturer, is not guaranteed or endorsed by the publisher.
Supplementary Material
The Supplementary Material for this article can be found online at: https://www.frontiersin.org/articles/10.3389/fpubh.2022.793176/full#supplementary-material
References
1. WHO. WHO Coronavirus Disease (COVID-19) Dashboard. [Internet]. Available online at: https://covid19.who.int/ (accessed March 6, 2022)
2. To KKW, Sridhar S, Chiu KHY, Hung DLL, Li X, Hung IFN, et al. Lessons learned 1 year after SARS-CoV-2 emergence leading to COVID-19 pandemic. Emerg Microbes Infect. (2021) 10:507–35. doi: 10.1080/22221751.2021.1898291
3. Liao H, Zhang L, Marley G, Tang W. Differentiating COVID-19 response. Strategies Innov. (2020) 1:100003. doi: 10.1016/j.xinn.2020.04.003
4. Middelburg RA, Rosendaal FR. COVID-19: how to make between-country comparisons. Int J Infect Dis IJID Off Publ Int Soc Infect Dis. (2020) 96:477–81. doi: 10.1016/j.ijid.2020.05.066
5. Tang TB. The COVID-19 response in Hong Kong. Lancet. (2022) 399:357. doi: 10.1016/S0140-6736(20)32217-0
6. King J, Ferraz OLM, Jones A. Mandatory COVID-19 vaccination and human rights. Lancet. (2022) 399:220–2. doi: 10.1016/S0140-6736(21)02873-7
7. He X, Jiang P, Wu Q, Lai X, Liang Y. Governmental Inter-sectoral strategies to prevent and control COVID-19 in a megacity: a policy brief from Shanghai, China. Front Public Heal. (2022) 10:764847. doi: 10.3389/fpubh.2022.764847
8. Mohammed H, Oljira L, Roba KT, Yimer G, Fekadu A, Manyazewal T. Containment of COVID-19 in Ethiopia and implications for tuberculosis care and research. Infectious Dis Pov. (2020) 9:131. doi: 10.1186/s40249-020-00753-9
9. Cheng ZJ, Zhan Z, Xue M, Zheng P, Lyu J, Ma J, et al. Public health measures and the control of COVID-19 in China. Clin Rev Allergy Immunol. (2021) 1–16. doi: 10.1007/s12016-021-08900-2
10. Lin S, Lin R, Yan N, Huang J. Traffic control and social distancing evidence from COVID-19 in China. PLoS ONE. (2021) 16:e0252300. doi: 10.1371/journal.pone.0252300
11. Asamoah JKK, Okyere E, Abidemi A, Moore SE, Sun GQ, Jin Z, et al. Optimal control and comprehensive cost-effectiveness analysis for COVID-19. Results Phys. (2022) 33:105177. doi: 10.1016/j.rinp.2022.105177
12. Kabir M, Saqib MAN, Zaid M, Ahmed H, Afzal MS. COVID-19, economic. impact and child mortality: a global concern. Clin Nutr. (2020) 39:2322–3. doi: 10.1016/j.clnu.2020.05.027
13. Choi SY. Industry volatility and economic uncertainty due to the COVID-19. pandemic: evidence from wavelet coherence analysis. Financ Res Lett. (2020) 37:101783. doi: 10.1016/j.frl.2020.101783
14. Zhang Y, Ma ZF. Impact of the COVID-19 pandemic on mental health and quality of life among local residents in Liaoning province, China: a cross-sectional study. Int J Environ Res Public Health. (2020) 17:2381. doi: 10.3390/ijerph17072381
15. Park KH, Kim AR, Yang MA, Lim SJ, Park JH. Impact of the COVID-19, pandemic on the lifestyle, mental health, and quality of life of adults in South Korea. PLoS ONE. (2021) 16:e0247970. doi: 10.1371/journal.pone.0247970
16. Ravens-Sieberer U, Kaman A, Erhart M, Devine J, Schlack R, Otto C. Impact of the COVID-19 pandemic on quality of life and mental health in children and adolescents in Germany. Eur Child Adolesc Psychiatry. (2021) 1–11. doi: 10.1007/s00787-021-01726-5
17. Zhang Z, Yao W, Wang Y, Long C, Fu X. Wuhan and Hubei COVID-19 mortality analysis reveals the critical role of timely supply of medical resources. J Infec. (2020) 81:147–78. doi: 10.1016/j.jinf.2020.03.018
18. Mirchandani P. Health care supply chains: COVID-19 challenges and pressing actions. Annals Int Med. (2020) 173:300–1. doi: 10.7326/M20-1326
19. Rojas-Rueda D, Morales-Zamora E. Built environment, transport, and COVID-19: a review. Curr Environ Heal Rep. (2021) 8:138–45. doi: 10.1007/s40572-021-00307-7
20. Miller JM, Blumstein A. Crime, Justice & the COVID-19 pfandemic: toward a national research agenda. Am J Crim Justice. (2020) 45:1–10. doi: 10.1007/s12103-020-09555-z
21. Petropoulos F, Makridakis S, Stylianou N. COVID-19: Forecasting confirmed. cases and deaths with a simple time series model. Int J Forecast. (2022) 38:439–52. doi: 10.1016/j.ijforecast.2020.11.010
22. Stanciu MO. Imagine a indicelui calitii vieii din Romnia i Urbanul mare. Romnesc n Context Internaional Calitatea Vietii. (2018) 29:291–306.
23. Utami FD, Rahman DY, Margaretta DO, Sustini E, Abdullah M. Journal of King Saud University – science landscape geometry-based percolation of traffic in several populous cities around the world. J King Saud Univ - Sci. (2020) 32:2701–9. doi: 10.1016/j.jksus.2020.06.004
24. NUMBEO. Nine indexes [Internet]. Available online at: https://www.numbeo.com/common/ (accessed July 1, 2020).
25. Netease News. The cumulative confirmed number of the COVID-19 [Internet]. Available online at: https://wp.m.163.com/163/page/news/virus_report/index.html?_nw_=1& _anw_=1 (accessed July 1, 2020).
26. Worldometer. Total Population of 52 Countries [Internet]. Available online at: https://www.worldometers.info/ (accessed July 1, 2020).
27. Deep Knowledge Group. Regional Safety Assessmen [Internet]. Available online at: https://www.dkv.global/covid-safety-assessment-200-regions (accessed July 1, 2020).
28. Garg VKNK. Predicting the new cases of coronavirus [COVID-19 ] in India by using time series analysis as machine learning model in python. J Inst Eng Ser B. (2021) 102:1303–9. doi: 10.1007/s40031-021-00546-0
29. Ceylan Z. Estimation of COVID-19 prevalence in Italy, Spain, and France. Sci Total Environ. (2020) 729:138817. doi: 10.1016/j.scitotenv.2020.138817
30. Ding Y, Huang R, Shao N. Time series forecasting of US COVID-19. Transmission Altern Ther Health Med. (2021) 27:4–11.
31. Liu CH, Stevens C, Conrad RC, Hahm HC. Evidence for elevated psychiatric distress, poor sleep, and quality of life concerns during the COVID-19 pandemic among US young adults with suspected and reported psychiatric diagnoses. Psychiatry Res. (2020) 292:113345. doi: 10.1016/j.psychres.2020.113345
32. Wolfson JA, Leung CW. Food insecurity and COVID-19: disparities in early. Effects for US adults. Nutrients. (2020) 12:1648. doi: 10.3390/nu12061648
33. Campedelli GM, Aziani A, Favarin S. Exploring the immediate effects of COVID-19 containment policies on crime: an empirical analysis of the short-term aftermath in Los Angeles. Am J Crim Justice. (2020) 1–24:8. doi: 10.31219/osf.io/gcpq8
34. Halford E, Dixon A, Farrell G, Malleson N, Tilley N. Crime and coronavirus: social distancing, lockdown, and the mobility elasticity of crime. Crime Sci. (2020) 9:11. doi: 10.1186/s40163-020-00121-w
35. Bairagi S, Mishra AK, Mottaleb KA. Impacts of the COVID-19 pandemic on food prices: evidence from storable and perishable commodities in India. PLoS ONE. (2022) 17:e0264355. doi: 10.1371/journal.pone.0264355
36. Erokhin V, Gao T. Impacts of COVID-19 on trade and economic aspects of food security: evidence from 45 developing countries. Int J Environ Res Public Health. (2020) 17:5775. doi: 10.3390/ijerph17165775
37. Tran BX, Nguyen HT, Le HT, Latkin CA, Pham HQ, Vu LG, et al. Impact of COVID-19 on economic well-being and quality of life of the vietnamese during the national social distancing. Front Psychol. (2020) 11:565153. doi: 10.3389/fpsyg.2020.565153
38. Bong C-L, Brasher C, Chikumba E, McDougall R, Mellin-Olsen J, Enright A. The COVID-19 pandemic: effects on low- and middle-income countries. Anesth Analg. (2020) 131:86–92. doi: 10.1213/ANE.0000000000004846
39. Andrade C. COVID-19: humanitarian and health care crisis in a third world country. J Clin Psychiatry. (2020) 81:13383. doi: 10.4088/JCP.20com13383
40. Shi P, Dong Y, Yan H, Zhao C, Li X, Liu W, et al. Impact of temperature on the dynamics of the COVID-19 outbreak in China. Sci Total Environ. (2020) 728:138890. doi: 10.1016/j.scitotenv.2020.138890
41. Martins LD, da Silva I, Batista WV, de Fátima Andrade M, Dias de. Freitas E, Martins JA. How socio-economic and atmospheric variables impact COVID-19 and Influenza outbreaks in tropical and subtropical regions of Brazil. Environ Res. (2020) 191:110184. doi: 10.1016/j.envres.2020.110184
42. Razzaq A, Sharif A, Aziz N, Irfan M, Jermsittiparsert K. Asymmetric link between environmental pollution and COVID-19 in the top ten affected states of US: a novel estimations from quantile-on-quantile approach. Environ Res. (2020) 191:110189. doi: 10.1016/j.envres.2020.110189
43. Bashir MF, Ma BJ, Bilal, Komal B, Bashir MA, Farooq TH, et al. Correlation between environmental pollution indicators and COVID-19 pandemic: a brief study in Californian context. Environ Res. (2020) 187:109652. doi: 10.1016/j.envres.2020.109652
44. Liang D, Shi L, Zhao J, Liu P, Schwartz J, Gao S, et al. Urban air pollution. May Enhance COVID-19 case-fatality and mortality rates in the United States medRxiv : the preprint server for health sciences. medRxiv. (2020). doi: 10.1101/2020.05.04.20090746
45. Cacho PM, Hernández JL, López-Hoyos M, Martínez-Taboada VM. Can climatic factors explain the differences in COVID-19 incidence and severity across the Spanish regions?: an ecological study. Environ Health. (2020) 19:106. doi: 10.1186/s12940-020-00660-4
46. Bashir MF, Ma B, Bilal, Komal B, Bashir MA, Tan D, et al. Correlation between climate indicators and COVID-19 pandemic in New York, USA. Sci Total Environ. (2020) 728:138835. doi: 10.1016/j.scitotenv.2020.138835
Keywords: COVID-19, time series analysis, social-related Indexes, climate, k-means clustering algorithm
Citation: Guo X, Chai R, Yao Y, Mi Y, Wang Y, Feng T, Tian J, Shi B, Jia J and Liu S (2022) Comprehensive Analysis of the COVID-19: Based on the Social-Related Indexes From NUMBEO. Front. Public Health 10:793176. doi: 10.3389/fpubh.2022.793176
Received: 11 October 2021; Accepted: 11 March 2022;
Published: 28 April 2022.
Edited by:
Carla Sofia e Sá Farinha, New University of Lisbon, PortugalReviewed by:
Rohit Salgotra, Tel Aviv University, IsraelAnabela Coelho, Instituto Politécnico de Lisboa, Portugal
Copyright © 2022 Guo, Chai, Yao, Mi, Wang, Feng, Tian, Shi, Jia and Liu. This is an open-access article distributed under the terms of the Creative Commons Attribution License (CC BY). The use, distribution or reproduction in other forums is permitted, provided the original author(s) and the copyright owner(s) are credited and that the original publication in this journal is cited, in accordance with accepted academic practice. No use, distribution or reproduction is permitted which does not comply with these terms.
*Correspondence: Jiwei Jia, Smlhaml3ZWlAamx1LmVkdS5jbg==; Siyu Liu, bGl1c2l5dUBqbHUuZWR1LmNu
†These authors have contributed equally to this work and share first authorship