 Xusen Zou1†
 Runchen Wang2,3†Zhao Yang4†Qixia Wang2,3†Wenhai Fu2,5†
 Zhenyu Huo2,3Fan Ge2,5
 Ran Zhong2Yu Jiang2,3Jiangfu Li2
 Shan Xiong2
 Wen Hong1*
 Wenhua Liang2*
- 1South China University of Technology, School of Public Administration, Guangzhou, China
- 2Department of Thoracic Oncology and Surgery, China State Key Laboratory of Respiratory Disease and National Clinical Research Center for Respiratory Disease, the First Affiliated Hospital of Guangzhou Medical University, Guangzhou, China
- 3Nanshan School, Guangzhou Medical University, Guangzhou, China
- 4Peking University First Hospital, Beijing, China
- 5First Clinical School, Guangzhou Medical University, Guangzhou, China
Background: Family socioeconomic position (SEP) in childhood is an important factor to predict some chronic diseases. However, the association between family SEP in childhood and the risk of lung cancer is not clear.
Methods: A systematic search was performed to explore their relationship. We selected education level, socioeconomic positions of parents and childhood housing conditions to represent an individual family SEP. Hazard ratios (HRs) of lung cancer specific-mortality were synthesized using a random effects model. Two-sample Mendelian randomization (MR) was carried out with summary data from published genome-wide association studies of SEP to assess the possible causal relationship of SEP and risk of lung cancer.
Results: Through meta-analysis of 13 studies, we observed that to compared with the better SEP, the poorer SEP in the childhood was associated with the increased lung cancer risk in the adulthood (HR: 1.25, 95% CI: 1.10 to 1.43). In addition, the dose-response analysis revealed a positive correlation between the poorer SEP and increased lung cancer risk. Same conclusion was reached in MR [(education level) OR 0.50, 95% CI: 0.39 to 0.63; P < 0.001].
Conclusion: This study indicates that poor family socioeconomic position in childhood is causally correlated with lung cancer risk in adulthood.
Systematic Review Registration: identifier: 159082.
Background
The relationship between everyday-life situations in childhood and chronic diseases has received increased attention across a number of disciplines in recent years (1–4). In addition to the genetic effects, the effects of social environment in early life can also impact one's later life (5, 6). Early prediction of high incidence of lung cancer can play an important role in preventing lung cancer-specific death. Early detection and treatment of lung cancer is a promising strategy to reduce lung cancer mortality (7).
SEP is one of the interfering factors of health of family members (8, 9). Family SEP in childhood consists of many conditions, including years of schooling, parents' social status, childhood housing conditions and so on (10, 11). So far, family SEP in childhood is an increasingly important factor to predict chronic diseases. Multiple studies have indicated that there is an association between SEP and the risk of chronic disease (12–15). Some cohort studies have also demonstrated the impact of family SEP in childhood on adult risk of mortality and cancer incidence (16–29). Overall, poor SEP in early years has an impact on adult morbidity and mortality, especially in cardiovascular and gastrointestinal disorders (30, 31). However, there has been little reliable evidence that lung cancer in adulthood may be related to family SEP in childhood (32, 33).
In this study, we sought to investigate the association between SEP in childhood and lung cancer risk in adulthood. A meta-analysis with dose response and a two-sample Mendelian Randomization (MR) were performed using single or multiple single nucleotide polymorphisms (SNPs) as an instrument in instrumental variable analyses by studying known genetic determinants of the exposure variable of interest.
MR uses genetic variants as instrumental variables for assessing causal relationships from observational data (34) and is an established method for probing questions of causality in observational epidemiology (35). MR technique is being extensively applied to estimate the long-term causal effects of various exposures on clinical and epidemiological outcomes using observational data (36). MR is an established approach to evaluate the effect of an exposure on an outcome. Most importantly, unlike main effect MR studies, gene x environment interaction studies are susceptible to confounding factors (37).
Methods
Search Strategy and Inclusion Criteria
Two investigators (W.R., L.C.) independently searched, PubMed, Web of Science from their inceptions (1966 and 1947, respectively) to June 1, 2020, for cohort studies related to family SEP in childhood and lung cancer in adulthood, without language restrictions. Keywords used were “socioeconomic position (SEP)”, “cohort”, “lung cancer”, “risk”, as well as their Medical Subject Headings (MeSH) terms. Only papers published in English were included. Details of the search terms and inclusion/exclusion criteria are shown in Figure 1.
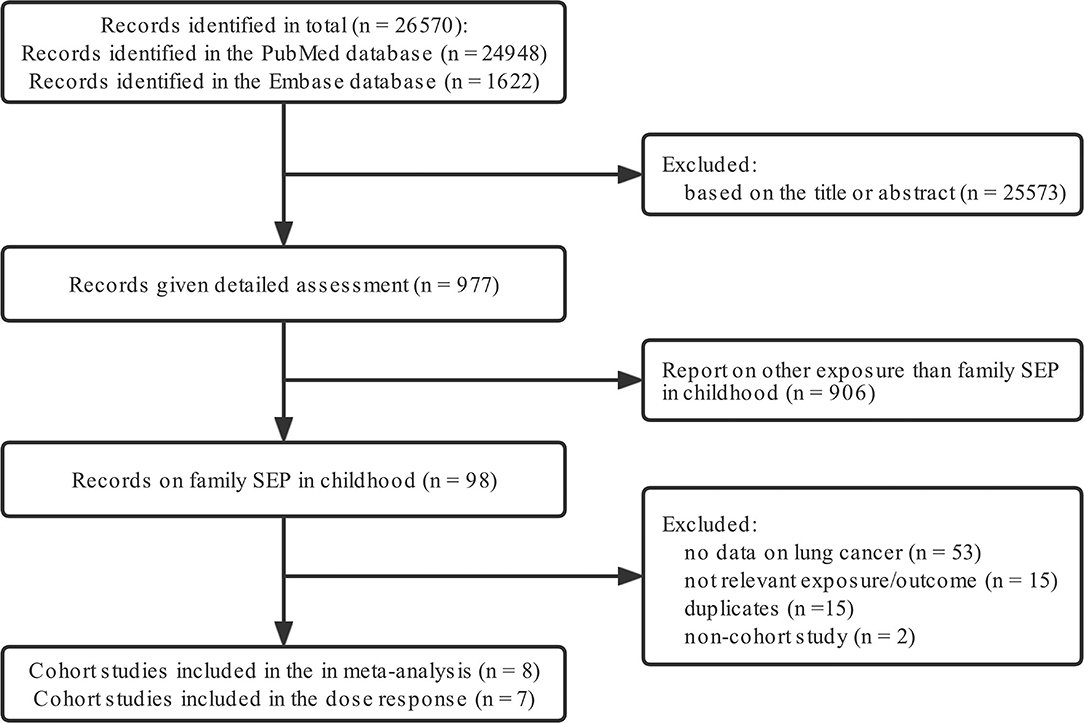
Figure 1. Flow diagram detailing the search strategy and identification of studies used in meta-analysis.
The inclusion criteria were: (i) cohort study design; (ii) all cases were lung cancer patients, and data were classified according to different SEP, regardless of subtypes of lung cancer; (iii) In addition, the exclusion criteria were: (i) small sample sizes; (ii) non-English publications; (iii) lack of data and necessary information for meta analysis or dose response analysis.
All the included studies were divided into two groups: (I) studies reported adjusted estimates of the hazard ratios (HR) (including relative risk and odds ratios) and 95% confidence interval (95% CI); (II) studies missed data mentioned above. We also included studies that graded data based on parents' financial status and family life in childhood, and overall impact. The quintile or quartile method was incorporated and the first level was used as the reference.
Data Acquisition Quality Assessment
Data were extracted by two investigators (W.R., H.Z.) independently, and any disagreements came to consensus after discussion. Basic data were recorded from all eligible studies, including the first author's name, publication year, country, study period, period of follow-up, number of lung cancer patients and HR with their 95% Cl. The results were reviewed by two senior investigators (L.W., H.J.).
Quality Assessment
The quality of the studies was evaluated using a score system that was designed with reference to the Newcastle-Ottawa Scale (NOS) tool (38–40). The system is based on a 0-9 points, with 9 reflecting the highest quality and 0 the lowest. Each point was allocated for the following: (I) representativeness of exposure arm(s), (II) selection of the comparative arm(s), (III) origin of exposure source, (IV) demonstration that outcome of interest was not present at start of study, (V) studies controlling the most important factors, (VI) studies controlling the other main factors, (VII) assessment of outcome with independency, (VIII) adequacy of follow-up length (to assess outcome), (IX) lost to follow-up acceptable (< 10% and reported).
Two researchers (W.R. and G.F.) independently evaluated the methodological quality of each included published cohort study. The results of the quality assessment were used for descriptive purposes, to provide an overall assessment of the quality of the included studies (38, 41–44).
A meta-analysis was performed following the Preferred Reporting Items for Systematic Reviews and Meta-analyses (PRISMA) guidelines and the study protocol of this study is 1,59,082 (45, 46). We collected study-specific HR with 95% Cl for lung cancer to combine the data. Through Cochran's I2 statistic, we examined the heterogeneity across studies and statistical heterogeneity was considered if an I2 statistic ≥ 50% (47). A random effect model was employed to synthesize hazard ratios (HRs) for lung cancer-specific mortality if high heterogeneity existed (p < 0.5, I2 > 50%), otherwise a fixed effect model was conducted.
We utilized Funnel plot tests, Begg's test and Egger's test to evaluate the publication bias (48–50). In addition, subgroup analysis was performed according to gender. Sensitivity analysis was conducted by excluding each study in turn to access the stability of results and potential sources of heterogeneity. All statistical manipulation was employed by Stata software (version 12, StataCorp, TX, USA). All P-values were 2-tailed; statistical significance was set at P-value < 0.05 (51).
The dose-response study was analyzed by Benchmark Dose Software 3.1.2(BMDS 3.1.2) (52). All steps were established under the BMDS guidelines (53–56). Multiple models were selected for analysis, including extra risk assumptions for background and a benchmark response of 5% (39, 40). According to the included studies, the dose response was divided into two categories: family economic status in childhood and childhood housing conditions. At the same time, according to the original data with or without adjustment, it was divided into adjusted and unadjusted group for subgroup analysis and publication bias analysis. In all dose-response models, we used Exponential models and Hill models as the main dose-response observation results, (57) while using other results for verification. Duplicate studies were excluded.
MR Analysis Using Summary Statistics
The MR method was based on the following three assumptions: (i) the instrumental variables are strongly associated with the family SEP in childhood; (ii) the instrumental variables affect cancer only through their effect on family SEP in childhood and not through any alternative causal pathway; and (iii) the instrumental variables are independent of any confounders (58, 59). To avoid the potential violation of the first assumption, we selected SNPs that meet the threshold of genome-wide significance (P < 5 × 10⁻⁸). Besides, we applied some methods including weighted median and MR–Egger to test the second assumption. Then we evaluated the directional pleiotropy based on the intercept obtained from the MR Egger analysis to satisfy the third assumption (60). We also performed a leave-one-out analysis in which we sequentially omitted one SNP at a time, to evaluate whether the MR estimate was driven or biased by a single SNP.
The analysis was conducted to estimate the effect of family SEP in childhood (X) on the risk of lung cancer (Y) using genetic variants (g), and the causal estimate is equal to Yg/Xg (61). For the association between genetic variants and family SEP in childhood (Xg), summary data were utilized from published Genome-Wide Association Studies (GWASs), (62–77) including Social Science Genetic Association Consortium (SSGAC) (1,060,068 individuals), MRC Integrative Epidemiology Unit (MRC-IEU) (2,49,790 individuals), UK Biobank (75,244 individuals) and Neale Lab (4,55,571 individuals) (Supplementary Table 1) (78–80). Summary statistics for the association between genetic variants and lung cancer (Yg) are from the International Lung Cancer Consortium (ILCCO) (27,209 individuals) (Supplementary Table 2) (69).
We selected uncorrelated variants to construct the instrumental variables in the two-sample MR analysis. Using both summary statistics for Yg and Xg, an Inverse Variance-Weighted (IVW) meta-analysis was employed to estimate the effect of genetically determined family SEP in childhood on the risk of lung cancer using the method of Burgess et al. (81):
where Xg is the beta estimate for the association between the SNP and family SEP in childhood, Yg is the beta estimate for the association between the SNP and lung cancer, and σYg is the standard error for Yg. Corresponding HR and 95% CIs were calculated using βIVW and se(βIVW).
In addition, MR-Egger and Weighted Median were also conducted to identify the causality. Ward ratio would only be observed when the first three models cannot be used due to lack of SNPs (82). Leave-one-out analysis was conducted to estimate whether the result was driven by a single SNP. MR-Egger regression was also performed to access the pleiotropy.
Results
Family Socioeconomic Position in Childhood and the Risk of Lung Cancer in Adulthood Observational Analyses
A total of eight cohort studies consisting of 2,779,242 cases were included in the final meta-analysis, (16, 17, 20, 23–28) and seven studies were included in the final dose-response analysis (16–22). The age of the included participants ranged from 14 to 74, the majority of the respondents were between the age of 30 to 64 with 2,413 respondents recorded to have died from lung cancer, details about patients characteristics of these studies can be seen in Supplementary Table 3. Supplementary Table 4 presented the result of the quality assessment. Results and study characteristics including name of first author, publication year, country or region, follow-up period, sample size and number of cases or deaths, type of outcome, gender, age range, HRs and 95% CIs were extracted and can be seen in Supplementary Table 5.
The results of quality assessment did not suggest any evidence of publication bias (Supplementary Figures 1, 2) [Unadjusted group: (Begg: 0.673; Egger: 0.182)]; [Adjusted group: (Begg:1; Egger:0.228)]. And sensitivity analysis was performed by sequentially excluding individual studies (Supplementary Figures 3, 4).
In unadjusted group, the pooled HR for family economy conditions with best family SEP in childhood group was 1.42 (95% CI, 1.21, 1.66) (I2 = 73.4%, P < 0.001) (Table 1, Figure 2). The risk was slightly lower than adjusted group: 1.25 (95% CI, 1.10, 1.42) (I2 = 48.9%, P = 0.04) (Table 1, Figure 3). Subgroup analysis based on sex using the provided adjusted original data resulted in a pooled HR of 1.09 (95% CI 0.95, 1.26) (I2 = 0.0%, p = 0.78) for male, a pooled HR of 1.10 (95%CI 0.88, 1.35) (I2 = 0.0%, p = 0.57) for female, and a pooled HR of 1.39 (95%CI 1.20, 1.62) (I2 = 48.9%, p = 0.04) for both sexes. Subgroup analysis based on sex that provided unadjusted original data resulted in a pooled HR of 1.52 (95% CI 1.13, 2.06) (I2 = 87.1%, p = 0.006) for male and a pooled HR of 1.28 (95%CI 1.07, 1.54) (I2 = 19.4%, p = 0.007) for female and a pooled HR of 1.63 (95%CI 1.15, 2.32) (I2 = 58.7%, p = 0.006) for both sexes. The above results was consistent in dose response used the model summary with BMR of 1 Std. Dev. including the family economic conditions of parents and childhood housing conditions (Supplementary Figure 5).
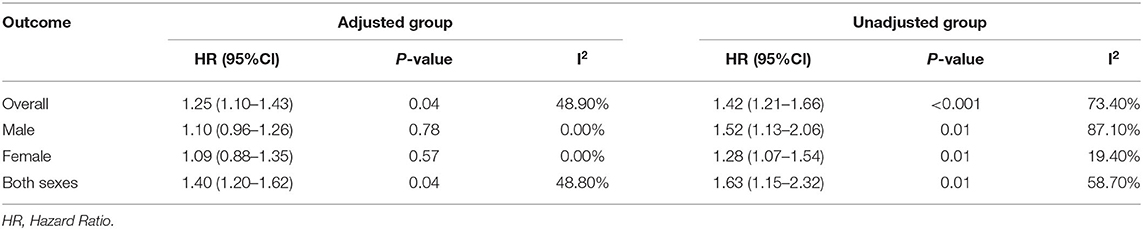
Table 1. Pooled estimates from random effects meta-analysis, expressing the HR of risk of lung cancer.
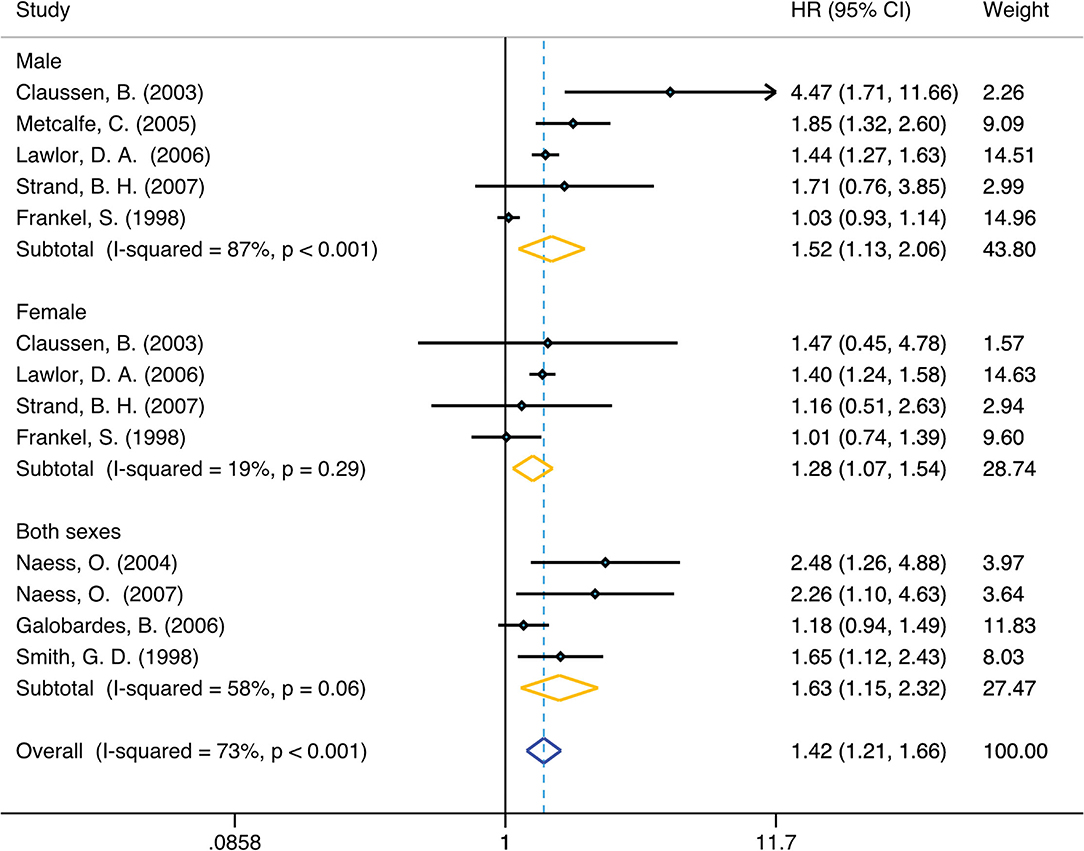
Figure 2. Forest plot of population-based cohort studies of family SEP and lung cancer, stratified by sex (unadjusted group).
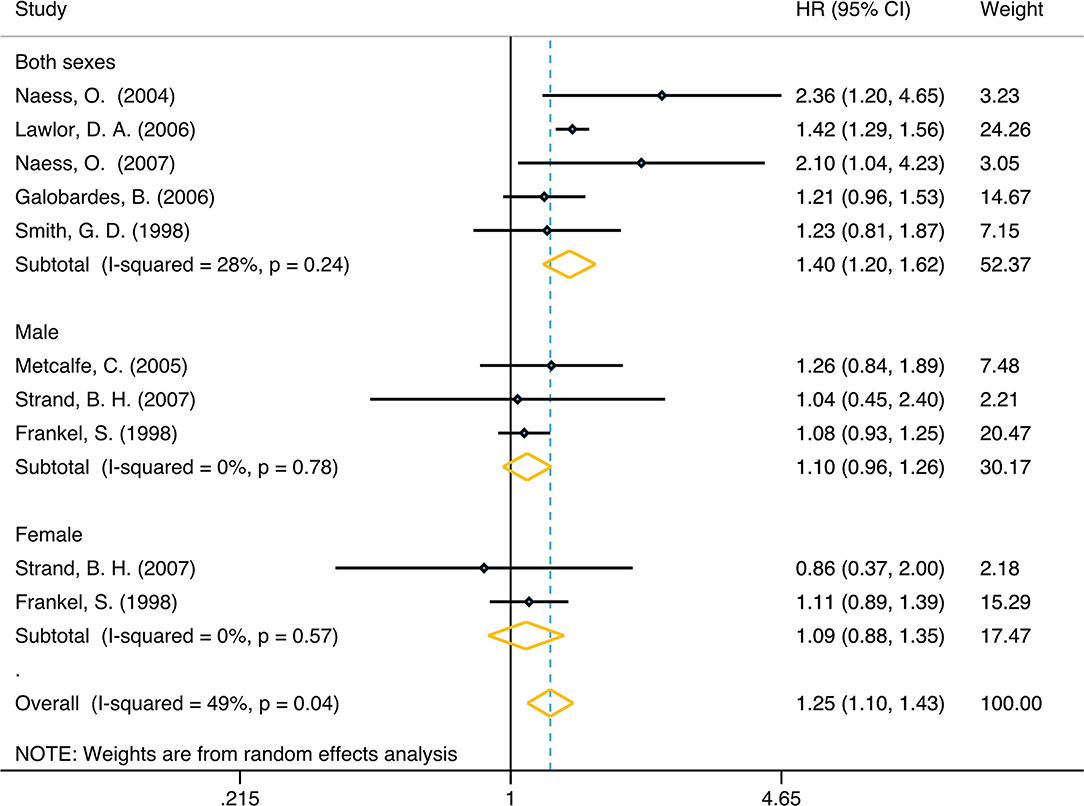
Figure 3. Forest plot of population-based cohort studies of family SEP and lung cancer, stratified by sex (adjusted group).
Genetically Determined Family SEP in Childhood Was Associated With Risk of Lung Cancer in Adulthood
Genetically predicted lower family SEP in childhood was associated with significantly higher odds of lung cancer (Table 2). The causal relationship between length of education and lung cancer was verified first. Using conventional MR analysis, one SD longer education was associated with a 50% lower risk of lung cancer (SSGAC 1: OR 0.50, 95% CI: 0.39, 0.63; P: 0.001). Another gene pool with the same exposure factor was also included for verification in our study, showing one SD longer education (genetic predisposition by 4 SNPs) was associated with a 60% lower risk of lung cancer (SSGAC 2: OR 0.40, 95% CI 0.32, 0.50; p: 0.001). With a sample size of 27 209, our sample provided sufficient statistical power (> 80%) to detect a causal effect of educational attainment on lung cancer. Power calculations on MR analysis were performed according to Brion et al. (83).
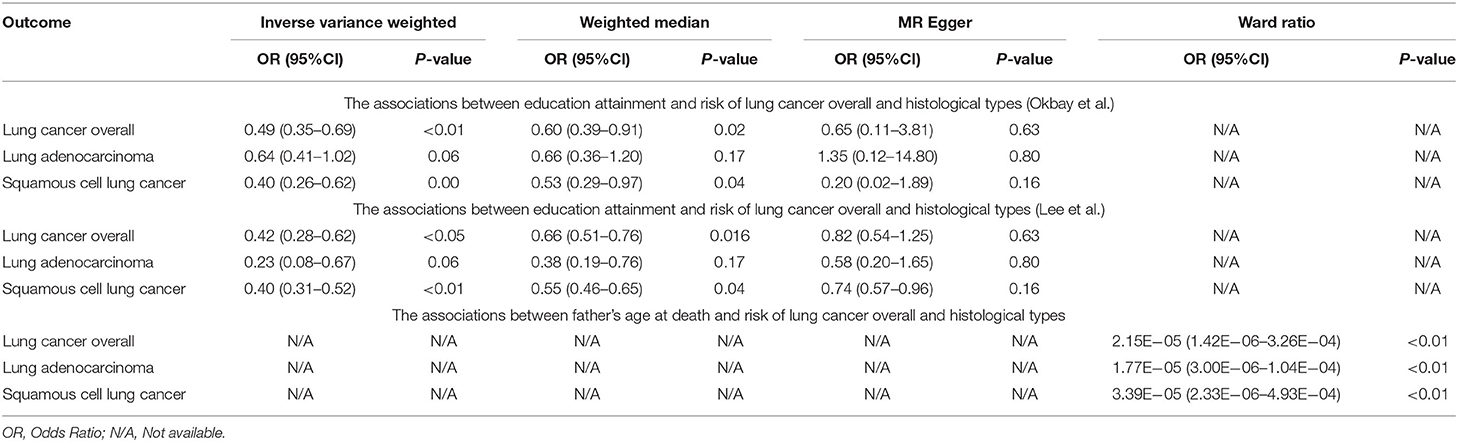
Table 2. Mendelian randomization estimates of the associations between family SEP in childhood and risk of lung cancer.
Meanwhile, associations were consistent in sensitivity analyses using weighted median (OR 0.57, 95% CI 0.45, 0.71; P: 0.001; Okbay et al.) (OR 0.58, 95% CI 0.48, 0.70; P < 0.001; Lee et al.) and MR-Egger method (OR 0.56, 95% CI 0.17, 1.88; P: 0.35; Okbay et al.) (OR 0.75, 95% CI 0.60, 0.94; P: 0.01; Lee et al.), but provided less precise estimates than with conventional MR (IVW method). Nonetheless, their causal estimates were similar in terms of direction and magnitude, and they were unlikely to occur by chance alone. These results were consistent with the hypothesis that genetic pleiotropy does not drive the result.
We also analyzed and observed the relationship between other exposure factors related to family SEP in childhood and lung cancer, and we found that the P-values for the intercept were large and the estimates adjusted for pleiotropy suggested null effects in four exposure factors: number of children fathered (Neale Lab): (OR 0.92, 95% CI: 0.29, 2.84; p: 0.88); mother's age at death (Neale Lab): (OR 1.00, 95% CI: 0.19, 5.26; p: 1.00); and average total household income before tax (MRC-IEU): (OR 0.90, 95% CI: 0.77, 1.04; p: 0.156). Nine out of the 15 independent exposure factor gene pools were unable to be analyzed due to the lack of SNPs corresponding to lung cancer.
Discussion
Based on data from 2,779,242 respondents, we observed that poorer family SEP in childhood means higher lung cancer risk in adulthood compared to controls. The overall dose-response of multiple models also demonstrated this trend. This phenomenon was partially verified by Mendelian randomization of two samples, but the causal relationship between some genes was still unclear. Through meta-analysis, we analyzed both the adjusted (age/adult social class) and unadjusted data, and strengthened the credibility by mutual authentication. The results showed a link between family SEP in childhood and the risk of lung cancer in adulthood in the unadjusted group.
People in poor family economic conditions were more likely to smoke, leading to a higher risk of lung cancer (84). Furthermore, the poor face a variety of problems that may pose other risks including malnutrition, violence, AIDS, and other infectious diseases, which also correlate with lung cancer risk (85, 86). The dose-response curve of family SEP in childhood also contribute to risk. Specifically, the lower the family economic conditions in childhood and the worse the childhood housing conditions, the more likely a person is to develop lung cancer in adulthood. This result has been verified in both the adjusted and unadjusted groups. We selected factors as comprehensive as possible to explore the relationship between family SEP in childhood and the risk of lung cancer in adulthood using two sample MR. Only the data from the official database were used, which made our data more reliable and useful. The results show that there is a clear causal relationship between the length of education and the occurrence of lung cancer. People with low education during childhood were more likely to smoke or be exposed to undesirable living environments, and lack relevant basic medical knowledge. Moreover, Children of parents who smoke perceived casual smoking to be safer and then reported wanting to smoke in response to smoking-related cues more than children of non-smoking parents (87). It should be noted that further research is needed to prove the relationship between father's age of death and lung cancer. On the one hand, although our results showed a strong correlation between SEP and the risk of lung cancer, only one SNP was included. This is too small to calculation of explained variance. This limited the representativeness of the result of father's death of age and lung cancer. On the other hand, early parental death, when a child experiences the loss of a parent before age 18, is one of the most severe stressors and a potential risk factor for adult psychopathology (88). It may cause an increased likelihood of poor habits, for example, smoking, which in turn lead to lung cancer. Worth mentioning, among the results related to education duration, the results of incorporating the genome determined by Okbay et al. were slightly different from the previous results of Zhou et al. (89). This may be explained by these observations: the statistical significance was set as P-value < 0.001 instead of 0.01 in the R package used for two-sample MR (34, 90). Because of this, the positive results of our study are more reliable. For the negative result in two-sample Mendelian randomization, we believe that further researcher is required to verify the result. Because the data of the SNPs in the existing studies are still limited, the final results of these studies have not yet been proven.
Three strengths of our study should be highlighted. First, to our knowledge, this is the most comprehensive meta-analysis estimating the relationship between family economic position in childhood and the risk of lung cancer in adulthood. The collection of such large sample data to assess the cancer risk for different family SEP in childhood around the world has not previously been performed. Second, we included adjusted and non-adjusted data for all-factors to mutually verify the dose-response of parents' socioeconomic status and family congestion in childhood. Third, this is the first study to explore the causal relationship between family SEP in childhood and the risk in adulthood by two sample MR. This research offered evidence for researcher focus on epidemiological characters in early detection of lung cancer and clinical staff of early diagnosis of lung cancer.
There are several limitations in our study. First, the studies included for meta-analysis and dose-response studies originated from the UK, Norway, and the Netherlands, there is the risk of introducing potentially heterogeneity. Second, because of the long-term follow-up needs of this study, included studies do not have data from recent years. Third, because the included cohort studies were all-factor epidemiological studies, subgroups of different lung cancer subtypes or specific age could not be established in the meta-analysis. Fourth, in terms of meta-analysis, due to the lack of subgroup data, the results obtained by the adjusted male and female subgroups were not statistically significant. Another potential limitation is that we only included common polymorphisms. Finally, although we have included many different exposure genes to build connections with lung cancer gene pool, some Mendelian randomization results are negative. However, limited SNPs of SEP can lead to false negative result. Further verification is needed to make a precise conclusion for the reason given above.
This research needs to be improved. Cohort results from other countries and expanded observations from lung cancer to all-factor risk are necessary for future studies. Genetic characteristics of continents other than Europe should also be included. Overall, our research confirms our conjecture: the family SEP in childhood is inversely proportional to the risk of lung cancer, which has a positive effect on the early diagnosis and intervention of lung cancer.
Conclusion
This study indicates that poor family SEP in childhood is a causal risk factor for lung cancer, and thus lung cancer screening should be more heavily considered for these populations. More research is needed to cross-validate these findings.
Data Availability Statement
The original contributions presented in the study are included in the article/Supplementary Material, further inquiries can be directed to the corresponding authors.
Author Contributions
XZ and RW: conceptualization and project administration. ZY, XZ, and RW: investigation. ZH, ZY, XZ, YJ, and RW: data curation. ZH: visualization and writing—review and editing. FG, XZ, and RW: formal analysis. FG, ZY, XZ, and RW: writing—original draft. RZ: methodology and software. JL: definition. JL and SX: validation. SX: supervision and funding acquisition. WH: resources. WH and ZH: writing—review and editing. All authors were involved in the conception and design of the study, critically reviewed, and approved the final manuscript.
Funding
This work was supported by the China National Science Foundation (Grant No. 81871893) and Key Project of Guangzhou Scientific Research Project (Grant No. 201804020030).
Conflict of Interest
The authors declare that the research was conducted in the absence of any commercial or financial relationships that could be construed as a potential conflict of interest.
Publisher's Note
All claims expressed in this article are solely those of the authors and do not necessarily represent those of their affiliated organizations, or those of the publisher, the editors and the reviewers. Any product that may be evaluated in this article, or claim that may be made by its manufacturer, is not guaranteed or endorsed by the publisher.
Acknowledgments
We sincerely thank all the medical staff who are fighting against this public health crisis.
Supplementary Material
The Supplementary Material for this article can be found online at: https://www.frontiersin.org/articles/10.3389/fpubh.2022.780538/full#supplementary-material
Supplementary Figure 1. Begg funnel plots of population-based cohort studies of family SEP and lung cancer (unadjusted group).
Supplementary Figure 2. Begg funnel plots of population-based cohort studies of family SEP and lung cancer (adjusted group).
Supplementary Figure 3. Sensitivity analysis of population-based cohort studies of family SEP and lung cancer (unadjusted group).
Supplementary Figure 4. Sensitivity analysis of population-based cohort studies of family SEP and lung cancer (adjusted group).
Supplementary Figure 5. Dose response of childhood housing conditions and lung cancer (adjusted group) (top left), family economic conditions and lung cancer (adjusted group) (top right), childhood housing conditions and lung cancer (unadjusted group) (bottom left), family economic conditions and lung cancer (unadjusted group) (bottom right).
Supplementary Table 1. Summary of identified MR gene bank of exposure.
Supplementary Table 2. Summary of identified MR gene bank of outcome.
Supplementary Table 3. Characteristic of the included studies in the meta-analysis.
Supplementary Table 4. The Newcastle-Ottawa quality assessment scale of including studies.
Supplementary Table 5. Data from included cohort studies.
Abbreviations
CI, Confidence interval; GWASs, Genome-wide association studies; HR, Hazard ratio; ILCCO, International Lung Cancer Consortium; IVW, Inverse Variance-Weighted; MeSH, Medical Subject Headings; MR, Mendelian randomization; OR, Odds ratios; RR, Relative risk; SCLC, Small cell lung cancer; SNP, Single-nucleotide polymorphism; TSMR, Two-sample Mendelian randomization; BMDS, Benchmark Dose Software.
References
1. Hertzman C. The biological embedding of early experience and its effects on health in adulthood. Ann N Y Acad Sci. (1999) 896:85–95. doi: 10.1111/j.1749-6632.1999.tb08107.x
2. Carey G, Crammond B. Systems change for the social determinants of health. BMC Public Health. (2015) 15:662. doi: 10.1186/s12889-015-1979-8
3. Blackwell DL, Hayward MD, Crimmins EM. Does childhood health affect chronic morbidity in later life? Soc Sci Med (1982). (2001). 52:1269–84. doi: 10.1016/S0277-9536(00)00230-6
4. Nordestgaard AT, Thomsen M, Nordestgaard BG. Coffee intake and risk of obesity, metabolic syndrome and type 2 diabetes. a Mendelian randomization study. Int J Epidemiol. (2015) 44:551–65. doi: 10.1093/ije/dyv083
5. Mackenbach JP, Kulhánová I, Bopp M, Deboosere P, Eikemo TA, Hoffmann R, et al. Variations in the relation between education and cause–specific mortality in 19 European populations a test of the “fundamental causes” theory of social inequalities in health. Soc Sci Med. (2015) 127:51–62. doi: 10.1016/j.socscimed.2014.05.021
6. Oates GR, Schechter MS. Socioeconomic status and health outcomes. cystic fibrosis as a model. Expert Rev Respir Med. (2016) 10:967–77. doi: 10.1080/17476348.2016.1196140
7. Yee J, Sadar MD, Sin DD, Kuzyk M, Xing L, Kondra J, et al. Connective tissue-activating peptide III. a novel blood biomarker for early lung cancer detection. J Clin Oncol. (2009) 27:2787–92. doi: 10.1200/JCO.2008.19.4233
8. Poulain T, Vogel M, Kiess W. Review on the role of socioeconomic status in child health and development. Curr Opin Pediatr. (2020) 32:308–14. doi: 10.1097/MOP.0000000000000876
9. Komulainen K, Mittleman MA, Jokela M, Laitinen TT, Pahkala K, Elovainio M, et al. Socioeconomic position and intergenerational associations of ideal health behaviors. Eur J Prev Cardiol. (2019) 26:1605–12. doi: 10.1177/2047487319850959
10. Moor I, Kuipers MAG, Lorant V., Pförtner T-K, Kinnunen JM, Rathmann K, Perelman J, Alves J, Robert P-O, Rimpelä A, et al. Inequalities in adolescent self–rated health and smoking in Europe comparing different indicators of socioeconomic status. J Epidemiol Community Health. (2019) 73:963–70. doi: 10.1136/jech-2018-211794
11. Adler NE, Boyce T, Chesney MA, Cohen S, Folkman S, Kahn RL, et al. Socioeconomic status and health. the challenge of the gradient. Am Psychol. (1994) 49:15–24. doi: 10.1037/0003-066X.49.1.15
12. Disano J, Goulet J, Muhajarine N, Neudorf C, Harvey J. Social-economic status and rates of hospital admission for chronic disease in urban Canada. Can Nurse. (2010) 106:24–9.
13. Kalyesubula R, Nankabirwa JI, Ssinabulya I, Siddharthan T, Kayima J, Nakibuuka J, et al. kidney disease in Uganda. a community based study. BMC Nephrol. (2017) 18:116. doi: 10.1186/s12882-017-0521-x
14. Forootan M, Bagheri N, Darvishi M. Chronic constipation. a review of literature. Medicine (Baltimore). (2018) 97:e10631. doi: 10.1097/MD.0000000000010631
15. Yankson R, Anto EA, Chipeta MG. Geostatistical analysis and mapping of malaria risk in children under 5 using point-referenced prevalence data in Ghana. Malar J. (2019) 18:67–67. doi: 10.1186/s12936-019-2709-y
16. Frankel S, Gunnell DJ, Peters TJ, Maynard M, Davey Smith G. Childhood energy intake and adult mortality from cancer. the boyd orr cohort study. Bmj. (1998) 316:499–504. doi: 10.1136/bmj.316.7130.499
17. Smith GD, Hart C, Blane D, Hole D. Adverse socioeconomic conditions in childhood and cause specific adult mortality. prospective observational study. Bmj. (1998) 316:1631–5. doi: 10.1136/bmj.316.7145.1631
18. Hart CL, Davey Smith G. Relation between number of siblings and adult mortality and stroke risk. 25 year follow up of men in the collaborative study. J Epidemiol Community Health. (2003) 57:385–91. doi: 10.1136/jech.57.5.385
19. Power C, Hypponen E, Smith GD. Socioeconomic position in childhood and early adult life and risk of mortality. a prospective study of the mothers of the (1958). British birth cohort. Am J Public Health. (2005) 95:1396–02. doi: 10.2105/AJPH.2004.047340
20. Galobardes B, Davey Smith G, Jeffreys M, McCarron P. Childhood socioeconomic circumstances predict specific causes of death in adulthood. the glasgow student cohort study. J Epidemiol Community Health. (2006) 60:527–9. doi: 10.1136/jech.2005.044727
21. de Kok IM, van Lenthe FJ, Avendano M, Louwman M, Coebergh JW, Mackenbach JP. Childhood social class and cancer incidence. results of the globe study. Soc Sci Med. (2008) 66:1131–9. doi: 10.1016/j.socscimed.2007.11.035
22. Dedman DJ, Gunnell D, Davey Smith G, Frankel S. Childhood housing conditions and later mortality in the boyd orr cohort. J Epidemiol Community Health. (2001) 55:10–5. doi: 10.1136/jech.55.1.10
23. Claussen B, Davey Smith G, Thelle D. Impact of childhood and adulthood socioeconomic position on cause specific mortality. the oslo mortality study. J Epidemiol Community Health. (2003) 57:40–5. doi: 10.1136/jech.57.1.40
24. Naess O, Claussen B, Davey Smith G. Relative impact of childhood and adulthood socioeconomic conditions on cause specific mortality in men. J Epidemiol Community Health. (2004) 58:597–8. doi: 10.1136/jech.2003.012229
25. Metcalfe C, Davey Smith G, Sterne JA, Heslop P, Macleod J, Hart CL. Cause-specific hospital admission and mortality among working men. association with socioeconomic circumstances in childhood and adult life, and the mediating role of daily stress. Eur J Public Health. (2005) 15:238–44. doi: 10.1093/eurpub/cki063
26. Lawlor DA, Sterne JA, Tynelius P, Davey Smith G, Rasmussen F. Association of childhood socioeconomic position with cause-specific mortality in a prospective record linkage study of 1,839,384 individuals. Am J Epidemiol. (2006) 164:907–15. doi: 10.1093/aje/kwj319
27. Naess O, Claussen B, Smith GD. Housing conditions in childhood and cause-specific adult mortality. the effect of sanitary conditions and economic deprivation on 55,761 men in Oslo Scand. J Public Health. (2007) 35:570–6. doi: 10.1080/14034940701320846
28. Strand BH, Kunst A. Childhood socioeconomic position and cause-specific mortality in early adulthood. Am J Epidemiol. (2007) 165:85–93. doi: 10.1093/aje/kwj352
29. Melchior M, Berkman LF, Kawachi I, Krieger N, Zins M, Bonenfant S, et al. Lifelong socioeconomic trajectory and premature mortality (35–65 years) in France. findings from the GAZEL cohort study. J Epidemiol Community Health. (2006) 60:937–44. doi: 10.1136/jech.2005.042440
30. Galobardes B, Smith GD, Lynch JW. Systematic review of the influence of childhood socioeconomic circumstances on risk for cardiovascular disease in adulthood. Ann Epidemiol. (2006). 16:2. doi: 10.1016/j.annepidem.2005.06.053
31. Vohra J, Marmot MG, Bauld L, Hiatt RA. Socioeconomic position in childhood and cancer in adulthood. a rapid-review. J. Epidemiol. Community Health. (2016) 70:629–34. doi: 10.1136/jech-2015-206274
32. Hrubá F, Fabiáová E, Bencko V, Cassidy A, Lissowska J, Mates D, et al. Socioeconomic indicators and risk of lung cancer in central and eastern Europe cen. Eur J Public Health. (2009) 17:115–21. doi: 10.21101/cejph.a3516
33. Sharpe KH, McMahon AD, McClements P, Watling C, Brewster DH, Conway DI. Socioeconomic inequalities in incidence of lung and upper aero-digestive tract cancer by age, tumour subtype and sex. a population-based study in Scotland (2000–2007). Cancer Epidemiol. (2012) 36:e164–e170. doi: 10.1016/j.canep.2012.01.007
34. Yavorska OO, Burgess S. Mendelian randomization. an R package for performing Mendelian randomization analyses using summarized data. Int J Epidemiol. (2017) 46:1734–9. doi: 10.1093/ije/dyx034
35. Bowden J, Del Greco M F, Minelli C, Davey Smith G, Sheehan NA, Thompson JR. Assessing the suitability of summary data for two-sample mendelian randomization analyses using MR-egger regression. the role of the I2 statistic. Int J Epidemiol. (2016) 45:1961–74. doi: 10.1093/ije/dyw220
36. Burgess S, Daniel RM, Butterworth AS, Thompson SG. Network mendelian randomization. using genetic variants as instrumental variables to investigate mediation in causal pathways. Int J Epidemiol. (2015) 44:484–95. doi: 10.1093/ije/dyu176
37. Tyrrell J, Wood AR, Ames RM, Yaghootkar H, Beaumont RN, Jones SE, et al. Gene-obesogenic environment interactions in the UK Biobank study. Int J Epidemiol. (2017) 46:559–75. doi: 10.1093/ije/dyw337
38. Stang A. Critical evaluation of the newcastle-ottawa scale for the assessment of the quality of nonrandomized studies in meta–analyses. Eur J Epidemiol. (2010) 25:603–5. doi: 10.1007/s10654-010-9491-z
39. Bogen KT. Generic hockey-stick model for estimating benchmark dose and potency. performance relative to BMDS and application to anthraquinone. Dose Response. (2011) 9:182–208. doi: 10.2203/dose-response.10-018.Bogen
40. Haber LT, Dourson ML, Allen BC, Hertzberg RC, Parker A, Vincent MJ, et al. Benchmark dose (BMD) modeling. current practice, issues, and challenges. Crit Rev Toxicol. (2018) 48:387–415. doi: 10.1080/10408444.2018.1430121
41. Friedemann Smith C, Tompson A, Holtman GA, Bankhead C, Gleeson F, Lasserson D, et al. General practitioner referrals to one–stop clinics for symptoms that could be indicative of cancer. a systematic review of use and clinical outcomes. Fam Pract. (2019) 36:255–61. doi: 10.1093/fampra/cmy069
42. Lo CK-L, Mertz D, Loeb M. Newcastle-ottawa Scale. comparing reviewers' to authors' assessments. BMC Med Res Methodol. (2014). 14:45. doi: 10.1186/1471-2288-14-45
43. Wang F-G, Yan W-M, Yan M, Song M-M. Outcomes of mini vs roux–en–Y gastric bypass. a meta–analysis and systematic review. Int J Surg. (2018). 56:7–14. doi: 10.1016/j.ijsu.2018.05.009
44. Suriyong P, Ruengorn C, Shayakul C, Anantachoti P, Kanjanarat P. Prevalence of chronic kidney disease stages 3-5 in low- and middle-income countries in Asia: A systematic review and meta-analysis. PLoS One. (2022). 17:e0264393. doi: 10.1371/journal.pone.0264393
45. Bernardo WM. PRISMA statement and PROSPERO. Int Braz J Urol. (2017) 43:383–4. doi: 10.1590/s1677-5538.ibju.2017.03.02
46. Selçuk AA. A Guide for systematic reviews. PRISMA Turk Arch Otorhinolaryngol. (2019) 57:57–8. doi: 10.5152/tao.2019.4058
47. Higgins JPT, Thompson SG, Deeks JJ, Altman DG. Measuring inconsistency in meta–analyses. BMJ. (2003) 327:557–60. doi: 10.1136/bmj.327.7414.557
48. Fan D, Liu L, Xia Q, Wang W, Wu S, Tian G, et al. Female alcohol consumption and fecundability a systematic review and dose–response meta–analysis. Sci rep. (2017) 7:13815. doi: 10.1038/s41598-017-14261-8
49. Lin L, Chu H. Quantifying publication bias in meta-analysis. Biometrics. (2018) 74:785–94. doi: 10.1111/biom.12817
50. Shi L, Lin L. The trim-and-fill method for publication bias. practical guidelines and recommendations based on a large database of meta-analyses. Medicine (Baltimore). (2019) 98:e15987. doi: 10.1097/MD.0000000000015987
51. Stroup DF, Berlin JA, Morton SC, Olkin I, Williamson GD, Rennie D, et al. Meta–analysis of observational studies in epidemiology. a proposal for reporting meta-analysis of observational studies in epidemiology (MOOSE) group. JAMA. (2000) 283:2008–12. doi: 10.1001/jama.283.15.2008
52. Jensen SM, Kluxen FM, Ritz C. A Review of recent advances in benchmark dose methodology. Risk Anal. (2019) 39:2295–315. doi: 10.1111/risa.13324
53. Shao K, Shapiro AJ. A Web–based system for bayesian benchmark dose estimation. Environ Health Perspect. (2018) 126:017002. doi: 10.1289/EHP1289
54. Filipsson AF, Sand S, Nilsson J, Victorin K. The benchmark dose method—-review of available models, and recommendations for application in health risk assessment. Crit Rev Toxicol. (2003) 33:505–42. doi: 10.1080/748638748
55. Davis JA, Gift JS. Zhao QJ. Introduction to benchmark dose methods and US EPA's benchmark dose software (BMDS) version 211. Toxicol Appl Pharmacol. (2011) 254:181–91. doi: 10.1016/j.taap.2010.10.016
56. Agency USEP. BMDS Wizard User's Guide. (2015). Available online at: https://www.epa.gov/sites/default/files/2015-11/documents/bmds_manual.pdf
57. Ma J. Estimating epidemic exponential growth rate and basic reproduction number. Infect Dis Model. (2020) 5:129–41. doi: 10.1016/j.idm.2019.12.009
58. Boef AGC, Dekkers OM. le Cessie S. Mendelian randomization studies a review of the approaches used and the quality of reporting. Int J Epidemiol. (2015) 44:496–511. doi: 10.1093/ije/dyv071
59. Burgess S, Dudbridge F, Thompson SG. Combining information on multiple instrumental variables in mendelian randomization. comparison of allele score and summarized data methods. Stat Med. (2016) 35:1880–906. doi: 10.1002/sim.6835
60. Burgess S, Thompson SG. Interpreting findings from mendelian randomization using the MR-egger method. Eur J Epidemiol. (2017) 32:377–89. doi: 10.1007/s10654-017-0255-x
61. Ordóñez–Mena JM, Schöttker B, Mons U, Jenab M, Freisling H, Bueno-de-Mesquita B, et al. Quantification of the smoking–associated cancer risk with rate advancement periods. meta–analysis of individual participant data from cohorts of the CHANCES consortium. BMC Med. (2016). 14:62. doi: 10.1186/s12916-016-0607-5
62. Tang H, Wei P, Chang P, Li Y, Yan D, Liu C, et al. Genetic polymorphisms associated with pancreatic cancer survival. a genome–wide association study. Int J Cancer. (2017) 141:678–86. doi: 10.1002/ijc.30762
63. Astle WJ, Elding H, Jiang T, Allen D, Ruklisa D, Mann AL, et al. The allelic landscape of human blood cell trait variation and links to common complex disease. Cell. (2016). 167:5. doi: 10.1016/j.cell.2016.10.042
64. Lutz SM, Cho MH, Young K, Hersh CP, Castaldi PJ, McDonald M-L, et al. A genome-wide association study identifies risk loci for spirometric measures among smokers of European and African ancestry. BMC Genet. (2015) 16:138. doi: 10.1186/s12863-015-0299-4
65. Wheeler HE, Gamazon ER, Frisina RD, Perez–Cervantes C, El Charif O, Mapes B, et al. Variants in and other mendelian deafness genes are associated with cisplatin–associated ototoxicity. Clin Cancer Res. (2017) 23:3325–33. doi: 10.1158/1078-0432.CCR-16-2809
66. Locke AE, Kahali B, Berndt SI, Justice AE, Pers TH, Day FR, et al. Genetic studies of body mass index yield new insights for obesity biology. Nature. (2015) 518:197–206. doi: 10.1038/nature14177
67. Al Olama AA, Kote— Z, Berndt SI, Conti DV, Schumacher F, Han Y, et al. A meta–analysis of 87,040 individuals identifies 23 new susceptibility loci for prostate cancer. Nat Genet. (2014) 46:1103–9.
68. Broer L, Buchman AS, Deelen J, Evans DS, Faul JD, Lunetta KL, et al. GWAS of longevity in CHARGE consortium confirms APOE and FOXO3 candidacy. J Gerontol A Biol Sci Med Sci. (2015) 70:110–8. doi: 10.1093/gerona/glu166
69. Wang Y, McKay JD, Rafnar T, Wang Z, Timofeeva MN, Broderick P, et al. Rare variants of large effect in BRCA2 and CHEK2 affect risk of lung cancer. Nat Genet. (2014) 46:736–41.
70. Mayerle J, den Hoed CM, Schurmann C, Stolk L, Homuth G, Peters MJ, et al. Identification of genetic loci associated with Helicobacter pylori serologic status. JAMA. (2013) 309:1912–20. doi: 10.1001/jama.2013.4350
71. Lauc G, Huffman JE, Pučić M, Zgaga L, Adamczyk B, MuŽinić A, et al. Loci associated with N–glycosylation of human immunoglobulin G show pleiotropy with autoimmune diseases and haematological cancers. PLoS Genet. (2013) 9:e1003225. doi: 10.1371/journal.pgen.1003225
72. Lango Allen H, Estrada K, Lettre G, Berndt SI, Weedon MN, Rivadeneira F, et al. Hundreds of variants clustered in genomic loci and biological pathways affect human height. Nature. (2010) 467:832–8. doi: 10.1038/nature09410
73. Genome–wide Genome–wide association study of 14 000 000 cases of seven common diseases and 3 000 shared controls. Nature. (2007). 447:661–78. doi: 10.1038/nature05911
74. Wu C, Kraft P, Stolzenberg-Solomon , Steplowski E, Brotzman M, Xu M, et al. Genome–wide association study of survival in patients with pancreatic adenocarcinoma. Gut. (2014) 63:152–60. doi: 10.1136/gutjnl-2012-303477
75. Radstake TRDJ, Gorlova O, Rueda B, Martin J-E, Alizadeh BZ, Palomino-Morales R, et al. Genome–wide association study of systemic sclerosis identifies CD247 as a new susceptibility locus. Nat Genet. (2010) 42:426–9. doi: 10.1038/ng.565
76. Allanore Y, Saad M, Dieudé P, Avouac J, Distler JHW, Amouyel P, et al. Genome–wide scan identifies TNIP1, PSORS1C1, and RHOB as novel risk loci for systemic sclerosis. PLoS Genet. (2011) 7:e1002091. doi: 10.1371/journal.pgen.1002091
77. Gorlova O, Martin J–E, Rueda B, Koeleman BPC, Ying J, Teruel M, et al. Identification of novel genetic markers associated with clinical phenotypes of systemic sclerosis through a genome–wide association strategy. PLoS Genet. (2011) 7:e1002178.
78. Benyamin B, Pourcain B, Davis OS, Davies G, Hansell NK, Brion MJA, et al. Childhood intelligence is heritable, highly polygenic and associated with FNBP1L. Mol Psychiatry. (2014) 19:253–8. doi: 10.1038/mp.2012.184
79. Pilling LC, Atkins JL, Bowman K, Jones SE, Tyrrell J, Beaumont RN, et al. Human longevity is influenced by many genetic variants evidence from 75,000 UK Biobank participants. Aging (Albany NY). (2016) 8:547–60. doi: 10.18632/aging.100930
80. Lee JJ, Wedow R, Okbay A, Kong E, Maghzian O, Zacher M, et al. Gene discovery and polygenic prediction from a genome–wide association study of educational attainment in 11 million individuals. Nat Genet. (2018) 50:1112–21. doi: 10.1038/s41588-018-0147-3
81. Burgess S, Butterworth A, Thompson SG. Mendelian randomization analysis with multiple genetic variants using summarized data. Genet Epidemiol. (2013) 37:658–65. doi: 10.1002/gepi.21758
82. Pierce BL, Burgess S. Efficient design for mendelian randomization studies. subsample and 2–sample instrumental variable estimators. Am J Epidemiol. (2013) 178:1177–84. doi: 10.1093/aje/kwt084
83. Brion M–JA, Shakhbazov K, Visscher PM. Calculating statistical power in Mendelian randomization studies. Int J Epidemiol. (2013). 42:1497–501. doi: 10.1093/ije/dyt179
84. Chae DH, Gavin AR, Takeuchi DT. Smoking prevalence among asian americans. findings from the national latino and Asian American study (NLAAS). Public Health Rep. (2006) 121:755–63. doi: 10.1177/003335490612100616
85. Pampel FC. Patterns of tobacco use in the early epidemic stages. Malawi and Zambia, 2000–2002. Am J Public Health. (2005). 95:1009–15. doi: 10.2105/AJPH.2004.056895
86. Stubbs B, Veronese N, Vancampfort D, Prina AM, Lin P-Y, Tseng P-T, et al. Perceived stress and smoking across 41 countries a global perspective across Europe, Africa, Asia and the Americas. Sci rep. (2017) 7:7597. doi: 10.1038/s41598-017-07579-w
87. Faletau J, Glover M, Nosa V, Pienaar F. Looks like smoking, is it smoking? children's perceptions of cigarette–like nicotine delivery systems, smoking and cessation. Harm Reduct J. (2013) 10:30–30. doi: 10.1186/1477-7517-10-30
88. Misra S, Gelaye B, Koenen KC, Williams DR, Borba CPC, Quattrone D, et al. Early parental death and risk of psychosis in offspring a six-country case-control study. J Clin Med. (2019) 8:1081. doi: 10.3390/jcm8071081
89. Zhou H, Zhang Y, Liu J, Yang Y, Fang W, Hong S, et al. Education and lung cancer a Mendelian randomization study. Int J Epidemiol. (2019) 48:743–50. doi: 10.1093/ije/dyz121
Keywords: lung cancer risk, socioeconomic position (SEP), meta-analysis, dose response, Mendelian randomization
Citation: Zou X, Wang R, Yang Z, Wang Q, Fu W, Huo Z, Ge F, Zhong R, Jiang Y, Li J, Xiong S, Hong W and Liang W (2022) Family Socioeconomic Position and Lung Cancer Risk: A Meta-Analysis and a Mendelian Randomization Study. Front. Public Health 10:780538. doi: 10.3389/fpubh.2022.780538
Received: 21 September 2021; Accepted: 11 April 2022;
Published: 06 June 2022.
Edited by:
Yiqiang Zhan, Helmholtz Association of German Research Centers (HZ), GermanyReviewed by:
Laercio Lopes DaSilva, MetroWest Medical Center, United StatesCheng Wang, Nanjing University, China
Copyright © 2022 Zou, Wang, Yang, Wang, Fu, Huo, Ge, Zhong, Jiang, Li, Xiong, Hong and Liang. This is an open-access article distributed under the terms of the Creative Commons Attribution License (CC BY). The use, distribution or reproduction in other forums is permitted, provided the original author(s) and the copyright owner(s) are credited and that the original publication in this journal is cited, in accordance with accepted academic practice. No use, distribution or reproduction is permitted which does not comply with these terms.
*Correspondence: Wenhua Liang, bGlhbmd3aDE5ODdAMTYzLmNvbQ==; Wen Hong, d2VuaG9uZ0BzY3V0LmVkdS5jbg==
†These authors share first authorship