 Bechir Naffeti
 Sebastien Bourdin
 Walid Ben Aribi
 Amira Kebir
 Slimane Ben Miled
- 1Laboratory of BioInformatics, bioMathematics and bioStatistics, Institute Pasteur of Tunis, Tunis, Tunisia
- 2Métis Lab, EM Normandie Business School, Le Havre, France
- 3Preparatory Institute for Engineering Studies of Tunis, University of Tunis, Tunis, Tunisia
The aim of this study is to make a comparative study on the reproduction number R0 computed at the beginning of each wave for African countries and to understand the reasons for the disparities between them. The study covers the two first years of the COVID-19 pandemic and for 30 African countries. It links pandemic variables, reproduction number R0, demographic variable, median age of the population, economic variables, GDP and CHE per capita, and climatic variables, mean temperature at the beginning of each waves. The results show that the diffusion of COVID-19 in Africa was heterogeneous even between geographical proximal countries. The difference of the basic reproduction number R0 values is very large between countries and is significantly correlated with economic and climatic variables GDP and temperature and to a less extent with the mean age of the population.
1. Introduction
On January 30, 2020, the World Health Organization (WHO) declared COVID-19 as a Public Health Emergency of International Concern1 and by March 11, 2020, declared the first pandemic caused by the coronavirus. Up to July 2021, COVID-19 has affected over 187 million people with more than 4 million associated deaths and in addition, has induced catastrophic public health and socio-economic affliction globally (1).
The first cases in Africa to be reported by WHO were respectively, on February 14, 18, and 25, 2020, in Egypt, Algeria, and Nigeria. These first cases have nearly coincided with those in Europe, which is likely the original source of pathogen introduction in Africa.2 Since then, the virus has spread quite quickly (see Figure 1) (2). Up to June 6, 2020, most African countries have crossed the threshold of 1, 000 cases and the whole continent had 175, 423 cumulative cases and 4, 862 reported deaths. The WHO had predicted that 29 to 44 million Africans would be infected with COVID-19 during the first year of the pandemic, and 83 to 190 thousand Africans would had die if they don't uphold containment measures.3
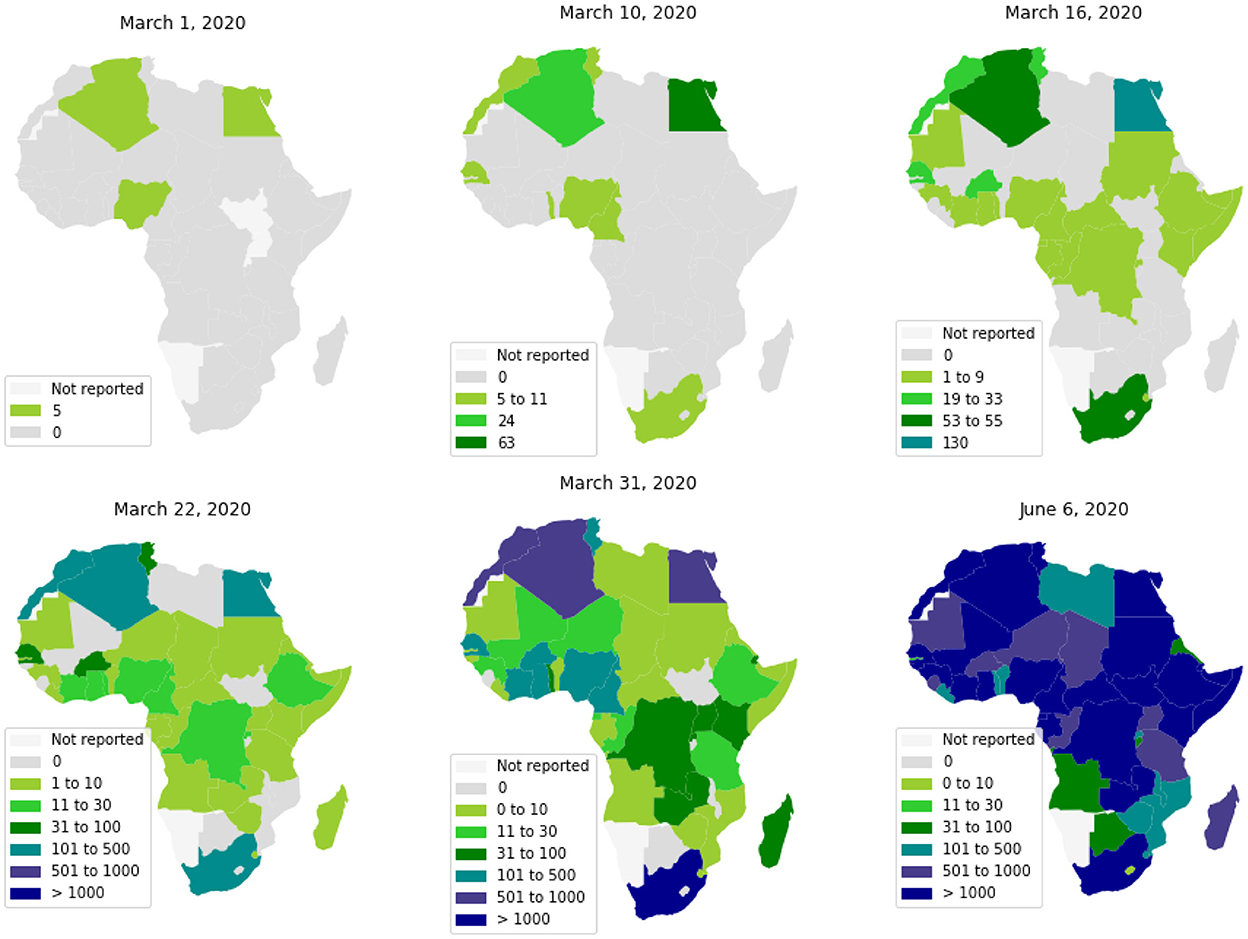
Figure 1. Spread of COVID-19 in Africa.
The high levels of poverty, weak health systems, and a large number of crowded urban areas, make the virus particularly devastating in African countries.4 However, the warmer climate, the population youth, and the boosted immunity by long exposure to previous endemic pathogens, would allow the continent to mitigate the risk of the pandemic (3). In this context, the diversity of COVID-19's dynamics throughout Africa and its relationship to socioeconomic and environmental factors can help us better understand the epidemic's determinism.
Like European countries (4), at the beginning of the COVID-19 epidemic, most African countries implemented strict Non-Pharmaceutical intervention (NPI) to limit the spread of this pandemic (5–7). This has included: the obligation to mask wearing and social distancing measures at the individual level, frontier closure, the closure of schools, universities, and public places, the closure of mosques and churches, and the prohibition of movement between cities and provinces. These measures have contributed in reducing the spread of the pandemic (8, 9). However, considering the socio-economical heterogeneity of the African countries (10), the response to these measures differed from one country to another as evidenced by the disparities between regions in infected cases and wave numbers (11).
To date, few studies have analyzed how the pandemic spread in Africa and how its intensity varied over time (12–16). Moreover, to our knowledge, no study has been conducted to analyze what are the determinants that could explain the geography of the pandemic.
This study aims at analyzing the Spatio-temporal evolution of the COVID-19 infection across 30 African countries and for each wave until March, 2022. And to provide demo-economical and environmental factors that can better explain the regional heterogeneity of the basic reproduction rate, R0. To this end, we calculate R0 at the early beginning of each wave, in order to avoid taking into account the NPI measure. We then make a correlation analysis between R0 and collected demographic, economic, and climatic data so as to assess how these factors may account for the regional variations of the pandemic.
The document is organized as follows: In Section 2, the material and method are presented. In Section 3, results and discussion are given. Finally, the conclusion is given in Section 4.
2. Materials and methods
In order to comprehend the differences between African countries, we collected epidemiological data from 45 African countries. Due to the quality of the data, this list was reduced to 30 countries distributed between North, South, East and West Africa. These countries are: Algeria, Angola, Burkina Faso, Cameroon, Chad, Ivory Coast, Egypt, Ethiopia, Guinea, Guinea-Bissau, Kenya, Libya, Madagascar, Mali, Mauritania, Morocco, Mozambique, Namibia, Niger, Nigeria, RDC, Rwanda, Senegal, Somalia, South Africa, Sudan, Tanzania, Tunisia, Zambia, and Zimbabwe.
Up to March, 2022, With the exception of Tanzania, Madagascar, Chad, and Burkina Faso, which had three waves, and Kenya, Algeria, Tunisia, and Zambia, which had five waves, nearly all of the thirty African countries analyzed had four waves. For all countries, the Omicron variant generated the most recent wave.
We took into account six epidemiological, demo-economical and climate factors for each country:
• Epidemiological variables are: The basic reproduction numbers, R0, of each wave, used to analyze the temporal evolution of the COVID-19 wave by wave at each country. The second one is the mean value of R0 over waves, denoted by MeanR where , is the R0 of the wave i and n is the number of waves. the MeanR is used to for an inter-countries comparison.
• Economic variables: The current health expenditure (CHE), and the gross domestic product (GDP) were collected from World Bank data.5 It has been shown that these variables have an impact on the propagation of the pandemic in several countries (17–19).
• Climate variable: Mean of the country's temperature at the periods of the beginning waves.6,7
• Demographic variable: The median of ages of the population population (see text footnote 5) as older patients are at higher risk of developing severity (20).
For each wave and each African country, basic reproduction rate, R0, was computed using the method developed in (21). This method is based on a SIR model, which is an Ordinary Differential Equations (ODE) that describes a structured population through three classes: S (susceptible), I (infected: reported and unreported), and R (removed: recovered or die). For more detail about the system of ordinary differential equations, parameters identification and how to determine the R0 values see Appendix. As it is difficult to estimate the impact of control policies in the calculation of R0, we chose to calculate R0 with data from the first days of each wave. Indeed, we assume that at the beginning of each wave the control policies are very little applied or non-existent, so the growth of the pandemic is exponential.
To measure the degree of the relationship between variables, we use the Pearson correlation defined by (22).
For the clustering countries with similar data variables, we use an “unsupervised learning” method, the hierarchical clustering (23).
In this method, it is not necessary to specify an initial number of clusters to run the algorithm. Dendrogram was used to visualize the partitioning of the data.
Impact data variables were summarized and visualized using Principal Component Analysis (PCA) (24).
Data set implementation and analysis is described in Figure 2.
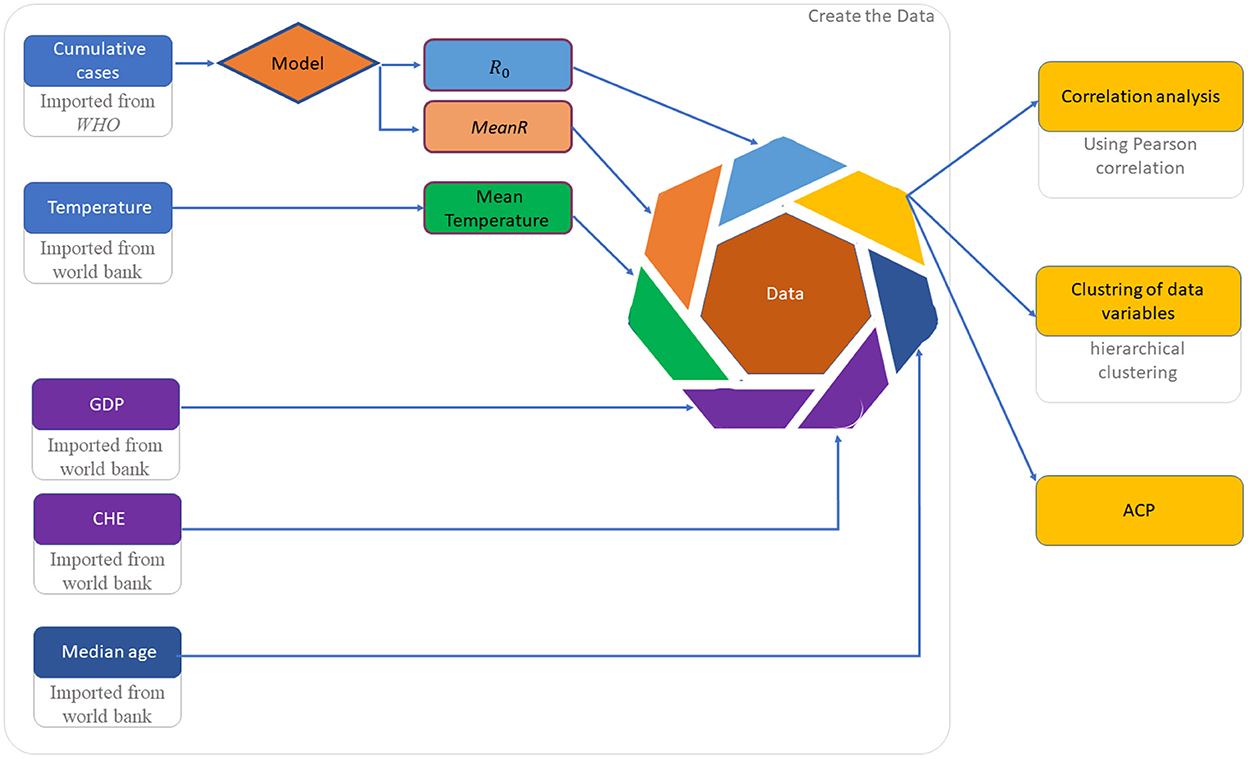
Figure 2. Flowchart diagram to explain the different steps of the methodology.
3. Results and discussion
In this section, we perform inter-country and intra-country analyses integrating economic, climatic, and demographic factors.
3.1. Inter-country analysis
Based on the mean of R0, MeanR, distribution across waves (see Figure 3), we divided countries into three groups (see Table 1 and Figure 4).
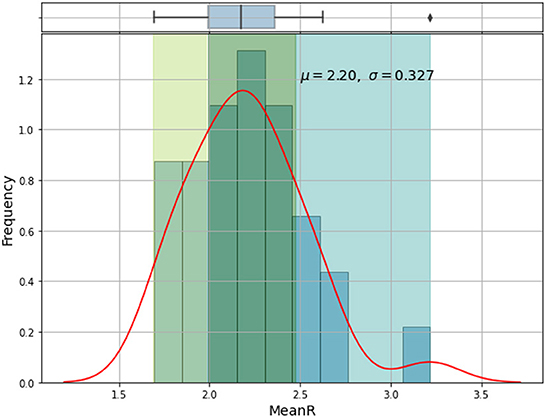
Figure 3. Frequency distribution and histogram of MeanR of all waves.
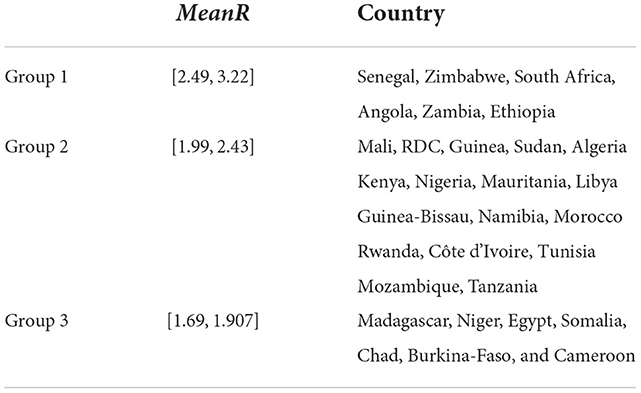
Table 1. Distribution of MeanR by Country.
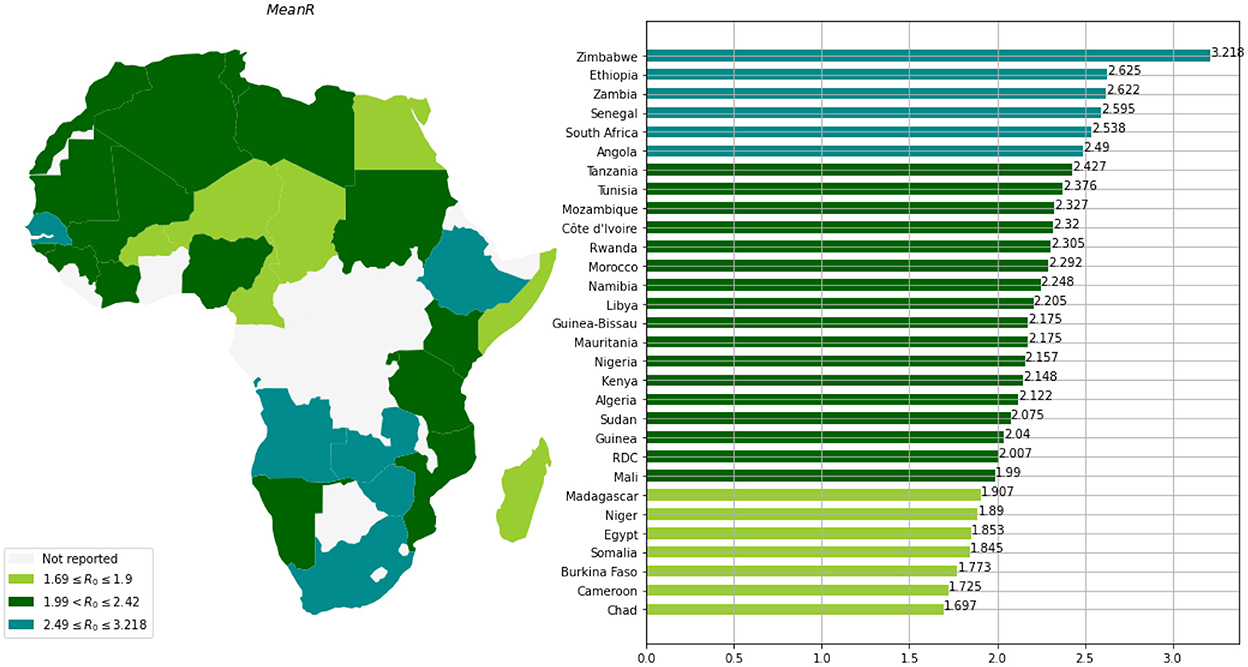
Figure 4. Distribution of MeanR among 30 countries in Africa.
We observe that more than 50% of the countries have MeanR values in [1.99, 2.37], mainly located in north Africa. Moreover, 25% of the other countries show higher values of MeanR and are located especially in South Africa.
3.2. Intra-country distribution
When comparing the first three waves, we can see that the R0 values for waves 4 and 5 have significantly grown (see Table 2). This makes sense given how quickly the Delta and Omicron variants have spread.

Table 2. Mean R0 over countries by waves.
Based on the values of R0 and for each wave, we clustered the countries into three groups (see Table 3 and Figure 5). We observe that countries with the highest MeanR, corresponding to Group 1, had experienced a strong first or second wave (countries in Group 1 for the first or second wave).
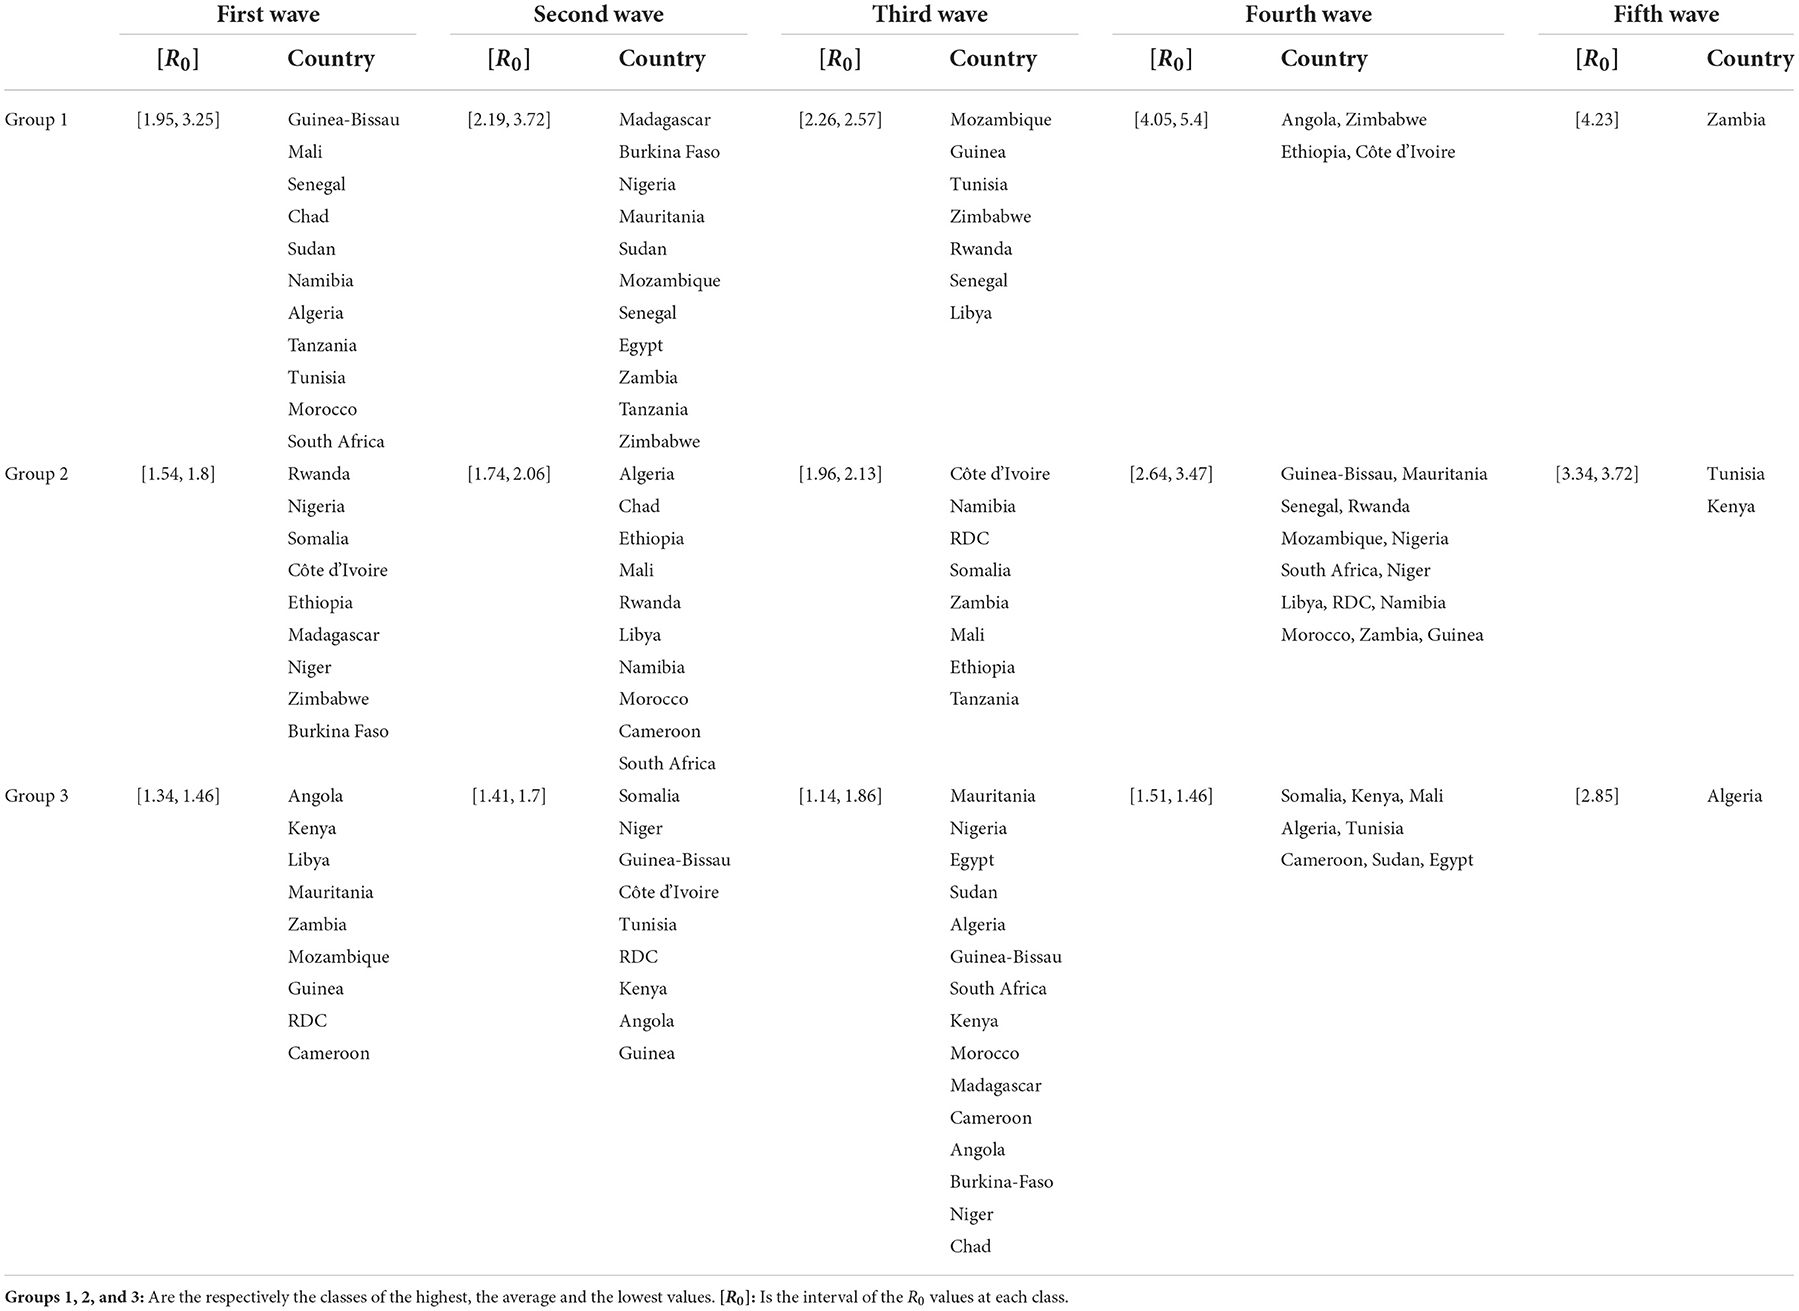
Table 3. Distribution of the country between a Group of R0 for each wave.
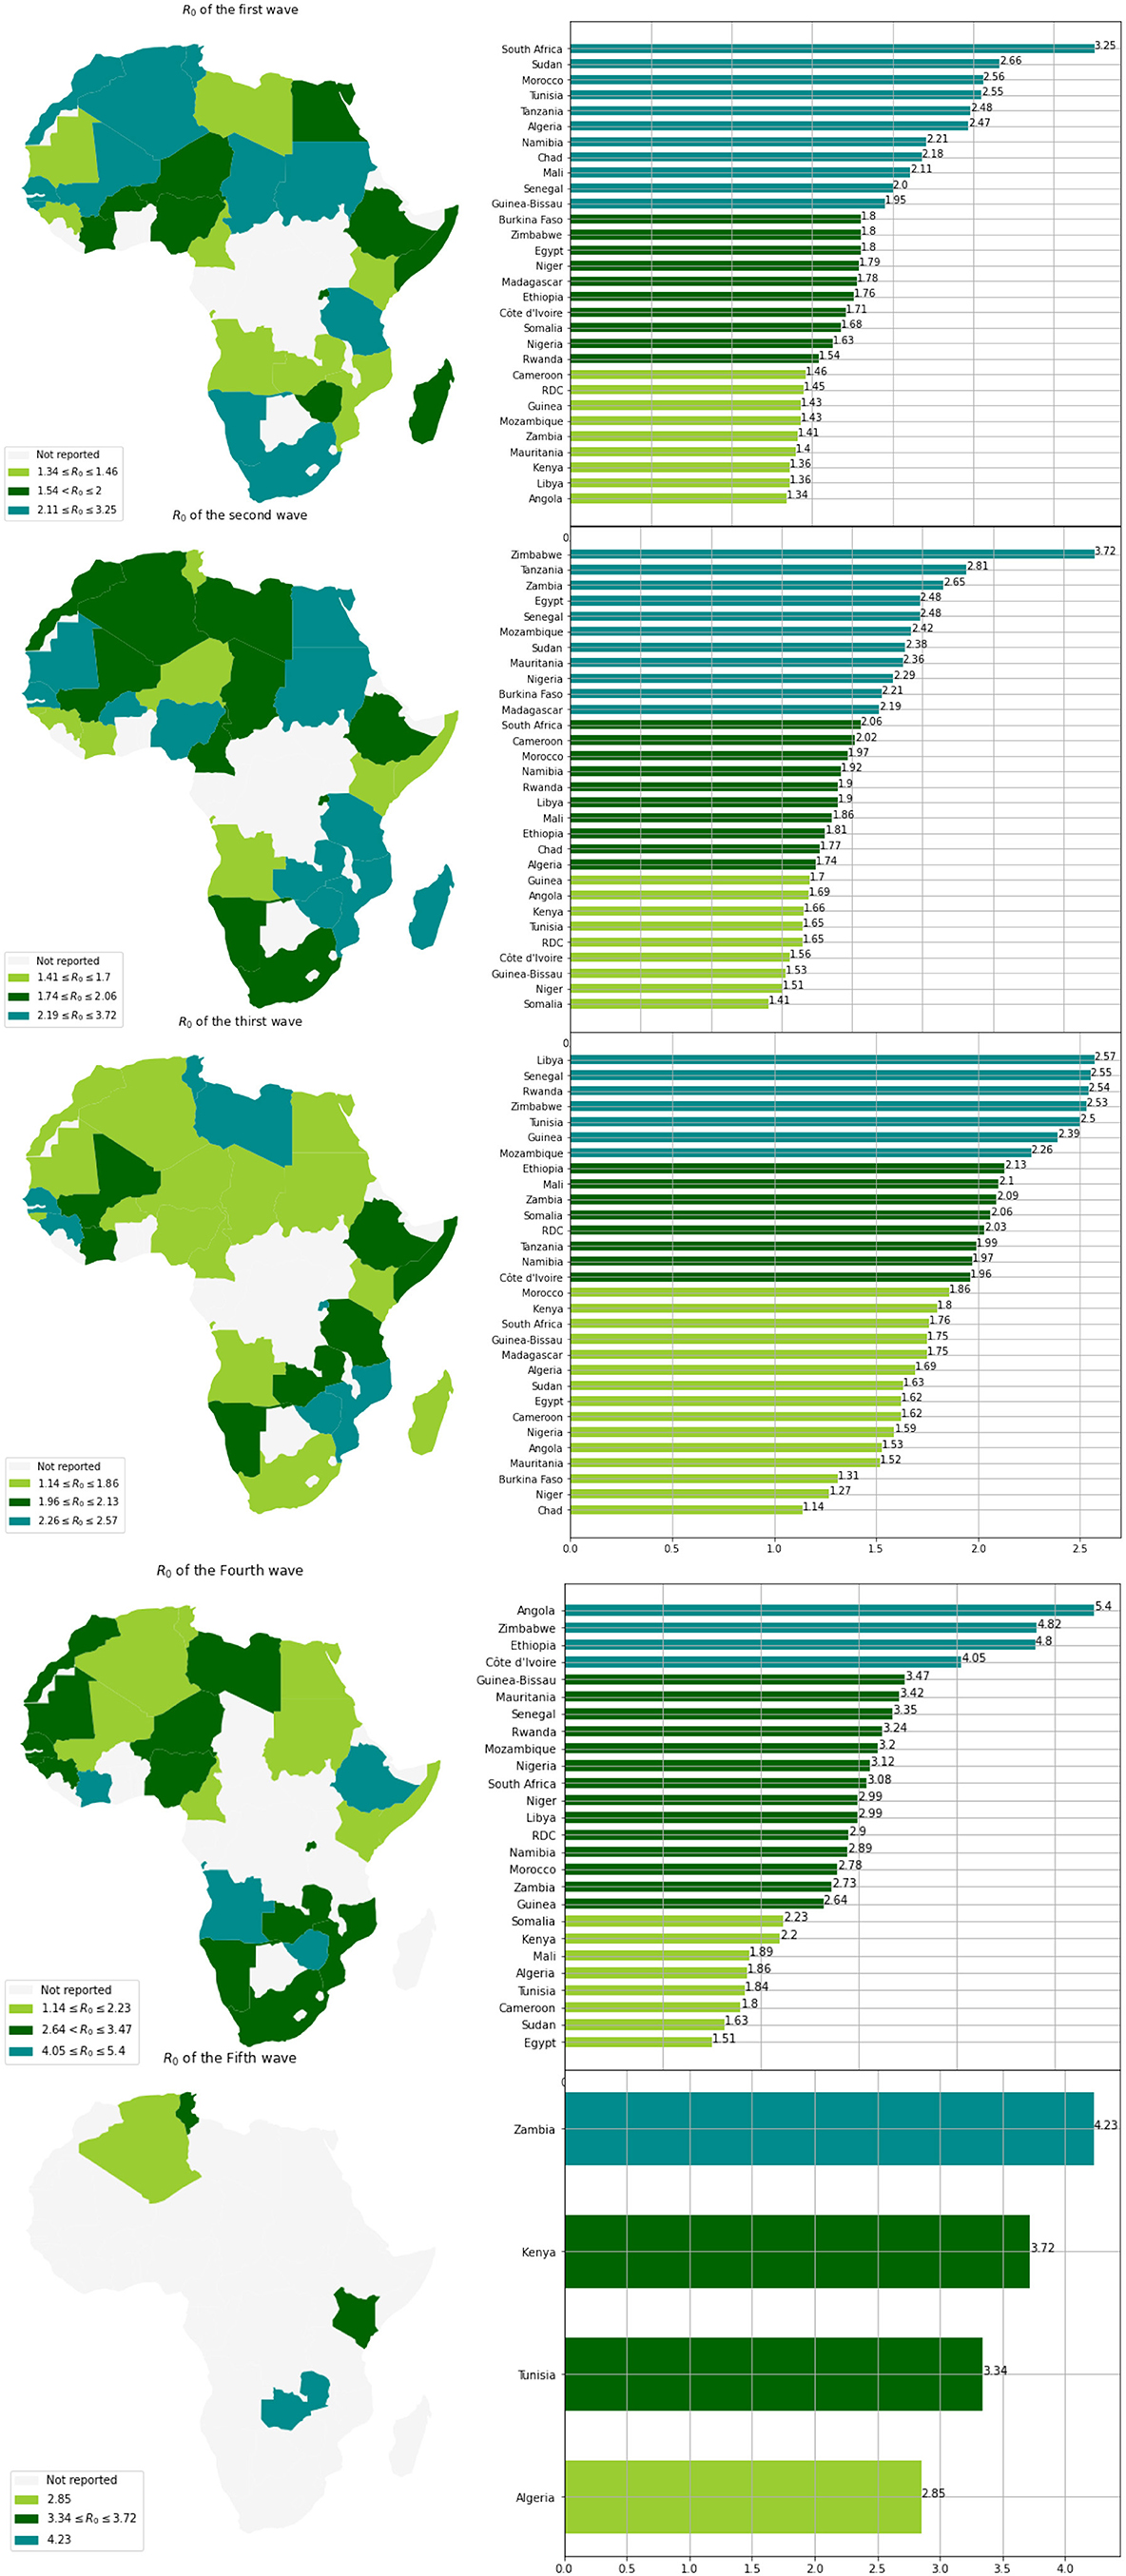
Figure 5. Distribution of the R0 of 30 countries in Africa for each wave.
Low R0 waves were experienced by the countries with the lowest MeanR Group (Group 3 for the MeanR). Indeed, some of the least affected countries (belonging to Group 2 or 3), have experienced three weak waves, such as Kenya and Guinea (Group 3, for the three waves) or a medium wave as Libya (Group 3 for waves 1 and group 2 for wave 2) RDC (Group 3 for waves 1 and 2 and Group 2 for wave 3) and Mauritania and Cameroon (Group 3 for waves 1 and 3).
We note that, in general, countries in the first Group for the first wave (except for Senegal, Tanzania, and Sudan) experienced a weaker second and third wave. Conversely, countries that experienced a weaker first wave (Groups 2 and 3), experienced a stronger second or third wave (Group 1). Indeed, in Tunisia, the first and third waves (belonging to Group 1), were significant, but the second wave was less so (belonging to Group 3). Senegal experienced three major waves (belonging to Group 1). Finally, South Africa, Chad, Morocco, and Algeria had a powerful first wave (belonging to Group 1), a moderate second wave (belonging to Group 2), and a weak third wave (belonging to Group 3).
3.3. Impact of economic factor
Next, we looked at the relationship between the mean R0 values, MeanR, and the Gross Domestic Product (GDP), and the Current Health Expenditure (CHE) (see Table 4 and data in the Appendix).
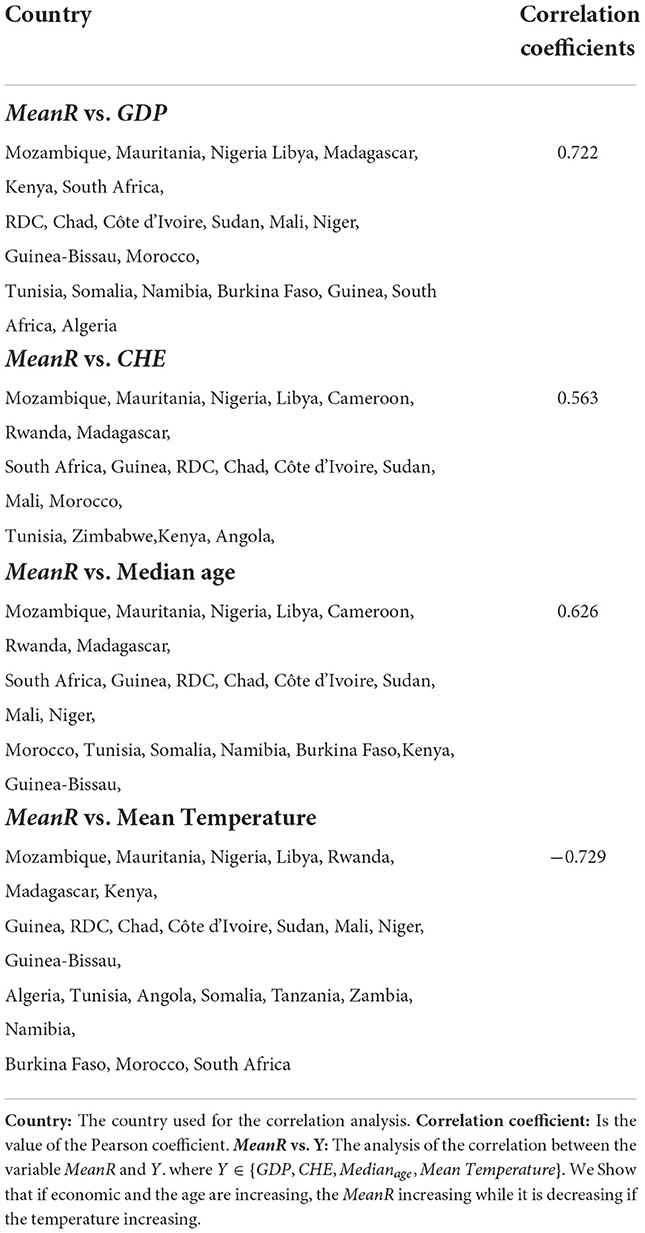
Table 4. Results of correlation analysis.
It is revealed that the MeanR is highly positively correlated to GDP and is moderately positively correlated to CHE. Indeed, countries with the highest GDPs in Africa (GDPs above US$3000 per capita), especially South Africa and some North African countries like Tunisia, Morocco, and Algeria, experienced a significant first wave (see Table 5). These countries were the first to be impacted by the epidemic because of their degree of development, which makes them more accessible to international trade (see Figure 6).
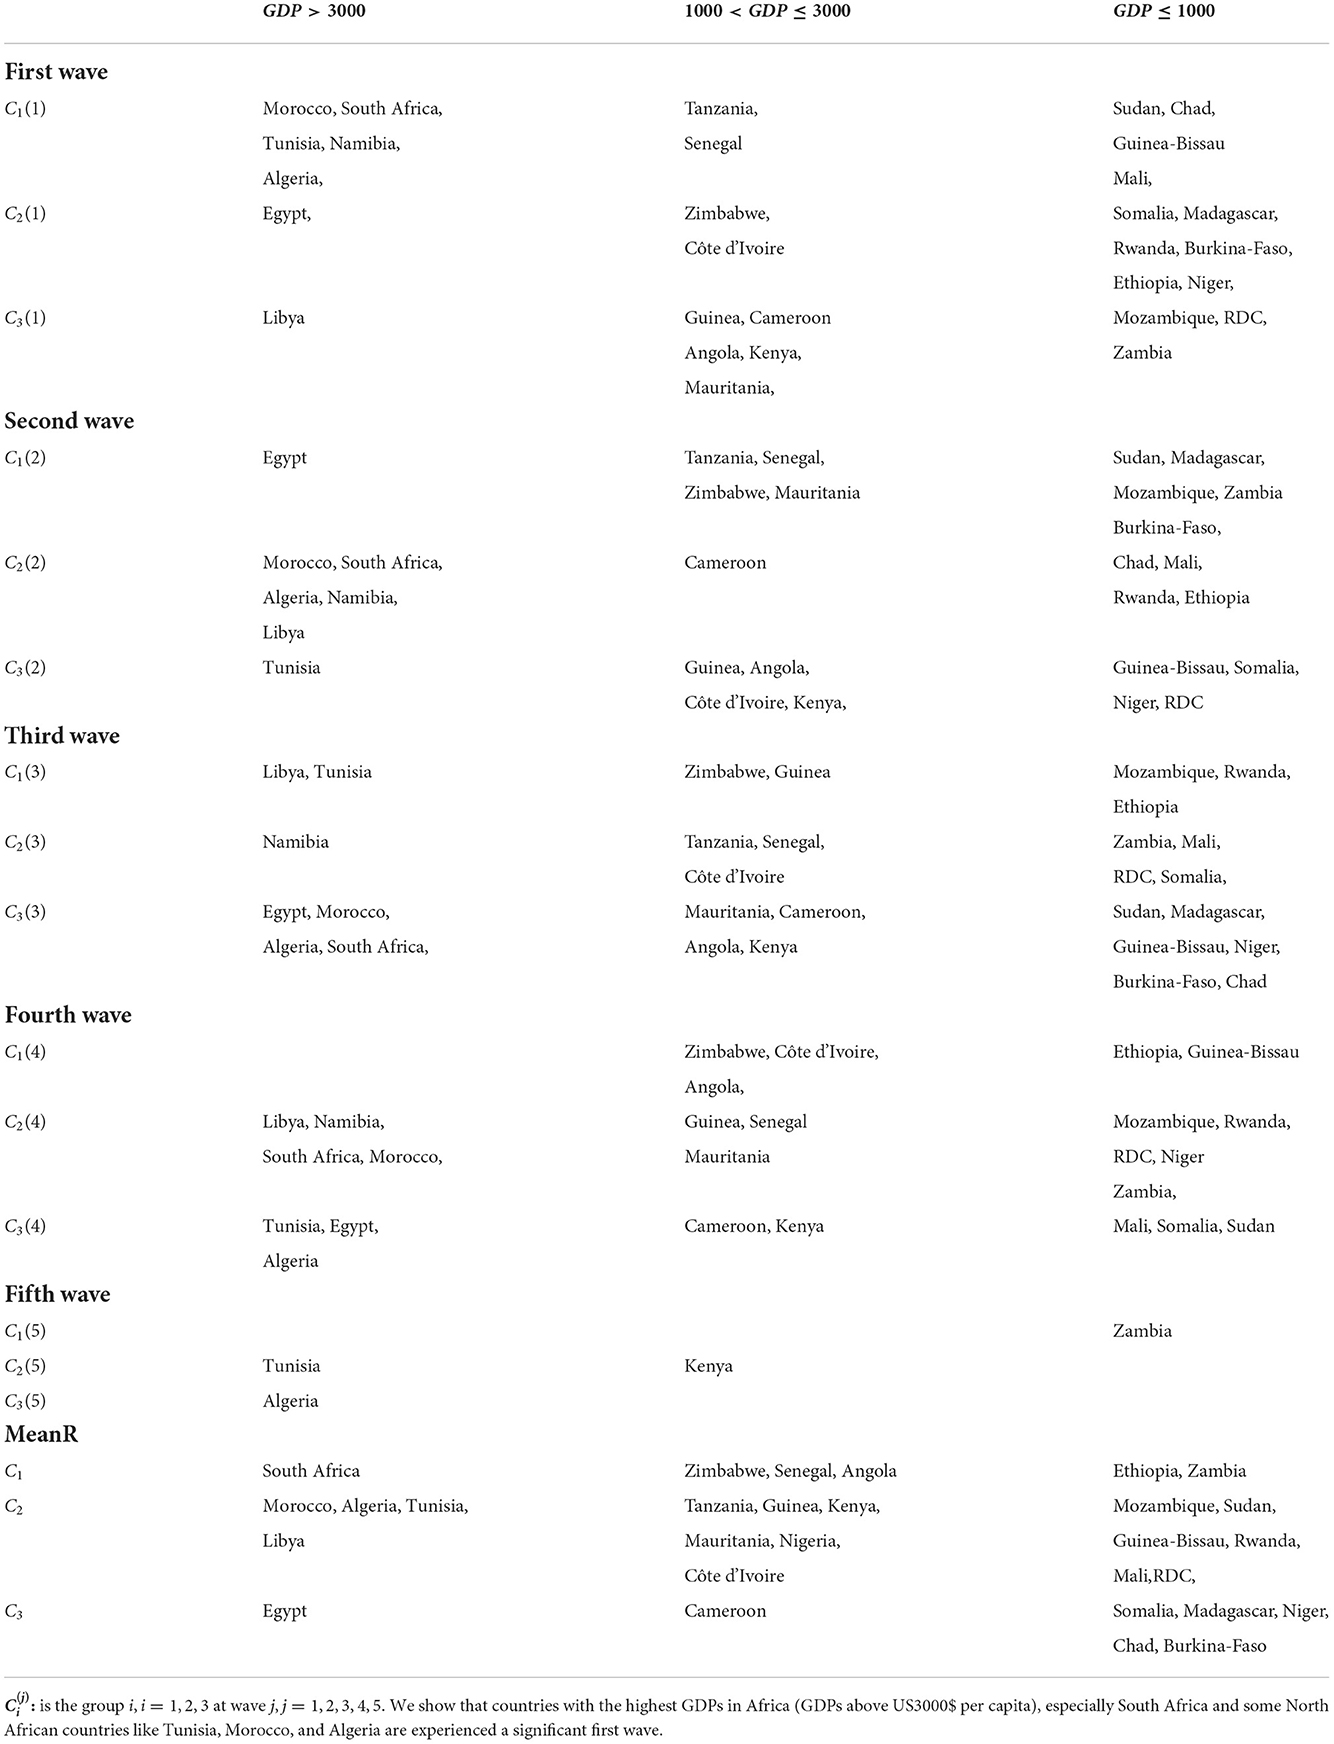
Table 5. Distribution of the countries between classes waves of R0 and GDP (in US$).
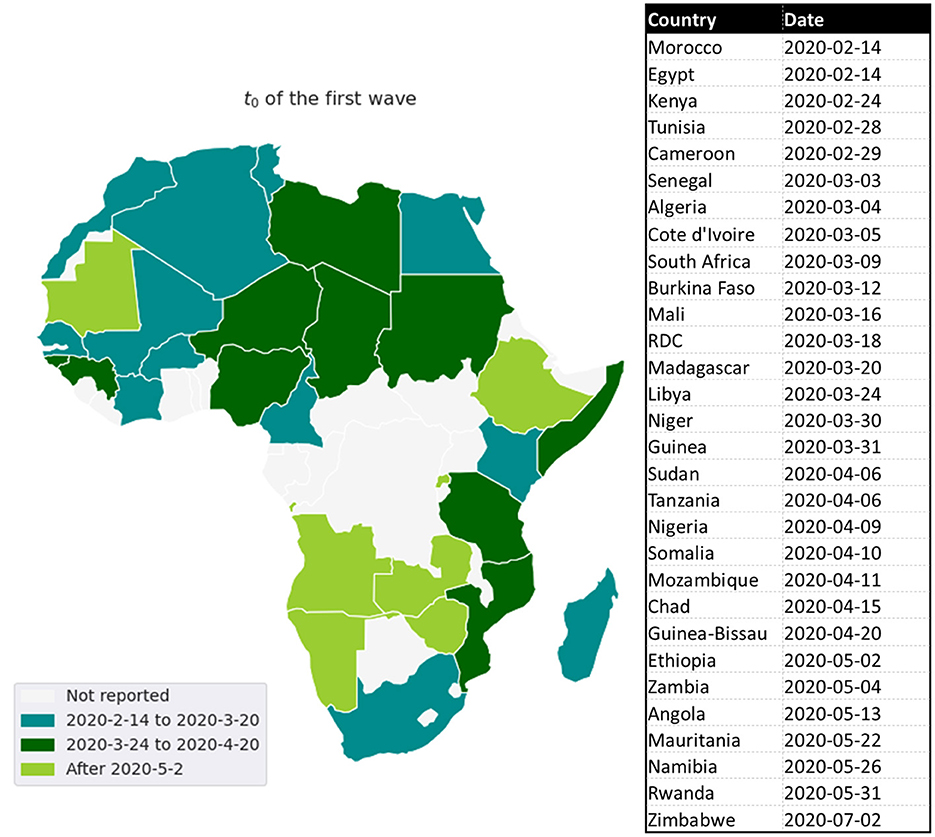
Figure 6. Distribution of the t0 for the first wave.
The lower relationship between R0 and CHE may be explained by two facts: Firstly, we measured R0 at the start of the wave when public health interventions were either not yet in place or were poorly in place. Secondly, the CHE plays a role in terms of preparedness and impact to improve the public health policy between waves in terms of screening capacity. A country with a high CHE has the material, human and technological resources to perform the volume of diagnostic tests and thus has the capacity to rapidly identify confirmed cases. This implies a strong dependence between the number of tests and CHE (17). It was noted that countries with low health system investment, CHE, often have a low testing capacity which makes it difficult to assess the true extent of COVID-19. For example, as of mid-April 2020, the Democratic Republic of the Congo was only performing about 200 tests per day (25), Senegal about 300 tests per day, and Ethiopia about 400 tests per day while the number of tests was 3493 in South Africa.8 For these countries, the question of the quality of the data and the reality of the virus circulation arises.
3.4. Impact of demographic factors
According to Table 4, there is a correlation between the demographic factors, i.e., the median age and MeanR. We observe (see Figure 5), that most countries with a median age under 18 have a MeanR less than 2, including Niger, Mali, Chad, Somalia, and Burkina Faso. While South Africa and other countries with a median age greater than 27 have a MeanR greater than 2.
This result may be explained by the fact that older people are over-represented in the COVID-19 data since they are more likely to be tested and have more serious infections (26). In contrast, younger people tend to be in better health than older ones, making them more immune to infection. This has been observed in the influenza pandemic in Africa where children and adolescents had a negligible epidemiological impact (27).
3.5. Impact of climatic factors
The annual temperature and MeanR are negatively highly correlated, as seen in Table 4 and Figure 5. Indeed, we observe that almost all of the countries with a lower value of meanR have a dry climate and a high annual temperature (annual temperature greater than 27°C), in contrast to the northern countries, which have a lower annual temperature (annual temperature less than 23°C; see Figure 4).
Note that, negative correlation had already been observed in China (28), in several Latin American countries (29, 30), in the U.S.A. (31) and in Japan (32). From a biological point of view, low humidity dries out the nasal mucosa and impairs the stability of the aerosol droplets and therefore virus particles (33). Hence, the virus replication is limited by temperatures (20 and 30°C) (34).
3.6. Clustering of African country from epidemic, economic, demographic, and climatic variables
We performed a hierarchical clustering and a principal component analysis (PCA) (Figures 7–10). The PCA depicts two primary axes (PC1, PC2) that together account for 75% of country variation, 54.2% for the PC1 and 20.6% for the PC2. The primary parameters in PC2 are MeanR, median age, and GDP. For PC1, the primary parameter is the temperature.
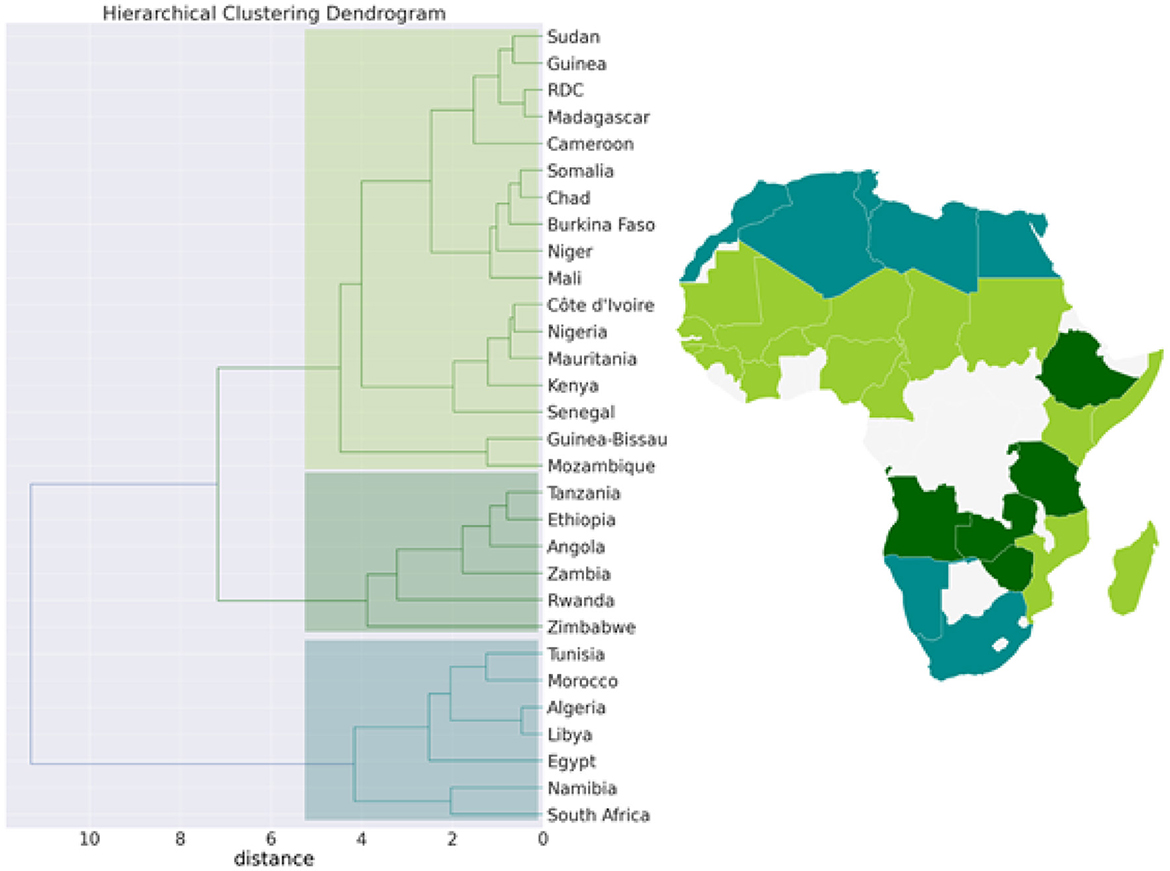
Figure 7. Hierarchical clustering (Dendrogram) for the pandemic, economic, demographic, and climatic variables allows countries to be grouped into 3 separate clusters.
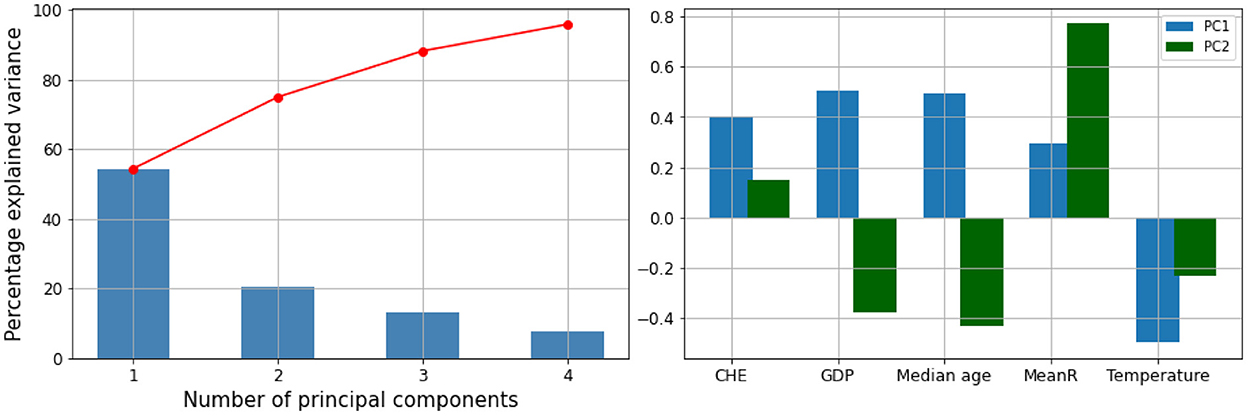
Figure 8. Principal components (PC) plot from the principal component analysis (PCA) on the pandemic, economic, demographic, and climatic variables.

Figure 9. Correlation circles for the two first PC planes.
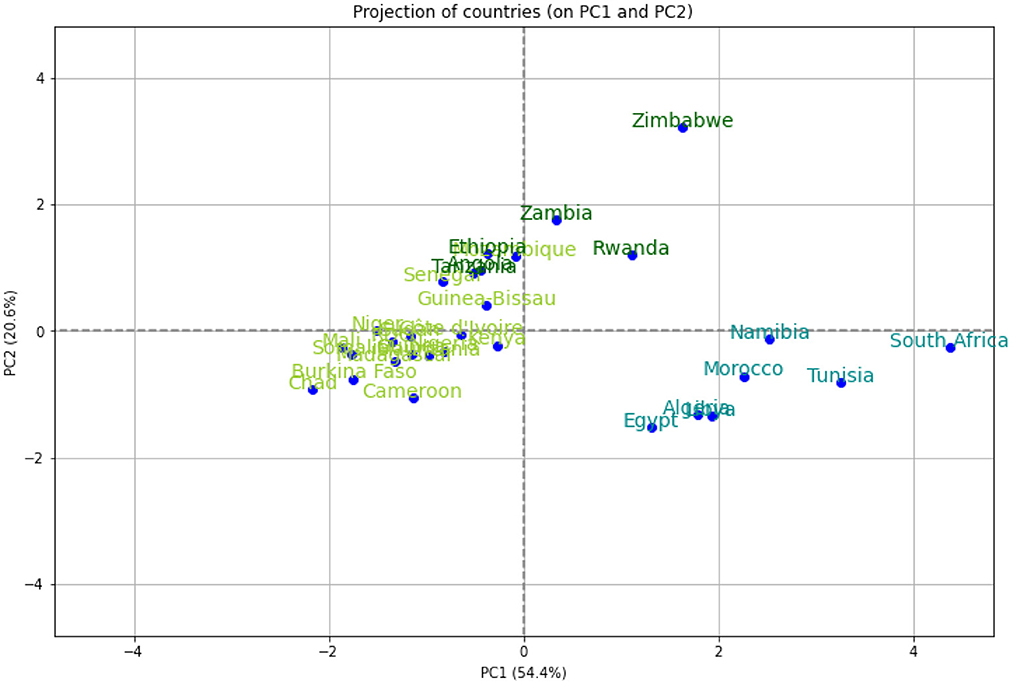
Figure 10. Projection of the 30 African countries of the PCA's plot on the first PC plane.
We then performed a Hierarchical Clustering of the countries (see Figure 7). We were able to divide the countries into two distinct clusters. Morocco, Algeria, Tunisia, Libya, Egypt, Namibia, and South Africa make up the first cluster, which spans north and south Africa. This cluster is characterized by high median age and a high GDP>US$3000) (in [21.8, 32.7] years old). Except for Egypt (MeanR = 1.8), this cluster has witnessed an average of MeanR>2.2. We have identified five countries that had a significant first wave.
The second cluster is in turn divided into sub-clusters, the first sub-cluster includes Tanzania, Ethiopia, Angola, Zambia, Rwanda, and Zimbabwe. This cluster is characterized by high values of MeanR. MeanR in [2.4, 3.21] in Zimbabwe, a middle GDP in US$ [797, 1800], and a median age < 20 years.
The latest cluster includes the rest of the countries. This cluster is characterized by a high annual temperature of more than 25°C and a GDP of between US$2350 and US$438. These countries are distinguished by MeanR values in [1.69, 2.59]. Twelve of the 18 countries of the second Group are included in this cluster.
4. Conclusion
The objective of our paper was to document the Spatio-temporal variations in the baseline reproduction rate R0 and to understand the reasons for the different disparities between them. We highlight that more developed countries experienced a higher incidence in the first wave, which can be explained by their higher international exposure. We also show that the quality of health systems played a key role in limiting virus-related mortality. Consistent with the literature, we also show that countries with younger populations were less affected by the pandemic. Finally, we show that climate also plays a determining role in explaining the reproduction rate R0. At the end of the analysis of the determinants, we have made a clustering of the countries in order to identify which ones have been the most suffering during this pandemic or on the contrary which ones have been the most resistant.
Our results show that the geography of the pandemic in Africa largely overlaps with the geography of the wealth of the states. Consequently, the fight against poverty and the development of health infrastructures are sine-qua-non conditions for an effective fight against future epidemics or pandemic crises that could occur.
Data availability statement
The original contributions presented in the study are included in the article/Supplementary material, further inquiries can be directed to the corresponding author/s.
Author contributions
BN, AK, and SBe contributed to conception and design of the study. BN and WB organized the database. BN and SBe performed the statistical analysis. BN, SBo, and WB wrote the first draft of the manuscript. BN, SBo, AK, and SBe wrote the final draft of the manuscript. All authors contributed to manuscript revision, read, and approved the submitted version.
Funding
This work was supported in part by the French Ministry for Europe and Foreign Affairs via the project REPAIR COVID-19-Africa coordinated by the Pasteur International Network association, by European Union's Horizon 2020 research and innovation program under grant agreement No. 883441 (STAMINA) and the Tunisian Ministry for High Education via PRF project PRFCOV19-D5P1 Evaluer, prédire, agir: stratégie fédérée pour la lutte contre la COVID-19.
Conflict of interest
The authors declare that the research was conducted in the absence of any commercial or financial relationships that could be construed as a potential conflict of interest.
Publisher's note
All claims expressed in this article are solely those of the authors and do not necessarily represent those of their affiliated organizations, or those of the publisher, the editors and the reviewers. Any product that may be evaluated in this article, or claim that may be made by its manufacturer, is not guaranteed or endorsed by the publisher.
Supplementary material
The Supplementary Material for this article can be found online at: https://www.frontiersin.org/articles/10.3389/fpubh.2022.1039925/full#supplementary-material
Footnotes
. ^1 https://www.who.int/director-general/speeches/detail/who-director-general-s-statement-on-ihr-emergency-committee-on-novel-coronavirus-(2019-ncov)
. ^2 https://www.afro.who.int/news/covid-19-cases-top-10-000-africa, https://covid19.ncdc.gov.ng/
. ^3 https://www.afro.who.int/news/new-who-estimates-190-000-people-could-die-covid-19-africa-if-not-controlled
. ^4 https://africacenter.org/spotlight/mapping-risk-factors-spread-covid-19-africa/
. ^5 https://data.worldbank.org/indicator/SH.XPD.CHEX.GD.ZS
. ^6 http://www.climatemps.com/
. ^7 https://climateknowledgeportal.worldbank.org/country/central-african-republic/climate-data-historical
. ^8 https://ourworldindata.org/grapher/daily-tests-per-thousand-people-smoothed-7-day
References
1. Jeanne L, Bourdin S, Nadou F, Noiret G. Economic globalization and the COVID-19 pandemic: global spread and inequalities. GeoJournal. (2022). doi: 10.1007/s10708-022-10607-6. [Epub ahead of print].
2. Mehtar S, Preiser W, Lakhe NA, Bousso A, TamFum JJM, Kallay O, et al. Limiting the spread of COVID-19 in Africa: one size mitigation strategies do not fit all countries. Lancet Global Health. (2020) 8:e881–3. doi: 10.1016/S2214-109X(20)30212-6
3. El-Sadr WM, Justman J. Africa in the path of COVID-19. N Engl J Med. (2020) 383:e11. doi: 10.1056/NEJMp2008193
4. Bourdin S, Ben Miled S, Salhi J. The drivers of policies to limit the spread of COVID-19 in Europe. J Risk Fin Manage. (2022) 15:67. doi: 10.3390/jrfm15020067
5. Haider N, Osman AY, Gadzekpo A, Akipede GO, Asogun D, Ansumana R, et al. Lockdown measures in response to COVID-19 in nine sub-Saharan African countries. BMJ Global Health. (2020) 5:e003319. doi: 10.1136/bmjgh-2020-003319
6. Maeda JM, Nkengasong JN. The puzzle of the COVID-19 pandemic in Africa. Science. (2021) 371:27–28. doi: 10.1126/science.abf8832
7. BenMiled S, Borgi C, Hsairi M, Somrani N, Kebir A. Hospital bed capacity across in Tunisia hospital during the first four waves of the COVID-19 pandemic: a descriptive analysis. medRxiv [Preprint]. (2022). doi: 10.1101/2022.08.23.22279122
8. Lai S, Ruktanonchai NW, Zhou L, Prosper O, Luo W, Floyd JR, et al. Effect of non-pharmaceutical interventions to contain COVID-19 in China. Nature. (2020) 585:410–3. doi: 10.1038/s41586-020-2293-x
9. Flaxman S, Mishra S, Gandy A, Unwin HJT, Mellan TA, Coupland H, et al. Estimating the effects of non-pharmaceutical interventions on COVID-19 in Europe. Nature. (2020) 584:257–61. doi: 10.1038/s41586-020-2405-7
10. Lwasa S. Appreciating the heterogeneity in the unity of Africa: a socio-ecological perspective on Africa's geographies. Can Geogr. (2019) 63:594–602. doi: 10.1111/cag.12576
11. Zhang F, Karamagi H, Nsenga N, Nanyunja M, Karinja M, Amanfo S, et al. Predictors of COVID-19 epidemics in countries of the World Health Organization African Region. Nat Med. (2021) 27:2041–7. doi: 10.1038/s41591-021-01491-7
12. Martinez-Alvarez M, Jarde A, Usuf E, Brotherton H, Bittaye M, Samateh AL, et al. COVID-19 pandemic in west Africa. Lancet Global Health. (2020) 8:e631–2. doi: 10.1016/S2214-109X(20)30123-6
13. Salyer SJ, Maeda J, Sembuche S, Kebede Y, Tshangela A, Moussif M, et al. The first and second waves of the COVID-19 pandemic in Africa: a cross-sectional study. Lancet. (2021) 397:1265–75. doi: 10.1016/S0140-6736(21)00632-2
14. Bailey D, Clark J, Colombelli A, Corradini C, De Propris L, Derudder B, et al. Regions in a time of pandemic. Region Stud. (2020) 54:1163–74. doi: 10.1080/00343404.2020.1798611
15. Bourdin S, Jeanne L, Nadou F, Noiret G. Does lockdown work? A spatial analysis of the spread and concentration of COVID-19 in Italy. Region Stud. (2021) 55:1182–93. doi: 10.1080/00343404.2021.1887471
16. McCann P, Ortega-Argilés R, Yuan PY. The COVID-19 shock in European regions. Region Stud. (2022) 56:1142–60. doi: 10.1080/00343404.2021.1983164
17. Oshinubi K, Rachdi M, Demongeot J. Analysis of reproduction number R0 of COVID-19 using current health expenditure as gross domestic product percentage (CHE/GDP) across countries. In:Oshinubi K, Rachdi M, Demongeot J, editors. Healthcare. vol. 9. MDPI (2021). p. 1247. doi: 10.3390/healthcare9101247
18. Asfahan S, Shahul A, Chawla G, Dutt N, Niwas R, Gupta N. Early trends of socio-economic and health indicators influencing case fatality rate of COVID-19 pandemic. Monaldi Arch Chest Dis. (2020) 90. doi: 10.4081/monaldi.2020.1388
19. Kompas T, Grafton RQ, Che TN, Chu L, Camac J. Health and economic costs of early and delayed suppression and the unmitigated spread of COVID-19: the case of Australia. PLoS ONE. (2021) 16:e0252400. doi: 10.1371/journal.pone.0252400
20. Barek MA, Aziz MA, Islam MS. Impact of age, sex, comorbidities and clinical symptoms on the severity of COVID-19 cases: a meta-analysis with 55 studies and 10014 cases. Heliyon. (2020) 6:e05684. doi: 10.1016/j.heliyon.2020.e05684
21. Liu Z, Magal P, Seydi O, Webb G. Understanding unreported cases in the COVID-19 epidemic outbreak in Wuhan, China, and the importance of major public health interventions. Biology. (2020) 9:50. doi: 10.3390/biology9030050
22. Ree MJ. Correlation and regression: applications for industrial organizational psychology and management. Organ Res Methods. (2002) 5:200. doi: 10.1177/1094428102005002005
23. Nielsen F(ed.). Hierarchical clustering. In: Introduction to HPC with MPI for Data Science. Springer (2016). p. 195–211. doi: 10.1007/978-3-319-21903-5_8
24. Abdi H, Williams LJ. Principal component analysis. Wiley Interdiscipl Rev Comput Stat. (2010) 2:433–59. doi: 10.1002/wics.101
25. Wells CR, Stearns JK, Lutumba P, Galvani AP. COVID-19 on the African continent. Lancet Infect Dis. (2020) 20:1368–70. doi: 10.1016/S1473-3099(20)30374-1
26. Clark A, Jit M, Warren-Gash C, Guthrie B, Wang HH, Mercer SW, et al. Global, regional, and national estimates of the population at increased risk of severe COVID-19 due to underlying health conditions in 2020: a modelling study. Lancet Global Health. (2020) 8:e1003–17. doi: 10.1016/S2214-109X(20)30264-3
27. Munro AP, Faust SN. Children are not COVID-19 super spreaders: time to go back to school. Arch Dis Childhood. (2020) 105:618–9. doi: 10.1136/archdischild-2020-319474
28. Li H, Xu XL, Dai DW, Huang ZY, Ma Z, Guan YJ. Air pollution and temperature are associated with increased COVID-19 incidence: a time series study. Int J Infect Dis. (2020) 97:278–82. doi: 10.1016/j.ijid.2020.05.076
29. Bolano-Ortiz TR, Camargo-Caicedo Y, Puliafito SE, Ruggeri MF, Bolano-Diaz S, Pascual-Flores R, et al. Spread of SARS-CoV-2 through Latin America and the Caribbean region: a look from its economic conditions, climate and air pollution indicators. Environ Res. (2020) 191:109938. doi: 10.1016/j.envres.2020.109938
30. Prata DN, Rodrigues W, Bermejo PH. Temperature significantly changes COVID-19 transmission in (sub) tropical cities of Brazil. Sci Tot Environ. (2020) 729:138862. doi: 10.1016/j.scitotenv.2020.138862
31. Li AY, Hannah TC, Durbin JR, Dreher N, McAuley FM, Marayati NF, et al. Multivariate analysis of black race and environmental temperature on COVID-19 in the US. Am J Med Sci. (2020) 360:348–56. doi: 10.1016/j.amjms.2020.06.015
32. Ujiie M, Tsuzuki S, Ohmagari N. Effect of temperature on the infectivity of COVID-19. Int J Infect Dis. (2020) 95:301–3. doi: 10.1016/j.ijid.2020.04.068
33. Schaffer F, Soergel M, Straube D. Survival of airborne influenza virus: effects of propagating host, relative humidity, and composition of spray fluids. Arch Virol. (1976) 51:263–73. doi: 10.1007/BF01317930
34. Lowen AC, Mubareka S, Steel J, Palese P. Influenza virus transmission is dependent on relative humidity and temperature. PLoS Pathog. (2007) 3:e151. doi: 10.1371/journal.ppat.0030151
35. Bozorg-Haddad O, Solgi M, Loáiciga HA. Meta-Heuristic and Evolutionary Algorithms for Engineering Optimization. John Wiley & Sons (2017). doi: 10.1002/9781119387053
Appendix: Model description
This model consists of the following system of ordinary differential equations:
Where t ≥ t0 the time in days, t0 is the beginning date of each wave, S(t) is the number of individuals susceptible to infection at time t, I(t) is the number of infectious individuals at time t, R(t) is the number of reported infectious individuals at time t and U(t) is the number of unreported infectious individuals at time t. This system is supplemented by initial condition at time t = t0, (S0, I0, R0, U0).
We assume that the cumulative number of reported symptomatic cases at time t is proportional to the cumulative number of symptomatic cases for each time t. Let's denote the proportion coefficient by f. Therefore, the rate of asymptomatic infectious becoming reported symptomatic is ν1 = fν and the rate of asymptomatic infectious becoming unreported symptomatic is ν2 = (1−f)ν.
Table A1 represents the set of parameters that are fixed by the hypothesis and those evaluated by the country model.
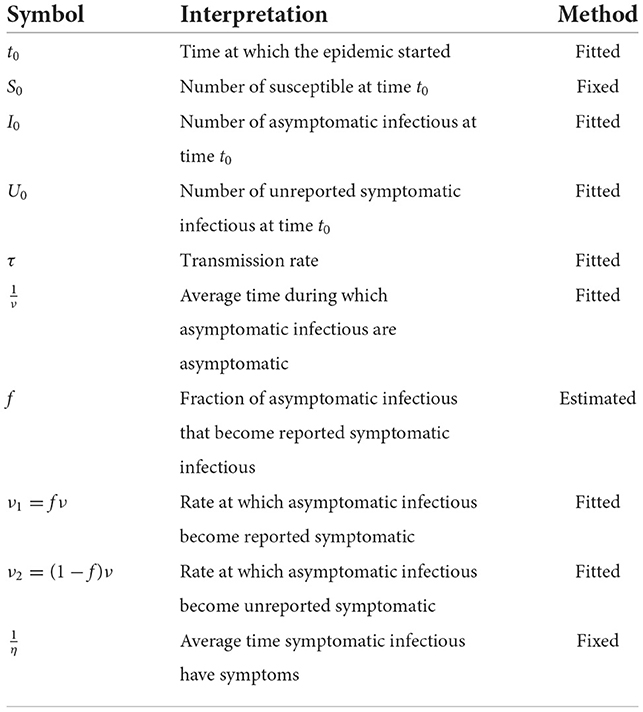
Table A1. Parameters and initial conditions of the model 1.
We assume that and , are fixed for all African countries, which means that the average period of infectiousness of both unreported symptomatic infectious individuals and reported symptomatic infectious individuals and that the average period of infectiousness is 7 days. The fraction of total infectious cases that are reported f is unknown and varies from region to region.
The cumulative number of the reported symptomatic infectious cases at time t is obtained by using the following equation (21):
Since in the early stage of the epidemic, all the infected components of the system grow exponentially and the number of susceptible remains unchanged during a relatively short period of time t, we can fit an exponentially growing curve CR(t) to the cumulative reported cases data defined by the following special form :
with χ1, χ2 and χ3 three positive numbers that we estimate using log-linear regression and the Genetic algorithm optimization method (35).
Following (21), we have:
Keywords: reproduction number R0, epidemiology, Africa, regional analysis, COVID-19, SIR model, SARS-CoV-2
Citation: Naffeti B, Bourdin S, Ben Aribi W, Kebir A and Ben Miled S (2022) Spatio-temporal evolution of the COVID-19 across African countries. Front. Public Health 10:1039925. doi: 10.3389/fpubh.2022.1039925
Received: 08 September 2022; Accepted: 08 November 2022;
Published: 28 November 2022.
Edited by:
Olumide Babatope Longe, Academic City University College, GhanaReviewed by:
Kayode Oshinubi, Bielefeld University, GermanyAna Clara Gomes da Silva, Universidade de Pernambuco, Brazil
Copyright © 2022 Naffeti, Bourdin, Ben Aribi, Kebir and Ben Miled. This is an open-access article distributed under the terms of the Creative Commons Attribution License (CC BY). The use, distribution or reproduction in other forums is permitted, provided the original author(s) and the copyright owner(s) are credited and that the original publication in this journal is cited, in accordance with accepted academic practice. No use, distribution or reproduction is permitted which does not comply with these terms.
*Correspondence: Bechir Naffeti, YmVjaGlyLm5hZmZldGlAZ21haWwuY29t