 Hao-Neng Huang
 Zhou Yang
 Yukun Wang2
 Chun-Quan Ou
 Ying Guan
- 1State Key Laboratory of Organ Failure Research, Department of Biostatistics, Guangdong Provincial Key Laboratory of Tropical Disease Research, School of Public Health, Southern Medical University, Guangzhou, China
- 2Guangdong University of Foreign Studies South China Business College, Guangzhou, China
The traditional campaign-style enforcement in environmental governance has been debated whether its rebound effect is likely to eat away the short-term environmental benefits and subsequently bring about severer pollution. There are methodological challenges in assessing the effect of temporary environmental intervention. By applying the generalized synthetic control method (GSCM), we quantified and characterized the effectiveness of environmental regulations implemented for the G20 Hangzhou Summit held on 4–5 September, 2016. The summit was successful in reducing Air Quality Composite Index by 17.40% (95% CI: 9.53%, 24.60%), 13.30% (95% CI: 4.23%, 21.50%), and 10.09% (95% CI: 2.01%, 17.51%) in the core, strictly-regulated and regulated areas respectively, comparing with the index expected under a “No-G20” scenario during the preparatory period and the summit period (July–September 2016), and the reduction of the levels in specific pollutants (PM10, PM2.5, NO2, and CO) was also observed. Besides, the environmental benefits lasted for at least 3 months after the summit. This study demonstrates that the pollution control measures during the G20 Hangzhou Summit improved air quality immediately and continuously, and the GSCM provides a useful tool for evaluating the intervention effects of environmental regulations.
Introduction
The problem of ambient air pollution has been highlighted because of its substantial health impacts and the ever-increasing public environmental awareness (1). The public is expecting stringent environmental governance. In addition to the long-term regulations, campaign-style enforcement of environmental interventions has gained popularity during mega event periods since the hosts are willing to burnish the country's international image and project its power in the region, and it achieved diverse results in different socioeconomic contexts. For example, the environmental enhancement measures for the Rio Olympics in Brazil resulted in reductions of most pollutants except O3, and the policy effects continued until 43 days after the Olympics (2). The primary goal of these measures was to yield immediate improvement in air quality and thus, obtain a blue sky during mega-events even at the cost of sacrificing some economic development or life convenience to an extent temporarily.
There are methodological challenges in assessing the effect of temporary environmental intervention. The interrupted time-series approach has been widely used to assess the intervention effect by comparing pollution levels between pre-intervention and post-intervention, while it is inapplicable when the intervention period is very short due to the lack of statistical power (3, 4). An alternative method commonly used is the traditional case-control design in which the critical issue is how to select a control unit matched with the treated unit. Since it is often difficult to find a single control unit that provides an appropriate comparison for the treated unit, we could use a weighted average of all control units in the donor pool to better approximate the pre-intervention characteristics of the treated unit, which is the basic concept of the synthetic control method (SCM) (5, 6). The generalized synthetic control method (GSCM) expands the SCM in several aspects. First, it adds to traditional SCM the possibility of calculating the treatment effect of multiple treated units simultaneously. Second, it improves the efficiency of the SCM and enhances its interpretability as it provides appropriate indicators of the uncertainty of estimates (e.g., confidence interval). Third, when the pre-treatment data is sufficient, a built-in cross-validation procedure automatically selects the proper number of factors and reduces the risk of over-fitting (7). To our best knowledge, although this method has been used in political science, economics, and clinical medicine (7–9), the GSCM has not been applied to the evaluation of environmental governance.
The 11th G20 Summit held on 4–5 September, 2016 in Hangzhou, China offered a golden opportunity to test the effectiveness of such interventions. This summit, involving leaders from 20 countries, was intended to bring the global economy onto the track of prosperity and stability and achieve sustainable and inclusive growth. To prepare for “the most important diplomatic event of the year at home,” Hangzhou and its neighboring cities in the Yangtze River Delta (YRD) region have made joint endeavors in restraining transboundary air pollution. Classified by the distances to the central court of the summit (50, 100, and 300 km), all cities within Zhejiang were divided into three types (i.e., the core areas, the strictly-regulated areas, and the regulated areas) which took different control measures. It is crucial to quantify the net effects of this intervention because these results will play an essential role in generalizing, revising, or canceling the interventions in the future.
The majority of these measures were short-term oriented, as they focused on restricting production or traffic and cessation of construction activities temporarily. However, it is worth noting that some efforts related to technological upgrades were also implemented due to this summit. Therefore, it was expected that the environmental benefits from hosting the G20 were not only limited to the duration of the summit but remained well beyond the summit.
Several studies have reported the undoubted short-term effect of this summit, including the reduction in the levels of criteria pollutants and gaseous precursors, inorganic and organic aerosols, and VOCs during the summit period via the WRF-Chem model, while the potential continuous impact of these control measures after the summit remained unknown (10–12). Besides, there was little literature on evaluating the effects in other cities in Zhejiang though they all responded to G20 environmental protection measures in varying degrees. Although composite indicators like the air quality index (AQI) can describe the overall effect, it is of great importance to figure out which pollutants are prone to be suppressed or rebounded due to the intervention. Previous studies showed inconsistent results when examining the effectiveness of emission control measures on O3. One study estimated a reduction of 11.7% in O3 level using a global chemical transport model during G20 in Hangzhou (13), and the drop was estimated to be 25.4% in another study using a Weather Research and Forecast and Community Multi-scale Air Quality model (11). However, in other two studies, O3 did not decrease or even increased (14, 15). The discrepancies in previous studies may result from the differences in the analytical methods used and the comparison period of interest.
In this study, using the GSCM in the evaluation of environmental regulations, we aim to quantify the effects of policy intervention related to the G20 Summit on the overall air quality and the levels of specific pollutants in different periods.
Materials and methods
Data
In this study, the Air Quality Composite Index (AQCI) was used as the primary outcome. Therefore, we considered all 74 cities with AQCI data available before 2018 provided by the Ministry of Ecology and Environment of China (https://www.mee.gov.cn/hjzl/dqhj/cskqzlzkyb/). Among 74 cities (11 cities in Zhejiang as treated cities and 63 cities as potential control cities), 14 control cities were excluded where the meteorological data were unavailable from the China Meteorological Data Center. Finally, our study was based on 49 control cities (Supplementary Table 1) and 11 treated cities including four cities (Hangzhou, Jiaxing, Huzhou, and Shaoxing) in the core areas, three (Ningbo, Jinhua, and Quzhou) in the strictly-regulated areas and four (Lishui, Taizhou, Wenzhou, and Zhoushan) in the regulated areas (Figure 1). The monthly data of six primary air pollutants were collected from the China Air Quality Online Monitoring and Analysis Platform (https://www.aqistudy.cn/) from July 2014 to December 2016. The AQCI is a non-dimensional index that has been widely used to reflect urban air quality. The China Ministry of Ecology and Environment ranks the air quality of the primary cities every month according to AQCI (16, 17). Compared to the air quality index (AQI) which only reflects the level of the single primary pollutant with the highest individual air quality index, AQCI integrates the information of six primary pollutants (SO2, NO2, PM10, PM2.5, CO, and O3) (18). Moreover, AQI cannot convey definite information about the seriously-polluted situation since the Chinese air pollution system does not report the actual level of AQI beyond 500. Thus, we considered monthly AQCI instead of AQI as one of the primary outcomes. In brief, the calculation of AQCI is as follows: First, calculate the single index of each air pollutant i from Ci/Si, where Ci represents monthly average concentrations for SO2, NO2, PM10, PM2.5, or the 95th percentile of daily mean level for CO or the 90th percentile of daily maximum 8-h level for O3; Si means corresponding of annual average concentrations of the national ambient air quality secondary standards in China (GB3095-2012, Supplementary Table 2). Then, the AQCI was calculated by adding up six indexes.
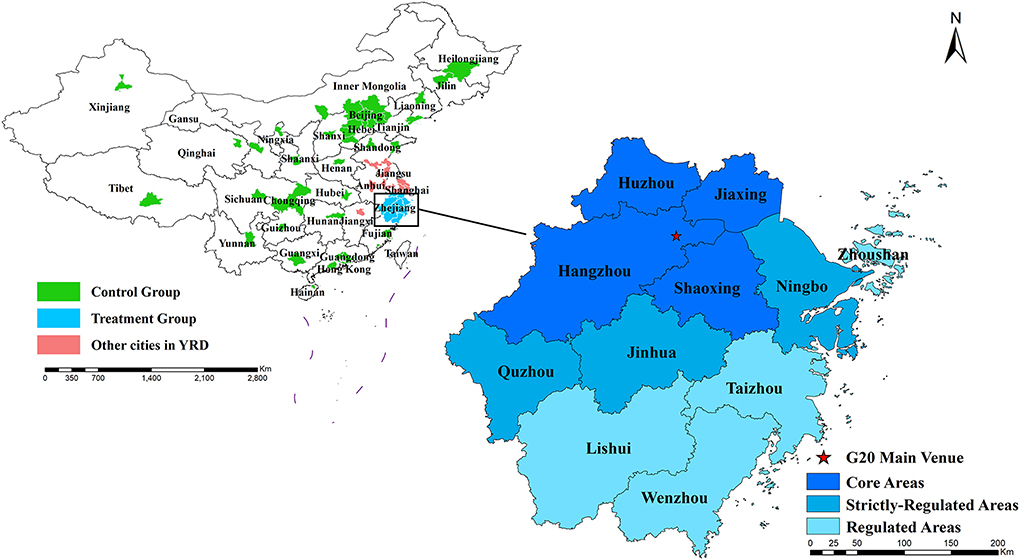
Figure 1. The distribution of 60 cities involved in this study.
Meteorological impacts on air pollution have been well-documented (19). In this study, 4 monthly meteorological factors (average rainfall, average wind speed, average temperature, and average relative humidity) were selected which were calculated as the average of daily data collected from the China Meteorological Data Center (http://data.cma.cn/). Considering the potential effect of other environmental and socioeconomic factors on air quality reported in literature and the availability of data (20, 21), we obtained relevant data from the China City Statistical Yearbook (2014–2016), including GDP per capita, green area, and population size which account for the economic development level and the productivity of a city, environmental purification capacity and the emitting behavior in terms of consumption. Considering the heteroscedasticity of data, we transformed the measurements into their natural logarithm form except for rain and temperature because of zero and negative values (20). Although the raw data suggested a decline in AQCI in June 2016, to avoid data-driven specification of the starting time of intervention, we pre-specified July 2016 as the starting point according to official documentation, since the 2016 Air Pollution Prevention and Control Implementation Plan issued by the Department of Ecological and Environment of Zhejiang Province listed many measures for the air pollution control related to the G20 Hangzhou Summit with the majority of the rectification and reform deadlines being set at the end of June 2016 (22). The inclusion of June 2016 in the control period may lead to a conservative estimation of the intervention effect. The pre-treatment periods were defined as July 2014–June 2016. And we defined two different treatment period: one was restricted to July 2016-September 2016 (preparatory period and summit period) to investigate the short-term effect of treatment, the other treatment period was extended to the end of 2016 (i.e., July 2016-December 2016, including preparatory period, summit period, and post-summit period), to examine the persistence of the intervention effect.
Method
In this study, we used the GSCM to estimate the policy effect of the G20 Hangzhou Summit on air quality. It constructs the counterfactual based on a linear interactive fixed effects model (LIFEM) that allows for the heterogeneity of treatment effects across units and time. The model can be expressed as:
where Yit is the logged average level of the single pollutant or AQCI in each city i in month t, Dit is the treatment indicator with 0 and 1 indicating pre-treatment (before July 2016) and post-treatment (in or after July 2016) for the treated units and with 0 at all time (July 2014–December 2016) for the control units, and δit means the heterogeneous treatment effect; xit is a vector of observed covariates including meteorological (i.e., rainfall, wind speed, temperature, and relative humidity) and environmental and socioeconomic factors (i.e., GDP per capita, green area, and population size), and β is the corresponding coefficients; ft represents unobserved common factors and λi is unknown factor loadings; εit is external shocks for city i in month t and follows the normal distribution with a mean of zero. Based on the potential outcome framework, our main purpose is to calculate the average treatment effect on the treated (ATT):
where Ntr is the number of treated cities. Since Yit(1) can be observed in the post-treatment period, we could estimate the counterfactual Yit(0) as: , in which and is obtained from a LIFEM only using all control cities data with some constraints on ft, and λi. The is calculated from the other LIFEM by minimizing the mean squared error (MSE) of the pre-treatment outcome for the treated cities. ATT represents the percent change of AQCI or specific pollutant concentrations in different areas compared to the counterfactual in the “no-G20” scenario. The 95% confidence intervals and the P-value were estimated using a parametric bootstrap procedure. A built-in cross-validation scheme was used to automatically select the optimal number of unobserved factors of the LIFEM that produces the lowest MSE, which minimizes the risk of overfitting and is easy to implement (7). Root mean squared error (RMSE), mean absolute error (MAE), and mean absolute percent error (MAPE) were used to examine the appropriateness and accuracy of the counterfactual.
Since the 2010 Shanghai World Expo, if any mega-events are held in YRD, the authorities of surrounding cities will issue some short-term environmental regulations for fear of emissions transport to ensure the host city's air quality. Therefore, the cities under the YRD regional joint prevention and control strategy including Shanghai and cities in Jiangsu, Anhui, and Jiangxi province were removed from the donor pool in the main analysis. In the sensitivity analysis, these cities were included to explore the net effect of control measures in the treated cities under study and clarify the robustness of the main results. Additionally, we performed the other sensitivity analysis by adjusting the treatment timing backward to examine whether the estimated causal effects are consistent (i.e., whether the estimated factors and loadings dramatically change when we shorten the pre-treatment periods a little).
We performed the analysis using the package of gsynth in R 4.1.1. A two-sided P < 0.05 was considered as statistical significance.
Results
Figure 2 shows the levels of the AQCI and six pollutants in three areas (core, highly-regulated and regulated areas). Compared with the same period in 2014 and 2015, July to September 2016 witnessed a downward trend in AQCI and the average monthly concentrations for most air pollutants in all areas, especially for PM2.5, NO2, and SO2, except that the concentrations of PM10 and O3 in the core areas were higher than those in 2014 and 2015. During the G20 period (September 4–5, 2016) in the core area, the observed daily mean concentrations of PM2.5, PM10, NO2, SO2, and CO were 36.75, 65.75, 19.63, 8.75μg/m3, 0.65mg/m3 respectively, all well below national air quality standards (Supplementary Table 2), whereas the level of O3 (140.25 μg/m3) almost exceeded the standard (160 μg/m3).
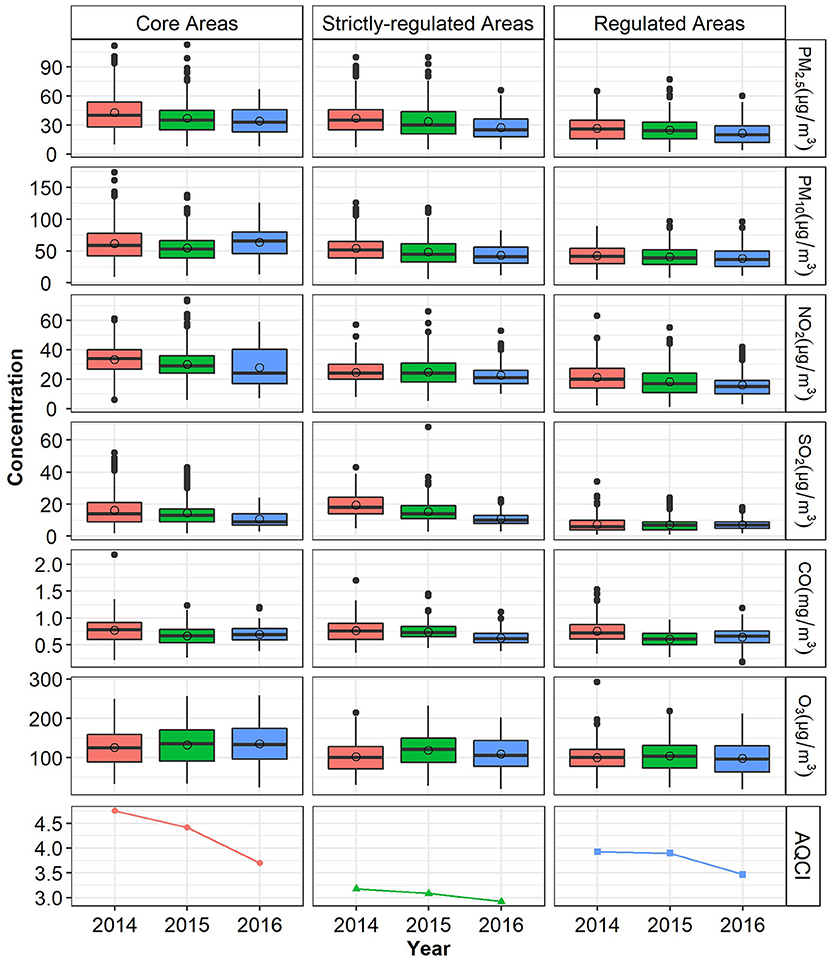
Figure 2. AQCI and main air pollutants concentration before and during the G20 period. Time span: July–September. The open circle represents the mean.
Figure 3 illustrates that the GSCM estimator fitted AQCI well in the pre-intervention period (July 2014–June 2016). The MAPE ranged from 4.4 to 6.4% and the RMSE was 0.079–0.113 in three types of areas (Supplementary Table 3). From July to September 2016, there was an average reduction of 17.40% (95% CI: 9.53%, 24.60%) in AQCI in the core areas when comparing the actual level to the counterfactual that represents the business-as-usual scenario, and AQCI also declined by 13.30% (95% CI: 4.23%, 21.50%) and 10.09% (95% CI: 2.01%, 17.51%) in the strictly-regulated areas and the regulated areas, respectively. Significant benefits from the summit-related environmental regulations were also observed for three pollutants (PM2.5, PM10, and NO2), with a decrease of 18.23% (95% CI: 6.30%, 28.64%), 21.58% (95% CI: 8.18%, 33.03%), and 24.51% (95% CI: 13.06%, 34.47%), respectively (Table 1). The reduction of PM2.5 and CO was also noticeable in the strictly-regulated areas, with a decrease of 20.12% (95% CI: 6.25%, 31.93%) and 13.17% (95% CI: 0.93%, 23.89%), respectively. Similar results were obtained from the regulated areas, although the reduction rate was relatively lower.
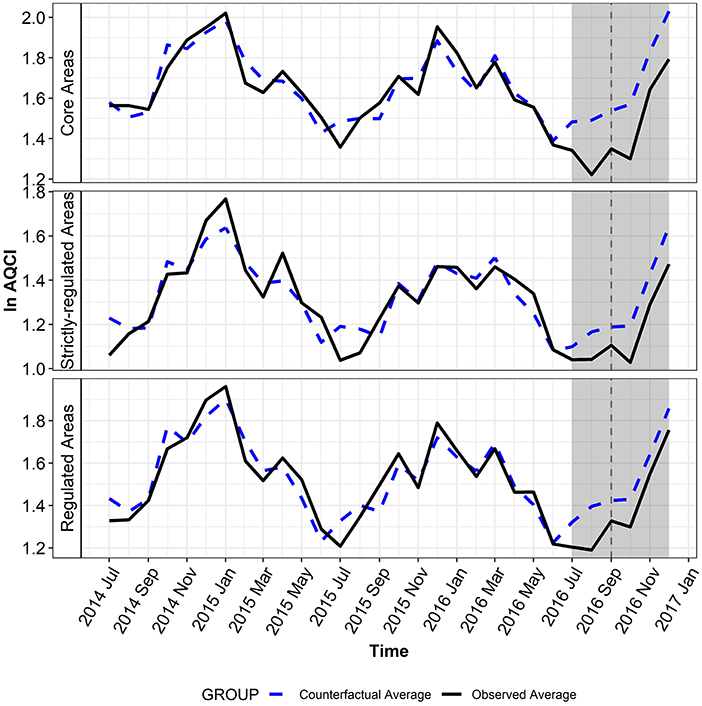
Figure 3. The observed and counterfactual monthly average of ln AQCI. The treatment period is shaded in gray and the vertical dashed line presents the time of the summit.
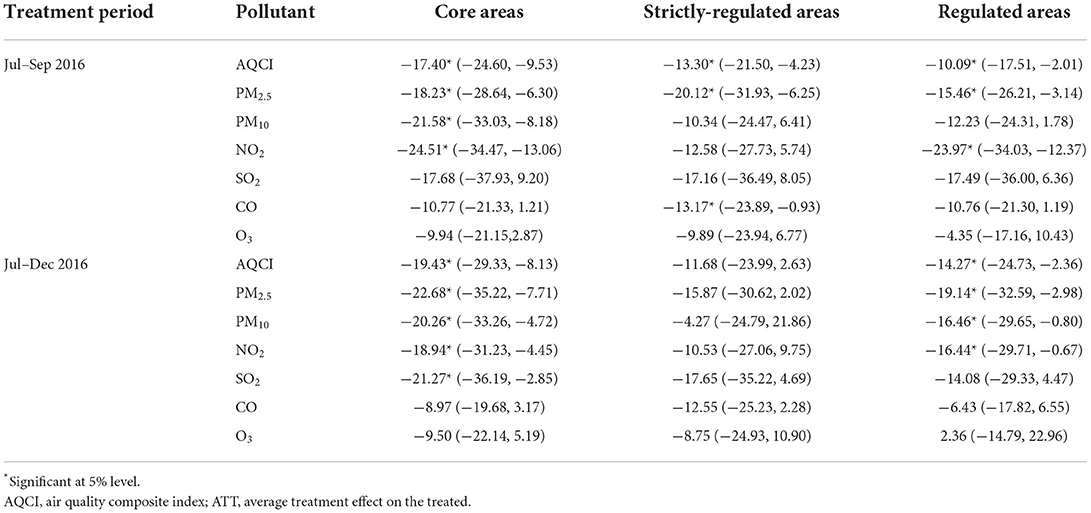
Table 1. The effect (ATT with 95% CI) of policy on AQCI and six main pollutants in three types of area.
Table 1 presents the effect of policy on AQCI and six main pollutants till December (i.e., 3 months after the summit). Although the time span of post-treatment was extended, a significant reduction of 19.43% (95% CI: 8.13%, 29.33%) was still found in the AQCI in the core areas. The PM2.5, PM10 concentration in these areas decreased by 22.68% (95% CI: 7.71%, 35.22%) and 20.26% (95% CI: 4.72%, 33.26%), respectively. For NO2 and SO2, the reduction level was also noticeable. In addition, the regulated areas witnessed significant decreases in AQCI, PM2.5, PM10, and NO2 while all decreases in the strictly-regulated areas were not statistically significant.
In the sensitivity analyses, when reconstructing the control group with the inclusion of other cities in YRD, the G20 Hangzhou Summit still had a positive impact on the air quality in three types of areas. Specifically, the estimated reductions in AQCI were 16.10% (95% CI: 8.35%, 23.21%), 10.42% (95% CI: 1.29%, 18.71%), and 8.89% (95% CI: 0.58%, 16.51%) during July to September in the core, strictly-regulated and regulated areas, respectively (Supplementary Table 4). In addition, backdating the intervention for 1 or 2 months (i.e., May or June) does not obviously change the estimated ATT after July 2016, and the ATT before July 2016 maintained stably at a very low and non-significant level (Supplementary Table 5), reassuring the appropriateness of treatment timing we pre-defined.
Discussion
To our knowledge, this is the first study using the GSCM to evaluate the effectiveness of the environmental intervention. The model specification of the GSCM is a crucial issue. We considered various covariates, including meteorological measures and GDP, population size and green area in each city in the model. The weighted combination of 49 control cities fitted the treated cities well during the pre-treatment period, indicating that the selection of the control group is appropriate and the construction of the counterfactual is reasonable. Our study verifies that the GSCM offers a valid tool for environmental program evaluation, especially when the commonly used interrupted time-series approach or the traditional case-control design is inapplicable. For example, in this study, the post-intervention time points were only 3 or 6, which was far from adequate in terms of statistical power (23–25).
Our study indicated the overall air quality in Hangzhou was improved during the summit period, which was consistent with previous studies although the effect size differed since they were based on different study periods. For instance, a simulation-based study integrated with the WRF-CMAQ model showed the predicated concentrations of PM2.5 were reduced by 56% from September 4 to September 5, 2016 in Hangzhou (11). Another study suggested the SO2, NO2, PM10, and PM2.5 concentrations in Hangzhou decreased by 42.6, 57.1, 36, and 38.5% respectively compared to the same period (August 24–September 6) from the 5 preceding years (15). Moreover, different from previous studies, our study was based on a larger spatial and temporal scale and attempted to evaluate the policy effect comprehensively. We further revealed that the positive impacts could be traced back to July and last until December, and all cities in Zhejiang in addition to Hangzhou gained the G20 benefits in varying degrees since. In general, more substantial and persistent improvement in AQCI was observed in the core areas than in the strictly-regulated and regulated areas.
The remarkable benefits were primarily attributable to stringent short-term environmental governance. Since August 24, 2016, a large-scale shutdown of factories had begun in Hangzhou and surrounding areas. It's noteworthy that citizens in Hangzhou were arranged to enjoy a 7-day holiday since 1 September, and they were encouraged to travel outside Hangzhou. The summer vacation of 2016 was also postponed to September 8, later than the summit. Since the benefits from these stringent short-term measures cannot be sustained, more attention should be paid to the long-term-oriented measures implemented for the summit. To control three categories of pollution (industrial pollution, coal-fired pollutants, and vehicle exhaust), specific actions have been taken successively during the preparatory period of the summit since July 2016, including retrofitting projects related to volatile organic compounds (VOCs) in polluting industries (i.e., coating, printing), expanding the restricted areas that disallow the combustion of high-polluting fuels, technological upgrades in five key sectors (i.e., steel, cement, chemical engineering, petrochemical, and non-ferrous metal), renewal of high-emission vehicles and replacing fossil fuels with clean energy and so on. As a result, continuous and remarkable improvements in AQCI from July to December 2016 were consistently observed in the core and the controlled areas. It suggests that, stimulated by mega-events, governments can achieve long-lasting environmental benefits only by incorporating some short-term governance with some long-term environmental regulation policies from the perspective of sustainability.
Our study highlighted the importance of joint prevention and control of atmospheric pollutants considering the transboundary nature of air pollution. To ensure blue skies in Hangzhou during the summit, other YRD cities surrounding Zhejiang had also released plans to restrict air pollution before G20. For instance, about 255 manufacturers in Shanghai related to petrochemical, steel, and cement were projected to temporarily reduce their production or shut down. We observed air quality improvement in three treatment areas including 10 cities in Zhejiang other than Hangzhou, and our sensitivity analyses revealed that the estimated AQCI reductions in three areas became smaller once nine YRD cities outside Zhejiang are included in the control group, indicating that YRD joint prevention and control measures played a certain role in fighting for G20 Blue Sky Protection Campaign. Regardless of targeting local or regional improvement of air quality, this cooperation needs to be strengthened in the future since long-range transport may offset the local emission control effects to some extent (26).
A few empirical studies have provided controversial evidence on the effectiveness of the G20 emission control measures during the summit period (13, 15). In our study, based on the causal framework of GSCM, we did not detect a significant reduction of O3, which may be due to the O3-VOCs-NOx sensitivity pattern after implementing emission control measures. A previous study has shown that O3 in urban Hangzhou mainly presents VOC-limited in summer (27). That is to say, if NOx emission control measures are stronger than the VOCs emission control measures in these areas, the inhibitory effect of NOx on O3 production will be weak, and finally, the O3 concentration will rise up. Additionally, our results did show a substantial reduction in the NO2 concentration. Similarly, during the 2014 APEC period in Beijing, the regional reduction in VOCs was significantly less than NOx, which increased the O3 concentration during the APEC conference (28–30). The sources of O3 precursors are complex, with a wide variety of species. The conventional PM2.5-oriented air quality regulations may deteriorate O3 levels because PM2.5 could serve as a scavenger of NOx and hydroperoxy radicals which may otherwise react with NO to produce O3 (31, 32). Therefore, a joint control strategy for PM2.5 and O3 is necessary and requires further investigation.
The results reported herein should be considered in light of some limitations. We investigated the net effects of the G20 Summited-related joint pollution control measures on air quality in 11 cities in Zhejiang. However, the spillover effects for YRD cities were not assessed, leading to underestimating the total effect of the intervention. In addition, isolating the effect of the G20 Summit on pollutant concentrations is challenging since pollution levels are also influenced by meteorological conditions and other factors. Our study attempted to address the impacts of weather and some socioeconomic factors on pollution levels by incorporating them in the model. However, we cannot avoid the possibility that some other influencing factors were not observed. Besides, since a series of intervention measures have been taken and evaluated together, the contribution of each specific measure to the environmental benefits needs further investigation.
Conclusion
The air pollution control measures implemented for the G20 Summit exerted remarkable improvement in AQCI and reduction in the levels of specific pollutants (PM2.5, PM10, NO2, and CO). Thankfully, the G20 Blue Sky is not a temporary show, and the constant improvement of air quality was observed to last at least 3 months after the summit, which is mainly attributed to a series of stringent policies restricting emissions and technical upgrades. This causal effect was estimated using the GSCM, which provides a useful tool for evaluating the intervention effects of environmental regulations.
Data availability statement
Publicly available datasets were analyzed in this study. This data can be found at: The AQCI data are available from the Ministry of Ecology and Environment (https://www.mee.gov.cn/hjzl/dqhj/cskqzlzkyb/) and air quality data are accessible from the China Air Quality Online Monitoring and Analysis Platform (https://www.aqistudy.cn/). Meteorological data are available from the China Meteorological Data Center (http://data.cma.cn/) upon reasonable request.
Author contributions
C-QO: conceptualization, supervision, and funding acquisition. YG: conceptualization and supervision. H-NH: data curation, writing—original draft preparation, and visualization. ZY and YW: writing—reviewing and editing. All authors read and approved the final manuscript.
Funding
This work was supported by the National Nature Science Foundation of China (81973140).
Conflict of interest
The authors declare that the research was conducted in the absence of any commercial or financial relationships that could be construed as a potential conflict of interest.
Publisher's note
All claims expressed in this article are solely those of the authors and do not necessarily represent those of their affiliated organizations, or those of the publisher, the editors and the reviewers. Any product that may be evaluated in this article, or claim that may be made by its manufacturer, is not guaranteed or endorsed by the publisher.
Supplementary material
The Supplementary Material for this article can be found online at: https://www.frontiersin.org/articles/10.3389/fpubh.2022.1021177/full#supplementary-material
Abbreviations
AQI, air quality index; AQCI, air quality composite index; ATT, average treatment effect; GSCM, generalized synthetic control method; LIFEM, linear interactive fixed effects model; MSE, mean squared error; SCM, synthetic control method; YRD, Yangtze River Delta.
References
1. Loxham M, Davies DE, Holgate ST. The health effects of fine particulate air pollution. Br Med J. (2019) 2019:bmj.l6609. doi: 10.1136/bmj.l6609
2. De La Cruz ARH, Dionisio Calderon ER, França BB, Réquia WJ, Gioda A. Evaluation of the impact of the Rio 2016 Olympic Games on air quality in the city of Rio de Janeiro, Brazil. Atmos Environ. (2019) 203:206–15. doi: 10.1016/j.atmosenv.2019.02.007
3. Taljaard M, McKenzie JE, Ramsay CR, Grimshaw JM. The use of segmented regression in analysing interrupted time series studies: an example in pre-hospital ambulance care. Implementation Sci. (2014) 9:77. doi: 10.1186/1748-5908-9-77
4. Wagner AK, Soumerai SB, Zhang F, Ross-Degnan D. Segmented regression analysis of interrupted time series studies in medication use research. J Clin Pharm Ther. (2002) 27:299–309. doi: 10.1046/j.1365-2710.2002.00430.x
5. Abadie A, Diamond A, Hainmueller J. Synthetic control methods for comparative case studies: estimating the effect of California's tobacco control program. J Am Stat Assoc. (2010) 105:493–505. doi: 10.1198/jasa.2009.ap08746
6. Abadie A, Cattaneo MD. Econometric methods for program evaluation. Annu Rev Econ. (2018) 10:465–503. doi: 10.1146/annurev-economics-080217-053402
7. Xu Y. Generalized synthetic control method: causal inference with interactive fixed effects models. Polit Anal. (2017) 25:57–76. doi: 10.1017/pan.2016.2
8. Mader S, Rüttenauer T. The effects of non-pharmaceutical interventions on COVID-19-related mortality: a generalized synthetic control approach across 169 countries. SocArXiv. (2021). doi: 10.31235/osf.io/v2ef8
9. Zhou C. Has the construction of the free trade zone increased the enterprise's total factor productivity—evidence from generalized synthetic control. Appl Fin Account. (2020) 6:35. doi: 10.11114/afa.v6i2.4983
10. Chen K, Metcalfe SE, Yu H, Xu J, Xu H, Ji D, et al. Characteristics and source attribution of PM2.5 during 2016 G20 Summit in Hangzhou: efficacy of radical measures to reduce source emissions. J Environ Sci. (2021) 106:47–65. doi: 10.1016/j.jes.2021.01.010
11. Li P, Wang L, Guo P, Yu S, Mehmood K, Wang S, et al. High reduction of ozone and particulate matter during the 2016 G-20 summit in Hangzhou by forced emission controls of industry and traffic. Environ Chem Lett. (2017) 15:709–15. doi: 10.1007/s10311-017-0642-2
12. Zhang G, Xu H, Wang H, Xue L, He J, Xu W, et al. Exploring the inconsistent variations in atmospheric primary and secondary pollutants during the 2016 G20 summit in Hangzhou, China: implications from observations and models. Atmos Chem Phys. (2020) 20:5391–403. doi: 10.5194/acp-20-5391-2020
13. Wang Y, Liao H. Effect of emission control measures on ozone concentrations in Hangzhou during G20 meeting in 2016. Chemosphere. (2020) 261:127729. doi: 10.1016/j.chemosphere.2020.127729
14. Su W, Liu C, Hu Q, Fan G, Xie Z, Huang X, et al. Characterization of ozone in the lower troposphere during the 2016 G20 conference in Hangzhou. Sci Rep. (2017) 7:17368. doi: 10.1038/s41598-017-17646-x
15. Wu K, Kang P, Tie X, Gu S, Zhang X, Wen X, et al. Evolution and assessment of the atmospheric composition in Hangzhou and its surrounding areas during the G20 summit. Aerosol Air Qual Res. (2019) 9:2757–69. doi: 10.4209/aaqr.2018.12.0481
16. Lin X, Wang D. Spatiotemporal evolution of urban air quality and socioeconomic driving forces in China. J Geogr Sci. (2016) 26:1533–49. doi: 10.1007/s11442-016-1342-8
17. Sheng N, Tang UW. The first official city ranking by air quality in China—a review and analysis. Cities. (2016) 51:139–49. doi: 10.1016/j.cities.2015.08.012
18. Zhang K, Ba M, Meng H, Sun Y. An air quality composite index based on pollutant concentration factor analysis. Afr J Math Comput Sci Res. (2019) 12:10–6. doi: 10.5897/AJMCSR2019.0788
19. Li R, Wang Z, Cui L, Fu H, Zhang L, Kong L, et al. Air pollution characteristics in China during 2015–2016: spatiotemporal variations and key meteorological factors. Sci Tot Environ. (2019) 648:902–15. doi: 10.1016/j.scitotenv.2018.08.181
20. Grunewald N, Martinez-Zarzoso I. Did the Kyoto Protocol fail? An evaluation of the effect of the Kyoto Protocol on CO2 emissions. Envir Dev Econ. (2016) 21:1–22. doi: 10.1017/S1355770X15000091
21. Han L, Zhou W, Li W, Li L. Impact of urbanization level on urban air quality: a case of fine particles (PM 25) in Chinese cities. Environ Poll. (2014) 194:163–70. doi: 10.1016/j.envpol.2014.07.022
22. Sthjt.zj.gov.cn. Air Pollution Prevention and Control Implementation Plan. Available online at: http://sthjt.zj.gov.cn/art/2016/4/14/art_1385790_13470946.html (accessed August 26, 2022).
23. Hawley S, Ali MS, Berencsi K, Judge A, Prieto-Alhambra D. Sample size and power considerations for ordinary least squares interrupted time series analysis: a simulation study. Clin Epidemiol. (2019) 11:197–205. doi: 10.2147/CLEP.S176723
24. Liu W, Ye S, Barton BA, Fischer MA, Lawrence C, Rahn EJ, et al. Simulation-based power and sample size calculation for designing interrupted time series analyses of count outcomes in evaluation of health policy interventions. Contempor Clin Trials Commun. (2020) 17:100474. doi: 10.1016/j.conctc.2019.100474
25. Penfold RB, Zhang F. Use of interrupted time series analysis in evaluating health care quality improvements. Acad Pediatr. (2013) 13:S38–44. doi: 10.1016/j.acap.2013.08.002
26. Ji Y, Qin X, Wang B, Xu J, Shen J, Chen J, et al. Counteractive effects of regional transport and emission control on the formation of fine particles: a case study during the Hangzhou G20 summit. Atmos Chem Phys. (2018) 18:13581–600. doi: 10.5194/acp-18-13581-2018
27. Li K, Chen L, Ying F, White SJ, Jang C, Wu X, et al. Meteorological and chemical impacts on ozone formation: a case study in Hangzhou, China. Atmos Res. (2017) 196:40–52. doi: 10.1016/j.atmosres.2017.06.003
28. Li X, Qiao Y, Zhu J, Shi L, Wang Y. The “APEC blue” endeavor: causal effects of air pollution regulation on air quality in China. J Clean Prod. (2017) 168:1381–8. doi: 10.1016/j.jclepro.2017.08.164
29. Sun Y, Wang Z, Wild O, Xu W, Chen C, Fu P, et al. “APEC blue”: secondary aerosol reductions from emission controls in Beijing. Sci Rep. (2016) 6:20668. doi: 10.1038/srep20668
30. Wang Z, Li Y, Chen T, Li L, Liu B, Zhang D, et al. Changes in atmospheric composition during the 2014 APEC conference in Beijing: multiobservation of air composition. J Geophys Res Atmos. (2015) 120:12695–707. doi: 10.1002/2015JD023652
31. Li K, Jacob DJ, Liao H, Shen L, Zhang Q, Bates KH. Anthropogenic drivers of 2013–2017 trends in summer surface ozone in China. Proc Natl Acad Sci USA. (2019) 116:422. doi: 10.1073/pnas.1812168116
Keywords: air pollution, generalized synthetic control method, G20 Hangzhou Summit, causal inference, mega event
Citation: Huang H-N, Yang Z, Wang Y, Ou C-Q and Guan Y (2022) The use of generalized synthetic control method to evaluate air pollution control measures of G20 Hangzhou Summit. Front. Public Health 10:1021177. doi: 10.3389/fpubh.2022.1021177
Received: 17 August 2022; Accepted: 16 September 2022;
Published: 03 October 2022.
Edited by:
Lin Yang, Hong Kong Polytechnic University, Hong Kong SAR, ChinaCopyright © 2022 Huang, Yang, Wang, Ou and Guan. This is an open-access article distributed under the terms of the Creative Commons Attribution License (CC BY). The use, distribution or reproduction in other forums is permitted, provided the original author(s) and the copyright owner(s) are credited and that the original publication in this journal is cited, in accordance with accepted academic practice. No use, distribution or reproduction is permitted which does not comply with these terms.
*Correspondence: Ying Guan, c211MDA4JiN4MDAwNDA7MTI2LmNvbQ==; Chun-Quan Ou, b3VjaHVucXVhbiYjeDAwMDQwO2hvdG1haWwuY29t