 Ye Wang
 Li Pan2
 Guangliang Shan
- 1School of Population Medicine and Public Health, Chinese Academy of Medical Sciences and Peking Union Medical College, Beijing, China
- 2Department of Epidemiology and Statistics, Institute of Basic Medical Sciences, Chinese Academy of Medical Sciences and Peking Union Medical College, Beijing, China
- 3School of Medicine, Sichuan Cancer Center, Sichuan Cancer Hospital & Institute, University of Electronic Science and Technology of China, Chengdu, China
- 4Puge Center for Disease Control and Prevention, Liangshan, China
- 5Xichang Center for Disease Control and Prevention, Liangshan, China
- 6Sichuan Academy of Medical Sciences and Sichuan Provincial People's Hospital, Chengdu, China
This study aimed to determine the association between the absolute mass, distribution, and relative ratio of body fat and muscle with the metabolically unhealthy (MU) phenotypes in normal weight and overweight/obesity in Yi people in China. The cross-sectional data from the Yi Migrants Study was used, which included 3,053 Yi people aged 20–80 years from the rural and urban sets. Participants were classified according to body mass index and metabolic status. Body composition including body fat percentage (BFP), fat mass index (FMI), visceral fat grade (VFG), muscle mass index (MMI), and muscle/fat ratio (M/F) were measured by bioelectrical impedance analysis. Restricted cubic spline and logistics regression models were used to test the associations between body composition parameters with MU phenotypes. Receiver-operating characteristic curves (ROC) were used to analyze the predictive value of MU phenotypes. Among the normal weight and overweight/obesity, 26.31% (497/1,889) and 52.15% (607/1,164) were metabolically unhealthy. Stratified by BMI, covariance analysis showed higher body fat (BFP, FMI, and VFG) and MMI in MU participants than in healthy participants. BFP, FMI, VFG, and MMI were positively associated with MU phenotypes both in normal weight and overweight/obesity after adjustment. M/F was significantly lower than MU participants and was negatively associated with MU phenotypes. BFP, FMI, VFG, and M/F could better predict MU phenotypes than BMI. We concluded that BFP, FMI, and VFG were positively associated with MU phenotypes, while M/F was negatively associated with MU phenotypes across the BMI categories in Yi people. Body fat and muscle measurement could be a valuable approach for obesity management.
Introduction
The prevalence of overweight and obesity has been sharply increasing in the last three decades worldwide including in China (1). The prevalence of obesity in Chinese adults was reported to increase from 3.6% in 1992 to 16.4% in 2015–19 (1). Obesity individuals are at higher risk of developing a wide range of diseases including cardiovascular disease (CVD), diabetes mellitus, chronic kidney disease, and some types of cancer (2). Nevertheless, the phenotypes of overweight and obesity are heterogeneous. Emerging evidence indicates that not all obese individuals develop metabolic disorders, and this subgroup of obese individuals is considered metabolically healthy obesity (MHO) (3). They have normal insulin sensitivity and inflammatory response and are usually free from cardiovascular metabolic risk factors (4). Similarly, the part of the normal-weight individuals with adverse metabolic status has also been reported, which is called metabolically unhealthy normal-weight (MUNW) (5).
Recent studies reveal the fact that the favorable metabolic profile might be a temporary status. A 0.5 million Chinese adults cohort showed that over one-third of the overweight or obese individuals converted from metabolic healthy to unhealthy phenotypes through 10 years of follow-up (6). Interestingly, participants with a stable MHO phenotype were found to have a comparable risk of CVD as metabolically healthy normal-weight (MHNW) individuals (7). Therefore, maintaining a healthy metabolic profile appears to be a valid approach to preventing cardiometabolic diseases (8).
The exact mechanisms underlying the metabolically healthy vs. unhealthy phenotypes remain to be explored. The dietary factors, physical activity, inflammation, and genetic factors were reported to contribute to MHO (9–12). Recent human studies suggest that adipose tissue function, body fat distribution, skeletal muscle et al. may be key factors in insulin sensitivity and metabolic phenotypes (13). Whether the effect of body composition indicators on metabolic health is consistent across all BMI categories, and whether the body fat and muscle predict metabolic phenotypes more precisely than BMI remain to be discussed.
In this present cross-sectional study, using population-based data, we aimed to determine the association between the absolute mass, distribution, and relative ratio of body fat and muscle with the metabolically unhealthy phenotypes in normal weight and overweight/obesity in Yi people in China. We also hypothesized that body fat and muscle indicators were more precise predictors than BMI in predicting metabolic phenotypes.
Materials and methods
Study population
The current study was based on a cross-sectional survey–The Yi Migrant Study, which was carried out in Liangshan Yi Autonomous Prefecture, Sichuan, China in 2015. The Yi Migrant Study was initiated in the 1980's and was designed to assess the cardiovascular risks as well as the determinants in Yi people using a migration epidemiology study design. Continuous field works have been conducted in different periods following the same procedure. A stratified cluster sampling method was used to recruit participants aged 20 to 80 years. Details of the sampling procedures have been described previously (14, 15).
In this migration epidemiology study, Yi people whose parents were both of Yi ethnicity can be included. Yi farmers were defined to be Yi people living in rural areas since birth. Yi migrants were defined to be Yi people who were born in rural areas and then migrated and had been living in an urban area for at least 1 year and were still living in the urban area. All participants provided written informed consent before the survey.
Data collection
Demographic characteristics (age, sex, education level, personal annual income, et al.), disease history (hypertension, diabetes, cardiovascular disease, et al.), and health-related lifestyle factors (smoking status, drinking status, physical activity, et al.) were collected by face-to-face interviews. A standard questionnaire was administered by well-trained staff to obtain the above information (15).
Anthropometric measurements including height, weight, and body composition were taken using calibrated instruments with standard protocols. Weight and body composition were measured in light clothing by bioelectrical impedance analysis (BIA) using the body composition analyzer (BC-420, TANITA, Japan). The measurements were recorded with an accuracy of 0.1. Standing height was measured barefoot by a wall-mounted stadiometer with an accuracy of 0.1 cm.
Blood pressure was measured using a digital sphygmomanometer (Omron HEM907, Japan). For each participant, systolic blood pressure (SBP) and diastolic blood pressure (DBP) were measured three times at one-minute intervals, after at least 5 min of rest in a seated position. The average of the three measurements was recorded.
A 9-ml venous blood sample with at least 8 h of fasting overnight was collected. The samples were centrifuged, aliquoted, and immediately frozen for future tests. Fasting blood glucose (FBG, mmol/L), triglyceride (TG, mmol/L), total cholesterol (TC, mmol/L), high-density lipoprotein cholesterol (HDL-C, mmol/L), and low-density lipoprotein cholesterol (LDL-C, mmol/L) levels were tested in Beijing Hepingli Hospital.
Definition
Body mass index (BMI) was calculated as weight in kilograms divided by the square of height in meters (kg/m2). In this study, BMI was categorized into normal-weight (<24 kg/m2) and overweight/obesity (≥24 kg/m2) according to the criteria for Chinese (16).
Body fat percentage (BFP, %), fat mass index (FMI, kg/m2), visceral fat grade (VFG), and muscle mass index (MMI, kg/m2) were body composition parameters of interest. BFP and VFG were directly measured by the body composition analyzer. FMI and MMI were calculated as fat mass and muscle mass in kilograms divided by the square of height in meters. The muscle/fat ratio (M/F) was calculated as fat mass divided by muscle mass.
Four cardiometabolic risk factors were used to determine metabolically unhealthy phenotypes in this study: (1) elevated blood pressure (SBP ≥ 130 mmHg and/or DBP ≥ 85 mmHg) or use of antihypertensive drugs; (2) impaired fasting glucose (IFG): FBG ≥ 5.6 mmol/L or use of medications for diabetes; (3) TG ≥ 1.7 mmol/L; (4) HDL-C <1.03 mmol/L in men or <1.30 mmol/L in women. Metabolically unhealthy was defined as meeting two or more of the cardiometabolic risk factors (17).
Combining the BMI and metabolic phenotypes, participants were divided into four categories: metabolically healthy and normal-weight (MHNW), metabolically unhealthy and normal-weight (MUNW), and metabolically healthy over-weight/obesity (MHO), and metabolically unhealthy overweight/obesity (MUO).
The definition and classification of other covariates including education, income, smoking, drinking, and physical activity were described in our previous publications (18).
Statistical analysis
All analyses were performed using SAS statistical software (Version 9.4; SAS Institute Inc., Cary, NC, USA). A two-tailed P-value of < 0.05 was considered statistically significant for all analyses.
Descriptive statistics were performed stratified by the four metabolic phenotypes. Summary results were presented as mean ± standard deviation (SD) for continuous variables and number (percentage, %) for categorical variables. Differences between phenotypic categories were tested using variance analysis or the Chi-square test. The standardized prevalence of MU phenotypes was calculated based on the sex and age distributions of the 2010 China census population.
Covariance analysis was used to compare the continuous metabolic components (BMI, BP, FBG, TG, and HDL-C) and body composition parameters (BFP, VFG, FMI, MMI, and M/F) to adjust for age, sex, and residence. Data were presented as least-square mean ± standard error (SE).
To examine the association between rural-to-urban migration, age, and BMI with metabolically unhealthy (MU) phenotypes, logistics regression models were used and the following modeling strategies were applied. Model 1 included rural-to-urban migration (Yi migrants vs. Yi farmers) as the variable of interest, model 2 and model 3 included BMI and age plus model 1 in sequence and model 4 adjusted for all covariates of concern (model 3 plus sex, education, income, smoking status, drinking status, occupational physical activity, and leisure-time exercise).
To examine the linear association between body composition parameters with MU phenotypes, restricted cubic spline (RCS) functions with three knots at the 5th, 50th, and 95th quantiles were fitted, in which BFP, VFG, FMI, MMI, and M/F were included as independent variables, and covariates of concern were included for adjustment. Due to the significant difference in body fat and muscle between men and women, all the analysis was performed stratified by sex. We then divided the parameters into three categories according to data distribution and integers, and use logistics regression models to assess the odds ratios (OR) and 95% confidence intervals (CI) of each parameter, with adjustment for covariates.
Finally, to evaluate whether body composition parameters perform better in predicting MU phenotypes than BMI, the receiver-operating characteristic curves (ROC) were used and the area under the curve (AUC) was calculated, and the Z-tests were used to compare the AUCs.
Results
Characteristics of the participants
The flowchart Supplementary Figure S1 illustrates the study sample selection. Table 1 lists the demographic and metabolic characteristics of the study participants by metabolic phenotypes. A total of 3,053 Yi people aged 20–80 years were enrolled in this study, among whom 1,884 were Yi farmers and 1,169 were rural-to-urban migrants. Of all the participants, 497 (26.31%) out of the 1,889 normal weight and 607 (52.15%) out of the 1,164 overweight/obesity were metabolically unhealthy. The age, occupational physical activity, and leisure-time exercise were significantly different between metabolically healthy and unhealthy participants both in normal weight and overweight/obesity. With the covariance analysis adjusted for age, sex, and residence, all the metabolic factors were found to be significantly different in metabolically healthy and unhealthy participants.
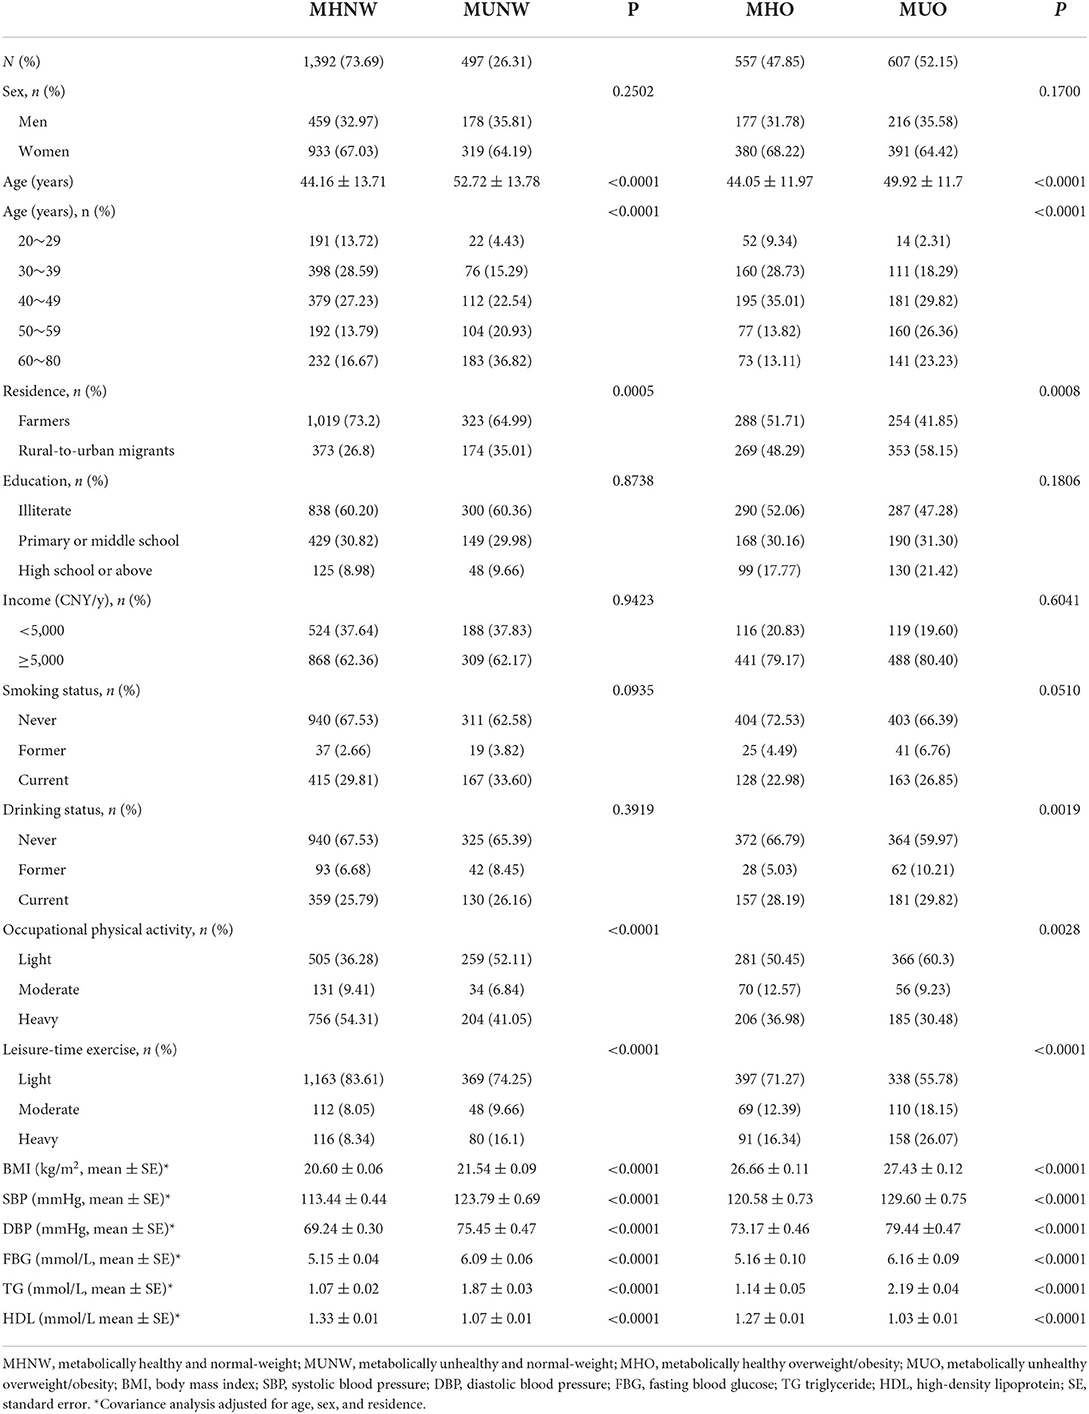
Table 1. Demographic and metabolic characteristics in participants from the Yi Migrant Study.
Prevalence of metabolically unhealthy phenotypes in Yi people
Stratified by BMI, the crude prevalence of MUNW and MUO in Yi farmers was significantly lower than in Yi migrants. After the adjustment for age and sex, the standardized prevalence of MUNW in Yi farmers and Yi migrants was still significantly different, while the standardized prevalence of MUO in the two groups was no different (see Supplementary Figures S2, S3).
The results of logistics regression models in Figure 1 show the association between rural-to-urban migration, BMI, and age with metabolically unhealthy phenotypes in Yi people. Without adjustment, Yi migrants were at nearly 1.5-fold higher odds of MU than Yi farmers. With the sequential adjustment for BMI and age, the ORs of rural-to-urban migration gradually decreased and were no more significant. With the full adjustment for demographic characteristics and health-related lifestyle factors, the OR of MU was 1.26 per 1 kg/m2 of BMI and 1.67 per 10 years of age in normal weight. In overweight/obesity, the ORs were 1.12 and 1.55 for BMI and age, respectively.
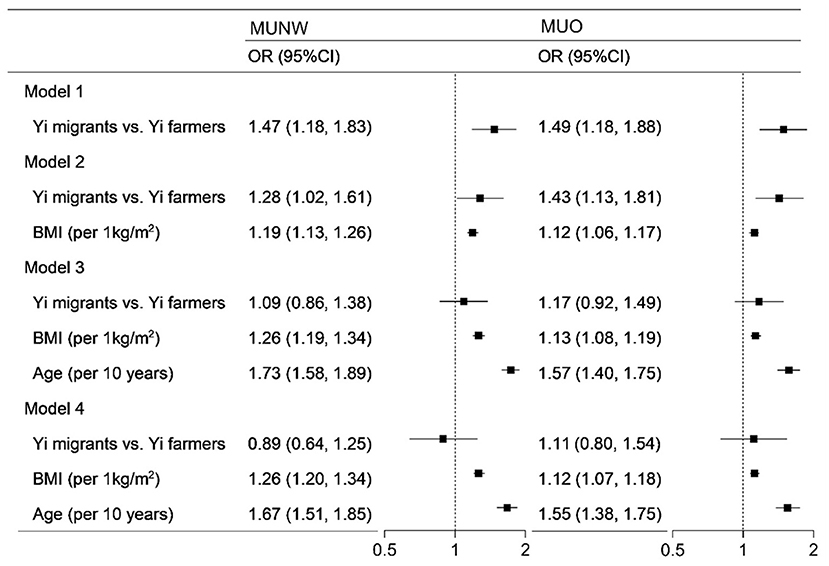
Figure 1. Logistics regression analysis of the association between rural-to-urban migration, age, and BMI with metabolically unhealthy phenotype. MUNW, metabolically unhealthy and normal-weight; MUO, metabolically unhealthy overweight/obesity; OR, odds ratio; BMI, body mass index. In the MUNW models, the MHNW was the control, and in the MUO models, the MHO was the control. Model 1 included rural-to-urban migration. Model 2 included model 1 plus BMI. Model 3 included model 2 plus BMI and age. Model 4 included model 3 plus sex, education, income, smoking status, drinking status, occupational physical activity, and leisure-time exercise.
Association between body composition with metabolically unhealthy phenotypes
Covariance analysis of body composition between metabolically healthy and unhealthy phenotypes was shown in Table 2. After adjustment for age and residence, the BFP, FMI, VFG, and MMI in metabolically healthy participants were significantly lower than in those metabolically unhealthy both in men and women. The MMI in overweight/obese men was an exception, the difference between the phenotypic groups was not significant. The M/F was found to be significantly higher in MHNW and MHO than in MUNW and MUO.
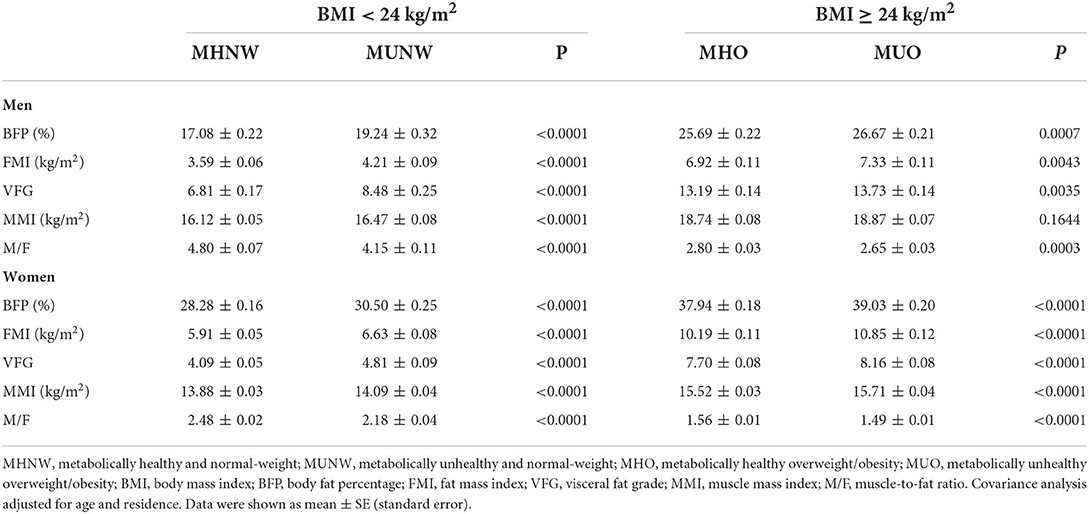
Table 2. Covariance analysis of body composition between metabolically healthy and unhealthy participants by sex and BMI.
The RCS analysis shows the linear relationship between body composition parameters and MU phenotypes by sex and BMI (see Figure 2 and Supplementary Figures S4–S7). With the adjustment for demographic characteristics and health-related lifestyle factors, BFP, FMI, VFG, and MMI show positive relationships with MHNW and MUO both in men and women. Figure 2 shows that with the increase in muscle/fat ratio, the ORs of MUNW and MUO descend.
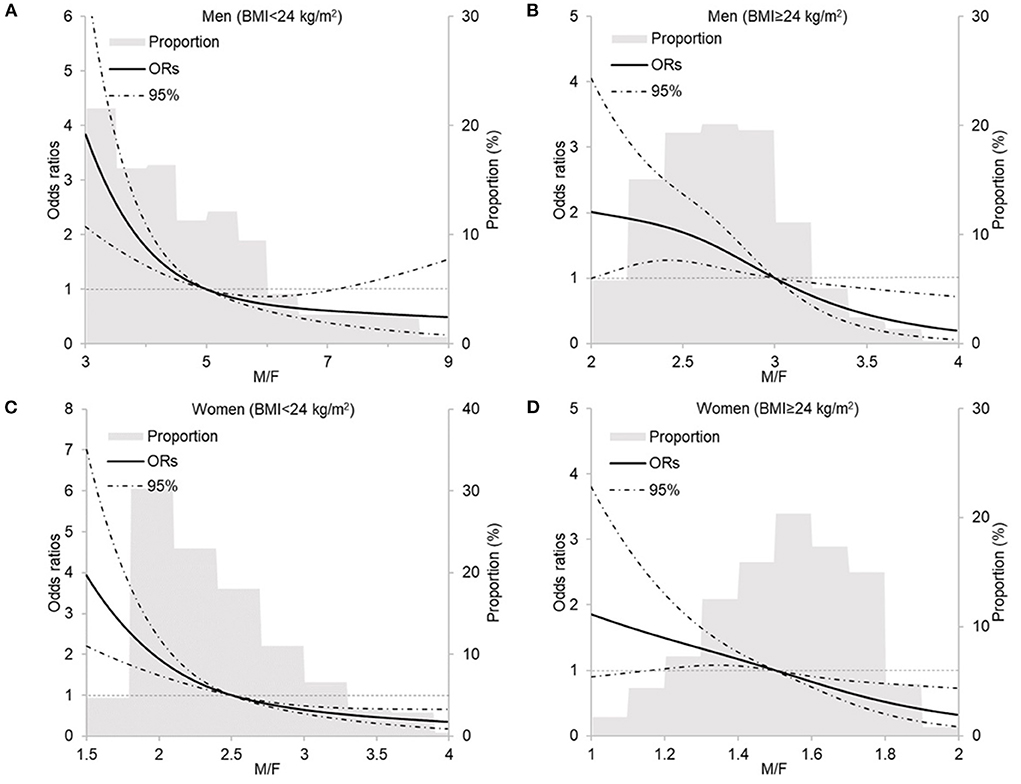
Figure 2. Restricted cubic spline analysis of the relationship between M/F with metabolically unhealthy phenotype by sex and BMI. (A) men, BMI < 24 kg/m2, P linear < 0.0001; (B) men, BMI ≥ 24 kg/m2, P linear = 0.7122; (C) women, BMI <24 kg/m2, P linear < 0.0001; (D) women, BMI ≥ 24 kg/m2, P linear = 0.2234. M/F, muscle-to-fat ratio; BMI, body mass index. Models included age, residence, education, income, smoking status, drinking status, occupational physical activity, and leisure-time exercise.
The continuous body fat and muscle parameters were divided into three categories according to tertiles and their association with MU phenotypes was assessed using logistic regression models by sex (see Figure 3). Each of the parameters was evaluated in a multivariable model separately, with the adjustment for demographic characteristics and health-related lifestyle factors. In men participants, the higher BFP and FMI categories were positively associated with MUNW and MUO. VFG and MMI were associated with higher odds of MUNW but not MUO. The higher M/F categories were associated with decreased odds of both MUNW and MUO. In women, all these parameters were significantly associated with MU phenotypes. The association between BFP, FMI, VFG, and MMI was positive while the association of M/F was negative. As the results show the consistent association between body fat and muscle with MU across the BMI categories, we then evaluated the association in the whole population. Supplementary Table S1 shows the strong association between BFP, FMI, VFG, MMI, and M/F with MU phenotype both in men and women.
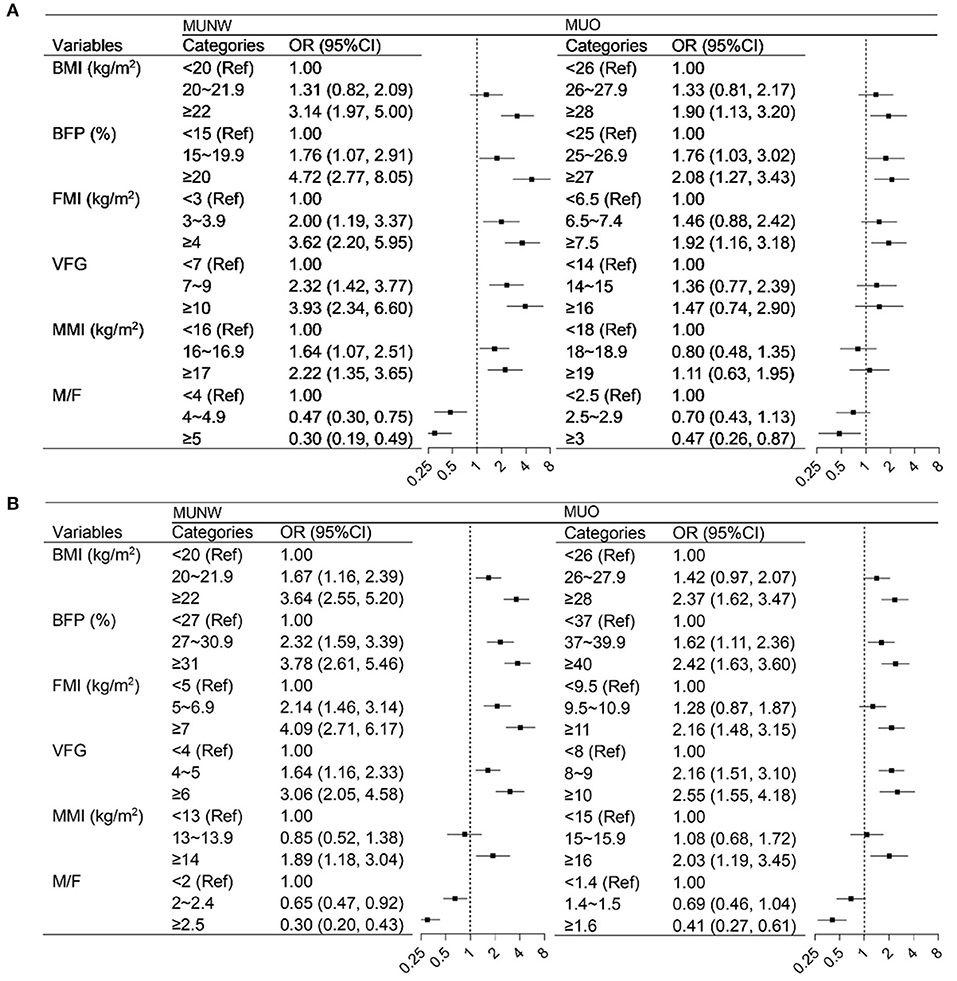
Figure 3. Logistics regression analysis of the association between body composition with metabolically unhealthy phenotype by sex and BMI. (A) men, (B) women. BMI, body mass index; BFP, body fat percentage; FMI, fat mass index; VFG, visceral fat grade; MMI, muscle mass index; M/F, muscle-to-fat ratio. In the MUNW models, the MHNW was the control, and in the MUO models, the MHO was the control. Models were adjusted for age, residence, education, income, smoking status, drinking status, occupational physical activity, and leisure-time exercise.
The ROCs of the body fat and muscle for predicting MU phenotypes by sex and BMI are shown in Figure 4. These parameters did not show a favorable predicting value of MUNW and MUO in men and women (~0.6–0.7). But they have better performance in prediction than BMI except for MMI (P < 0.05 for all comparisons). A better performance was found in normal weight than that in overweight/obesity.
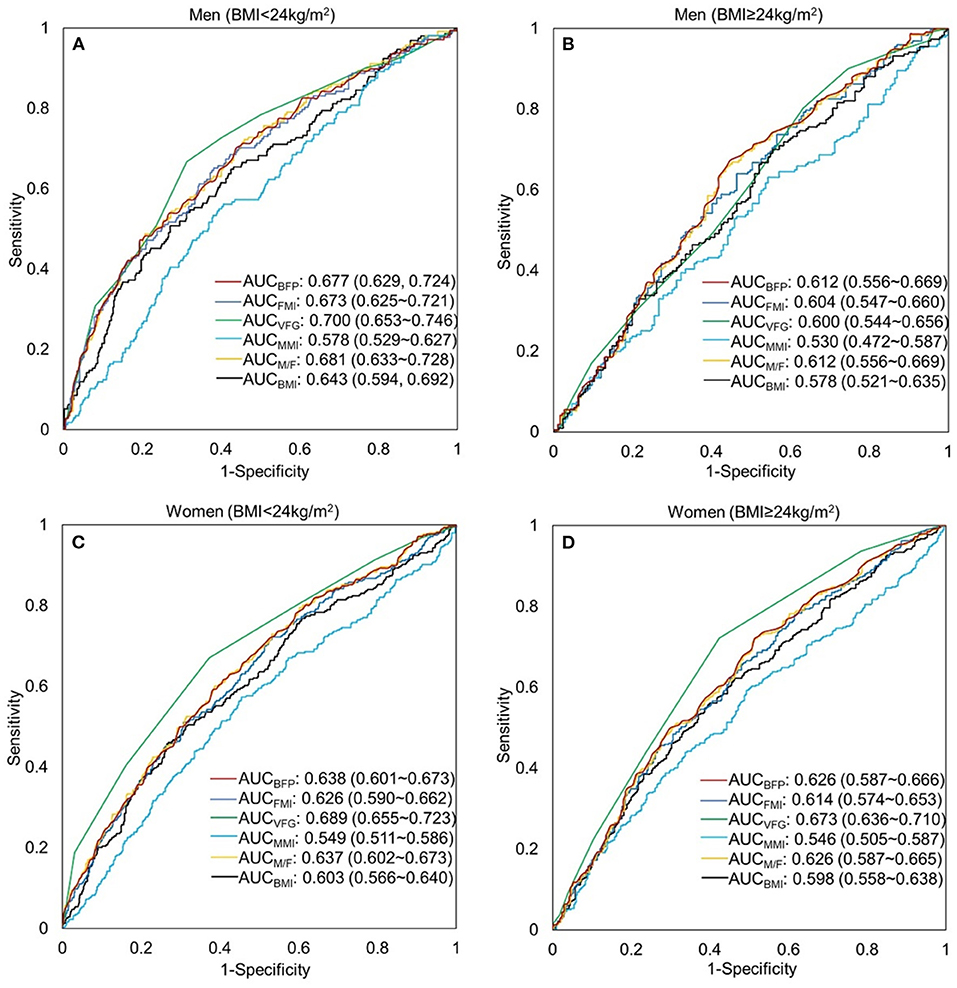
Figure 4. Receiver-operating characteristic (ROC) curve of the body composition indicators to predict metabolically unhealthy phenotype by sex and BMI. (A) men, BMI < 24 kg/m2; (B) men, BMI ≥ 24 kg/m2; (C) women, BMI <24 kg/m2; (D) women, BMI≥24 kg/m2. BFP, body fat percentage (%); FMI, fat mass index (kg/m2); VFG, visceral fat grade; MMI, muscle mass index (kg/m2); M/F, muscle-to-fat ratio; BMI, body mass index (kg/m2).
Discussion
In this cross-section study, we demonstrated the prevalence of metabolically unhealthy phenotypes and evaluated the association of absolute mass (BFP, FMI, MMI), distribution (VFG), and relative ratio (M/F) of body fat and muscle with the MU phenotypes in normal weight and overweight/obesity in Yi people. Our results verified the consistent effects of body fat and muscle mass on metabolic health across the normal-weight and overweight/obesity categories, and also illustrated the better performance of body composition indicators than BMI in predicting MU phenotypes.
The idea and the clinical implication of MHO have drawn much discussion in the past few years (19). The research on MHO is important because the existence of a metabolic healthy phenotype among obesity might provide an effective way for obesity management and treatment. Due to the lack of standard criteria to define metabolically healthy obesity, the prevalence of MHO can be greatly varied (20, 21). In this study, we assessed that approximately half of the overweight/obese adults in Yi people were metabolically healthy. We also found that although normal-weight, 1/4 to 1/3 of participants had unhealthy metabolic phenotypes. The proportions differed by residence and increased by age and BMI. Even though this study and our previous studies showed that rural-to-urban migrants were at higher risk of metabolic disorders (22–24), the variance could be partly attributed to demographic and increased body weight. The results showed that the disparities between Yi farmers and rural-to-urban migrants were no more significant after adjusting for age and BMI, which indicated the essential role of age and body weight increase on metabolic unhealthy phenotypes.
Along with genetic and lifestyle factors (25, 26), BMI and total adiposity are positively correlated with cardiometabolic disease risk at the population level (27). BMI is a widely used parameter for evaluating obesity, while BMI is unable to distinguish the relative mass of body fat and lean mass, nor estimate the body fat distribution. In this study, using the bioelectrical impedance analysis method, we assessed the mass (BFP and FMI) and distribution (VFG) of body fat. The results indicated that no matter the BMI categories and sex, both mass and distribution of body fat showed a positive relationship with metabolically unhealthy phenotypes. A recent study in China showed coincident results of the relationships (28). Lv et al. (28) measured the body composition indices by quantitative computed tomography and found that total adipose tissue (TAT), visceral adipose tissue (VAT), and VAT/TAT were positively associated with a higher risk of MU phenotypes across BMI categories. In our study, we did not assess the subcutaneous fat, which showed a significant difference between metabolically healthy and unhealthy participants (28, 29). Another parameter of fat distribution in this study, VFG, showed a strong association with metabolic health and showed better predicting performance than the other indicators. The effect of visceral fat has also been proved in previous studies (30, 31).
Muscle mass was regarded as a protective factor against MU phenotypes in previous studies (32, 33). However, in this study, the highest category of muscle mass index was at increased risk of being metabolically unhealthy. It might be due to the concomitance of muscle and fat mass at the individual level. Kim et al. (32) compared the muscle mass and quality between metabolically healthy and unhealthy phenotypes and concluded that not only muscle mass but also muscle quality are associated with metabolic health. In the present study, we calculated the muscle-to-fat ratio to assess the effect of the relative ratio of muscle and fat on metabolic health. The results showed that increased M/F values were beneficial to a healthier metabolic phenotype. The fat-to-muscle ratio has been introduced as a new anthropometric indicator by several researchers (34–36). However, we regard the muscle-to-fat ratio as a more significant indicator because it provided the approach to reducing metabolic disorder risks by elevating the muscle mass and simultaneously reducing the fat mass. A previous study also suggested that the muscle-to-fat ratio was a better indicator than the fat-to-muscle ratio in quantifying insulin resistance (37).
Our study has a few importance for clinical and public health implications. The study verified the heterogeneity of obesity, and also reminded the implicit cardiometabolic disease risk in the normal-weight. We emphasized the importance of body weight management by monitoring BMI at the population level. Despite the weakness of distinguishing body composition, BMI is an intuitive and economical approach for indicating the exceeded body adipose tissues. The study confirmed the linear positive association between body fat (BFP, FMI, and VFG) with MU phenotypes, and also proved a better performance in predicting MU phenotypes than BMI. The results called for the utilization of body composition measurement for a more precise obesity evaluation and prevention when the health resources were accessible. Additionally, since 1/4 to 1/3 of the normal-weight participants were metabolically unhealthy, it is essential to maintain a healthy lifestyle and monitor blood pressure, glucose, and lipid metabolism at an appropriate interval in this cardiometabolic low-risk population.
One of the limitations of our study lies in the cross-sectional nature of the study design. The statistical association can be found, but, no causal inference can be reliably established. Secondly, the measurements of the body fat and muscle were dependent on the bioelectrical impedance analysis method, rather than the more accurate dual-energy X-rays absorptiometry (DXA). While the BIA has the advantage of safety, cost, and portability over DXA in the large-scale population-based field survey. And fortunately, BIA shows satisfying agreement with DXA in the real-world setting (38). We also acknowledge that AUCs around 0.6 in our study were not good enough to distinguish MUNW and MHO. More precise indicators were pending to be discovered in the future. Finally, we did not collect data on diet, which is a major contributor to metabolic phenotypes. The lack of dietary data limits the detection of risk factors and the essential adjustment in the multivariable models. Further prospective studies are needed to collect comprehensive data and verify the relationship between body fat and muscle with metabolic trajectories.
Conclusions
In this cross-sectional study, using the population-based data, we observed that the metabolically unhealthy phenotypes were prevalent both in normal-weight and overweight/obesity in Yi people. The results showed the positive association of BFP, FMI, VFG, and the negative association of M/F with MU phenotypes across the BMI categories in Yi people. Measurement of body fat and muscle could provide a more precise approach for the management and prevention of obesity-related cardiometabolic risks.
Data availability statement
The original contributions presented in the study are included in the article/Supplementary material, further inquiries can be directed to the corresponding author.
Ethics statement
The studies involving human participants were reviewed and approved by bio Ethical Committee of Institute of Basic Medical Sciences, Chinese Academy of Medical Sciences. The patients/participants provided their written informed consent to participate in this study.
Author contributions
GS designed the study and supervised data collection. YW analyzed the data, interpreted results, and drafted the manuscript. LP, SW, WY, FY, ZL, and ZY participated in data collection. All authors have approved the submitted versions.
Funding
This work was supported by grants from National Natural Science Foundation of China (No. 81273158).
Conflict of interest
The authors declare that the research was conducted in the absence of any commercial or financial relationships that could be construed as a potential conflict of interest.
Publisher's note
All claims expressed in this article are solely those of the authors and do not necessarily represent those of their affiliated organizations, or those of the publisher, the editors and the reviewers. Any product that may be evaluated in this article, or claim that may be made by its manufacturer, is not guaranteed or endorsed by the publisher.
Supplementary material
The Supplementary Material for this article can be found online at: https://www.frontiersin.org/articles/10.3389/fpubh.2022.1020457/full#supplementary-material
References
1. Pan XF, Wang L, Pan A. Epidemiology and determinants of obesity in China. Lancet Diabetes Endocrinol. (2021) 9:373–92. doi: 10.1016/S2213-8587(21)00045-0
2. Bovet P, Chiolero A, Gedeon J. Health effects of overweight and obesity in 195 countries. N Engl J Med. (2017) 377:1495–6. doi: 10.1056/NEJMc1710026
3. Stefan N, Häring HU, Hu FB, Schulze MB. Metabolically healthy obesity: epidemiology, mechanisms, and clinical implications. Lancet Diabetes Endocrinol. (2013) 1:152–62. doi: 10.1016/S2213-8587(13)70062-7
4. Blüher M. Metabolically healthy obesity. Endocr Rev. (2020) 41:405–20. doi: 10.1210/endrev/bnaa004
5. Xia L, Dong F, Gong H, Xu G, Wang K, Liu F, et al. Association between indices of body composition and abnormal metabolic phenotype in normal-weight Chinese adults. Int J Environ Res Public Health. (2017) 14:391. doi: 10.3390/ijerph14040391
6. Song Z, Gao M, Lv J, Yu C, Guo Y, Bian Z, et al. Metabolically healthy obesity, transition to unhealthy phenotypes, and type 2 diabetes in 05 million Chinese adults: the China Kadoorie Biobank. Eur J Endocrinol. (2022) 186:233–44. doi: 10.1530/EJE-21-0743
7. Mongraw-Chaffin M, Foster MC, Anderson CAM, Burke GL, Haq N, Kalyani RR, et al. Metabolically healthy obesity, transition to metabolic syndrome, and cardiovascular risk. J Am Coll Cardiol. (2018) 71:1857–65. doi: 10.1016/j.jacc.2018.02.055
8. Paczkowska-Abdulsalam M, Kretowski A. Obesity, metabolic health and omics: current status and future directions. World J Diabetes. (2021) 12:420–36. doi: 10.4239/wjd.v12.i4.420
9. Matta J, Nasreddine L, Jomaa L, Hwalla N, Mehio Sibai A, Czernichow S, et al. Metabolically healthy overweight and obesity is associated with higher adherence to a traditional dietary pattern: a cross-sectional study among adults in Lebanon. Nutrients. (2016) 8:432. doi: 10.3390/nu8070432
10. Martinez-Gomez D, Ortega FB, Hamer M, Lopez-Garcia E, Struijk E, Sadarangani KP, et al. Physical activity and risk of metabolic phenotypes of obesity: a prospective Taiwanese cohort study in more than 200,000 adults. Mayo Clin Proc. (2019) 94:2209–19. doi: 10.1016/j.mayocp.2019.04.042
11. Cadenas-Sanchez C, Ruiz JR, Labayen I, Huybrechts I, Manios Y, González-Gross M, et al. Prevalence of metabolically healthy but overweight/obese phenotype and its association with sedentary time, physical activity, and fitness. J Adolesc Health. (2017) 61:107–14. doi: 10.1016/j.jadohealth.2017.01.018
12. Gutiérrez-Repiso C, Linares-Pineda TM, Gonzalez-Jimenez A, Aguilar-Lineros F, Valdés S, Soriguer F, et al. Epigenetic biomarkers of transition from metabolically healthy obesity to metabolically unhealthy obesity phenotype: a prospective study. Int J Mol Sci. (2021) 22:10417. doi: 10.3390/ijms221910417
13. Goossens GH. The metabolic phenotype in obesity: fat mass, body fat distribution, and adipose tissue function. Obes Facts. (2017) 10:207–15. doi: 10.1159/000471488
14. Wang Y, Pan L, Wan S, Yi H, Yang F, He H, et al. Increasing prevalence of overweight and obesity in Yi farmers and migrants from 2007 to 2015 in China: the Yi migrant study. BMC Public Health. (2018) 18:659. doi: 10.1186/s12889-018-5577-4
15. He H, Pan L, Pa L, Cui Z, Ren X, Wang D, et al. Data resource profile: the China National Health Survey (CNHS). Int J Epidemiol. (2018) 47:1734–1735f. doi: 10.1093/ije/dyy151
16. Zhou BF. Predictive values of body mass index and waist circumference for risk factors of certain related diseases in Chinese adults–study on optimal cut-off points of body mass index and waist circumference in Chinese adults. Biomed Environ Sci. (2002) 15:83–96. doi: 10.1046/j.1440-6047.11.s8.9.x
17. van Vliet-Ostaptchouk JV, Nuotio ML, Slagter SN, Doiron D, Fischer K, Foco L, et al. The prevalence of metabolic syndrome and metabolically healthy obesity in Europe: a collaborative analysis of ten large cohort studies. BMC Endocr Disord. (2014) 14:9. doi: 10.1186/1472-6823-14-9
18. Wang Y, Pan L, Wan SP, Yi HW, Yang F, He HJ, et al. Association between age at arrival, duration of migration, and overweight/obesity in Chinese rural-to-urban migrants: the Yi migrant study. Chin Med J. (2020) 134:60–7. doi: 10.1097/CM9.0000000000000973
19. Boonchaya-anant P, Apovian CM. Metabolically healthy obesity–does it exist? Curr Atheroscler Rep. (2014) 16:441. doi: 10.1007/s11883-014-0441-1
20. Liu C, Wang C, Guan S, Liu H, Wu X, Zhang Z, et al. The prevalence of metabolically healthy and unhealthy obesity according to different criteria. Obes Facts. (2019) 12:78–90. doi: 10.1159/000495852
21. Hinnouho GM, Czernichow S, Dugravot A, Batty GD, Kivimaki M, Singh-Manoux A. Metabolically healthy obesity and risk of mortality: does the definition of metabolic health matter? Diabetes Care. (2013) 36:2294–300. doi: 10.2337/dc12-1654
22. Shan GL, Wei DY, Wang CX, Zhang JH, Wang B, Ma MJ, et al. Body mass index and hypertension hemodynamic subtypes in Yi farmers and migrants. Biomed Environ Sci. (2012) 25:53–60. doi: 10.3967/0895-3988.2012.01.008
23. Wang B, Wei D, Wang C, Zhang J, Pan L, Ma M, et al. Prevalence of dyslipidemia and associated factors in the Yi farmers and migrants of Southwestern China. Atherosclerosis. (2012) 223:512–8. doi: 10.1016/j.atherosclerosis.2012.06.009
24. Zhang J, Wan S, Dong F, Pan L, Yihuo W, Gong H, et al. Secular trends of the impact of overweight and obesity on hypertension in Yi people: Yi Migrant Study, 1996-2015. Int J Hypertens. (2020) 2020:5368357. doi: 10.1155/2020/5368357
25. Li L, Yin J, Cheng H, Wang Y, Gao S, Li M, et al. Identification of genetic and environmental factors predicting metabolically healthy obesity in children: data from the BCAMS study. J Clin Endocrinol Metab. (2016) 101:1816–25. doi: 10.1210/jc.2015-3760
26. Barrea L, Muscogiuri G, Pugliese G, de Alteriis G, Colao A, Savastano S. Metabolically Healthy Obesity (MHO) vs. Metabolically Unhealthy Obesity (MUO) Phenotypes in PCOS: Association with Endocrine-Metabolic Profile, Adherence to the Mediterranean Diet, and Body Composition. Nutrients. (2021) 13:3925. doi: 10.3390/nu13113925
27. Iacobini C, Pugliese G, Blasetti Fantauzzi C, Federici M, Menini S. Metabolically healthy versus metabolically unhealthy obesity. Metabolism. (2019) 92:51–60. doi: 10.1016/j.metabol.2018.11.009
28. Lv F, Cai X, Li Y, Fu Z, Zhang X, Zhou X, et al. Association between indices of body composition and metabolically unhealthy phenotype in China: a cross-sectional study. Front Endocrinol. (2022) 13:891327. doi: 10.3389/fendo.2022.891327
29. Stefan N, Schick F, Häring HU. Causes, characteristics, and consequences of metabolically unhealthy normal weight in humans. Cell Metab. (2017) 26:292–300. doi: 10.1016/j.cmet.2017.07.008
30. Jiang K, Luan H, Pu X, Wang M, Yin J, Gong R. Association between visceral adiposity index and insulin resistance: a cross-sectional study based on US adults. Front Endocrinol. (2022) 13:921067. doi: 10.3389/fendo.2022.921067
31. Ciresi A, Amato MC, Pizzolanti G, Giordano Galluzzo C. Visceral adiposity index is associated with insulin sensitivity and adipocytokine levels in newly diagnosed acromegalic patients. J Clin Endocrinol Metab. (2012) 97:2907–15. doi: 10.1210/jc.2012-1518
32. Kim HK, Lee MJ, Kim EH, Bae SJ, Kim KW, Kim CH. Comparison of muscle mass and quality between metabolically healthy and unhealthy phenotypes. Obesity. (2021) 29:1375–86. doi: 10.1002/oby.23190
33. Kim G, Lee SE, Lee YB, Jun JE, Ahn J, Bae JC, et al. Relationship between relative skeletal muscle mass and nonalcoholic fatty liver disease: a 7-year longitudinal study. Hepatology. (2018) 68:1755–68. doi: 10.1002/hep.30049
34. Liu D, Zhong J, Ruan Y, Zhang Z, Sun J, Chen H. The association between fat-to-muscle ratio and metabolic disorders in type 2 diabetes. Diabetol Metab Syndr. (2021) 13:129. doi: 10.1186/s13098-021-00748-y
35. Xu K, Zhu HJ, Chen S, Chen L, Wang X, Zhang LY, et al. Fat-to-muscle ratio: a new anthropometric indicator for predicting metabolic syndrome in the han and bouyei populations from Guizhou Province, China. Biomed Environ Sci. (2018) 31:261–71. doi: 10.3967/bes2018.034
36. Ramírez-Vélez R, Carrillo HA, Correa-Bautista JE, Schmidt-RioValle J, González-Jiménez E, Correa-Rodríguez M, et al. Fat-to-muscle ratio: a new anthropometric indicator as a screening tool for metabolic syndrome in young colombian people. Nutrients. (2018) 10:1027. doi: 10.3390/nu10081027
37. Kurinami N, Sugiyama S, Yoshida A, Hieshima K, Miyamoto F, Kajiwara K, et al. Body muscle-to-fat ratio, rather than fat-to-muscle ratio, significantly correlates with measured insulin resistance in patients with type 2 diabetes mellitus. J Clin Med Res. (2021) 13:387–91. doi: 10.14740/jocmr4401
38. Lahav Y, Goldstein N, Gepner Y. Comparison of body composition assessment across body mass index categories by two multifrequency bioelectrical impedance analysis devices and dual-energy X-ray absorptiometry in clinical settings. Eur J Clin Nutr. (2021) 75:1275–82. doi: 10.1038/s41430-020-00839-5
Keywords: body composition, metabolically healthy overweight/obesity, Yi people, bioelectrical impedance analysis, muscle-to-fat ratio
Citation: Wang Y, Pan L, Wan S, Yihuo W, Yang F, Li Z, Yong Z and Shan G (2022) Body fat and muscle were associated with metabolically unhealthy phenotypes in normal weight and overweight/obesity in Yi people: A cross-sectional study in Southwest China. Front. Public Health 10:1020457. doi: 10.3389/fpubh.2022.1020457
Received: 16 August 2022; Accepted: 15 September 2022;
Published: 06 October 2022.
Edited by:
Hao Peng, Soochow University, ChinaReviewed by:
Pei Xiao, Capital Medical University, ChinaXiaojie Yuan, Fourth Military Medical University, China
Copyright © 2022 Wang, Pan, Wan, Yihuo, Yang, Li, Yong and Shan. This is an open-access article distributed under the terms of the Creative Commons Attribution License (CC BY). The use, distribution or reproduction in other forums is permitted, provided the original author(s) and the copyright owner(s) are credited and that the original publication in this journal is cited, in accordance with accepted academic practice. No use, distribution or reproduction is permitted which does not comply with these terms.
*Correspondence: Guangliang Shan, Z3VhbmdsaWFuZ19zaGFuQDE2My5jb20=