 Xingyuan Zhou1
- 1Department of Pediatrics, The Affiliated Hospital of Medical School of Ningbo University, Ningbo, Zhejiang, China
- 2Department of Obstetrics, Tangshan Maternal and Child Health Care Hospital of Hebei Province, Tangshan, Hebei, China
- 3Department of Preventative Medicine, Medicine School of Ningbo University, Ningbo, Zhejiang, China
Introduction: Exposure to ambient air pollutants is associated with an increased incidence of respiratory diseases such as pneumonia and asthma, especially in younger children. We investigated the relationship between rates of hospitalization of children aged under 5 years for pneumonia and asthma and the concentration of air pollutants in Ningbo between January 1, 2015 and August 29, 2017.
Methods: Data were obtained from the Ningbo Air Quality Data Real-time Publishing System and the big data platform of the Ningbo Health Information Center. A generalized additive model was established via logarithmic link function and utilized to evaluate the effect of pollutant concentration on lag dimension and perform sensitivity analysis.
Results: A total of 10,301 cases of pneumonia and 115 cases of asthma were identified over the course of this study. Results revealed that PM2.5, PM10, SO2 and NO2 were significantly associated with hospitalization for pneumonia and asthma in children under 5 years of age. For every 10-unit increase in lag03 air pollutant concentration, hospitalization for pneumonia and asthma due to PM2.5, PM10, SO2 and NO2 increased by 2.22% (95%CI: 0.64%, 3.82%), 1.94% (95%CI: 0.85%, 3.04%), 11.21% (95%CI: 4.70%, 18.10%) and 5.42% (95%CI: 3.07%, 7.82%), respectively.
Discussion: Adverse effects of air pollutants were found to be more severe in children aged 1 to 5 years and adverse effects due to PM2.5, PM10 and SO2 were found to be more severe in girls. Our findings underscore the need for implementation of effective public health measures to urgently improve air quality and reduce pediatric hospitalizations due to respiratory illness.
1. Introduction
Pneumonia, the single largest infectious cause of death in children worldwide, accounts for 14% of all deaths of children under 5 years of age and killed 740,180 children in 2019 alone (1, 2). In China, the annual incidence of clinically severe pneumonia among this pediatric population decreased by 69% from 1990 to 2015 (3). However, despite this generally optimistic downward trend, mortality of pediatric pneumonia patents in China remains high. In 2015 alone, 22,242 children aged under 5 years died of pneumonia (4). Asthma incidence was also reported to have decreased worldwide (5). Despite declining asthma mortality, the global health burden of this condition remains significant. In 2015, ~334 million people worldwide were reported to be living with asthma, among them many school-age children (6, 7). The combined burden of pediatric pneumonia and asthma warrants scrutiny to achieve the 2030 Sustainable Development Goals (7, 8).
Over the past 20 years, numerous studies have shown that exposure to air pollution correlates with increased rates of respiratory and cardiovascular diseases, as well as mortality (9–11). Ambient particulate matter (PM) in air pollutants not only cause lung infections but also enter the circulation via the blood gas barrier, thereby inflicting widespread damage (12–16). Corrosive gaseous pollutants such as SO2 damage the skin, mucous membranes, and respiratory system (17). Exposure to air pollutants triggers and/or exacerbates lung disease in people of all ages (18, 19). Among them, children are particularly vulnerable to the adverse effects of air pollution and are more likely than adults to suffer from respiratory diseases related to air pollutants (20, 21). The reasons may be that children's ventilation rate is higher than that of adults, children have biological characteristics such as immature pulmonary and immune systems, and early exposure to air pollution may affect the development of children's respiratory and immune systems (22–24). As such, adverse health effects due to air pollutants among children aged under 5 years is particularly concerning. Although a number of studies evaluating effects of air pollution on pediatric pulmonary health have been performed worldwide (25–29), findings remain inconclusive. Importantly, levels of air pollution as well as socioeconomic development vary greatly from region to region. To date, few studies have evaluated associations between air pollution and pneumonia and asthma in children under 5 years old in China. Indeed, most similar research conducted in China has evaluated associations between only one type of air pollutant and pathology, with most studies having analyzed regions with remarkably high air pollution levels. As such, associations among several major air pollutants with pediatric respiratory pathology in regions with lower levels of air pollution warrant study.
Ningbo is a coastal city in China geographically located in the region of the Ningbo Plain and is characterized by relatively warm and humid year-round weather as well as a subtropical monsoon climate. Ningbo is also characterized by well-developed secondary industry and a lack of central heating. Between 2015 and 2017, excellent and good air quality rates were reported to have been 82.7, 84.7, and 85.2%, respectively. Over this same time period, the Chinese national comprehensive index of air quality ranked Ningbo 24th, 19th, and 17th among key cities and 6th, 5th, and 4th among the 25 most important Yangtze River Delta cities. Although the Ningbo ambient air quality remained stable and tended to be good, general pollution trends remained concerning as levels of particulate matter (PM) <2.5 micrometers in diameter (PM2.5) exceeded national secondary safety standards and levels of fine PM were high (30–32). Haze was also found to have increased levels of air pollution in colder months. In this study, Ningbo was selected to evaluate associations between concentrations of six ambient pollutants (PM2.5, PM10, O3, CO, SO2, and NO2) and daily hospitalization rates for pneumonia and asthma among children aged under 5 years. Subgroup analyses were performed to evaluate associations between age, sex, season, and pathology and hospitalization rates. Hospitalization data were obtained from the big data platform of the Ningbo Health Information Center and air pollutant data were obtained from the Ningbo Air Quality Monitoring System. Our conclusions provide essential information for the study of environmental triggers of pneumonia and asthma in children in children under 5 years old and further highlight the urgency of developing effective public health interventions and help provide healthier communities.
2. Methods
2.1. Study setting
The southeast coastal city of Ningbo is situated in the southern wing of the Yangtze River Delta and possesses total land and urban areas of 9,816 and 9,816 km2, respectively (28°51′-30°33′N, 120°55′-122°16′E). The total sea area of Ningbo is 8,355.8 km2 and its total coastline length is 1,594.4 km. The Ningbo area is characterized by a subtropical monsoon climate, seasons that are clearly distinguishable, adequate sunlight, abundant rainfall and a long frost-free winter period. Chemical, textile and garment, and machinery industries constitute the majority of the well-developed secondary industry in the Ningbo area. As past studies only investigated the influences of sea transport and the chemical industry on Ningbo air pollution, we selected this city for our study.
According to an official health statistics report, in 2017 Ningbo possessed a total of 4,157 medical institutions, a total of 37,315 beds, and a total population of 8.055 million people (33, 34). As such, the number of beds per thousand persons in 2017 was 4.66. Four Class 3 Grade A general and two Class 3 Grade A specialized hospitals operated in Ningbo in 2017, exceeding standards set forth by the Outline of the National Health Service System (2015–2020). Our data were obtained from medical institutions of all levels in an effort to comprehensively evaluate hospitalization of children under 5 years of age for pneumonia or asthma.
2.2. Study population
Legal access to the Ningbo Health Information Center big data platform, which contained data concerning patients hospitalized for pneumonia and asthma, was provided by the Health Commission of Ningbo. Hospitalizations between January 2015 and August 2017 with principal diagnoses of pneumonia (ICD-10 codes J12–J18) and asthma (ICD-10 codes J45–J46) among children aged under 5 years were included in this study. Patients with incomplete data regarding hospital admission date or multiple versions of medical records dating from the same day were excluded from analyses. Inpatient data obtained from the big data platform included patient date of birth, sex, place of residence, disease diagnosis code, admission details and discharge date.
2.3. Ambient air pollution and meteorological data
Levels of ambient air pollutants recorded in urban Ningbo were obtained from the Ningbo Air Quality Data Real-time Publishing System (http://air.nbemc.net/StationAQ/Index), operated by the Ningbo Environmental Monitoring Center under direction of the Ningbo Environmental Protection Bureau and a secondary station of the National Environmental Monitoring Network. A total of 21 air quality monitoring stations throughout the metropolitan Ningbo area functioned in recording air pollution levels at the time of the study. Daily mean concentrations of PM2.5, PM10, O3, CO, SO2, and NO2 were averaged for each single station. For analysis of O3 levels, an algorithm for obtaining 8-hour moving average concentrations was used. Take 0–7 o 'clock, 1–8 o 'clock, ......, and the hourly average concentration from 17 to 24 o 'clock, respectively. The maximum value of these mean values is the mean concentration of ozone in 8 h as the daily average concentration of O3. For other pollutants, 24-hourly average levels were calculated. Daily average concentrations of PM2.5, PM10, SO2, NO2, and CO were calculated from the hourly concentration of a single station. Instruments at each station measure the hourly concentration of air pollutants at the station, and the 24-hour concentration value from 1 to 24 o 'clock is the arithmetic mean of the daily average concentration of air pollutants at the station. Because individual exposure levels could not be accurately assessed in this study, average levels of all pollutant measurement station data were considered as the individual exposure level as previously defined (35). Daily temperature and relative humidity data from January 1, 2015 to August 29, 2017 were obtained from the Ningbo Meteorological Bureau to control for meteorological factors (36).
2.4. Statistical analysis
Time series analysis is usually used to study acute health effects of air pollution; the generalized additive model (GAM) is the most widely used time series model (37). According to Hastie and Tibshirani's systematic interpretation of this model (38), GAM incorporates both parametric and non-parametric methods to identify relevant air pollutants and the presence of unknown confounding factors; known confounding factors (such as temperature and other non-linear relationships) are controlled for via data smoothing. Elimination of confounding factors facilitates accurate estimation of pollutant risk. Prior to model establishment, we conducted a descriptive analysis of relevant data. Spearman's correlation coefficient was used to analyze correlations between air pollutant concentrations and meteorological variables due to the non-normal distribution of data.
Because the number of daily hospitalized cases for pneumonia approximately followed a Poisson distribution, log-link function was used in model construction. Daily hospitalized pneumonia cases were considered to be a dependent variable; non-linear independent variables were time, temperature and relative humidity. As in previous studies (39–42), non-linear independent variables were modeled via natural cubic spline. Degrees of freedom (df) for each variable were selected based on partial autocorrelation function (PACF) and generalized cross-validation (GCV) values. Degrees of freedom for spline functions of non-linear independent variables were 10, 3 and 3 for time, temperature and relative humidity, respectively. Year [i.e., Year 1 (2015), Year 2 (2016), Year 3 (2017)], season (i.e., warm months, May–October; cold months, November–April) and day of week (DOW) were considered to be potential confounders in our model and treated as categorical variables. The basic form of our model was as follows:
E(Yt), the expected number of hospitalized cases on day t; α, intercept; β, the log-relative risk of disease related to a unit increase in pollutant concentration; Pol, concentrations of pollutants; ns( ), natural cubic spline function; T, temperature; RH, relative humidity.
In addition to day (lag0) pollutant concentrations, we evaluated effects of pollutant concentration on lag dimension, such as effects on single-day (lag1–lag7) and multi-day (moving average, lag01–lag07) lag. Relative risks (RR) for 10-unit increases in PM2.5, PM10, O3, CO, SO2, and NO2 concentrations were reported with 95% confidence intervals (95%CI). Subgroup analyses were further performed to assess consequences of air pollutant levels on age (<1 and 1–5 years), sex (boy or girl), disease (pneumonia and asthma) and season (November–April and May–October).
RR, excess risk (ER) and the 95%CI for hospitalizations were calculated per every 10 μg/m3 increase in PM2.5, PM10, SO2, NO2, and O3 concentrations, and per 100 μg/m3 increase in CO concentrations. Calculation of ER was performed as follows:
Sensitivity analyses were performed accordingly: (a) to determine each pollutant's possible role, we established two-pollutant models for all pollutants without interactions; (b) cases among patients younger than 1 month old were considered to not have been influenced by exposure to pollution; and (c) to test the stability of our model, alternative df values (9 and 10) for time were calculated utilizing the model itself.
All statistical analyses were conducted with R version 3.6.1 for Windows. A two-tailed p-value <0.05 was considered statistically significant.
3. Results
3.1. Descriptive statistics of daily hospital admissions for pneumonia, pollutants and meteorological variables
In total there were 10,301 hospital admissions for pneumonia and 115 hospital admissions for asthma among children aged under 5 years in Ningbo between January 1, 2015 and August 29, 2017 (Table 1). Due to fewer cases of asthma hospitalization during the study period, we accumulated the data on a monthly basis prior to statistical description. The mean number of daily pneumonia hospitalizations was 11 (range: 1–30) and the mean number of monthly asthma hospitalizations was 4 (range: 0–13). From the quantitative perspective, the number of infant (<1 year) cases (2,634) was less than that of children aged 1–5 years (7,782) and the number of cases during colder months (November–April; 5,939 cases) was greater than that during warmer months (May–October; 4,477 cases).

Table 1. Descriptive statistics of the hospitalization for pneumonia and asthma among children aged < 5 years, Ningbo City, 2015–2017.
Statistical summaries concerning ambient air pollutant concentrations and meteorological conditions encountered throughout the study period were detailed previously (43), and included temperature and relative humidity means of 18.2°C (range: −4.5–34.8°C) and 74.8% (range: 35.0–98.0%), as well as mean PM2.5, PM10, O3, SO2, NO2, and CO concentrations of 40.2, 63.5, 99.3, 13.0, 39.7 μg/m3, and 0.8 mg/m3, respectively. Additionally, correlations among ambient air pollutants and their relationships with meteorological conditions were consistent with findings reported by us previously (43), with PM2.5, PM10, SO2, NO2, and CO concentrations having positively correlated with those of other pollutants (apart from O3) and negatively correlated with temperature.
3.2. Associations between air pollutants and daily hospital admissions for pneumonia and asthma
Figure 1 shows the associations between hospital admissions (pneumonia and asthma hospitalizations) and a 10-μg/m3 increase (a 100-μg/m3 increase for CO) on lag0 (reflecting acute effects), lags1–7 (reflecting hysteresis) and lags01–07 (reflecting cumulative hysteresis) for corresponding pollutants (Details of excess risks are provided in Supplementary Table 1). At lag0, hospital admissions were positively associated with all pollutants and statistically significant associations were observed for PM2.5 (RR = 1.014, 95%CI: 1.003, 1.024), PM10 (RR = 1.011, 95%CI: 1.003, 1.018), SO2 (RR = 1.060, 95%CI: 1.016, 1.106) and NO2 (RR = 1.027, 95%CI: 1.011, 1.043) (Supplementary Table 2). Analysis of PM2.5, PM10, SO2, and NO2 revealed effects of irregular RR value fluctuations for lags1–7; for lags01–07, RR values trended up and stabilized at lag03. In summary, the adverse effects of SO2 were found to be greatest among all air pollutants, with findings confirmed by both daily and the cumulative lag values.
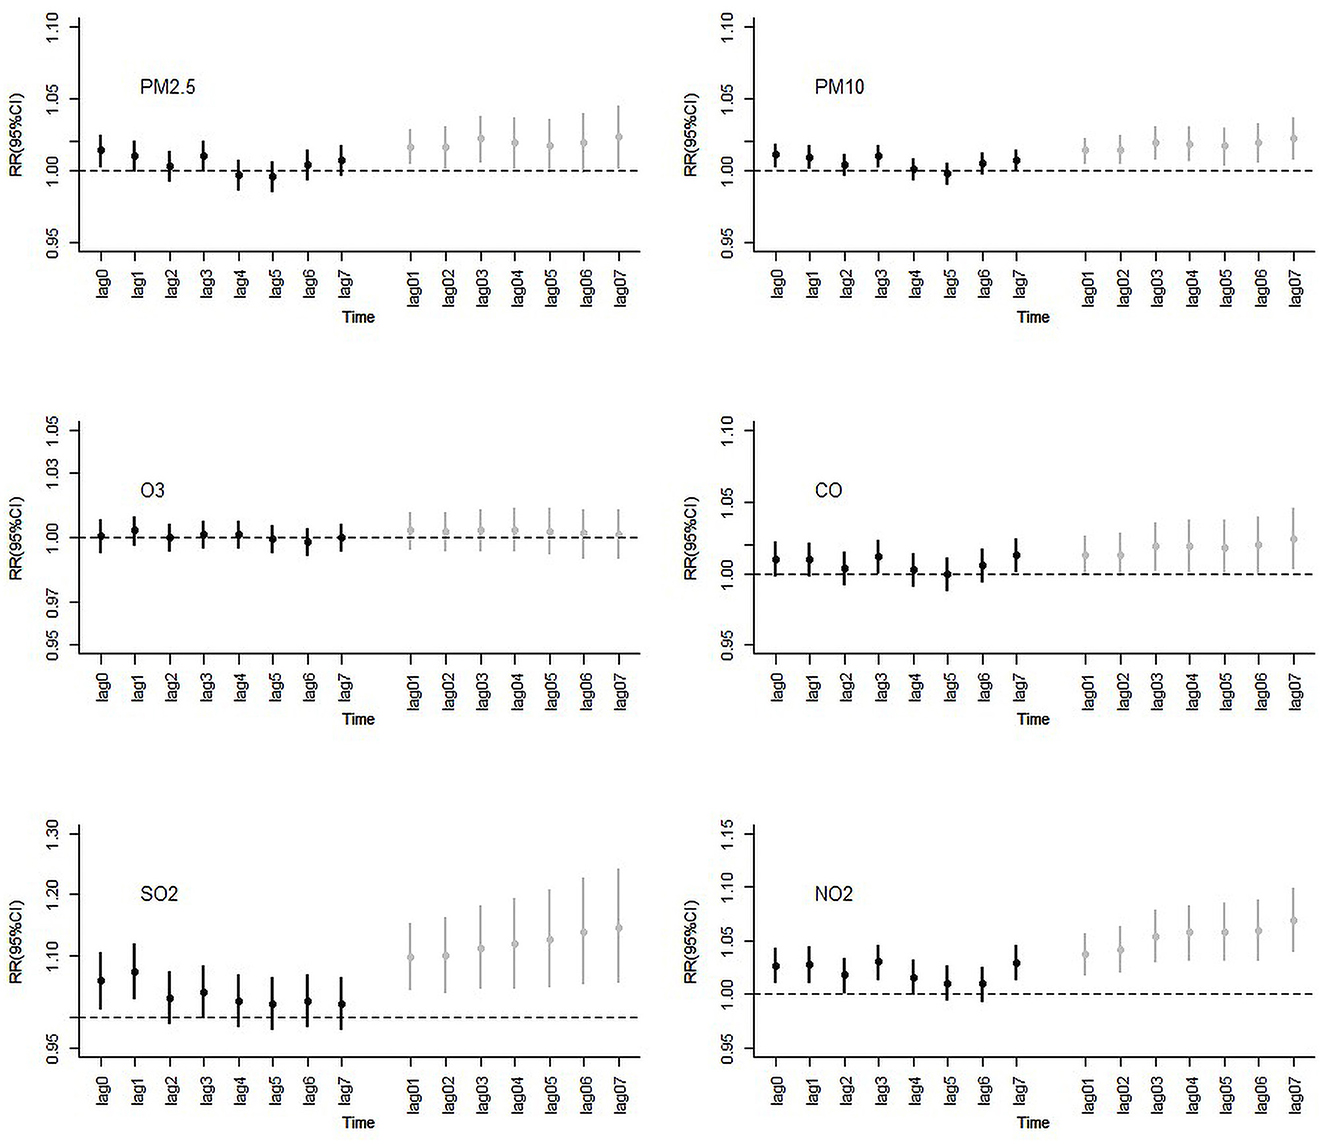
Figure 1. RR (Rate ratios) and 95%CIs (confidence intervals) following a 10-units increase on lag0, lags1–7, and lags01–07 ambient air pollution concentrations and hospital admissions for pneumonia and asthma, Ningbo, 2015–2017.
Figure 2 presents RRs and 95%CIs according to 10-μg/m3 increases for lag0 and lag03 among all cases, concentrations of different air pollutant subgroups and hospitalizations. Effects of cumulative lag generally reached a stable, high level on lag03; this was true among different subgroups. For all cases, we found that hospital admissions were increased by 1.38, 1.08, 5.99, and 2.69% on lag0 per 10-μg/m3 increase in PM2.5, PM10, SO2, and NO2, respectively. Judging from overall lag03 values, increases were found to be 2.22, 1.94, 11.21, and 5.42%, respectively. All of these findings were statistically significant. Significant associations for asthma were found for PM2.5 (RR = 1.110, 95%CI: 1.019, 1.209), PM10 (RR = 1.088, 95%CI: 1.023, 1.158), and SO2 (RR = 1.560, 95%CI: 1.088, 2.239). Large CIs were likely noted due to the relatively small number of cases; hospital admissions for pneumonia were found to possess narrow CIs as well as statistical significance.
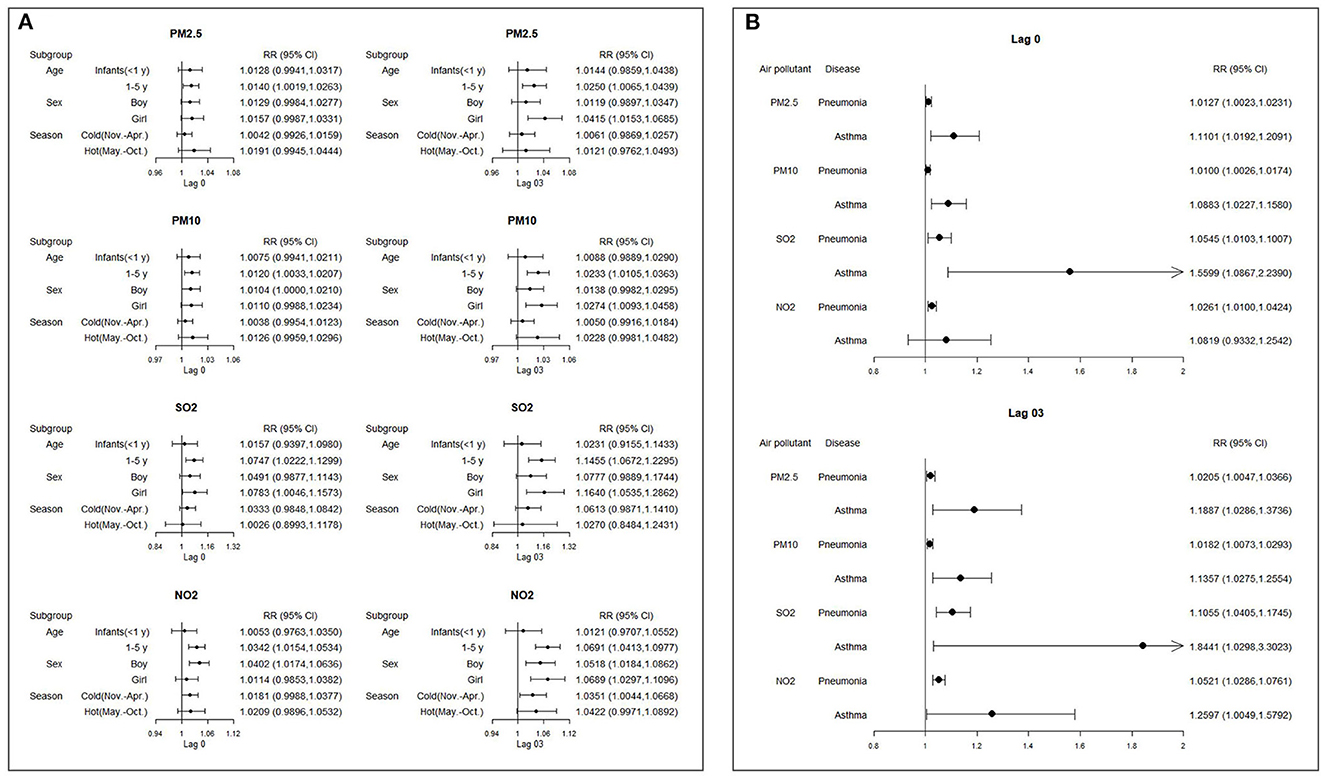
Figure 2. RR (Rate ratios) and 95% CIs (confidence intervals) following a 10-μg/m3 increase on lag0 and lag03 of all cases and different subgroups ambient air pollution concentrations and hospital admissions for pneumonia and asthma. (A) Subgroup analyses by age, sex and season. (B) Subgroup analyses by pathology).
3.3. Subgroup analyses by age, sex, pathology and season
Significant associations for children aged 1–5 years were found for PM2.5 (RR = 1.014, 95%CI: 1.002, 1.026), PM10 (RR = 1.012, 95%CI: 1.003, 1.021), SO2 (RR = 1.075, 95%CI: 1.022, 1.130) and NO2 (RR = 1.034, 95%CI: 1.015, 1.053); no significant associations were observed for infants (aged < 1 year) for all pollutants.
The associations of ambient air pollutant concentrations and hospital admissions for pneumonia and asthma were higher during warmer as compared to colder months, apart from SO2, which was found to have a higher association throughout colder months. However, these differences were not significant.
3.4. Sensitivity analyses
Estimated RR and 95%CI values in single- and two-pollutant models adjusted for PM2.5, PM10, O3, CO, SO2, and NO2 on lag0 for hospital admissions for pneumonia and asthma are shown in Figure 3. Addition of other pollutants to the model revealed that as compared with single-pollutant model results, estimated RRs changed to a certain extent and sometimes even lost statistical significance. Except for that of O3 (not statistically significant), estimated health effects of NO2 were found to be most stable (as determined by whether statistical significance was lost statistical) across both models. In general, estimates of PM2.5, PM10, SO2, and NO2 decreased after inclusion of other pollutants (apart from O3 and CO; associations between PM10 and hospital admissions for pneumonia and asthma increased slightly after the inclusion of PM2.5). Estimates of PM2.5, PM10, and SO2 in particular lost significance.
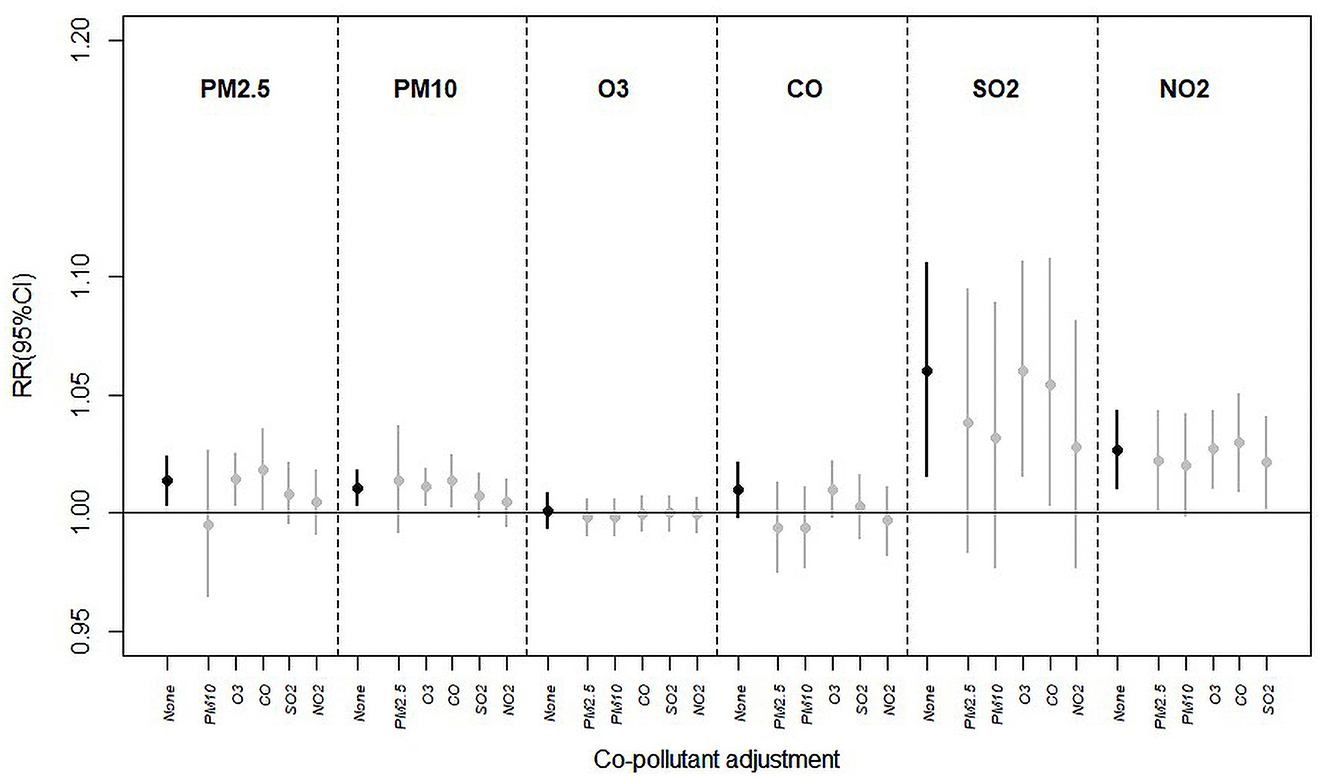
Figure 3. Estimated RR (Rate ratios) and 95%CIs (confidence intervals) in the single- and two-pollutant models with adjustment for PM2.5, PM10, O3, CO, SO2, and NO2 on lag0 for hospital admissions for pneumonia and asthma.
Supplementary Table 3 shows sensitivity analyses findings, considering PM2.5 as an example, by excluding children aged <1 month (total number of excluded infants: 36) and using alternative degrees of freedom (df: 9 and 10) for time. Exclusion of infants was estimated to not have significantly affected results as compared to including this population in analysis. In addition, when time df was 9 or 10, model results were generally stable.
4. Discussion
During the study period, mean concentrations of PM2.5 (40.2 ± 24.7 μg/m3), PM10 (63.5 ± 35.0 μg/m3), NO2 (39.7 ± 17.0 μg/m3), and O3 (99.3 ± 41.9 μg/m3) were found to have been significantly higher than standards set forth by WHO Air Quality Guidelines (44) (AQGs; PM2.5: 5 μg/m3 annual mean; PM10: 15 μg/m3 annual mean; NO2: 10 μg/m3 annual mean; O3:60 μg/m3 peak season mean) in Ningbo, China. In contrast, the concentrations of SO2 (13.0 ± 5.9 μg/m3) and CO (0.8 ± 0.2 mg/m3) remained within limits (SO2: 40 μg/m3 24-h mean; CO: 4 mg/m3 24-h mean). In addition, the single-day effect of the overall adverse effects of air pollutants was highest at lag0, while the cumulative lag effect was highest at lag03. To our knowledge, this is one of the few Chinese studies performed to assess effects of ambient air pollutants on the increase in the number of pneumonia and asthma hospitalizations among children aged under 5 years.
We used population-based time series analysis to confirm that increased atmospheric concentrations of PM2.5, PM10, SO2, and NO2 were significantly associated with increased hospital admissions for these illnesses among the aforementioned population. Our findings were consistent with those reported in previous studies, although specific estimates differed from study to study (45, 46). This discrepancy was likely due to differences in utilized research methods, an inherently different period considered in different studies and objective regional differences.
In the overall air pollution, the adverse effect of SO2 was found to be greatest among all pollutants, as confirmed by lag0 results and those of the entire cumulative lag period. The results for the same region in 2018 also showed that SO2 had the greatest impact on the loss of life due to ischaemic heart disease, followed by NO2 (47). Our results were consistent with a meta-analysis performed by Nhung et al. (48), which similarly reported SO2 to carry the highest excess risk among many air pollutants, with each 10 μg/m3 increase in SO2 concentration exposure associating with a 2.90% increase in pediatric pneumonia diagnoses (95%CI: 1.004, 1.053). Meanwhile, a previous study also performed in Ningbo similarly demonstrated that the strongest adverse effect resulting in pneumonia hospitalization was exerted by SO2; every 10 μg/m3 increase in SO2 exposure at lag5 was found to be associated with an increase in risk of 5.0% (95%CI: 1.013, 1.088) among children for pneumonia hospitalization (49). Previous studies also reported adverse effects of SO2 on asthma risk in children. One meta-analysis of 22 studies revealed a significant association between SO2 and asthma attacks in a subgroup of children (OR = 1.047, 95%CI: 1.009, 1.086) (50). In addition, a study in Taiwan reported that among all pollutants studied, SO2 most strongly correlated with daily asthma hospitalization in children aged 0–5 years (RR = 1.647, 95%CI: 1.607, 1.689) (51). These findings underscore the significant acute effects and delayed cumulative toxicity of SO2 on pediatric asthma and pneumonia hospitalization. To explore possible causes for these phenomena, several experiments investigated the mechanism by which SO2 exerts stronger adverse effects. A highly soluble gas that also functions as a bronchoconstrictor, SO2 stimulates receptor fibers and mucosal sensory nerves in the airway (52), thereby upregulating expression of proinflammatory cytokines, producing a Th1/Th2 imbalance, aggravating the pulmonary inflammatory response, promoting inflammation and increasing oxidative stress (53, 54). As such, the environmental increase in SO2 leads to a significant decrease in small airway function and increased airway oxidative stress, potentially manifesting with asthma (55).
Secondary to SO2, PM2.5, and PM10 were also found to significantly influence pediatric asthma and pneumonia hospitalizations at lag0 and lag03 in this study. The health effects of PM on the public, as well as relevant pathologic mechanisms, have been widely studied in recent decades. Particles <2.5 mm in diameter are capable of entering the circulation, while particles <10 mm in diameter are capable of penetrating deep into pulmonary tissue. Various PM components such as organic carbon, nitrates, metals and silicon have been linked to development of early-life pneumonia (56). Fine PM likely exerts stronger effects on lung cells due to deeper tissue deposition and slower clearance (57). Importantly, PMs produce free radicals and cause oxidative stress in lung cells (15). In addition, PMs increase susceptibility to infection via suppression of immunity (12). Effects of PM on pneumonia have also been widely studied (48, 58, 59). One systematic meta-analysis concluded that for each 10 mg/m3 increase in PM2.5 and PM10, short-term impacts on hospitalization for pediatric pneumonia in children were ~1.8% (95%CI: 1.005, 1.031) and 1.5% (95%CI: 1.006, 1.024), with PM2.5 second only to SO2 in terms of influence on risk (48). A study performed in Qingdao, China reported that an increase in interquartile spacing between PM2.5 and PM10 was associated with a significant increase in risk of hospitalization for pneumonia in children under 4 years of age, at 7.5% (95%CI: 1.017, 1.136) and 10.1% (95%CI: 1.037, 1.169), respectively (58). Taiwanese studies have provided higher estimates, reporting increased interquartile spacing of PM2.5 and PM10 at lag3 to increase the risk for emergency department admission for children suffering pneumonia by 18.2 (95%CI: 1.088, 1.284) and 13.1% (95%CI: 1.051, 1.217) (59). Moreover, the adverse effects of PM on pediatric hospitalization for respiratory diseases such as asthma and bronchiolitis were also studied in Brazil (60) and the United States (61). The two-pollutant model utilized in this study revealed that PM2.5 and PM10 lost some statistical significance after introduction of NO2 and SO2 to analyses; it can thus be speculated that pediatric pneumonia and asthma hospitalization are influenced more greatly by NO2 and SO2 concentrations.
Surprisingly, we found that NO2 exerted the most consistent effect on hospitalization according to both of our pollutant models. However, adverse effects of NO2 were noted to decrease after introduction of SO2 and PM to analysis, with findings retaining statistical significance. Similar findings were reported in an Australian study where the effect of outdoor air NO2 content on pediatric hospitalizations was found to be largely independent of effects exerted by other pollutants (62). One Vietnamese study reported that an increase in NO2 levels in the mean quartile range (21.9 μg/m3) was associated with a 6.1% increase in pediatric hospitalizations for pneumonia (95%CI: 1.025, 1.098), with findings remaining consistent in analyses of multiple pollutants (21). Those findings are likely explained by NO2 being a free radical whose action has the potential to deplete tissue antioxidant defenses and lead to increased inflammation. Furthermore, exposure to NO2 was associated with reduced lung volume growth (63) an increased pneumonia incidence (64–66) and increased penicillin MIC against Streptococcus pneumoniae among children (67). In addition, prenatal and postnatal exposure to NO2 was found to be a likely risk factor for pediatric allergies and respiratory diseases (68). Therefore, compared with other pollutants, NO2 seems to better reflect the effects of air pollution on pediatric pneumonia and asthma hospitalization. Considering the stability of NO2, and its properties as a major traffic pollutant (69, 70), implementation of more effective environmental policies should be formulated in Ningbo to reduce children's exposure to NO2 and thus its harmful effects on childhood health.
Age specific analysis revealed the adverse effects of air pollutants on pediatric pneumonia and asthma to be higher as compared to infants. Similar results have been reported in other Chinese cities (71–73) as well as some foreign cities (74, 75). These results may be related to the behavior patterns of children and the effects of breast milk. Importantly, infants under the age of 1 year usually have full-time caregivers that nurture them exclusively indoors, while older children (2–5 years) are generally more active and thus more exposed to outdoor air pollutants (75). Interestingly, breastfeeding was reported to be an important protective factor for a child's immune system against air pollution. Several studies in China have shown that breastfeeding is associated with a reduced risk of pediatric respiratory diseases (76–78). Hence, Infants received more protection from breast milk than children 1–5 years of age. These findings suggest that parents should pay attention to the respiratory health of children aged 1–5 years who are vulnerable to air pollution, and take measures such as reducing travel or wearing masks on smoggy days to reduce the harm of air pollution to children. In addition, the care and protection of infants under 1 year old should be maintained, and breastfeeding should be advocated.
Our study was not without some seasonal heterogeneity. Generally, the adverse effects of PM2.5, PM10, and NO2 were noted to be slightly higher in warmer as compared to colder months, consistent with findings reported by previous studies performed in Beijing (79), Fuzhou (80), Taiwan (81), and Hong Kong (82). The reasons why air pollutants are more harmful in a warmer season can be explained by high temperature itself being associated with increased risk of pneumonia (83). Furthermore, higher temperatures affect emission, transportation, dilution, chemical conversion, and deposition of air pollutants (84). In addition, significant thermoregulatory stress to heat, manifesting in processes such as sweating, similarly increases absorption and distribution of air pollutants in the human body (85). Effects observed may also be explained by temperature-influenced patterns of exposure; namely people tending to engage in greater frequencies of outdoor activities in warmer months and thus increasing air pollutant exposure (86). However, the influences of temperature remain inconclusive, with some studies having reported air pollutants to more markedly increase pneumonia hospitalization rates in colder months (87). Further research is thus warranted needed to investigate the impact of temperature on air pollutants and health.
Sex subgroup analysis revealed that apart from NO2, the adverse effects of PM2.5, PM10, and SO2 on pneumonia and asthma were higher in girls as compared to boys. One similar subgroup analysis from Wuhan reported that PM2.5 had a higher OR of 1.020 (95%CI: 1.007, 1.034) in hospitalized females as compared to hospitalized males, while NO2 exerted significant effects exclusively on boys (88). Our findings similarly underscored a greater adverse effect of NO2 on pneumonia and asthma hospitalization rates among boys at lag0. In a Hong Kong study, PM was reported to exert a slightly greater effect on increased hospitalization rates for pneumonia among girls as compared to boys (27). One Chinese study analyzing deaths among children under 5 years of age also reported a significant correlation between exposure to PM2.5 and pneumonia mortality, with a larger effect estimated among girls. One birth cohort study performed in the Netherlands reported that asthma rates in girls tended to more strongly correlate with air pollution levels as compared to those of boys, although interactions between exposure and sex were not statistically significant (89). Conversely, some studies have reported boys to be more sensitive to air pollution (71, 73, 90). Although sex differences in air pollution epidemiology have recently become a hot topic of discussion, no consensus has been reached to date (90). Although exact causative mechanisms remain unclear, studies have reported boys and girls to respond differently to various air pollutants, likely due to different degrees of sensitivity to air pollution and differences in early postnatal respiratory development (90, 91). Importantly, differences in lung structure, immune processes and inflammatory responses were reported to make girls more susceptible to infection (92, 93). In addition, as boys are generally more active more frequently exposed to outdoor air pollutants than girls, this also likely results in greater risk of pulmonary illness (94). Whether there is a difference between boys and girls aged under 5 years old in outdoor activity participation in Ningbo warrants exploration.
Importantly, we found that the air pollutants analyzed in this study exerted much greater adverse effects on asthma as compared with pneumonia hospitalization. Although previous studies conducted in Sri Lanka (95), Georgia (96), and the United States (97) reported similar findings and underscored a positive correlation between air pollutants such as PM and NO2 and asthma hospitalization in the case of asthma, either no significant correlation with pneumonia hospitalization or loss of significance after model adjustment found in the case of pneumonia. In Vietnam, study of high air pollutant concentrations revealed that although PM2.5, PM10, SO2, and NO2 were positively correlated with hospitalization for pneumonia and asthma, estimated risk of air pollutants for asthma became greater while estimated risk for pneumonia decreased after adjustment for PM2.5 (21). Oxidative stress, airway remodeling, inflammation, immune dysregulation and enhanced respiratory sensitization to airborne allergens have all been proposed to explain how air pollution contributes to asthma pathogenesis (98). The occurrence and exacerbation of asthma are also influenced by various factors such as genetic susceptibility and ancestry (99), recent viral respiratory tract infection or allergen exposure (100), extreme weather (101) and pollen exposure (102, 103), among others. Interestingly, prior findings suggest an increased susceptibility to asthma as compared to pneumonia. Furthermore, a study evaluating children in 18 European countries reported 33% more cases of childhood asthma to be attributable to air pollution exposure (PM2.5) (104). In light of the relatively small number of asthma cases in our study, future correlation analyses are warranted. In addition, adoption of more appropriate policies to reasonably reduce exposure to air pollutants and thus asthma incidence among children are necessary.
Our study was not without limitations. Firstly, like other research in the field of environmental health relying on use of large health databases, data on patient-level variables were not available, which limited our ability to identify potentially more susceptible populations. More detailed individual data would be required to correct for confounding effects of individual characteristics on the associations between air pollutants and childhood pneumonia and asthma hospitalization. As our sample size of asthma hospital admission was limited, the validity of our conclusions concerning relationships between asthma and air pollutants remains in question. Finally, as emergency room visits for pneumonia and asthma were not analyzed in this study, future research is warranted to more accurately assess the impact of air pollutants on emergency department admission in the context of acute pulmonary conditions such as pneumonia and asthma.
Of note, this study possessed several points of strength. Firstly, our findings revealed detailed estimates of the risk of air pollutant-associated hospital admission in the settings of pediatric pneumonia and asthma utilizing high-quality data obtained from a big data platform that included clinical information of all children residing in Ningbo. Secondly, successful construction of our analytical model allowed for performance of reasonable subgroup and sensitivity analyses elucidating the detailed impact of air pollutants on pediatric pulmonary health. Finally, our utilization of high-quality meteorological data allowed for representative estimation of effects expected to be exerted by air pollutants on health throughout the Ningbo metropolitan area.
5. Conclusion
Exposure of air pollutants including PM2.5, PM10, SO2, and NO2 in the Ningbo metropolitan area was found to positively correlate with pneumonia- and asthma-related hospitalizations among children aged under 5 years. Among these pollutants, NO2 likely remains the most stable and exerts the most significant adverse effects on human health. Adverse effects were found to be stronger in children aged 1–5, with adverse effects of PM2.5, PM10, and SO2 generally stronger in girls. Implementation of more appropriate public health measures throughout the urban Ningbo area is warranted to reduce childhood exposure to PM2.5, PM10, SO2, and NO2, and in turn reduce rates of pediatric hospitalizations for acute pulmonary conditions.
Data availability statement
The original contributions presented in the study are included in the article/Supplementary material, further inquiries can be directed to the corresponding authors.
Author contributions
Conceptualization: XZho and LL. Methodology: XZha and MG. Software: GH. Formal analysis: MG. Data curation: ZhiL and XY. Writing-original draft preparation: LL and XZho. Writing-review and editing: XZho, MG, ZheL, and XZha. Funding acquisition: LL. All authors contributed to the article and approved the submitted version.
Funding
This research was funded by the National Natural Science Foundation of China, 81602940; Natural Science Foundation of Zhejiang Province, LY20H260002; State Key Laboratory of Reproductive Medicine, Nanjing Medical University, Nanjing, 211166, China, SKLRMK202104; Medical Technology Program Foundation of Zhejiang, 2023KY1108.
Acknowledgments
We thank all participants.
Conflict of interest
The authors declare that the research was conducted in the absence of any commercial or financial relationships that could be construed as a potential conflict of interest.
Publisher's note
All claims expressed in this article are solely those of the authors and do not necessarily represent those of their affiliated organizations, or those of the publisher, the editors and the reviewers. Any product that may be evaluated in this article, or claim that may be made by its manufacturer, is not guaranteed or endorsed by the publisher.
Supplementary material
The Supplementary Material for this article can be found online at: https://www.frontiersin.org/articles/10.3389/fpubh.2022.1017105/full#supplementary-material
Supplementary Table 1. ER (Excess risk) and 95%CIs (confidence intervals) following a 10-units increase on lag0, lags1–7 and lags01–07 ambient air pollution concentrations and hospital admissions for pneumonia and asthma, Ningbo, 2015–2017.
Supplementary Table 2. Association between different air pollutants and increases of 10-μg/m3 (CO increase of 100-μg/m3) and hospitalization rates (hospitalization for pneumonia and asthma).
Supplementary Table 3. A sensitivity analysis: excluding children under 1 month of age and different degrees of freedom of time variables (taking PM2.5 as an example).
References
1. Troeger CE, Khalil IA, Blacker BF, Biehl MH, Albertson SB, Zimsen SR, et al. Quantifying risks and interventions that have affected the burden of lower respiratory infections among children younger than 5 years: an analysis for the Global Burden of Disease Study 2017. Lancet Infect Dis. (2020) 20:60–79. doi: 10.1016/s1473-3099(19)30410-4
2. World Health Organization. Pneumonia in Children. World Health Organization (2022). Available online at: https://www.who.int/news-room/fact-sheets/detail/pneumonia
3. McAllister DA, Liu L, Shi T, Chu Y, Reed C, Burrows J, et al. Global, regional, and national estimates of pneumonia morbidity and mortality in children younger than 5 years between 2000 and 2015: a systematic analysis. Lancet Global Health. (2019) 7:e47–57. doi: 10.1016/S2214-109X(18)30408-X
4. Liu L, Oza S, Hogan D, Chu Y, Perin J, Zhu J, et al. Global, regional, and national causes of under-5 mortality in 2000–2015: an updated systematic analysis with implications for the Sustainable Development Goals. Lancet. (2016) 388:3027–35. doi: 10.1016/S0140-6736(16)31593-8
6. Lancet T. Asthma—hope for the future? Lancet. (2015) 386:1014. doi: 10.1016/S0140-6736(15)00192-0
7. Asher MI, Rutter CE, Bissell K, Chiang CY, El Sony A, Ellwood E, et al. Worldwide trends in the burden of asthma symptoms in school-aged children: Global Asthma Network Phase I cross-sectional study. Lancet. (2021) 398:1569–80. doi: 10.1016/S0140-6736(21)01450-1
8. Boerma T, Requejo J, Victora CG, Amouzou A, George A, Agyepong I, et al. Countdown to 2030: tracking progress towards universal coverage for reproductive, maternal, newborn, and child health. Lancet. (2018) 391:1538–48. doi: 10.1016/s0140-6736(18)30104-1
9. Brunekreef B, Holgate ST. Air pollution and health. Lancet. (2002) 360:1233–42. doi: 10.1016/S0140-6736(02)11274-8
10. Wu S, Ni Y, Li H, Pan L, Yang D, Baccarelli AA, et al. Short-term exposure to high ambient air pollution increases airway inflammation and respiratory symptoms in chronic obstructive pulmonary disease patients in Beijing, China. Environ Int. (2016) 94:76–82. doi: 10.1016/j.envint.2016.05.004
11. Li W, Dorans KS, Wilker EH, Rice MB, Ljungman PL, Schwartz JD, et al. Short-term exposure to ambient air pollution and circulating biomarkers of endothelial cell activation: the framingham heart study. Environ Res. (2019) 171:36–43. doi: 10.1016/j.envres.2018.10.027
12. Becker S, Soukup JM. Exposure to urban air particulates alters the macrophage-mediated inflammatory response to respiratory viral infection. J Toxicol Environ Health A. (1999) 57:445–57. doi: 10.1080/009841099157539
13. Gurgueira SA, Lawrence J, Coull B, Murthy GG, González-Flecha B. Rapid increases in the steady-state concentration of reactive oxygen species in the lungs and heart after particulate air pollution inhalation. Environ Health Perspect. (2002) 110:749–55. doi: 10.1289/ehp.02110749
14. Anderson HR, Atkinson RW, Bremner SA, Marston L. Particulate air pollution and hospital admissions for cardiorespiratory diseases: are the elderly at greater risk? Eur Respirat J. (2003) 40:39s−46s. doi: 10.1183/09031936.03.00402203
15. Gilmour PS, Rahman I, Donaldson K, MacNee W. Histone acetylation regulates epithelial IL-8 release mediated by oxidative stress from environmental particles. Am J Physiol Lung Cell Mol Physiol. (2003) 284:L533–40. doi: 10.1152/ajplung.00277.2002
16. Auerbach A, Hernandez ML. The effect of environmental oxidative stress on airway inflammation. Curr Opin Allergy Clin Immunol. (2012) 12:133–9. doi: 10.1097/ACI.0b013e32835113d6
17. Lung MA. Acute effects of inhaled sulphur dioxide on pig nasal vascular and airway resistances. Sheng li xue bao: [Acta physiologica Sinica]. (2014) 66:79–84. doi: 10.13294/j.aps.2014.0010
18. Phung D, Hien TT, Linh HN, Luong LM, Morawska L, Chu C, et al. Air pollution and risk of respiratory and cardiovascular hospitalizations in the most populous city in Vietnam. Sci Total Environ. (2016) 557–558:322–30. doi: 10.1016/j.scitotenv.2016.03.070
19. Sicard P, Khaniabadi YO, Perez S, Gualtieri M, De Marco A. Effect of O(3), PM(10) and PM(25) on cardiovascular and respiratory diseases in cities of France, Iran and Italy. Environ Sci Pollut Res Int. (2019) 26:32645–65. doi: 10.1007/s11356-019-06445-8
20. Landrigan PJ, Fuller R, Fisher S, Suk WA, Sly P, Chiles TC, et al. Pollution and children's health. Sci Total Environ. (2019) 650(Pt 2):2389–94. doi: 10.1016/j.scitotenv.2018.09.375
21. Nhung NTT, Schindler C, Dien TM, Probst-Hensch N, Perez L, Kunzli N. Acute effects of ambient air pollution on lower respiratory infections in Hanoi children: an 8-year time series study. Environ Int. (2018) 110:139–48. doi: 10.1016/j.envint.2017.10.024
22. Chen CH, Chan CC, Chen BY, Cheng TJ, Leon Guo Y. Effects of particulate air pollution and ozone on lung function in non-asthmatic children. Environ Res. (2015) 137:40–8. doi: 10.1016/j.envres.2014.11.021
23. Lelieveld J, Haines A, Pozzer A. Age-dependent health risk from ambient air pollution: a modelling and data analysis of childhood mortality in middle-income and low-income countries. Lancet Planet Health. (2018) 2:e292–300. doi: 10.1016/S2542-5196(18)30147-5
24. Landrigan PJ, Fuller R, Acosta NJR, Adeyi O, Arnold R, Basu NN, et al. The Lancet Commission on pollution and health. Lancet. (2018) 391:462–512. doi: 10.1016/s0140-6736(17)32345-0
25. Medina-Ramón M, Zanobetti A, Schwartz J. The effect of ozone and PM10 on hospital admissions for pneumonia and chronic obstructive pulmonary disease: a national multicity study. Am J Epidemiol. (2006) 163:579–88. doi: 10.1093/aje/kwj078
26. Host S, Larrieu S, Pascal L, Blanchard M, Declercq C, Fabre P, et al. Short-term associations between fine and coarse particles and hospital admissions for cardiorespiratory diseases in six French cities. Occup Environ Med. (2008) 65:544–51. doi: 10.1136/oem.2007.036194
27. Qiu H, Tian LW, Pun VC, Ho KF, Wong TW, Yu IT. Coarse particulate matter associated with increased risk of emergency hospital admissions for pneumonia in Hong Kong. Thorax. (2014) 69:1027–33. doi: 10.1136/thoraxjnl-2014-205429
28. Horne BD, Joy EA, Hofmann MG, Gesteland PH, Cannon JB, Lefler JS, et al. Short-term elevation of fine particulate matter air pollution and acute lower respiratory infection. Am J Resp Crit Care Med. (2018) 198:759–66. doi: 10.1164/rccm.201709-1883OC
29. Strosnider HM, Chang HH, Darrow LA, Liu Y, Vaidyanathan A, Strickland MJ. Age-specific associations of ozone and fine particulate matter with respiratory emergency department visits in the United States. Am J Resp Crit Care Med. (2019) 199:882–90. doi: 10.1164/rccm.201806-1147OC
30. Environment NMBoEa,. Ningbo Environmental Status Bulletin 2015. (2016). Available online at: http://sthjj.ningbo.gov.cn/art/2016/6/7/art_1229051263_52545139.html
31. Environment NMBoEa,. Ningbo Environmental Status Bulletin 2016. (2017). Available online at: http://sthjj.ningbo.gov.cn/art/2017/6/5/art_1229051263_52545138.html
32. Environment NMBoEa,. Ningbo Environmental Status Bulletin 2017. (2018). Available online at: http://sthjj.ningbo.gov.cn/art/2018/6/5/art_1229051263_52545136.html
33. Ningbo tHCo. Health Development in Ningbo in 2017. (2018). Available online at: http://wjw.ningbo.gov.cn/art/2018/10/12/art_1229128285_548562.html
34. Ningbo tHCo. Number of Districts, Counties (Cities), Health Care Institutions, Beds Personnel in Ningbo in 2017. (2018). Available online at: http://wjw.ningbo.gov.cn/art/2018/10/12/art_1229128285_548561.html.
35. Dehghan A, Khanjani N, Bahrampour A, Goudarzi G, Yunesian M. The relation between air pollution and respiratory deaths in Tehran, Iran- using generalized additive models. BMC Pulmon Med. (2018) 18:49. doi: 10.1186/s12890-018-0613-9
36. Samet JM, Dominici F, Zeger SL, Schwartz J, Dockery DW. The national morbidity, mortality, and air pollution study. Part I: methods and methodologic issues. Res Rep. (2000) 94(Pt 1):5–14.
37. Fan L, Gu Q, Zeng Q. Progress in the application of generalized additive model in epidemiologic studies on air pollution. J Environ Occup Med. (2019) 36:676–81.
38. Hastie T, Tibshirani R. Generalized additive models for medical research. Stat Methods Med Res. (1995) 4:187–96. doi: 10.1177/096228029500400302
39. Dominici F, Peng RD, Bell ML, Pham L, McDermott A, Zeger SL, et al. Fine particulate air pollution and hospital admission for cardiovascular and respiratory diseases. JAMA. (2006) 295:1127–34. doi: 10.1001/jama.295.10.1127
40. Chen R, Yin P, Meng X, Liu C, Wang L, Xu X, et al. Fine particulate air pollution and daily mortality. A nationwide analysis in 272 Chinese cities. Am J Resp Crit Care Med. (2017) 196:73–81. doi: 10.1164/rccm.201609-1862OC
41. Tian Y, Liu H, Wu Y, Si Y, Li M, Wu Y, et al. Ambient particulate matter pollution and adult hospital admissions for pneumonia in urban China: a national time series analysis for 2014 through 2017. PLoS Med. (2019) 16:e1003010. doi: 10.1371/journal.pmed.1003010
42. Liu C, Chen R, Sera F, Vicedo-Cabrera AM, Guo Y, Tong S, et al. Ambient particulate air pollution and daily mortality in 652 cities. N Engl J Med. (2019) 381:705–15. doi: 10.1056/NEJMc1913285
43. Hua Y, Yuan X, Wang J, Zeng K, Zhi S, Liu L. Association between air pollution and hospital admissions for chronic respiratory disease in people aged over 65 years: a time series analysis in Ningbo, China, 2015–2017. Int Arch Occup Environ Health. (2022) 95:1293–304. doi: 10.1007/s00420-022-01887-z
44. World Health Organization. WHO Global Air Quality Guidelines: Particulate Matter (PM2.5 and PM10), Ozone, Nitrogen Dioxide, Sulfur Dioxide and carbon Monoxide. World Health Organization (2021). Available online at: https://www.who.int/publications/i/item/9789240034228.
45. Lv C, Wang X, Pang N, Wang L, Wang Y, Xu T, et al. The impact of airborne particulate matter on pediatric hospital admissions for pneumonia among children in Jinan, China: a case-crossover study. J Air Waste Manag Assoc. (2017) 67:669–76. doi: 10.1080/10962247.2016.1265026
46. Mehta S, Shin H, Burnett R, North T, Cohen AJ. Ambient particulate air pollution and acute lower respiratory infections: a systematic review and implications for estimating the global burden of disease. Air Qual Atmosp Health. (2013) 6:69–83. doi: 10.1007/s11869-011-0146-3
47. Huang J, Li G, Qian X, Xu G, Zhao Y, Huang J, et al. The burden of ischemic heart disease related to ambient air pollution exposure in a coastal city in South China. Environ Res. (2018) 164:255–61. doi: 10.1016/j.envres.2018.02.033
48. Nhung NTT, Amini H, Schindler C, Kutlar Joss M, Dien TM, Probst-Hensch N, et al. Short-term association between ambient air pollution and pneumonia in children: a systematic review and meta-analysis of time-series and case-crossover studies. Environ Pollut. (2017) 230:1000–8. doi: 10.1016/j.envpol.2017.07.063
49. Li D, Wang JB, Zhang ZY, Shen P, Zheng PW, Jin MJ, et al. Effects of air pollution on hospital visits for pneumonia in children: a 2-year analysis from China. Environ Sci Pollut Res Int. (2018) 25:10049–57. doi: 10.1007/s11356-018-1192-2
50. Orellano P, Quaranta N, Reynoso J, Balbi B, Vasquez J. Effect of outdoor air pollution on asthma exacerbations in children and adults: systematic review and multilevel meta-analysis. PLoS ONE. (2017) 12:e0174050. doi: 10.1371/journal.pone.0174050
51. Kuo CY, Chan CK, Wu CY, Phan DV, Chan CL. The short-term effects of ambient air pollutants on childhood asthma hospitalization in Taiwan: a national study. Int J Environ Res Public Health. (2019) 16:203. doi: 10.3390/ijerph16020203
52. Tunnicliffe WS, Hilton MF, Harrison RM, Ayres JG. The effect of sulphur dioxide exposure on indices of heart rate variability in normal and asthmatic adults. Eur Resp J. (2001) 17:604–8. doi: 10.1183/09031936.01.17406040
53. Li R, Kou X, Tian J, Meng Z, Cai Z, Cheng F, et al. Effect of sulfur dioxide on inflammatory and immune regulation in asthmatic rats. Chemosphere. (2014) 112:296–304. doi: 10.1016/j.chemosphere.2014.04.065
54. Li X, Huang L, Wang N, Yi H, Wang H. Sulfur dioxide exposure enhances Th2 inflammatory responses via activating STAT6 pathway in asthmatic mice. Toxicol Lett. (2018) 285:43–50. doi: 10.1016/j.toxlet.2017.12.020
55. Liu L, Poon R, Chen L, Frescura AM, Montuschi P, Ciabattoni G, et al. Acute effects of air pollution on pulmonary function, airway inflammation, and oxidative stress in asthmatic children. Environ Health Perspect. (2009) 117:668–74. doi: 10.1289/ehp.11813
56. Fuertes E, MacIntyre E, Agius R, Beelen R, Brunekreef B, Bucci S, et al. Associations between particulate matter elements and early-life pneumonia in seven birth cohorts: results from the ESCAPE and TRANSPHORM projects. Int J Hyg Environ Health. (2014) 217:819–29. doi: 10.1016/j.ijheh.2014.05.004
57. Valavanidis A, Fiotakis K, Vlachogianni T. Airborne particulate matter and human health: toxicological assessment and importance of size and composition of particles for oxidative damage and carcinogenic mechanisms. J Environ Sci Health C Environ Carcinogen Ecotoxicol Rev. (2008) 26:339–62. doi: 10.1080/10590500802494538
58. Zhang J, Ren D, Cao X, Wang T, Geng X, Li X, et al. Ambient air pollutants and hospital visits for pneumonia: a case-crossover study in Qingdao, China. BMC Public Health. (2021) 21:66. doi: 10.1186/s12889-020-10065-0
59. Tsai MT, Ho YN, Chiang CY, Chuang PC, Pan HY, Chiu IM, et al. Effects of fine particulate matter and its components on emergency room visits for pediatric pneumonia: a time-stratified case-crossover study. Int J Environ Res Public Health. (2021) 18:599. doi: 10.3390/ijerph182010599
60. César AC, Nascimento LF, Mantovani KC, Pompeo Vieira LC. Fine particulate matter estimated by mathematical model and hospitalizations for pneumonia and asthma in children. Revista Paulista de Pediatria Orgao Oficial da Sociedade de Pediatria de Sao Paulo. (2016) 34:18–23. doi: 10.1016/j.rppede.2015.12.005
61. Karr C, Lumley T, Schreuder A, Davis R, Larson T, Ritz B, et al. Effects of subchronic and chronic exposure to ambient air pollutants on infant bronchiolitis. Am J Epidemiol. (2007) 165:553–60. doi: 10.1093/aje/kwk032
62. Barnett AG, Williams GM, Schwartz J, Neller AH, Best TL, Petroeschevsky AL, et al. Air pollution and child respiratory health: a case-crossover study in Australia and New Zealand. Am J Resp Crit Care Med. (2005) 171:1272–8. doi: 10.1164/rccm.200411-1586OC
63. Mölter A, Agius RM, de Vocht F, Lindley S, Gerrard W, Lowe L, et al. Long-term exposure to PM10 and NO2 in association with lung volume and airway resistance in the MAAS birth cohort. Environ Health Perspect. (2013) 121:1232–8. doi: 10.1289/ehp.1205961
64. Chen N, Shi J, Huang J, Yu W, Liu R, Gu L, et al. Impact of air pollutants on pediatric admissions for Mycoplasma pneumonia: a cross-sectional study in Shanghai, China. BMC Public Health. (2020) 20:447. doi: 10.1186/s12889-020-8423-4
65. Liu W, Huang C, Hu Y, Fu Q, Zou Z, Sun C, et al. Associations of gestational and early life exposures to ambient air pollution with childhood respiratory diseases in Shanghai, China: a retrospective cohort study. Environ Int. (2016) 92–93:284–93. doi: 10.1016/j.envint.2016.04.019
66. Souza LS, Nascimento LF. Air pollutants and hospital admission due to pneumonia in children: a time series analysis. Rev Assoc Med Brasil. (2016) 62:151–6. doi: 10.1590/1806-9282.62.02.151
67. Zhou Z, Fang C, Li J, Zhou M, Chen X. Ambient NO(2) is associated with Streptococcus pneumoniae-induced pneumonia in children and increases the minimum inhibitory concentration of penicillin. Int J Biometeorol. (2022) 66:87–96. doi: 10.1007/s00484-021-02193-y
68. Liu W, Huang C, Cai J, Fu Q, Zou Z, Sun C, et al. Prenatal and postnatal exposures to ambient air pollutants associated with allergies and airway diseases in childhood: a retrospective observational study. Environ Int. (2020) 142:105853. doi: 10.1016/j.envint.2020.105853
69. Yadav R, Nagori A, Mukherjee A, Singh V, Lodha R, Kabra SK, et al. Effects of ambient air pollution on emergency room visits of children for acute respiratory symptoms in Delhi, India. Environ Sci Pollut Res Int. (2021) 28:45853–66. doi: 10.1007/s11356-021-13600-7
70. Castro A, Künzli N, Götschi T. Health benefits of a reduction of PM(10) and NO(2) exposure after implementing a clean air plan in the Agglomeration Lausanne-Morges. Int J Hyg Environ Health. (2017) 220:829–39. doi: 10.1016/j.ijheh.2017.03.012
71. Pu X, Wang L, Chen L, Pan J, Tang L, Wen J, et al. Differential effects of size-specific particulate matter on lower respiratory infections in children: A multi-city time-series analysis in Sichuan, China. Environ Res. (2021) 193:110581. doi: 10.1016/j.envres.2020.110581
72. Wang J, Cao H, Sun D, Qi Z, Guo C, Peng W, et al. Associations between ambient air pollution and mortality from all causes, pneumonia, and congenital heart diseases among children aged under 5 years in Beijing, China: a population-based time series study. Environ Res. (2019) 176:108531. doi: 10.1016/j.envres.2019.108531
73. Wang X, Xu Z, Su H, Ho HC, Song Y, Zheng H, et al. Ambient particulate matter (PM(1), PM(25), PM(10)) and childhood pneumonia: the smaller particle, the greater short-term impact? Sci Total Environ. (2021) 772:145509. doi: 10.1016/j.scitotenv.2021.145509
74. Luong LTM, Dang TN, Thanh Huong NT, Phung D, Tran LK, Van Dung D, et al. Particulate air pollution in Ho Chi Minh city and risk of hospital admission for acute lower respiratory infection (ALRI) among young children. Environ Pollut. (2020) 257:113424. doi: 10.1016/j.envpol.2019.113424
75. Darrow LA, Klein M, Flanders WD, Mulholland JA, Tolbert PE, Strickland MJ. Air pollution and acute respiratory infections among children 0–4 years of age: an 18-year time-series study. Am J Epidemiol. (2014) 180:968–77. doi: 10.1093/aje/kwu234
76. Zhang C, Guo Y, Xiao X, Bloom MS, Qian Z, Rolling CA, et al. Association of breastfeeding and air pollution exposure with lung function in Chinese children. JAMA Netw Open. (2019) 2:e194186. doi: 10.1001/jamanetworkopen.2019.4186
77. Dong GH, Qian ZM, Liu MM, Wang D, Ren WH, Bawa S, et al. Breastfeeding as a modifier of the respiratory effects of air pollution in children. Epidemiology. (2013) 24:387–94. doi: 10.1097/EDE.0b013e3182877eb8
78. Chen F, Lin Z, Chen R, Norback D, Liu C, Kan H, et al. The effects of PM(25) on asthmatic and allergic diseases or symptoms in preschool children of six Chinese cities, based on China, Children, Homes and Health (CCHH) project. Environ Pollut. (2018) 232:329–37. doi: 10.1016/j.envpol.2017.08.072
79. Zhao Y, Kong D, Fu J, Zhang Y, Chen Y, Liu Y. Increased risk of hospital admission for asthma in children from short-term exposure to air pollution: case-crossover evidence from Northern China. Front Public Health. (2021) 9:798746. doi: 10.3389/fpubh.2021.798746
80. Zhou Q, Kang SL, Lin X, Zhang XY. Impact of air pollutants on hospital visits for pediatric asthma in Fuzhou city, southeast China. Environ Sci Pollut Res Int. (2022) 29:58664–74. doi: 10.1007/s11356-022-19928-y
81. Cheng CY, Cheng SY, Chen CC, Pan HY, Wu KH, Cheng FJ. Ambient air pollution is associated with pediatric pneumonia: a time-stratified case-crossover study in an urban area. Environ Health Global Access Sci Sour. (2019) 18:77. doi: 10.1186/s12940-019-0520-4
82. Lam HCY, Hajat S, Chan EYY, Goggins WB. Different sensitivities to ambient temperature between first- and re-admission childhood asthma cases in Hong Kong: a time series study. Environ Res. (2019) 170:487–92. doi: 10.1016/j.envres.2018.12.002
83. Onozuka D, Hashizume M, Hagihara A. Impact of weather factors on Mycoplasma pneumoniae pneumonia. Thorax. (2009) 64:507–11. doi: 10.1136/thx.2008.111237
84. Macdonald RW, Harner T, Fyfe J. Recent climate change in the Arctic and its impact on contaminant pathways and interpretation of temporal trend data. Sci Total Environ. (2005) 342:5–86. doi: 10.1016/j.scitotenv.2004.12.059
85. Gordon CJ. The mouse thermoregulatory system: its impact on translating biomedical data to humans. Physiol Behav. (2017) 179:55–66. doi: 10.1016/j.physbeh.2017.05.026
86. Chen R, Peng RD, Meng X, Zhou Z, Chen B, Kan H. Seasonal variation in the acute effect of particulate air pollution on mortality in the China Air Pollution and Health Effects Study (CAPES). Sci Total Environ. (2013) 450–451:259–65. doi: 10.1016/j.scitotenv.2013.02.040
87. Zanobetti A, Schwartz J. Air pollution and emergency admissions in Boston, MA. J Epidemiol Commun Health. (2006) 60:890–5. doi: 10.1136/jech.2005.039834
88. Huang ZH, Liu XY, Zhao T, Jiao KZ, Ma XX, Ren Z, et al. Short-term effects of air pollution on respiratory diseases among young children in Wuhan city, China. World J Pediat WJP. (2022) 18:333–42. doi: 10.1007/s12519-022-00533-5
89. Gehring U, Wijga AH, Koppelman GH, Vonk JM, Smit HA, Brunekreef B. Air pollution and the development of asthma from birth until young adulthood. Eur Resp J. (2020) 56:20. doi: 10.1183/13993003.00147-2020
90. Clougherty JE. A growing role for gender analysis in air pollution epidemiology. Environ Health Perspect. (2010) 118:167–76. doi: 10.1289/ehp.0900994
91. Gargaglioni LH, Marques DA, Patrone LGA. Sex differences in breathing. Comp Biochem Physiol A Mol Integ Physiol. (2019) 238:110543. doi: 10.1016/j.cbpa.2019.110543
92. Becklake MR, Kauffmann F. Gender differences in airway behaviour over the human life span. Thorax. (1999) 54:1119–38. doi: 10.1136/thx.54.12.1119
93. Paoletti P, Carrozzi L, Viegi G, Modena P, Ballerin L, Di Pede F, et al. Distribution of bronchial responsiveness in a general population: effect of sex, age, smoking, and level of pulmonary function. Am J Resp Crit Care Med. (1995) 151:1770–7. doi: 10.1164/ajrccm.151.6.7767519
94. Telford RM, Telford RD, Olive LS, Cochrane T, Davey R. Why are girls less physically active than boys? Findings from the LOOK longitudinal study. PLoS ONE. (2016) 11:e0150041. doi: 10.1371/journal.pone.0150041
95. Priyankara S, Senarathna M, Jayaratne R, Morawska L, Abeysundara S, Weerasooriya R, et al. Ambient PM(25) and PM(10) exposure and respiratory disease hospitalization in Kandy, Sri Lanka. Int J Environ Res Public Health. (2021) 18:617. doi: 10.3390/ijerph18189617
96. Huang M, Ivey C, Hu Y, Holmes HA, Strickland MJ. Source apportionment of primary and secondary PM(2.5): associations with pediatric respiratory disease emergency department visits in the U.S. State of Georgia. Environ Int. (2019) 133(Pt A):105167. doi: 10.1016/j.envint.2019.105167
97. Malig BJ, Green S, Basu R, Broadwin R. Coarse particles and respiratory emergency department visits in California. Am J Epidemiol. (2013) 178:58–69. doi: 10.1093/aje/kws451
98. Gowers AM, Cullinan P, Ayres JG, Anderson HR, Strachan DP, Holgate ST, et al. Does outdoor air pollution induce new cases of asthma? Biological plausibility and evidence: a review. Respirology. (2012) 17:887–98. doi: 10.1111/j.1440-1843.2012.02195.x
99. Huls A, Vanker A, Gray D, Koen N, MacIsaac JL, Lin DTS, et al. Genetic susceptibility to asthma increases the vulnerability to indoor air pollution. Eur Resp J. (2020) 55:19. doi: 10.1183/13993003.01831-2019
100. Ramsahai JM, Hansbro PM, Wark PAB. Mechanisms and management of asthma exacerbations. Am J Resp Crit Care Med. (2019) 199:423–32. doi: 10.1164/rccm.201810-1931CI
101. Silver JD, Sutherland MF, Johnston FH, Lampugnani ER, McCarthy MA, Jacobs SJ, et al. Seasonal asthma in Melbourne, Australia, and some observations on the occurrence of thunderstorm asthma and its predictability. PLoS ONE. (2018) 13:e0194929. doi: 10.1371/journal.pone.0194929
102. Erbas B, Jazayeri M, Lambert KA, Katelaris CH, Prendergast LA, Tham R, et al. Outdoor pollen is a trigger of child and adolescent asthma emergency department presentations: a systematic review and meta-analysis. Allergy. (2018) 73:1632–41. doi: 10.1111/all.13407
103. O'Hollaren MT, Yunginger JW, Offord KP, Somers MJ, O'Connell EJ, Ballard DJ, et al. Exposure to an aeroallergen as a possible precipitating factor in respiratory arrest in young patients with asthma. N Engl J Med. (1991) 324:359–63. doi: 10.1056/NEJM199102073240602
Keywords: air pollution, pneumonia, asthma, children, generalized additive model, time-series analysis
Citation: Zhou X, Guo M, Li Z, Yu X, Huang G, Li Z, Zhang X and Liu L (2023) Associations between air pollutant and pneumonia and asthma requiring hospitalization among children aged under 5 years in Ningbo, 2015–2017. Front. Public Health 10:1017105. doi: 10.3389/fpubh.2022.1017105
Received: 11 August 2022; Accepted: 27 December 2022;
Published: 25 January 2023.
Edited by:
Tao Liu, Jinan University, ChinaCopyright © 2023 Zhou, Guo, Li, Yu, Huang, Li, Zhang and Liu. This is an open-access article distributed under the terms of the Creative Commons Attribution License (CC BY). The use, distribution or reproduction in other forums is permitted, provided the original author(s) and the copyright owner(s) are credited and that the original publication in this journal is cited, in accordance with accepted academic practice. No use, distribution or reproduction is permitted which does not comply with these terms.
*Correspondence: Xiaohong Zhang,  zhangxiaohong0721@163.com; Liya Liu, 1443004737@qq.com