 Xiaoqing Li1†
 Qinjian Wang2†
 Chuanteng Feng2,3
 Bin Yu2,3Xi Lin1Yao Fu2Shu Dong2Ge Qiu4,5
 Darren How Jin Aik4,5Yanrong Yin1Pincang Xia6Shaofen Huang1Nian Liu2Xiuquan Lin1Yefa Zhang1
 Xin Fang1Wenling Zhong1*
 Peng Jia4,5*
 Shujuan Yang2,5*
- 1Department for Chronic and Noncommunicable Disease Control and Prevention, Fujian Provincial Center for Disease Control and Prevention, Fuzhou, China
- 2West China School of Public Health and West China Fourth Hospital, Sichuan University, Chengdu, China
- 3Institute for Disaster Management and Reconstruction, Sichuan University, Chengdu, China
- 4School of Resource and Environmental Sciences, Wuhan University, Wuhan, China
- 5International Institute of Spatial Lifecourse Health (ISLE), Wuhan University, Wuhan, China
- 6Department for HIV/AIDS and STDs Control and Prevention, Fujian Provincial Center for Disease Control and Prevention, Fuzhou, China
Background: Greenness exposure is beneficial to human health, but its potential mechanisms through which the risk for metabolic syndrome (MetS) could be reduced have been poorly studied. We aimed to estimate the greenness-MetS association in southeast China and investigate the independent and joint mediation effects of physical activity (PA), body mass index (BMI), and air pollutants on the association.
Methods: A cross-sectional study was conducted among the 38,288 adults based on the Fujian Behavior and Disease Surveillance (FBDS), established in 2018. MetS was defined as the presence of three or more of the five components: abdominal obesity, elevated triglyceride, reduced high-density lipoprotein cholesterol (HDL-C), high blood pressure, and elevated fasting glucose. The residential greenness exposure was measured as the 3-year mean values of the normalized difference vegetation index (NDVI) and enhanced vegetation index (EVI) within the 250, 500, and 1,000 meters (m) buffer zones around the residential address of each participant. Logistic regression models were used to estimate the greenness-MetS association. The causal mediation analysis was used to estimate the independent and joint mediation effects of PA, BMI, particulate matter with an aerodynamic diameter of 2.5 μm (PM2.5), particulate matter with an aerodynamic diameter ≤ 10 μm (PM10), nitrogen dioxide (NO2), and sulfur dioxide (SO2).
Results: Each interquartile range (IQR) increase in greenness was associated with a decrease of 13% (OR = 0.87 [95%CI: 0.83, 0.92] for NDVI500m and OR = 0.87 [95%CI: 0.82, 0.91] for EVI500m) in MetS risk after adjusting for covariates. This association was stronger in those aged < 60 years (e.g., OR = 0.86 [95%CI: 0.81, 0.92] for NDVI500m), males (e.g., OR = 0.73 [95%CI: 0.67, 0.80] for NDVI500m), having an educational level of primary school or above (OR = 0.81 [95%CI: 0.74, 0.89] for NDVI500m), married/cohabitation (OR = 0.86 [95%CI: 0.81, 0.91] for NDVI500m), businessman (OR = 0.82 [95%CI: 0.68, 0.99] for NDVI500m), other laborers (OR = 0.77 [95%CI: 0.68, 0.88] for NDVI500m), and non-smokers (OR = 0.77 [95%CI: 0.70, 0.85] for NDVI500m). The joint effect of all six mediators mediated about 48.1% and 44.6% of the total effect of NDVI500m and EVI500m on the MetS risk, respectively. Among them, BMI showed the strongest independent mediation effect (25.0% for NDVI500m), followed by NO2 and PM10.
Conclusion: Exposure to residential greenness was associated with a decreased risk for MetS. PA, BMI, and the four air pollutants jointly interpreted nearly half of the mediation effects on the greenness-MetS association.
Introduction
Metabolic syndrome (MetS) is considered a primary cause of death and disability globally, especially in low- and middle-income countries (LMICs) (1). MetS consists of interrelated risk factors of cardiovascular diseases (CVDs), including dysglycemia, raised blood pressure, elevated triglyceride levels, low high-density lipoprotein cholesterol levels, and obesity (particularly central adiposity) (2). People with MetS are at twice the risk of developing CVD over the next 5 to 10 years than those without MetS. The increasing evidence has suggested an array of risk factors of MetS, such as a low level of physical activity (PA), weight gain, and an unhealthy diet (3).
Emerging evidence is beginning to link the upstream determinants, such as environmental factors (e.g., air pollution and residential greenness), to interrelated risk factors of MetS. For example, air pollution has been associated with obesity (4), as a high concentration of air pollutants may lead to metabolic dysfunctions through increased oxidative stress and inflammations in adipose tissue (5), accumulations of hepatic lipid (6), and the reduction of glucose utilization in skeletal muscle (7). Air pollution may also increase the risk for other chronic diseases, such as cardiovascular disease, respiratory disease, and cancer, thus further indirectly affect body weight (8). Also, environment can affect the risk for MetS through influencing their behaviors. For example, poor air quality may prevent people from engaging in regular PA and encourage sedentary behavior (9), and a green and human attractive residential environment may promote walking and cycling (10–12), which can all change the level of risk factors of MetS. Therefore, environmental factors may also be crucial for MetS.
Accumulating evidence has suggested that greenness exposure could benefit human health, including providing more opportunities for PA and social activities, reducing feelings of stress, and mitigating exposure to air pollution (13, 14). These factors may have an independent or a combined effect on the pathogenesis of MetS. For example, a study in Liaoning Province of China has shown that only particulate matter with an aerodynamic diameter of ≤ 2.5 μm (PM2.5), nitrogen dioxide (NO2), and ozone (O3) mediated the association between greenness and MetS risk (15). At the same time, another study in the UK has shown that the greenness-MetS association may be mediated by PA and air pollution exposure (16). These existing studies have only examined the independent mediation effects of those potential mediators, which usually co-exist and may interact with one another to complicate their health effects. The multiple mediation analysis that investigates the joint effect may be of great significance to yield an accurate estimate (17). Hence, it is necessary to investigate the joint effect of those mediators between greenness exposure and MetS risk, which can better understand potential mechanisms underlying residential greenness and MetS risk.
Globally, China has the highest burden of CVDs and is facing a CVD crisis. Deaths from CVDs in China have nearly doubled in the past few decades, while rates are falling in other high-income countries (18). Hence, China has the most urgent need to study MetS for early CVD prevention (19). This study aimed to estimate the associations between long-term exposure to greenness and MetS risk in China and investigate the independent and joint mediation effects of air pollutants, PA, and body mass index (BMI) on the greenness-MetS association. The findings would serve as solid evidences for intervention design and policy-making to further reduce MetS risk.
Materials and methods
Study design and dataset
This study was based on the Fujian Behavior and Disease Surveillance (FBDS), a cross-sectional study investigating health-related behaviors and chronic diseases among adults in Fujian Province, China. The baseline dataset of the FBDS, investigated from June 2018 to December 2020, was used in this study.
A multi-stage, stratified cluster random sampling method was adopted to recruit FBDS participants from communities. The eight prefecture-level cities in Fujian Province were considered as the first sampling level. About 3–6 districts (urban) or counties (rural) were selected from each prefecture-level city. 4–6 urban subdistricts or rural townships were selected with probability proportional to size from each district/county. Then, 3–5 neighborhood communities or administrative villages were selected with probability proportional to size from each subdistrict/township. Subsequently, Each community or village was devided into several groups with the size of 50 households and 2 groups were randomly selected from each community or village. All 50 households in each group were clusterly sampled. Finally, one adult aged ≥ 18 years was selected from every household by a Kish selection table. The selected household that can not respond to all three attempts made on 3 days was replaced by another household with a similar family structure (e.g., nuclear family) in the same village or residential area. Medical staff in township health centers phoned and briefed prospective participants about the study and confirmed their eligibility to participate in the study.
The inclusion criteria for FBDS participants were (1) age ≥ 18 years on the day of the investigation; (2) permanent residents living in their current residence for at least 6 months, the capability of completing baseline surveys; and (3) complete questionnaire interviews, physical examinations, and blood tests. As for the exclusion criteria, they were (1) severe mental diseases (e.g., schizophrenia and bipolar disorder), and (2) unable to communicate with the interviewers. A total of 54,961 adults aged 18 years or older from 212 rural townships or urban subdistricts were invited to our survey. Upon arrival at the survey sites, participants who voluntarily decided to take part in the study were again informed about the study by the trained interviewers, and completed a written consent form. All participants received medical examinations and clinical laboratory tests (Supplementary Figure S1). In the current analysis, we excluded 16,673 individuals who had incomplete information on MetS and its components. Finally, a total of 38,288 adults were included in this study (Supplementary Figure S2).
The Ethical Review Board of the Fujian Provincial Center for Disease Control and Prevention reviewed and approved the study protocol (2018001).
Outcome variables
The MetS was assessed according to the criteria for diagnosis by the National Heart, Lung, and Blood Institute, American Heart Association, World Heart Federation, International Atherosclerosis Society, and International Association for the Study of Obesity in 2009 (2). It was defined as the presence of three or more of the following five components: (1) abdominal obesity, described as waist circumference ≥ 90 cm for men and ≥ 85 cm for women (20); (2) elevated triglyceride, defined as a fasting triglyceride level ≥ 1.7 mmol/L (150 mg/dL) or the reported receipt of elevated triglyceride medication (21); (3) reduced high-density lipoprotein cholesterol (HDL-C), referring to a level < 1.03 mmol/L (<40 mg/dL) in men and 1.29 mmol/L (<50 mg/dL) in women, or the reported receipt of reduced HDL-C medication (21); (4) high blood pressure, referring to systolic 130 or diastolic 85 mmHg or any use of antihypertensive medication; and (5) elevated fasting glucose, defined as a fasting plasma glucose ≥ 5.6 mmol/L or the reported receipt of glucose-lowering medication (22).
Exposure variables
Residential greenness was measured by the satellite-based normalized difference vegetation index (NDVI) and enhanced vegetation index (EVI), derived from satellite imagery. Both vegetation indices were derived from the MOD13Q1.061 Terra Vegetation Indices 16-Day Global 250 m SIN Grid, computed at a spatial resolution of 250 m by surface reflectance from the Moderate-resolution Imaging Spectroradiometer (MODIS) satellite images of the National Aeronautics and Space Administration's (NASA) (23). NDVI is calculated based on satellite sensors' red and near-infrared bands (24–26). EVI is calculated similarly to NDVI but takes an additional blue light band to correct the atmospheric and soil background for enhanced accuracy. Hence, EVI has been considered more sensitive than NDVI in high-biomass areas (24–26). Both NDVI and EVI values range from −1 to 1, where higher positive value indicates a higher coverage of greenness; in contrast, negative values represent other features with high surface reflectance, such as clouds, water, and snow. We processed and analyzed Landsat 8 Thematic Mapper satellite images with a minimum of cloud cover for generating NDVI/EVI. We defined residential greenness as the annual mean NDVI/EVI during 2016–2018 (the 3 years before the survey) within the 250, 500, and 1,000 m buffer zones around the residential address of each participant, for easier comparison with similar studies (27, 28). The 500 m radius of the buffer zone has been widely used in many similar studies to measure residential greenness (29), so the results from the 500 m buffer zone were presented as the main results.
Mediators
We identified common potential confounding variables between greenness exposure and MetS risk from the available literature, and incorporated them in a directed acyclic graph (DAG) to select a minimal set of covariates (30). PA, BMI, and air pollution exposure appeared in the DAG as mediators between greenness and MetS (Supplementary Figure S3), as shown in the previous literature (15, 16, 31, 32). PA was measured by the days of conducting physical activity per week. BMI was calculated as one's body weight (kg) divided by the squared height (m2). The exposures to PM2.5, PM10, NO2, and sulfur dioxide (SO2) were calculated as the mean concentrations over the residential address of each participant during the 3 years before the survey. The concentration of the air pollutants was estimated at a 1-km spatial resolution by random forest models, on the basis of the observation data from 1,480 on-ground monitoring stations, satellite data, meteorological factors (temperature and humidity), land use information, and other spatial and temporal predictors (33). A 10-fold cross-validation process was performed to assess the validity of the predictions for PM2.5 (the overall adjusted R2 = 0.84, the Root Mean Square Error = 9.24), PM10 (0.77, 18.91), NO2 (0.79, 4.94), and SO2 (0.70, 3.67).
Covariates
According to the DAG (Supplementary Figure S3), three major groups of covariates were controlled for in this study, including sociodemographic characteristics, lifestyle habits, and environmental factors. The sociodemographic characteristics included age (year), sex (male or female), ethnicity (Han or minority), and educational level (little or no formal education, primary school, junior or high school, or bachelor's degree or above). Additionally, marriage status (married/cohabitation, unmarried, or widowed/divorced/separated), occupation (unemployed, farmer, businessman, administrative staff, student, or other laborers), insurance type (commercial insurance, non-commercial insurance, or no insurance), and residential location (urban or rural) were chosen. Lifestyle habits included smoking status (non-smokers, or current or former smokers), second-hand smoking (no or yes), alcohol drinking status (non-drinkers, or current or former drinkers), and dietary habits (days per month for grains, vegetables, meat, fruits, aquatic products, and milk). As for the environmental factors, temperature (°C) and humidity (%) were selected. Subsequently, the annual temperature and humidity over the participants' residential addresses for the three years before the survey were averaged; this data was obtained from the China Meteorological Administration (34).
Statistical analyses
The primary characteristics of the participants were summarized by proportions or means with standard deviations (SD). We used logistic regression models to assess the associations between long-term exposure to greenness and MetS and its related indexes. The results are presented as odds ratios (ORs) with corresponding 95% confidence intervals (CIs) for each interquartile range (IQR) increment in NDVI and EVI after adjusting for covariates. To assess the robustness of our results, we conducted the following sensitivity analyses: (1) estimating the association between greenness exposure and MetS risk at the buffer areas of 250 and 1,000 m; (2) fitting the adjusted model using the one to three years average greenness value to test the robustness of the effect estimations.
We also performed a stratified analysis. It was categorized by age, sex, ethnicity, educational level, marriage status, occupation, insurance type, drinking status, smoking status, and residence to examine the associations across different sub-populations. Subsequently, the interaction between stratified factors and greeness exposure were performed and presented as a cross-product term in the regression model (i.e., NDVI * age or NDVI * sex or NDVI * ethnicity).
Based on the DAG, PA, BMI, PM2.5, PM10, NO2, and SO2 were considered the mediators in the association between greenness exposure and MetS, and their independent and combined mediation effects were examined by causal mediation analysis (17, 35). Individual effects were tested by including each mediator separately in the full model, while for the joint effect of multiple mediators, a set of mediators (PA, BMI, PM2.5, PM10, NO2, and SO2) was included jointly in the full model, regardless of order. Mediation analysis, based on the counterfactual view, was a regression-based multiple mediation approach to considering multiple mediators simultaneously, which can also be adapted to situations within which mediators interact with one another (17, 35, 36). In this approach, we used regression models including residential greenness, PA, BMI, PM2.5, PM10, NO2 and SO2, and covariates. Next, we used six ordinal logistic regressions to regress PA, BMI, PM2.5, PM10, NO2, and SO2 on residential greenness and covariates (37, 38). These analyses were performed using the function “CMA verse”, implemented in the R package (35). The total effect can be decomposed into direct (not through mediators) and indirect/mediation effects (through mediators). Finally, for each mediator and the joint six mediators, we calculated the indirect/mediation effect percentage over the total impact. The standard errors of the mediation effect was estimated by generating 5000 bootstrap iterations.
The DAG was constructed in DAGitty (v3.0). All statistical analyses were analyzed in R Foundation for Statistical Computing (version 4.0.3). We had set the significance threshold to 0.05, and all analysis tests were 2-sided.
Results
Baseline characteristics
The study participants' average (SD) age was 53.63 (13.65) years, and 52.77% were women. The majority of participants were of Han ethnicity (98.51%), unemployed and farmer (62.07%), and had an educational level below primary school (80.03%) (Table 1). Those participants who were females, elderly, widowed/divorced/separated, and rural residents, had lower educational level, a habit of never smoking and alcohol drinking, higher BMI, and a lower intake of cereal, vegetables, meat, fruits, aquatic products, and milk, and exercise less regularly were more likely to have MetS (all P-value<0.05). The mean (SD) of the 3-year average air pollution concentrations were 29.11 μg/m3 (2.66 μg/m3), 51.86 μg/m3 (5.82 μg/m3), 21.35 μg/m3 (2.89 μg/m3), and 8.96 μg/m3 (1.76 μg/m3) for PM2.5, PM10, NO2, and SO2, respectively.
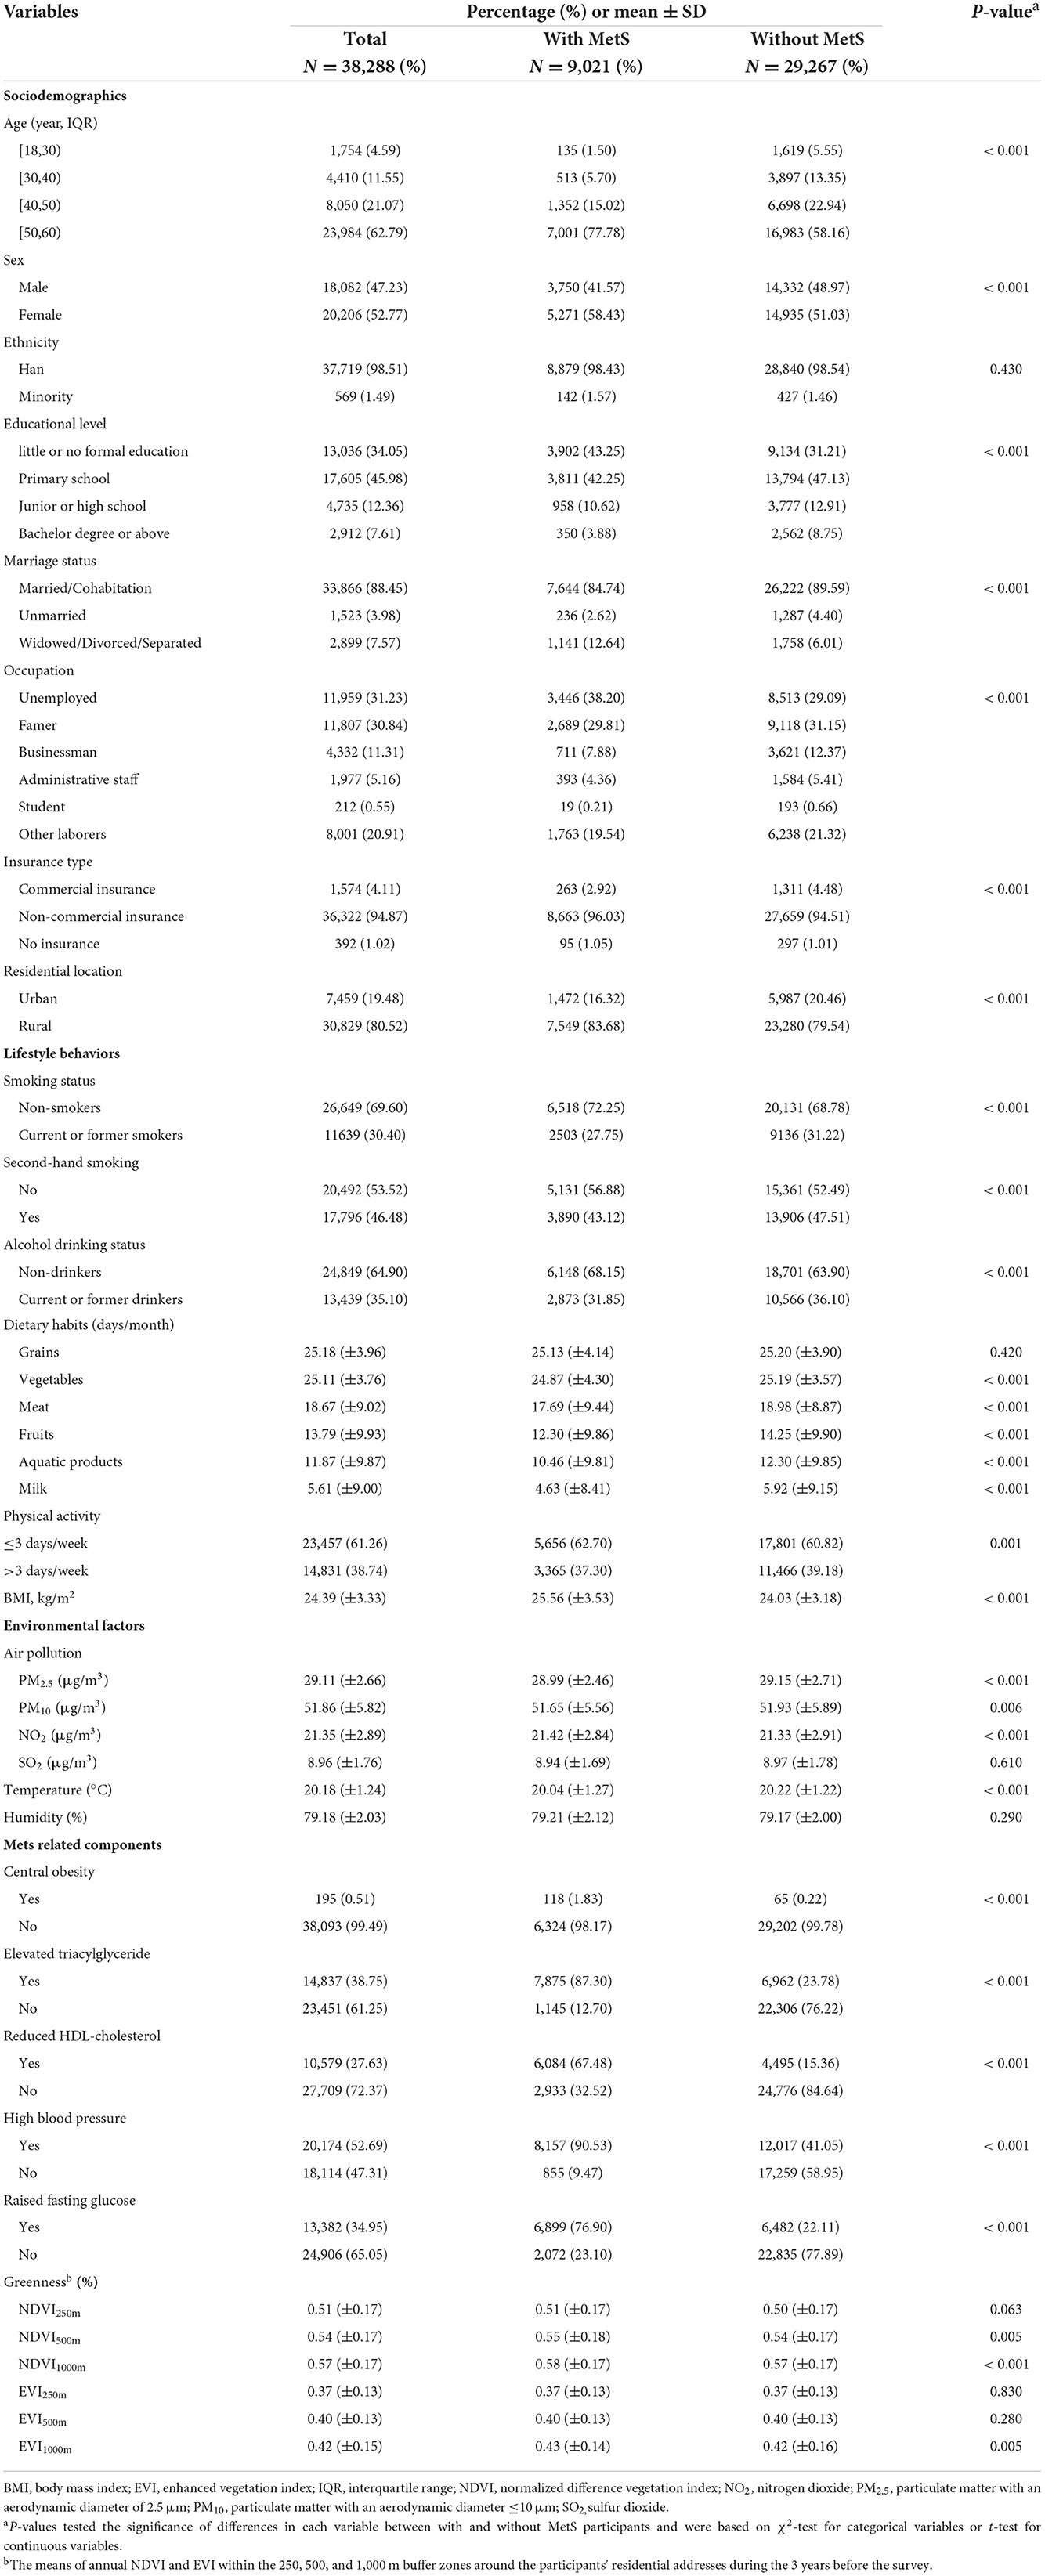
Table 1. Characteristics of the study participants.
Moreover, there was spatial heterogeneity in levels of greenness exposure among the study communities (Figure 1). For example, the range of the NDVI500m and EVI500m were 0.16–0.90 and 0.11–0.73, respectively. Hence, the NDVI and EVI values were highly correlated, with r2 ranging from 0.86 to 0.97 (Supplementary Figure S4).
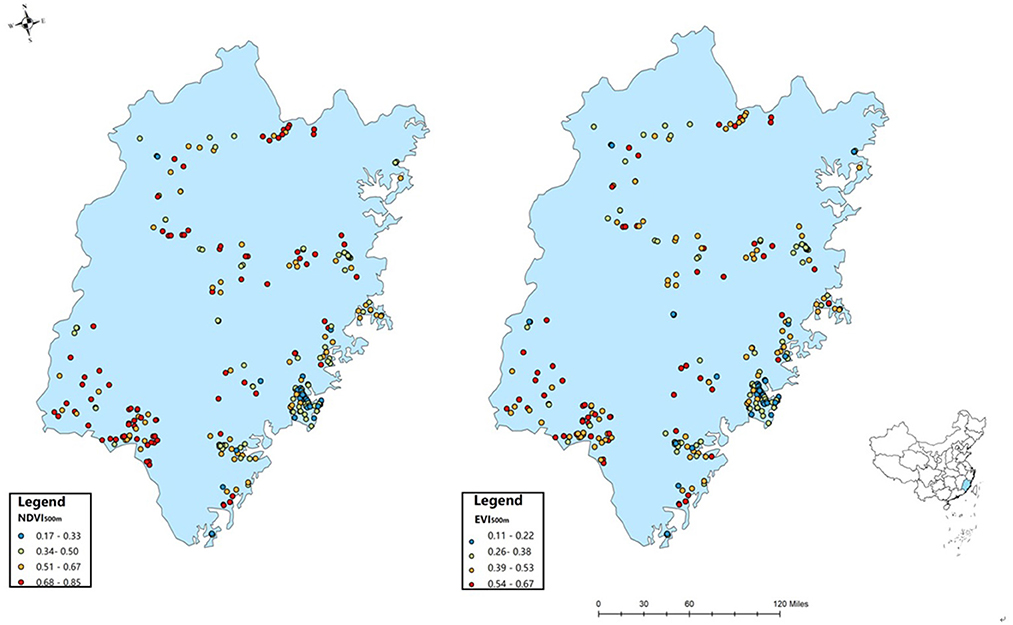
Figure 1. Residential greenness exposure and location of the study area on the map of China. NDI, normalized difference vegetation index; EVI, enhanced vegetation index.
Greenness exposure and MetS risk
In the crude model, higher greenness exposure at NDVI500m and EVI500m was significantly associated with a higher risk of MetS (Table 2). However, when adjusted to our covariates model, each IQR increase in NDVI500m and EVI500m was associated with a 13% reduced risk of MetS after adjusting for covariates (NDVI500m: OR = 0.87 [95% CI: 0.83, 0.92]; EVI500m: OR = 0.87 [0.82, 0.91]), respectively (Table 2).
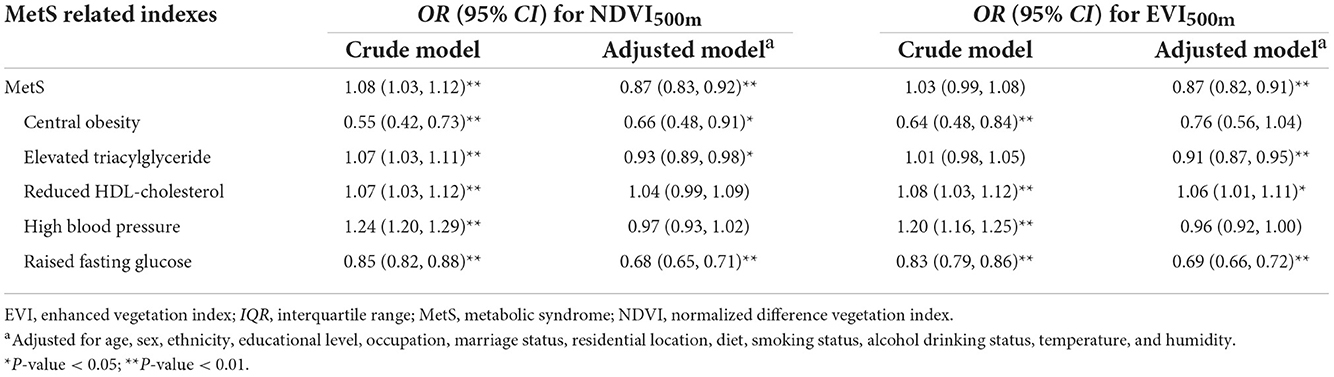
Table 2. Associations of each IQR increase residential greenness exposure in NDVI500m and EVI500m with the MetS risk.
We observed that each IQR increase in NDVI500m was associated with a decreased risk for central obesity (OR = 0.66 [0.48, 0.91]), elevated triacylglyceride (OR = 0.93 [0.89, 0.98]) and raised fasting glucose (OR = 0.68 [0.65, 0.71]). While, an reduced risk of elevated triacylglyceride (OR = 0.91 [0.87, 0.95]) and raised fasting glucose (OR = 0.69 [0.66, 0.72]) was observed for EVI500m. However, we found an increased risk of reduced HDL-cholesterol (OR = 1.06 [1.01, 1.11]) for EVI500m (Table 2).
Each IQR increase in EVI and NDVI at the buffer areas of 250m and 1,000m significantly reduced the MetS risk (NDVI250m: OR = 0.89 [0.84, 0.93]; EVI250m: OR = 0.88 [0.84, 0.92]; NDVI1000m: OR = 0.89 [0.84, 0.94]; EVI1000m: OR = 0.89 [0.85, 0.94]), and the results were similar with EVI at the buffer of 500 m (Supplementary Tables S1, S2). Moreover, the annual mean of greenness exposure over the past 1-, 2- and 3-years showed the robust effect estimates for MetS risk (Supplementary Table S3).
In stratified analysis, stronger associations between greenness exposure in NDVI500m and EVI500m and MetS risk were observed in young, male, having an educational level of primary school or above, married/cohabitation, businessman and non-smokers subgroups. For example, those aged <60 years (NDVI500m: OR = 0.86 [0.81, 0.92]; EVI500m: OR = 0.85 [0.79, 0.90]), males (NDVI500m: OR = 0.73 [0.67, 0.80]; EVI500m: OR = 0.74 [0.68, 0.81]), those with an educational level of primary school or above (NDVI500m: OR = 0.81 [0.74, 0.89]; EVI500m: OR = 0.84 [0.76, 0.92]), married/cohabitation participants (NDVI500m: OR = 0.86 [0.81, 0.91]; EVI500m: OR = 0.86 [0.81, 0.90]), businessman (NDVI500m: OR = 0.82 [0.68, 0.99]; EVI500m: OR = 0.83 [0.69, 0.99]), other laborers (NDVI500m: OR = 0.77 [0.68, 0.88]; EVI500m: OR = 0.80 [0.71, 0.91]), and non-smokers (NDVI500m: OR = 0.77 [0.70, 0.85]; EVI500m: OR = 0.77 [0.70, 0.85]) showed stronger associations (Table 3).
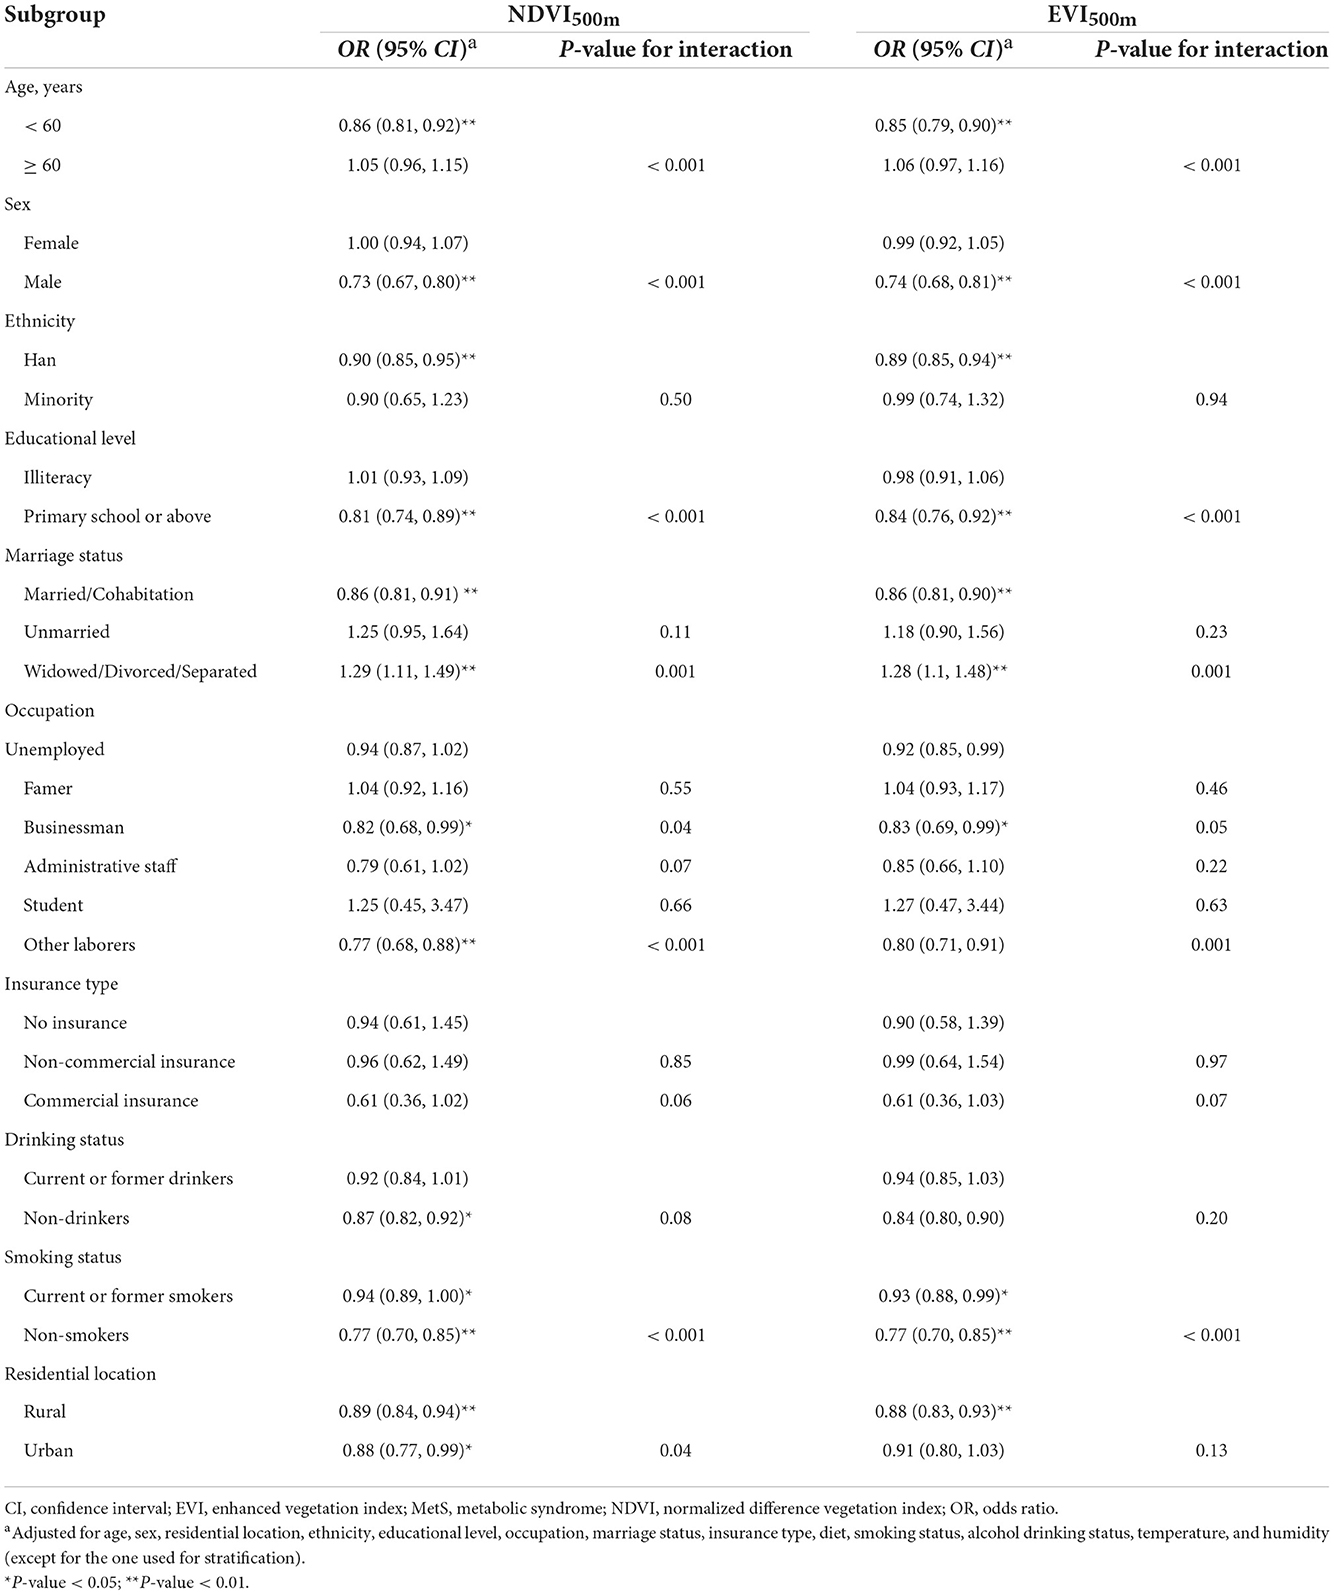
Table 3. Associations between residential greenness exposure and MetS risk stratified by potential modifiers.
Pathways between greenness exposure and MetS risk
The joint effect of PM2.5, PM10, NO2, SO2, PA, and BMI mediated 48.10% and 44.61% of the total effect of NDVI500m and EVI500m on the MetS risk, respectively. Moreover, the independent mediation analysis showed that PM10 (accounting for 22.04% of the total effect), NO2 (24.12%), and BMI (24.97%) significantly mediated the association between NDVI500m and MetS risk. The most substantial mediation effect was observed in BMI (24.97%). A similar mediation effect was observed for PM10, NO2, and BMI on the association of EVI500m with MetS risk (PM10, NO2, and BMI accounting for 20.90%, 21.89%, and 25.60% of the total effect, respectively) (Table 4).
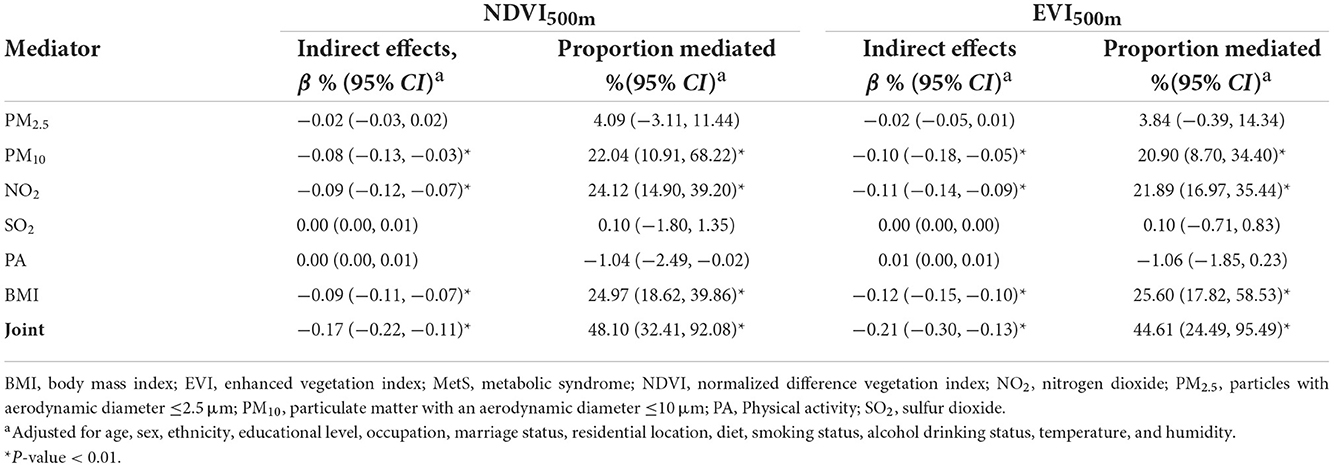
Table 4. Mediation of associations between residential NDVI500m and EVI500m and MetS riska.
Discussion
Our study found that long-term exposure to residential greenness was associated with the risk for MetS, and the associations were independently mediated by PM10, NO2, and BMI. The joint mediation effect of PM2.5, PM10, NO2, SO2, PA, and BMI was as high as 48.10% and 44.61% of the total effect of NDVI500m and EVI500m on the MetS risk, respectively. The findings provided substantial evidence on the effects of residential greenness and its medicated mechanism on the MetS risk. This evidence would raise attention to neighborhood greenness for reducing the chronic disease burden in China.
We observed the negative association between residential greenness exposure and the MetS risk in this study. To the best of our knowledge, two previous studies explored the relationship between long-term exposure to greenness and the incidence or prevalence of MetS, but their results were inconsistent (15, 39). For example, a cross-sectional study indicated a beneficial association between residential greenness and MetS in the Chinese urban population (15). However, another study using multi-exposure models showed that greenness exposure was inverse but non-significant associated with prevalent and incident MetS (39). We observed an inverse association between greenness exposure and risk of MetS with adjustment for all covariates, including demographic characteristics, lifestyle, and environmental factors. This relationship showed that the lack of adjustments for these covariates may underestimate the association. Therefore, applying our findings to other study areas or populations would solely depend on the correlation between residential greenness, demographic characteristics, and lifestyle factors. However, our findings suggested a positive association of EVI500m with reduced HDL-cholesterol, which was inconsistent with a previous study that greenness had a negative association with reduced HDL-cholesterol (39, 40). The possible reason may be explained by the cross-sectional study design, and high disparities across the different populations. Further prospective studies are needed to explore the association between greenness exposure and blood lipid levels.
Air pollutants and BMI significantly mediated the association between residential greenness exposure and MetS risk. There are several proposed hypotheses for the beneficial effects of greenness exposure. First, exposure to higher concentrations of air pollutants, such as PM2.5, PM10, NO2, and SO2, was associated with an elevated risk of MetS. Greenness exposure could attenuate the adverse effect of air pollution exposure by removing particulate matter and carbon monoxide (41, 42). Our study found that the PM10 and NO2 could mediate about 20.90%–24.12% of the association between NDVI500m / EVI500m and MetS risk. In contrast, we did not find a significant mediation effect between PM2.5 and SO2. A possible explanation is that PM10 and NO2 in our study site were more serious, while the concentration of PM2.5 and SO2 may be relatively low (43). Besides, PM10 has a larger particle size and concentration than PM2.5, PM10 is more likely to be dry deposited on vegetation surfaces through gravity sedimentation. Once particles are impacted onto the vegetation surface, some particulates could be washed away by rain and transferred to the soil, re-suspended in the atmosphere by wind, or fall to the ground with leaves and branches (44, 45). Thus, plants may absorb more PM10 than PM2.5. One previous study also reported similarities, indicating that only PM10, NO2, and O3 had mediating effects (15). Second, BMI is a leading risk factor for MetS (31), and high community greenness exposure is reported to be associated with reduced obesity risk (46). People living with high greenness exposure are more likely to participate in regular physical activity and be associated with lower BMI (47). A previous study in China showed that physical activity could mediate about 50% of the association between NDVI and hypertension (48). In hindsight, our study found that BMI mediated the association but not PA. Therefore, participants with a history of MetS-related components would have a modified physical activity pattern as a non-pharmacological intervention; and their BMI would change slower. Another possible explanation is that BMI was calculated by objective measurements, whereas PA was self-reported by participants, which may induce recall bias. Besides, these mediators may interact with each other and have a role in human health. Our results by multiple mediation analysis indicated that the joint mediation effect of PM2.5, PM10, NO2, SO2, PA, and BMI could explain almost half of the association. The sensitivity analysis demonstrated that these associations were stable.
In subgroup analysis, we observed that the association between greenness exposure and MetS risk was more substantial in males, participants aged < 60 years, those without smoking habits, an educational level of primary school or above, and being married/cohabitation, other laborers, and businessman. A previous study has also explored the age-specific effects of greenness on MetS, indicating that participants aged < 65 years had a more substantial effect estimate (46). Perhaps, younger adults are more likely to use the outdoor green space than older people and can benefit more from greenness exposure. The sex-related biological (e.g., sex hormones and immune and inflammation responses), occupational (e.g., outdoor physical activity), and lifestyle factors (e.g., smoking and drinking habits) may result in sex disparities in the greenness exposure effect (49). Married, better-educated people and businessmen usually have more social support and social resources, and are able to live in communities with better environments and thus benefit more from greenness exposure (44). In addition, the association of non-smoking habits with more healthy lifestyle habits, including greenness in residential environments, can be said to link and influence one another.
To our knowledge, this study has at least two major strengths. First, the stratified cluster random sampling method adopted in this study better represents the heterogeneity of population and environmental exposure. It would also increase the generalizability of our findings. Second, both single and multiple mediation analyses were used to estimate the indirect effects of the selected mediators. This combination of mediation analyses led to the sufficient statistical power to detect modest effects and help deeply understand the potential mechanisms underlying the association between residential greenness and the MetS risk.
There are several avenues for potential improvement or further exploration of this study. First, as the MetS were only measured once, our research design could not fully reveal a causal relationship between long-term residential greenness exposure and MetS risk. However, the estimation of greenness exposure was the average exposure level for the past three years, which reduced the chance of reverse causality. Second, although we employed EVI and NDVI as proxies of the overall level of residential greenness, there are limitations in information quality and accuracy given the nature of the satellite imagery data. Moreover, the satellite-derived information of urban greenness might not fully capture all pathways through which humans experience nature. More could be done in the future when other micro-level environmental auditing approaches became available, and a follow-up analysis of the eye-level based visibility of greenness could be done to enhance and validate the current work. Lastly, the health effect of residential greenness exposure may vary depending on daily time-activity patterns. However, these unmeasured activity patterns may affect the effect estimates. Hence, we suggest that wearable devices, such as a smartwatch, be used in a nested small sample of our study. This move would precisely measure daily time-activity patterns and, thus, help further calibrate individual exposures at the population level.
Conclusions
This large-scale epidemiological study provides a better understanding of the impact of residential greenness exposure on MetS risk among adults in southeastern China. Such impact was found to be especially apparent in young adults, males, and those without smoking habits. PM10, NO2, and BMI mediated the association between residential greenness exposure and MetS, and the joint mediation effect of PM2.5, PM10, NO2, SO2, PA, and BMI may explain almost half of the association.
This study has highlighted the importance of residential greenness exposure to reduce the MetS risk and thereby the potential for use as a framework for improving public health in urban areas. Multiple stakeholders, such as policymakers, researchers, and urban planners, can benefit from the findings of this study. The evidence would serve for the optimization of environmental protection policies and the development of healthier cities.
We suggest that human health outcomes should be incorporated into the goals of green space related urban design, planning, and policy-making. Our study makes the connection between urban greenness and health outcomes more visible, which will facilitate and encourage collaborations across different sectors, including epidemiology, public health, urban planning, and municipal and civil engineering. The results of the current study will further safeguard green spaces in the city as an important asset for supporting health and wellbeing. It will also facilitate healthier urban design and development in the future and thereby getting a true long-term legacy.
Data availability statement
The original contributions presented in the study are included in the article/Supplementary material, further inquiries can be directed to the corresponding authors.
Ethics statement
The Ethical Review Board of the Fujian Provincial Center for Disease Control and Prevention reviewed and approved the study protocol (2018001). The participants provided their written informed consent to participate in this study.
Author contributions
XiaL, QW, and SY was responsible for data cleaning. WZ and XiaL was responsible for obtaining funding. SY, WZ, PJ, and XiaL were responsible for study design. SY contributed in revision. PJ, XiaL, QW, and SY were responsible for manuscript preparation. QW, SY, WZ, PJ, and XiaL were responsible for methodology. PX, CF, BY, YF, SD, GQ, DJ, XiaL, QW, SY, and NL were responsible for data cleaning. XiL, YY, SH, XiuL, YZ, WZ, XiaL, and XF were responsible for data collection. All authors contributed to the article and approved the submitted version.
Funding
This study was funded by the Fujian Provincial Health Technology Project (2021GGA035), the National Natural Science Foundation of China (42271433), the Fujian Province Pilot Project (2020Y0060), the Regional Innovation Cooperation Program of Science and Technology Commission Foundation of Sichuan Province (2021YFQ0031 and 2021-YF05-00886-SN), the Sichuan University-Dazhou Cooperation Project (2020CDDZ-26-SCU), the Fujian Provincial Scientific and Technological Innovation Platform (2019Y2001), and the Wuhan University Specific Fund for Major School-level Internationalization Initiatives (WHU-GJZDZX-PT07).
Acknowledgments
The authors thank the support from the International Institute of Spatial Lifecourse Health (ISLE).
Conflict of interest
The authors declare that the research was conducted in the absence of any commercial or financial relationships that could be construed as a potential conflict of interest.
Publisher's note
All claims expressed in this article are solely those of the authors and do not necessarily represent those of their affiliated organizations, or those of the publisher, the editors and the reviewers. Any product that may be evaluated in this article, or claim that may be made by its manufacturer, is not guaranteed or endorsed by the publisher.
Supplementary material
The Supplementary Material for this article can be found online at: https://www.frontiersin.org/articles/10.3389/fpubh.2022.1014380/full#supplementary-material
References
1. Cardiovascular disease chronic chronic kidney disease and diabetes mortality burden of cardiometabolic risk factors from 1980 to 2010. a comparative risk assessment. Lancet Diabetes Endocrinol. (2014) 2:634–47. doi: 10.1016/S2213-8587(14)70102-0
2. Alberti KG, Eckel RH, Grundy SM, Zimmet PZ, Cleeman JI, Donato KA, et al. Harmonizing the metabolic syndrome. A joint interim statement of the International Diabetes Federation Task Force on Epidemiology and Prevention; National Heart, Lung, and Blood Institute; American Heart Association; World Heart Federation; International Atherosclerosis Society; and International Association for the Study of Obesity. Circulation. (2009) 120:1640–5. doi: 10.1161/CIRCULATIONAHA.109.192644
3. Krist AH, Davidson KW, Mangione CM, Barry MJ, Cabana M, Caughey AB, et al. behavioral counseling interventions to promote a healthy diet and physical activity for cardiovascular disease prevention in adults with cardiovascular risk factors. US preventive services task force recommendation statement. JAMA. (2020) 324:2069–75. doi: 10.1001/jama.2020.21749
4. Liu M, Tang W, Zhang Y, Wang Y, Baima K, Li Y, et al. Urban-rural differences in the association between long-term exposure to ambient air pollution and obesity in China. Environ Res. (2021) 201:111597. doi: 10.1016/j.envres.2021.111597
5. Kang J, Cheng Y, Jin Y, Hou Y. Environmental hazard factors for respiratory tract and eye symptoms of women in Ankang rural, Shanxi Province. Wei Sheng Yan Jiu. (2011) 40:345–7.
6. Svensson PA, Gummesson A, Carlsson LMS, Sjöholm K. Changes in human adipose tissue gene expression during diet-induced weight loss. World Rev Nutr Diet. (2010) 101:103–114. doi: 10.1159/000314515
7. Toledo-Corral CM, Alderete TL, Habre R, Berhane K, Lurmann FW, Weigensberg MJ, et al. Effects of air pollution exposure on glucose metabolism in Los Angeles minority children. Pediatr Obes. (2018) 13:54–62. doi: 10.1111/ijpo.12188
8. Venkatesan P. WHO report: air pollution is a major threat to health. Lancet Respir Med. (2016) 4:351. doi: 10.1016/s2213-2600(16)30014-5
9. Roberts JD, Voss JD, Knight B. The association of ambient air pollution and physical inactivity in the United States. PLoS ONE. (2014) 9:e90143. eng. Epub 2014/03/07. doi: 10.1371/journal.pone.0090143
10. Markevych I, Schoierer J, Hartig T, Chudnovsky A, Hystad P, Dzhambov AM, et al. Exploring pathways linking greenspace to health. theoretical and methodological guidance. Environ Res. (2017) 158:301–17. doi: 10.1016/j.envres.2017.06.028
11. de Keijzer C, Tonne C, Sabia S, Basagaña X, Valentín A, et al. Green and blue spaces and physical functioning in older adults. longitudinal analyses of the Whitehall II study Environ Int. (2019) 122:346–56. doi: 10.1016/j.envint.2018.11.046
12. Rook GA. Regulation of the immune system by biodiversity from the natural environment. an ecosystem service essential to health. Proc Natl Acad Sci U S A. (2013) 110:18360–7. doi: 10.1073/pnas.1313731110
13. Kumar P, Druckman A, Gallagher J, Gatersleben B, Allison S, Eisenman TS, et al. The nexus between air pollution, green infrastructure and human health. Environ Int. (2019) 133(Pt A):105181. doi: 10.1016/j.envint.2019.105181
14. Liu XX, Ma XL, Huang WZ, Luo YN, He CJ, Zhong XM, et al. Green space and cardiovascular disease. a systematic review with meta-analysis. Environ Pollut. (2022) 301:118990. doi: 10.1016/j.envpol.2022.118990
15. Yang BY, Liu KK, Markevych I, Knibbs LD, Bloom MS, Dharmage SC, et al. Association between residential greenness and metabolic syndrome in Chinese adults. Environ Int. (2020) 135:105388. doi: 10.1016/j.envint.2019.105388
16. de Keijzer C, Basagaña X, Tonne C, Valentín A, Alonso J, Antó JM, et al. Long-term exposure to greenspace and metabolic syndrome. a Whitehall II study. Environ Pollut. (2019) 255(Pt 2):113231. doi: 10.1016/j.envpol.2019.113231
17. VanderWeele TJ, Vansteelandt S. Mediation analysis with multiple mediators. Epidemiol Method. (2014) 2:95–115. doi: 10.1515/em-2012-0010
18. Li JJ, Liu HH Li S. Landscape of cardiometabolic risk factors in Chinese population. a narrative review. Cardiovasc Diabetol. (2022) 21:113. doi: 10.1186/s12933-022-01551-3
19. IHME. Global Burden of Disease Study 2019 (GBD 2019) Results. Global Burden of Disease Collaborative Network. New York, NY: Institute for Health Metrics and Evaluation (2019). Available online at: https://vizhub.healthdata.org/gbd-compare
20. Endocrinology CSo. Expert consensus on integrated management of type 2 diabetes mellitus complicated with obesity in China. Chin J Diabetes. (2016) 32:623–7. doi: 10.3969/j.issn.1672-2809.2016.17.001
21. Alberti KG, Zimmet P, Shaw J. Metabolic syndrome–a new world-wide definition. a consensus statement from the international diabetes federation. Diabet Med. (2006) 23:469–80. doi: 10.1111/j.1464-5491.2006.01858.x
22. Diagnosis and classification of diabetes mellitus. Diabetes Care. (2013) 36(Suppl. 1):S67–74. doi: 10.2337/dc13-S067
23. K. D. MOD13Q1—MODIS/Terra Vegetation Indices 16-Day L3 Global 250m Sin Grid v006. Sioux Falls, SD. NASA EOSDIS Land Processes DAAC. (2015). doi: 10.5067/MODIS/MOD13Q1.006
24. Matsushita B, Yang W, Chen J, Onda Y, Qiu G. Sensitivity of the Enhanced Vegetation Index (EVI) and Normalized Difference Vegetation Index (NDVI) to topographic effects. A case study in high-density cypress forest. Sensors. (2007) 7:2636–51. doi: 10.3390/s7112636
25. Guimaraes RJPS, Freitas CC, Dutra LV, Scholte RGC, Amaral RS, et al. Evaluation of a linear spectral mixture model and vegetation indices (NDVI and EVI) in a study of schistosomiasis mansoni and Biomphalaria glabrata distribution in the state of Minas Gerais, Brazil. Mem Inst Oswaldo Cruz. (2010) 105:512–8. doi: 10.1590/S0074-02762010000400028
26. Tsalyuk M, Kelly M, Getz WM. Improving the prediction of African savanna vegetation variables using time series of MODIS products. Isprs J Photogram Remote Sens. (2017) 131:77–91. doi: 10.1016/j.isprsjprs.2017.07.012
27. Dong X, Tu R, Zhang L, Abdulai T, Liu X, Li R, et al. Residential greenness and atherosclerotic cardiovascular disease risk in a rural Chinese adult population. Ecotoxicol Environ Saf. (2021) 222:112458. doi: 10.1016/j.ecoenv.2021.112458
28. Jiang J, Mao S, Xie Y, Chen X, Abulaiti K, Liu M, et al. Is residential greenness associated with dyslipidemia and lipid levels in Chinese rural-dwelling adults? The Henan rural cohort study. Environ Sci Pollut Res Int. (2022) 29:5852–62. doi: 10.1007/s11356-021-16026-3
29. Kua KP, Lee S. The influence of residential greenness on mortality in the Asia-Pacific region. a systematic review and meta-analysis. Perspect Public Health. (2021) 141:342–53. doi: 10.1177/17579139211011496
30. Greenland S, Pearl J, Robins JM. Causal diagrams for epidemiologic research. Epidemiology. (1999) 10:37–48. doi: 10.1097/00001648-199901000-00008
31. Lee J, Lee H. Effects of risk factor numbers on the development of the metabolic syndrome. J Exer Rehabi. (2020) 16:183–8. doi: 10.12965/jer.2040202.101
32. Xiao X, Wang RY, Knibbs LD, Jalaludin B, Heinrich J, Markevych I, et al. Street view greenness is associated with lower risk of obesity in adults. Findings from the 33 Chinese community health study. Environ Res. (2021) 200:434. doi: 10.1016/j.envres.2021.111434
33. Yang S, Liang X, Dou Q, La Y, Cai J, Yang J, et al. Ethnic disparities in the association between ambient air pollution and risk for cardiometabolic abnormalities in China. Sci Total Environ. (2022) 838(Pt 1):155940. doi: 10.1016/j.scitotenv.2022.155940
34. Bureau SS. China Statistical Yearbook 2015, 2016, 2017, 2018. Beijing: Chinese Statistical Press (2015–2018).
35. Shi BY, Choirat C, Coull BA, VanderWeele TJ, Valeri L. CMAverse. A suite of functions for reproducible causal mediation analyses. Epidemiology. (2021) 32:E20–2. doi: 10.1097/EDE.0000000000001378
36. Bellavia A, Valeri L. Decomposition of the total effect in the presence of multiple mediators and interactions. Am J Epidemiol. (2018) 187:1311–8. doi: 10.1093/aje/kwx355
37. Jérolon A, Baglietto L, Birmelé E, Alarcon F, Perduca V. Causal mediation analysis in presence of multiple mediators uncausally related. Int J Biostat. (2020) 17:191–221. doi: 10.1515/ijb-2019-0088
38. Fu JZ, Liu Q, Zhu Y, Sun CQ, Duan HL, Huang L, et al. Circulating folate concentrations and the risk of mild cognitive impairment. A prospective study on the older Chinese population without folic acid fortification. Eur J Neurol. (2022) 29:2913–24. doi: 10.1111/ene.15474
39. Voss S, Schneider A, Huth C, Wolf K, Markevych I, Schwettmann L, et al. ENVINT-D-20-01309. Long-term exposure to air pollution, road traffic noise, residential greenness, and prevalent and incident metabolic syndrome results from the population-based KORA F4/FF4 cohort in Augsburg, Germany. Environ Int. (2021) 147:106364. doi: 10.1016/j.envint.2020.106364
40. Fan S, Yang BY, Xue Z, Huang WZ, Zhou Z, Yuan J, et al. Associations between residential greenness and blood lipids in Chinese Uyghur adults. Environ Int. (2020) 142:105903. doi: 10.1016/j.envint.2020.105903
41. Diener A, Mudu P. How can vegetation protect us from air pollution? A critical review on green spaces' mitigation abilities for air-borne particles from a public health perspective - with implications for urban planning. Sci Total Environ. (2021) 796:148605. doi: 10.1016/j.scitotenv.2021.148605
42. Aly SH, Zakaria R, Kondorura CF, Iop. The capability of green open space in absorbing carbon monoxide and carbon dioxide emissions in Balai Kota Makassar. In. 3rd International Conference on Civil and Environmental Engineering (ICCEE). (2019). Bali, Indonesia.
43. Zhao BT, Su YX, He SS, Zhong M, Cui GM. Evolution and comparative assessment of ambient air quality standards in China. J Integ Environ Sci. (2016) 13:85–102. doi: 10.1080/1943815X.2016.1150301
44. Hartig T, Mitchell R, de Vries S, Frumkin H. Nature and health. Annu Rev Public Health. (2014) 35:207–28. doi: 10.1146/annurev-publhealth-032013-182443
45. Jim CY, Chen WY. Assessing the ecosystem service of air pollutant removal by urban trees in Guangzhou (China). J Environ Manage. (2008) 88:665–76. doi: 10.1016/j.jenvman.2007.03.035
46. Huang WZ, Yang BY, Yu HY, Bloom MS, Markevych I, Heinrich J, et al. Association between community greenness and obesity in urban-dwelling Chinese adults. Sci Total Environ. (2020) 702:135040. doi: 10.1016/j.scitotenv.2019.135040
47. Twohig-Bennett C, Jones A. The health benefits of the great outdoors. A systematic review and meta-analysis of greenspace exposure and health outcomes. Environ Res. (2018) 166:628–37. doi: 10.1016/j.envres.2018.06.030
48. Jia X, Yu Y, Xia W, Masri S, Sami M, Hu Z, et al. Cardiovascular diseases in middle aged and older adults in China. the joint effects and mediation of different types of physical exercise and neighborhood greenness and walkability. Environ Res. (2018) 167:175–83. doi: 10.1016/j.envres.2018.07.003
Keywords: greenness, normalized difference vegetation index (NDVI), enhanced vegetation index (EVI), metabolic syndrome (MetS), independent mediation effect, joint mediation effect
Citation: Li X, Wang Q, Feng C, Yu B, Lin X, Fu Y, Dong S, Qiu G, Jin Aik DH, Yin Y, Xia P, Huang S, Liu N, Lin X, Zhang Y, Fang X, Zhong W, Jia P and Yang S (2022) Associations and pathways between residential greenness and metabolic syndromes in Fujian Province. Front. Public Health 10:1014380. doi: 10.3389/fpubh.2022.1014380
Received: 08 August 2022; Accepted: 22 November 2022;
Published: 22 December 2022.
Edited by:
Jun Yang, Guangzhou Medical University, ChinaReviewed by:
Jianxiong Hu, Guangdong Provincial Center for Disease Control and Prevention, ChinaSui Zhu, Jinan University, China
Di Liu, Guangzhou Medical University, China
Copyright © 2022 Li, Wang, Feng, Yu, Lin, Fu, Dong, Qiu, Jin Aik, Yin, Xia, Huang, Liu, Lin, Zhang, Fang, Zhong, Jia and Yang. This is an open-access article distributed under the terms of the Creative Commons Attribution License (CC BY). The use, distribution or reproduction in other forums is permitted, provided the original author(s) and the copyright owner(s) are credited and that the original publication in this journal is cited, in accordance with accepted academic practice. No use, distribution or reproduction is permitted which does not comply with these terms.
*Correspondence: Wenling Zhong, bWJ6d2xAMTYzLmNvbQ==; Shujuan Yang, cmVraW55QDEyNi5jb20=; Peng Jia, amlhcGVuZ2ZmQGhvdG1haWwuY29t
†These authors have contributed equally to this work