
94% of researchers rate our articles as excellent or good
Learn more about the work of our research integrity team to safeguard the quality of each article we publish.
Find out more
ORIGINAL RESEARCH article
Front. Public Health, 28 November 2022
Sec. Infectious Diseases: Epidemiology and Prevention
Volume 10 - 2022 | https://doi.org/10.3389/fpubh.2022.1007205
 Suhyun Hwangbo1,2†
 Yoonjung Kim3†
 Chanhee Lee1
 Seungyeoun Lee4
 Bumjo Oh5
 Min Kyong Moon6,7
 Shin-Woo Kim3*
 Taesung Park1,8*
Background: As the worldwide spread of coronavirus disease 2019 (COVID-19) continues for a long time, early prediction of the maximum severity is required for effective treatment of each patient.
Objective: This study aimed to develop predictive models for the maximum severity of hospitalized COVID-19 patients using artificial intelligence (AI)/machine learning (ML) algorithms.
Methods: The medical records of 2,263 COVID-19 patients admitted to 10 hospitals in Daegu, Korea, from February 18, 2020, to May 19, 2020, were comprehensively reviewed. The maximum severity during hospitalization was divided into four groups according to the severity level: mild, moderate, severe, and critical. The patient's initial hospitalization records were used as predictors. The total dataset was randomly split into a training set and a testing set in a 2:1 ratio, taking into account the four maximum severity groups. Predictive models were developed using the training set and were evaluated using the testing set. Two approaches were performed: using four groups based on original severity levels groups (i.e., 4-group classification) and using two groups after regrouping the four severity level into two (i.e., binary classification). Three variable selection methods including randomForestSRC were performed. As AI/ML algorithms for 4-group classification, GUIDE and proportional odds model were used. For binary classification, we used five AI/ML algorithms, including deep neural network and GUIDE.
Results: Of the four maximum severity groups, the moderate group had the highest percentage (1,115 patients; 49.5%). As factors contributing to exacerbation of maximum severity, there were 25 statistically significant predictors through simple analysis of linear trends. As a result of model development, the following three models based on binary classification showed high predictive performance: (1) Mild vs. Above Moderate, (2) Below Moderate vs. Above Severe, and (3) Below Severe vs. Critical. The performance of these three binary models was evaluated using AUC values 0.883, 0.879, and, 0.887, respectively. Based on results for each of the three predictive models, we developed web-based nomograms for clinical use (http://statgen.snu.ac.kr/software/nomogramDaeguCovid/).
Conclusions: We successfully developed web-based nomograms predicting the maximum severity. These nomograms are expected to help plan an effective treatment for each patient in the clinical field.
The coronavirus disease 2019 (COVID-19) pandemic is a rapidly evolving global emergency that continues to strain healthcare systems (1). Vaccinations are currently being implemented worldwide, but the pandemic persists and it leads to increases in the demand for medical resources. The clinical course of COVID-19 patients is known to appear in various forms ranging from asymptomatic to critical. A large cohort study that included 44,672 patients with COVID-19 from China showed that most cases were classified as mild to moderate (81%). However, 14% were severe, and 5% were critical (2). Therefore, to date, studies on various clinical parameters have been conducted to develop predictive scores or algorithms to identify clinical courses in the early stage.
Age and underlying diseases are known factors associated with higher risks of increased severity or mortality in patients with COVID-19 (3–5). In other studies, clinical symptoms, and laboratory or radiologic findings were included in the factors predicting severity or mortality associated with COVID-19 (6–8). There are several studies considering all of these clinical factors. For example, a retrospective study conducted in China showed that old age, coronary heart disease condition, lymphopenia, elevated procalcitonin, and D-dimer were independently related to mortality (9). Another study conducted in Switzerland for predicting severe disease courses requiring ICU admission demonstrated that male sex, low hemoglobin, the elevation of inflammatory parameters [C-reactive protein (CRP) or leucocyte counts], hyperglycemia, and impaired renal function were the most predictive risk factors (10).
As pointed out by Kim et al., it is important to prioritize patients in need of intensive care to avoid unnecessary consumption of medical resources on mild patients (11). This importance was further emphasized as the sudden COVID-19 outbreak intensified the shortage of hospital beds, critical care equipment, and medical professionals (12). To efficiently manage limited medical resources, it is important to predict the clinical course of patients during hospitalization. It is expected to properly triage patients, monitor the clinical progress of the disease, and allocate proper resources including intensive care facilities or healthcare staff by predicting the maximum severity of clinical progress.
Various nomograms have been developed for predicting the probabilities of disease progression or COVID-19-related mortality using baseline characteristics of patients (13–15). Specifically, we previously developed nomograms that predict the triage for COVID-19 patients based on 5,601 Korean patients (15). Although a large number of patients were included at the time, there were some restrictions on data access and software availability imposed by the Korea Disease Control and Prevention Agency (KDCA). Only three traditional machine learning (ML) algorithms [i.e., logistic regression (LR) (16), random forest (RF) (17), and support vector machine (SVM) (18)] could be applicable. For laboratory data, only five blood cell-centric findings were available. In addition, as initial chest X-ray and inflammatory laboratory findings have been reviewed as factors for severity prediction (1, 19), we further collected these radiologic and laboratory findings to develop more accurate predictive models.
In this study, we developed early predictive models of the maximum severity after the diagnosis of COVID-19. In addition to the three ML algorithms used in our previous study, we were able to apply more sophisticated artificial intelligence (AI)/ML algorithms such as GUIDE (20) and deep neural network (DNN) (21) because newly collected data were used instead of the public data provided by KDCA. We also added initial chest X-ray infiltration and various additional laboratory findings including inflammatory index (i.e. CRP) and organ dysfunction markers [i.e., aspartate transaminase (AST), creatinine, lactate dehydrogenase (LDH)] as candidate predictors (22). Our studies provide evidence that AI/ML applied to clinical parameters are expected to enable the development of tools that can predict the maximum severity.
This is a multicenter retrospective cohort study of polymerase chain reaction-confirmed COVID-19 patients admitted to 10 hospitals in Daegu, Korea (23). The cohort includes data from 2,263 patients followed from February 18, 2020, to May 19, 2020. The data records consist of demographic characteristics, physical measurement, vital signs, clinical findings (i.e., symptoms), co-morbidities, radiologic findings, and laboratory findings. For readmitted patients, first admission records were used.
A total of 46 variables were used in this study. Excluding an outcome variable (i.e., maximum severity during hospitalization), 45 variables were used as predictors. Records for 45 predictors with an average missing rate of 16% (IQR: 6–19%) were collected from each patient on the first day of admission. In this study, the original data was used as it is. This study was approved by the institutional review board of Kyungpook National University Hospital (KNUH 2020-03-044).
Excluding those who died on the first day of admission, 2,254 of 2,263 patients were used in this study. To define the outcome, a disease severity variable was used. The disease severity was divided into four groups: mild, moderate, severe, and critical (23). The disease severity was systematically defined by reflecting the opinions of infectious disease specialists in the clinical field. Detailed definitions of the four groups are given in Table 1. Each patient's diagnosis places them among the four severity groups, depending on the patient's condition (i.e., body temperature, diagnosis of pneumonia, oxygen therapy) during hospitalization. The highest level of severity for a patient diagnosed during hospitalization was called maximum severity. This is to predict and prepare in advance for high-risk patients for conditions such as pneumonia, ICU admission, and death that occur suddenly during hospitalization.
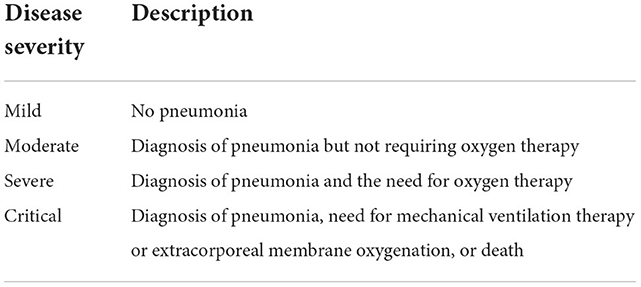
Table 1. Four groups of disease severity.
Of the 45 predictors, 2 demographic variables, 4 vital signs, and 12 laboratory findings were continuous variables. Note that the body temperature belonging to the four vital sign predictors is the body temperature measured only on the first day of admission. Based on the opinions of clinicians for practical use in the clinical field, an optimal cutoff was selected for dichotomizing each continuous predictor. To this end, the maximally selected rank statistics (24) were used. Thus, all predictors used in this study were discrete variables. For each predictor variable, the Cochran-Armitage Trend test (CA) (25) was performed to identify the predictor with a linear trend of the maximum severity. Specifically, a one-sided test was performed to identify predictor with increasing linear trend. That is, in the case of significant variables, the proportion increases as the severity of the disease increases in the group exceeding the cutoff. Bonferroni correction was applied to handle multiple testing problem (26). A p-value < 0.05 was considered significant.
The overall workflow is shown in Figure 1. To avoid overfitting in the predictive model, we randomly split the total dataset into training and testing datasets in a 2:1 ratio, taking into account the maximum severity proportions of the four groups. While developing the predictive model for the maximum severity, two types of classification were considered: 4-group classification and binary classification. For the 4-group classification, we developed a predictive model using four maximum severity groups as they are. For multiple marker selection, Akaike information criterion (AIC)-based stepwise selection (27) was used.
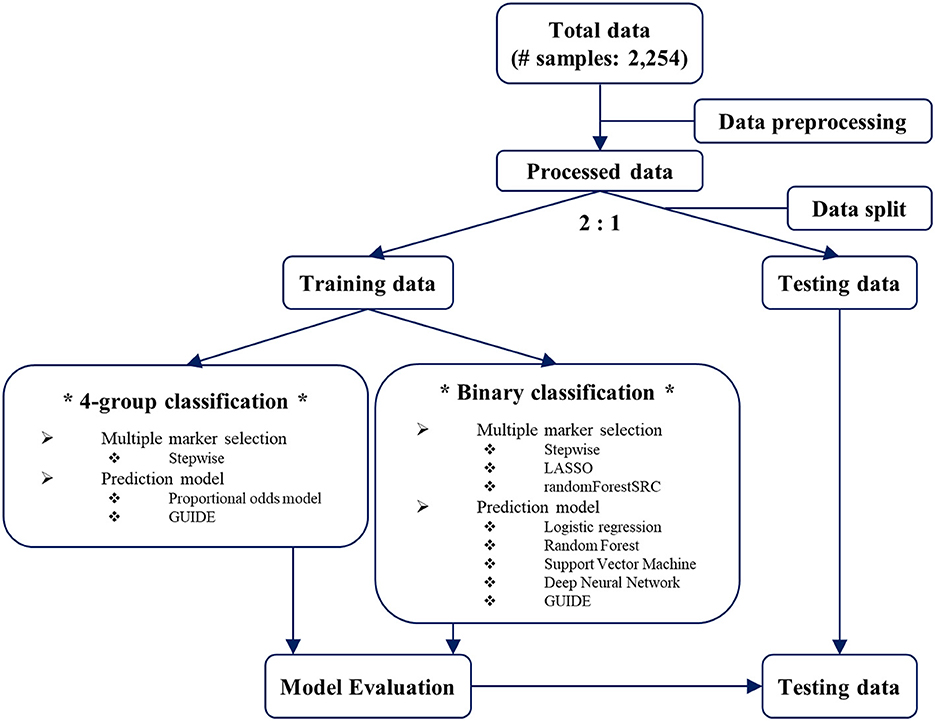
Figure 1. The overall workflow for predictive model development.
For the binary classification, we combined the four maximum severity groups into two groups: (1) Mild vs. Above Moderate (2) Below Moderate vs. Above Severe (3) Below Severe vs. Critical. Above Moderate refers to a group that combines moderate, severe, and critical. Below Moderate refers to a group that combines mild and moderate. Above Severe refers to a group that combines severe and critical. Below Severe refers to a group that combines mild, moderate, and severe. For each outcome with a binary group, multiple predictive markers were selected using the area under the receiver operating characteristic curve (AUC)-based stepwise selection (28), the least absolute shrinkage and selection operator (LASSO) (29), and randomForestSRC (30). For randomforestSRC, we used both GINI index and AUC as a splitting rule. To compare the performance of LR-based predictors (stepwise and LASSO) and randomforestSRC given the same number of predictors, we matched the number of predictors with the average number (i.e., 5) of LR-based predictors when selecting the top ranked predictors in the randomforestSRC. For each binary outcome, the top five predictors were selected based on the variable importance result of randomforestSRC.
For the 4-group classification, the proportional odds model (31) and GUIDE were used (Figure 1). The proportional odds model is an extended logistic regression for the ordinal outcome as follows:
where Y is the outcome with four ordinal categories (j = mild, moderate, severe), αj is an intercept corresponding to the jth category and β is a vector of coefficients. In the case of the proportional odds model, the proportionality assumption was confirmed through the likelihood ratio test, which compares the proportional odds model and the cumulative logit model (32). GUIDE is an improved decision tree-based method and develops a predictive model by selecting predictors based on the Chi-square test (20). As evaluation measures, precision, recall, and F1-score were calculated by comparing each category to the rest using a one-vs-all strategy. For each of these measures, two types of averages were calculated with considering the sample size and without considering the sample size. In addition, the accuracy was used by calculating the proportion of correctly classified observations in the confusion matrix.
For the binary classification, we developed three predictive models: (1) Mild vs. Above Moderate (2) Below Moderate vs. Above Severe (3) Below Severe vs. Critical. During the marker selection process, a 5-fold cross-validation (CV) was performed. We considered five AI/ ML algorithms: LR, RF, SVM, DNN, and GUIDE. For RF, SVM, and DNN, we tuned hyperparameters via 5-fold CV to identify optimal hyperparameters with the highest mean of AUCs. In addition to AUC, balanced accuracy, specificity, recall (i.e., sensitivity), precision, and F1-score were used as evaluation measures. A parsimonious model, a simple model with a high predictive ability for each outcome, was considered the final predictive model.
For the total of 2,254 COVID-19 patients, the maximum severity was classified into four groups. The four groups are mild (n = 548; 24.3%), moderate (n = 1,115; 49.5%), severe (n = 397; 17.6%), and critical (n = 194; 8.6%). Table 2 shows the clinical characteristics of 2,254 patients for the four groups. For age, the proportion of severe and critical groups over 60 years was very high compared to those under 60 years old (adj. p-value = 2.8E-98; CA test). In terms of sex, the maximum severity was more severe for men than women (adj. p-value = 0.0043; CA test). Body mass index (BMI) and two vital signs (i.e., body temperature, and respiration rate) were statistically significant predictors showing a linear trend with the maximum severity. Among the other predictors, three initial clinical findings were fatigue, shortness of breath, altered consciousness, 8 comorbidities [i.e., diabetes, heart failure, hypertension, chronic cardiac disease (CCD), chronic kidney disease, cancer, chronic neurological disorder (CND), dementia], chest X-ray infiltration, and 8 laboratory findings [i.e., CRP, Procalcitonin, AST, alanine transaminase (ALT), Creatine kinase MB, LDH, Creatinine, prothrombin time international normalized ratio (PT-INR)] showed the linear trend with the maximum severity (Table 2).
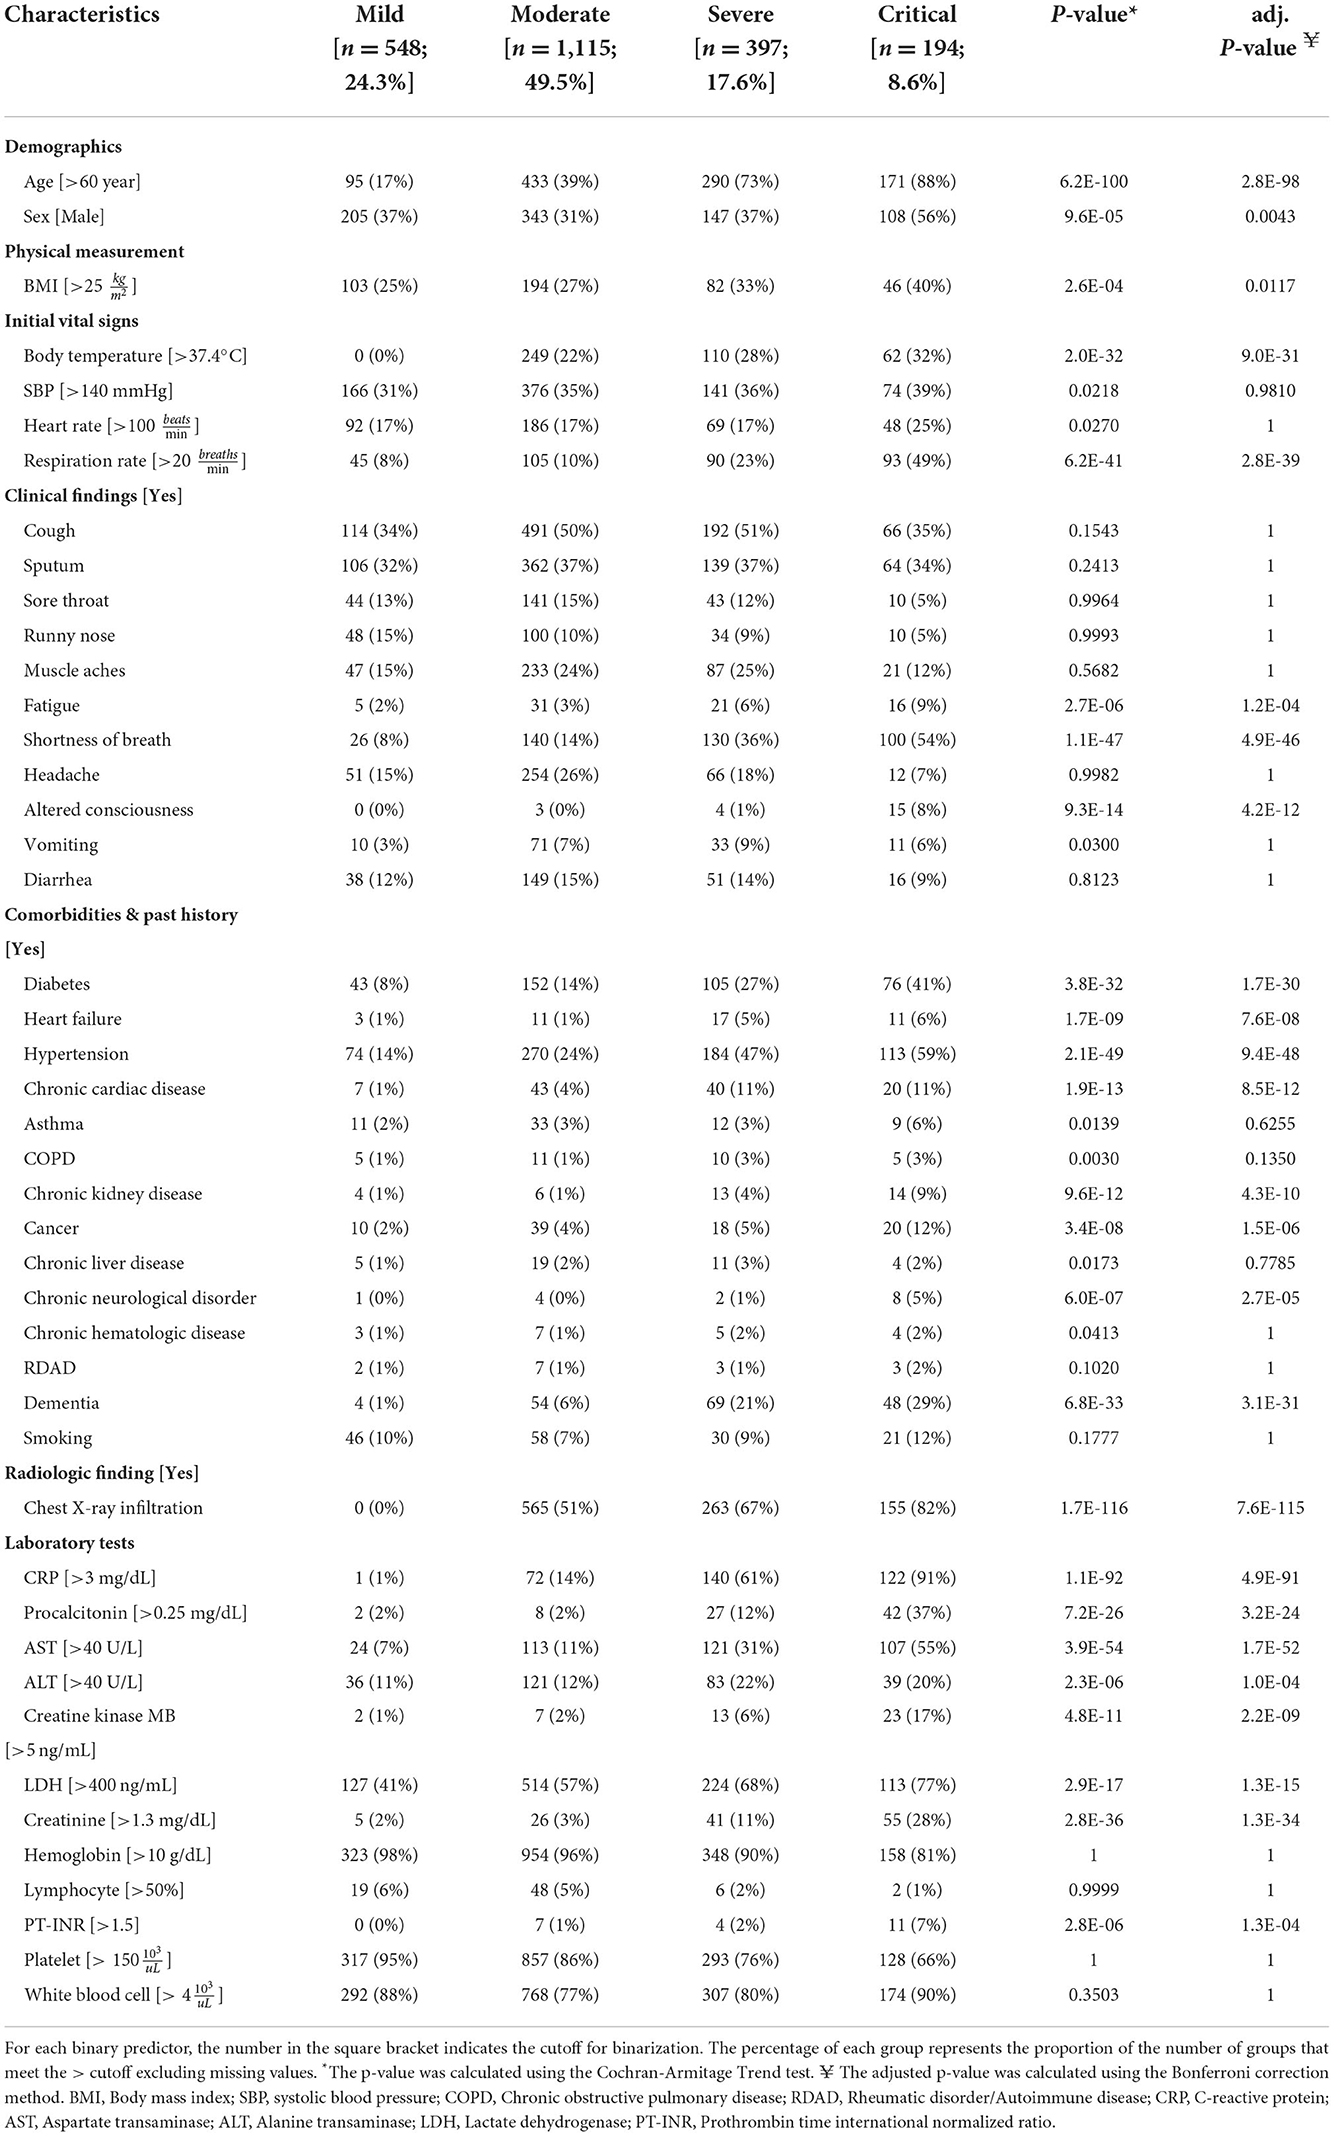
Table 2. Patient's characteristics for each group of the maximum severity.
First, we developed predictive models using the four ordinal groups which represent triage COVID-19 patients more informatively. To select multiple markers associated with the maximum severity, we used the proportional odds model and GUIDE model. As a result of AIC-based stepwise selection, eight predictors were selected including age, SBP, cough, sore throat, shortness of breath, hypertension, ALT, and lymphocyte. Based on these eight predictors, the proportional odds assumption was held (p-value = 0.9980). Thus, we developed a predictive model using the proportional odds model and evaluated its performance on the testing data. In the case of the proportional odds model when evaluating the performance, the probability of being a specific category j was calculated by using the difference between the cumulative probability corresponding to j and j−1 [i.e., P(Y = j) = P(Y ≤ j)−P(Y ≤ j−1)]. Each sample of the testing data is classified into the group with the highest probability. The evaluation results of the proportional odds model are shown in Table 3. The accuracy and the weighted averages of precision, recall, and F1-scores for the proportional odds model was 0.524, 0.407, 0.499, and 0.408, respectively. For the GUIDE model, six predictors were selected as follows: CRP, respiration rate, age, headache, cough, and PT-INR. The prediction results of the GUIDE model were also low (Table 3). In both the proportional odds model and GUIDE, it seems that most groups were predicted to be the moderate group with the highest proportion of the four severity groups.
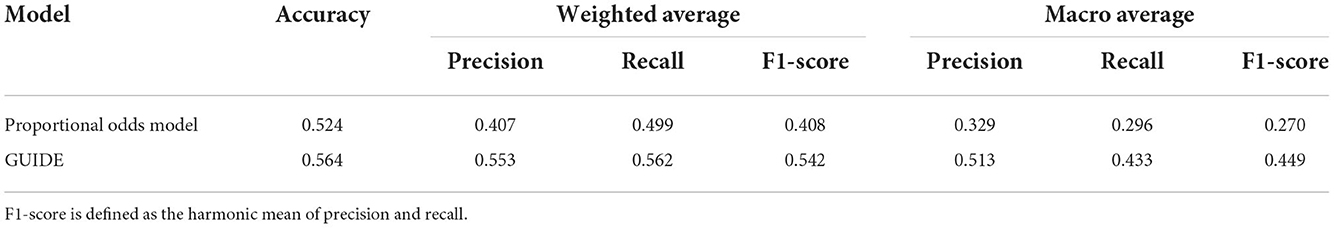
Table 3. Predictive models and performance for 4-group classification in testing data.
By extending the approach of our previous study, we developed predictive models based on more sophisticated AI/ML algorithms using a variety of predictors such as radiologic and laboratory findings reported to be associated with severity. We combined the four outcome groups into two groups [i.e., (1) Mild vs. Above Moderate, (2) Below Moderate vs. Above Severe, and (3) Below Severe vs. Critical]. For each of the three binary outcomes, the variable selection was performed using AUC-based stepwise, LASSO, and randomForestSRC methods. For each outcome, predictive models were developed using selected variables based on five AI/ML algorithms: LR, RF, SVM, DNN, and GUIDE. Table 4 shows the model and performance results. For each binary outcome, a parsimonious model with the best predictive performance using fewer predictors was chosen as the final model.
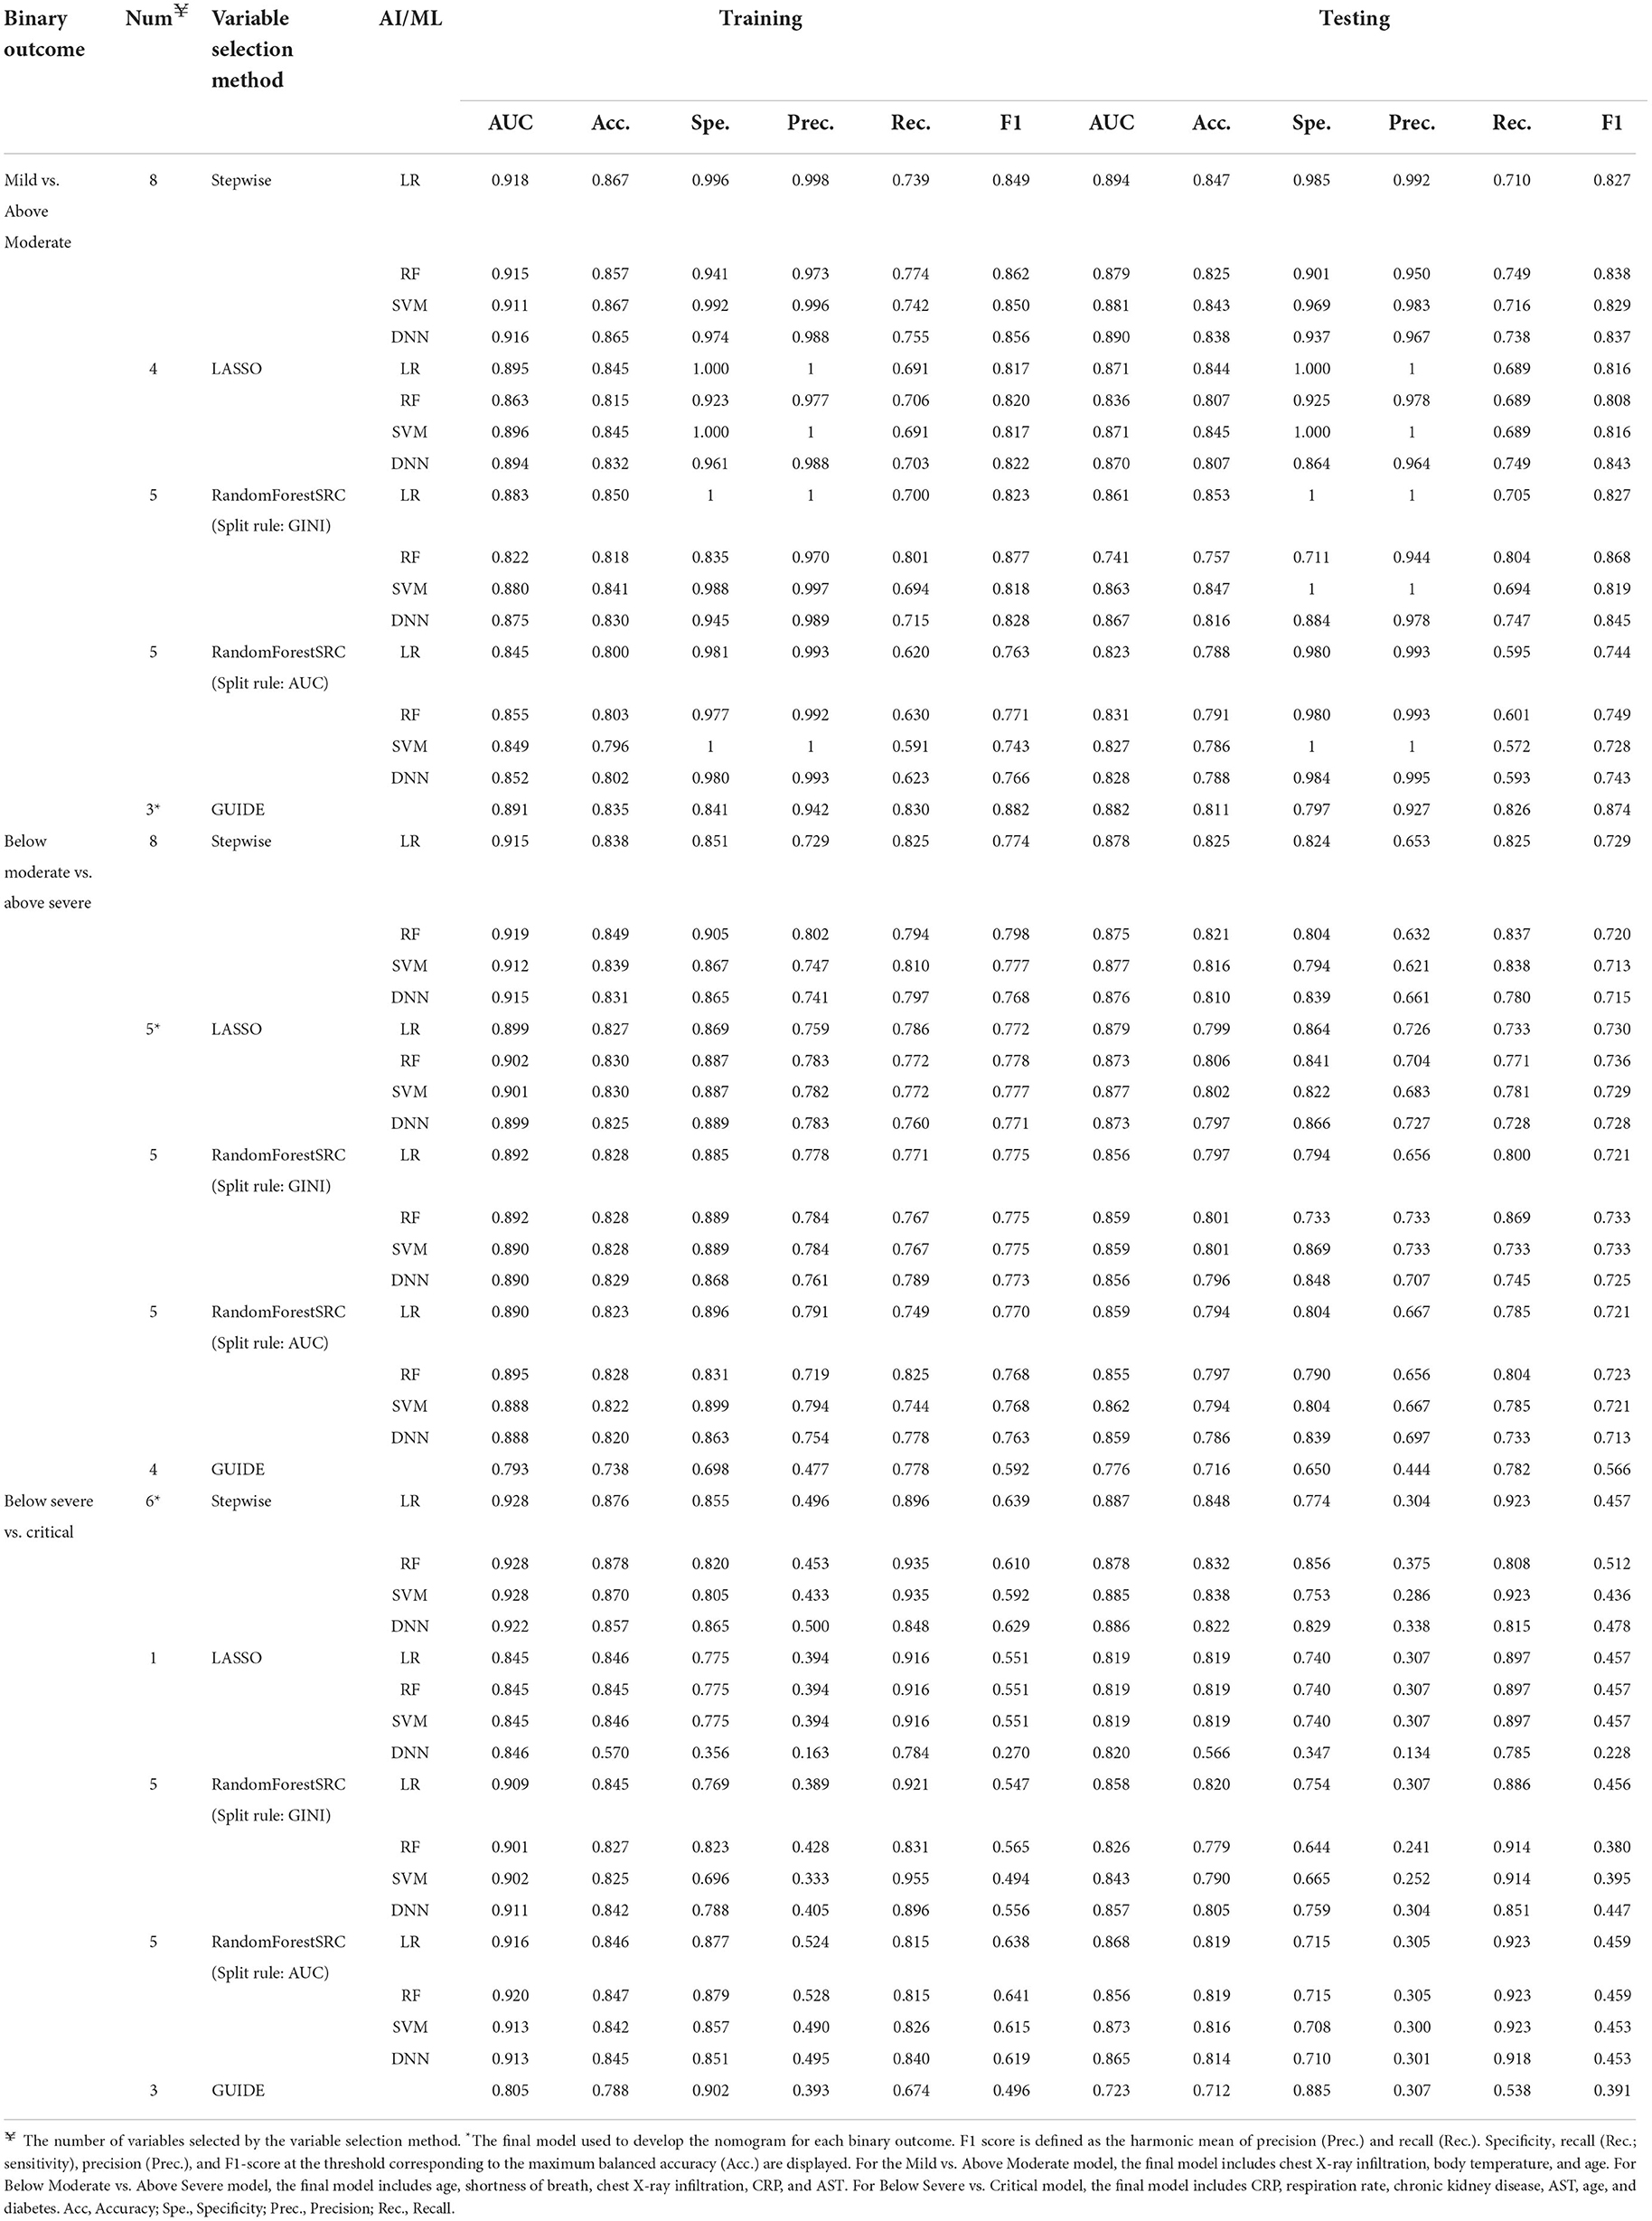
Table 4. Predictive models and performance for each binary outcome.
For (1) Mild vs. Above Moderate model, three predictors including chest X-ray infiltration, body temperature, and age were finally selected for the final model. The final model showed good performance with an AUC of 0.882, balanced accuracy of 0.811, and F1-score of 0.874 for GUIDE. In particular, the predictive performance of the GUIDE for binary classification is much better than a model for 4-group classification, when converting the 4 × 4 confusion matrix of 4-group classification to a 2 × 2 version (33). Figure 2 shows the results of GUIDE using training data. The number between 1 and 15 of each node represents the label of the node. At each split, an observation goes to the left branch if and only if the condition is satisfied. The predicted class (in red) and sample size (in italics) are printed below the terminal node. Terminal nodes with classes predicted to be Above Moderate = 1 are shown in green, and classes predicted to be Mild = 0 are shown in yellow. Sample proportions by class for Mild = 0 and Above Moderate = 1 are displayed next to the node. From the tree, the importance of the variables can be inferred in the order of chest X-ray infiltration, body temperature, and age. In that an observation moves to the left branch when the condition is met, all predictors can be inferred to have positive effects on the Above Moderate group.
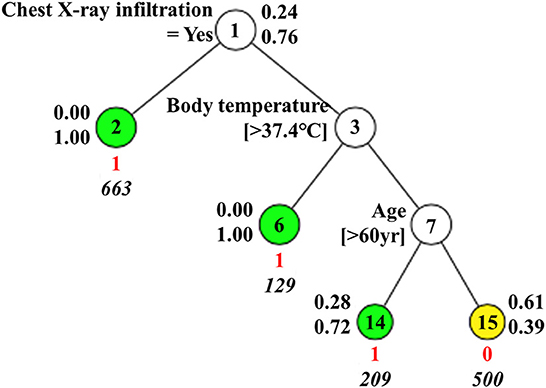
Figure 2. GUIDE model for Mild vs. Above Moderate.
For (2) Below Moderate vs. Above Severe model, 5 predictors were finally selected as the final model: age, shortness of breath, chest X-ray infiltration, CRP, and AST. Based on LR with the highest performance, all predictors showed positive effects on the Above Severe group (Table 5). When ranked based on statistical significance, CRP had the highest, followed by shortness of breath. A positive association between CRP level and the severity of COVID-19 has been reported (34). In addition to CRP, age, shortness of breath, and chest X-ray infiltration were also well-known factors predicting the severity of COVID-19 (15, 35). The model showed predictive performance with the highest performance with AUC = 0.879 (balanced accuracy = 0.799, F1-score = 0.730) for LR.
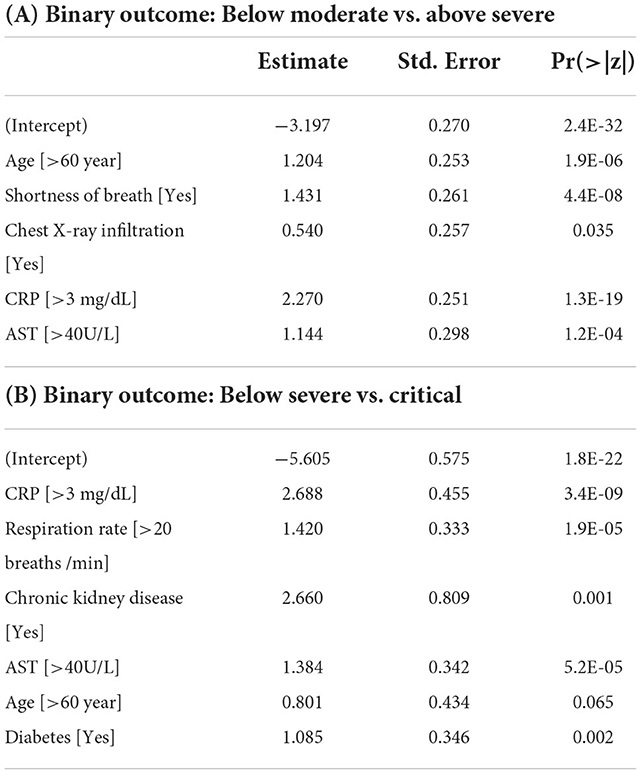
Table 5. Fitted results of the logistic regression model for the Below Moderate vs. Above Severe model and Below Severe vs. Critical model.
For (3) Below Severe vs. Critical model, 6 predictors were finally selected as the final model: CRP, respiration rate, chronic kidney disease, AST, age, and diabetes. As with the Below Moderate vs. Above Severe model, based on LR with the highest AUC value, all predictors showed positive effects on the Critical group (Table 5). When ranked based on statistical significance, CRP ranked highest. CRP has also been studied as a factor to predict the need for mechanical ventilation (36). In addition to CRP, respiration rate and age have been reported as predictors for an increased risk of mechanical ventilation (37). Chronic kidney disease and diabetes were also risk factors contributing to death in hospitalized COVID-19 patients (38, 39). The model had the highest AUC value of 0.887 and the highest balanced accuracy of 0.848 for LR. For these three predictive models, we developed nomograms to predict the maximum severity of each COVID-19 patient using the coefficients of the LR model (Figure 3). The nomogram is available at http://statgen.snu.ac.kr/software/nomogramDaeguCovid/ and is expected to help plan effective treatment for each patient in a clinical setting.
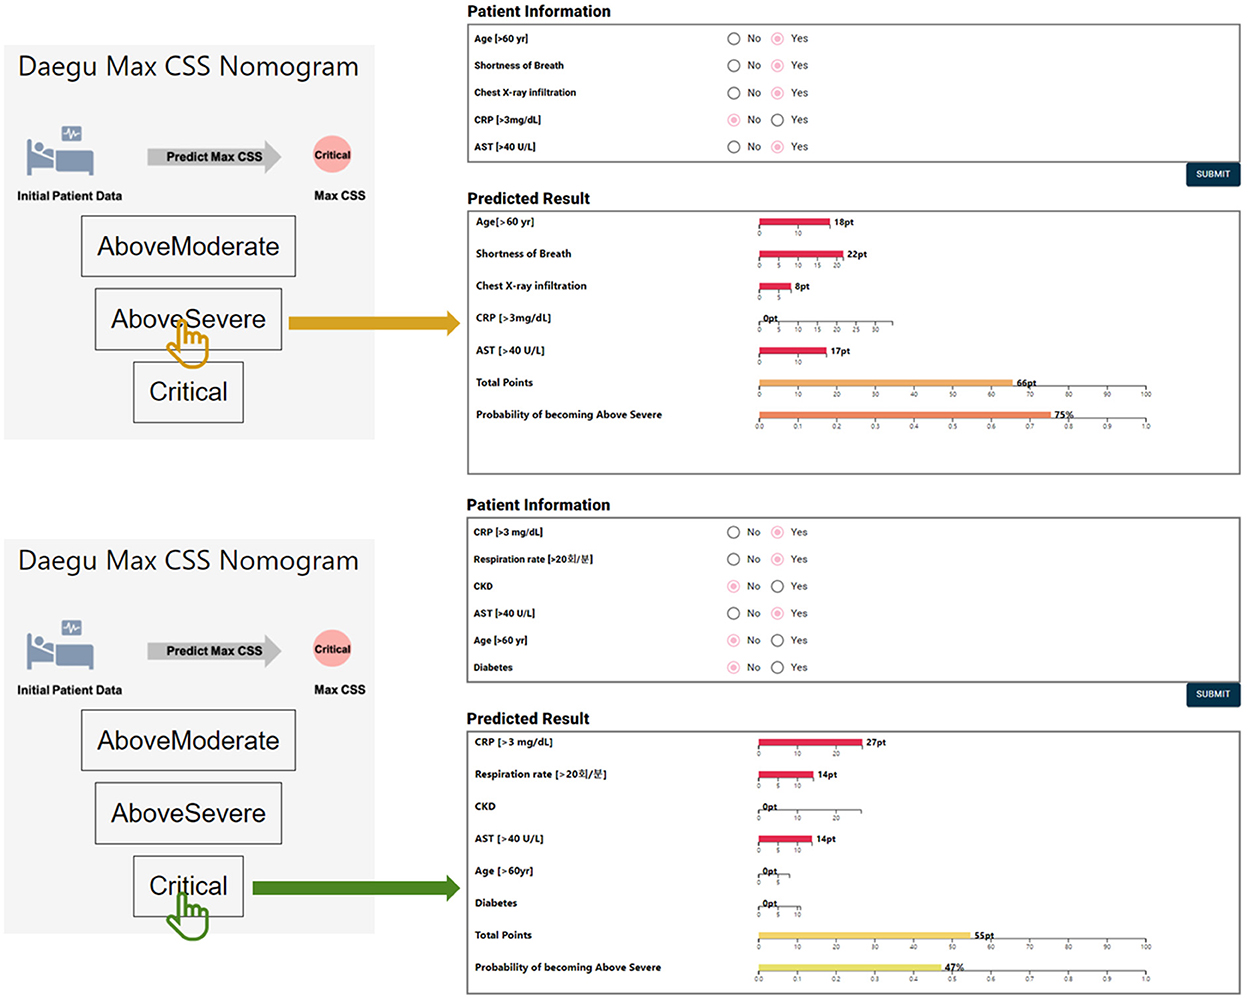
Figure 3. An example of the nomogram for each outcome.
As the COVID-19 pandemic continues for a long time, the importance of proper preparation and distribution of medical resources at an early stage is growing. Early prediction of the high-risk group for severe COVID-19 pneumonia is important because it can reduce mortality by providing timely treatment to critically ill patients such as the elderly (40, 41). For early prediction, this study successfully developed AI/ML-based models that predict the maximum severity of COVID-19 patients during hospitalization. Of the two approaches used in this study, the binary classification approach performed much better than the 4-group classification approach. Based on the binary classification results with higher performance, we developed web-based nomograms useful for clinical practice as follows: (1) Mild vs. Above Moderate, (2) Below Moderate vs. Above Severe, and (3) Below Severe vs. Critical. The Mild vs. Above Moderate model showed the predictive performance of AUC = 0.882 using only three clinicopathologic predictors (i.e., chest X-ray infiltration, body temperature, and age). This implies that three predictors without laboratory findings are sufficient to predict the Mild vs. Above Moderate model. Conversely, models predicting (2) Above Severe or (3) Critical groups required laboratory findings such as CRP and AST. For these two models, the predictive performance was further compared to the best model when predictors were selected without laboratory findings. For the Below Moderate vs. Above Severe, the final model used to develop the nomogram showed higher predictive performance (AUC range: 0.873–0.879; 5 predictors) than the best model (AUC range: 0.809–0.825; 8 predictors which include age, chest X-ray, body temperature, smoking, CND, respiration rate, hypertension, and sex) when clinicopathological predictors were selected without laboratory findings. Here, the 8 predictors based only on clinicopathological variables are not the same as the 8 predictors (CRP, AST, age, shortness of breath, dementia, diabetes, creatinine, and chest X-ray) selected by the stepwise method in Table 4. The Below Severe vs. Critical model (AUC range: 0.878–0.887; 6 predictors) used to develop the nomogram also outperformed the best model (AUC range: 0.719–0.831; 8 predictors which include age, respiration rate, smoking, chest X-ray, diabetes, body temperature, sex, and CCD) when only clinicopathological predictors were selected.
Most of the predictors used to develop the nomogram were found to be consistent with previously reported results in the literature. Age, the common predictor of the three models used in the nomogram, is known to be a major risk factor for clinical severity (1). Chest X-ray infiltration was previously reported as a predictor of detecting the moderate and severe groups with an accuracy of 0.86 or better (42). CRP, which serves as an early marker of inflammation, has also been reported as an early predictor of COVID-19 severity (34, 43). AST, which acts as a sign of liver damage, has also been reported as one of the important predictors for predicting severity (44). It is well-known that shortness of breath is prevalent in severe patients (45). Respiration rate, chronic kidney disease, and diabetes were reported risk factors for mechanical ventilation or death corresponding to the critical group (37–39).
Our study showed similar results in a large cohort retrospective study conducted in the United States. The previous study used 64 input variables, including vital signs, various laboratory findings, and comorbidities. As the previous study found that age, male sex, and liver disease were associated with higher clinical severity, the Below Severe vs. Critical model in this study had a high predictive performance with clinical parameters including age, male sex, and elevated AST relating to liver diseases. In the previous study, ferritin and d-dimer were used as input variables, but in our study, cytokine storm syndrome-related these blood tests occurring in severe COVID-19 were not included. However, a high predictive model was presented without using these laboratory findings, and through this, convenience in predicting the disease severity in clinical situations can be expected. Our study demonstrated that the predictive model has the potential to predict the maximum disease severity of patients with COVID-19 with high accuracy and to help healthcare systems in planning for surge medical capacity for COVID-19, especially in a situation where medical resources are limited.
Compared to our previous study (15), the main characteristics of this study are as follows. Firstly, in this study, the maximum severity defined based on the opinions of infectious disease specialists is expected to arouse sympathy from other clinicians in the clinical field. As a result, this model may be useful in clinical practice and the design of further clinical studies. Secondly, various AI/ML algorithms including DNN and GUIDE were used as comparison methods. The predictive performance based on various AI/ML algorithms suggests that the logistic model used to develop the nomogram outperforms other comparative models. Lastly, the results of this study suggest that various laboratory findings such as CRP and AST contribute to the higher predictive performance with a smaller number of predictors.
Most of the existing methods have focused on classifying two groups, such as mild and severe patients (46). However, a predictive model based on the 4-group classification allows for ease of diagnosis for four groups of COVID-19 patients without the need for three predictive models. In addition, for more accurate classification, it is necessary to develop a predictive model using the ordinal information of four groups (47). Although the predictive performance for the four groups was not good because most of the four groups were predicted as the moderate group with the highest proportion, the results are expected to be useful for designing future analysis plans such as an approach reflecting weights depending on the proportion of the outcome.
However, this study has some limitations. Firstly, we could not evaluate the impact of COVID-19 treatment, new COVID-19 variants, and vaccination status on the clinical severity course because this study was conducted in early COVID-19 pandemic patient groups. Secondly, full therapeutic options were not available such as remdesivir, tocilizumab (anti-IL-6 receptor monoclonal antibody), baricitinib (janus kinase inhibitor), and anti-SARS-CoV-2 monoclonal antibody. Thirdly, laboratory findings related to cytokine storm syndrome occurring in severe COVID-19 such as ferritin, interleukin 6 (IL-6), and d-dimer were not included. Ferritin (macrophage activation indicator) and IL-6 (T lymphocyte activation) are known to suspect cytokine storm syndrome in severe COVID-19 exacerbation (48). If laboratory test results related to these cytokine systems were included, it could help to create a model that can better predict severe or critical disease severity. We are continually updating data from 10 hospitals in Daegu, and collecting new data at SMG-SNU Boramae Medical Center in Seoul. Based on these updated data, we are conducting new systematic analyzes including variant information and therapeutic options. The new results will be reported in a separate paper in the new future. Lastly, although our study included only Korean, further research on different races could help to predict clinical disease severity more accurately. However, despite these limitations, this study is a meaningful study in its way to determine the maximum severity of the patient only from the initial condition in the absence of variant information or treatment for COVID-19.
In conclusion, three predictive models were developed to predict the maximum severity during hospitalization based on the initial hospitalization records. The five AI/ML algorithms including DNN and GUIDE were used for model development. Each of the three predictive models showed excellent predictive performance using a few predictors. Representatively, the Mild vs. Above Moderate model showed the predictive performance of 0.882 for AUC using three clinicopathologic predictors. Based on these three predictive models, we successfully developed web-based nomograms useful in the clinical field. These nomograms are expected to help plan effective and timely treatment for each patient.
The datasets generated for this study are available on request to the corresponding author.
The studies involving human participants were reviewed and approved by the Institutional Review Board of Kyungpook National University Hospital (KNUH 2020-03-044). The patients/participants provided their written informed consent to participate in this study.
SH and TP led the overall study and conceived the model. YK and S-WK contributed to the data collection. SH and CL contributed to the data analysis. CL developed the nomogram. SH, SL, BO, MM, S-WK, and TP contributed to data interpretation. SH and YK wrote the manuscript. TP and S-WK supervised the project. All authors read, edited, and approved the final manuscript.
This research was supported by the Bio and Medical Technology Development Program of the National Research Foundation (NRF) funded by the Korean government (MSIT) (No. 2021M3E5E3081425).
The authors thank Taeyeong Jung, Hyeonjung Ham, and Keon Vin Park for their contribution to the initial analysis, and Catherine Apio for English editing.
The authors declare that the research was conducted in the absence of any commercial or financial relationships that could be construed as a potential conflict of interest.
All claims expressed in this article are solely those of the authors and do not necessarily represent those of their affiliated organizations, or those of the publisher, the editors and the reviewers. Any product that may be evaluated in this article, or claim that may be made by its manufacturer, is not guaranteed or endorsed by the publisher.
1. Gallo Marin B, Aghagoli G, Lavine K, Yang L, Siff EJ, Chiang SS, et al. Predictors of COVID-19 severity: a literature review. Rev Med Virol. (2021) 31:1–10. doi: 10.1002/rmv.2146
2. Wu Z, McGoogan JM. Characteristics of and important lessons from the coronavirus disease 2019 (COVID-19) outbreak in China: summary of a report of 72 314 cases from the chinese center for disease control and prevention. JAMA. (2020) 323:1239–42. doi: 10.1001/jama.2020.2648
3. O'Driscoll M, Ribeiro Dos Santos G, Wang L, Cummings DAT, Azman AS, Paireau J, et al. Age-specific mortality and immunity patterns of SARS-CoV-2. Nature. (2021) 590:140–5. doi: 10.1038/s41586-020-2918-0
4. Banerjee A, Pasea L, Harris S, Gonzalez-Izquierdo A, Torralbo A, Shallcross L, et al. Estimating excess 1-year mortality associated with the COVID-19 pandemic according to underlying conditions and age: a population-based cohort study. Lancet. (2020) 395:1715–25. doi: 10.1016/S0140-6736(20)30854-0
5. Bennett KE, Mullooly M, O'Loughlin M, Fitzgerald M, O'Donnell J, O'Connor L, et al. Underlying conditions and risk of hospitalisation, ICU admission and mortality among those with COVID-19 in Ireland: a national surveillance study. Lancet Reg Health Eur. (2021) 5:100097. doi: 10.1016/j.lanepe.2021.100097
6. Wu G, Yang P, Xie Y, Woodruff HC, Rao X, Guiot J, et al. Development of a clinical decision support system for severity risk prediction and triage of COVID-19 patients at hospital admission: an international multicentre study. Eur Respir J. (2020) 56:2001104. doi: 10.1183/13993003.01104-2020
7. Yu Y, Wang X, Li M, Gu L, Xie Z, Gu W, et al. Nomogram to identify severe coronavirus disease 2019 (COVID-19) based on initial clinical and CT characteristics: a multi-center study. BMC Med Imaging. (2020) 20:111. doi: 10.1186/s12880-020-00513-z
8. Liu J, Liu Y, Xiang P, Pu L, Xiong H, Li C, et al. Neutrophil-to-lymphocyte ratio predicts critical illness patients with 2019 coronavirus disease in the early stage. J Transl Med. (2020) 18:206. doi: 10.1186/s12967-020-02374-0
9. Shang Y, Liu T, Wei Y, Li J, Shao L, Liu M, et al. Scoring systems for predicting mortality for severe patients with COVID-19. EClin Med. (2020) 24:100426. doi: 10.1016/j.eclinm.2020.100426
10. Schöning V, Liakoni E, Baumgartner C, Exadaktylos AK, Hautz WE, Atkinson A, et al. Development and validation of a prognostic COVID-19 severity assessment (COSA) score and machine learning models for patient triage at a tertiary hospital. J Transl Med. (2021) 19:56. doi: 10.1186/s12967-021-02720-w
11. Kim H-J, Han D, Kim J-H, Kim D, Ha B, Seog W, et al. An easy-to-use machine learning model to predict the prognosis of patients with COVID-19: retrospective cohort study. J Med Internet Res. (2020) 22:e24225. doi: 10.2196/24225
12. Sen-Crowe B, Sutherland M, McKenney M, Elkbuli A, A. closer look into global hospital beds capacity and resource shortages during the COVID-19 pandemic. J Surg Res. (2021) 260:56–63. doi: 10.1016/j.jss.2020.11.062
13. Moon Hj, Kim K, Kang EK, Yang H-J, Lee E. Prediction of COVID-19-related mortality and 30-day and 60-day survival probabilities using a nomogram. J Korean Med Sci. (2021) 36:0. doi: 10.3346/jkms.2021.36.e248
14. Pan D, Cheng D, Cao Y, Hu C, Zou F, Yu W, et al. A predicting nomogram for mortality in patients with COVID-19. Front Public Health. (2020) 8:461. doi: 10.3389/fpubh.2020.00461
15. Oh B, Hwangbo S, Jung T, Min K, Lee C, Apio C, et al. Prediction models for the clinical severity of patients with COVID-19 in Korea: retrospective multicenter cohort study. J Med Internet Res. (2021) 23:e25852. doi: 10.2196/25852
16. Hosmer Jr DW, Lemeshow S, Sturdivant RX. Applied Logistic Regression. Hoboken, NJ: John Wiley & Sons (2013).
17. Liaw A, Wiener M. Classification and regression by randomForest. R news. (2002) 2:18–22. doi: 10.1057/9780230509993
18. Noble WS. What is a support vector machine? Nat Biotechnol. (2006) 24:1565–7. doi: 10.1038/nbt1206-1565
19. Calvillo-Batllés P, Cerdá-Alberich L, Fonfría-Esparcia C, Carreres-Ortega A, Muñoz-Núñez CF, Trilles-Olaso L, et al. Development of severity and mortality prediction models for COVID-19 patients at emergency department including the chest x-ray. Radiología. (2022) 4:214–77. doi: 10.1016/j.rxeng.2021.09.004
20. Loh WY. Classification and regression trees. Wiley Interdiscip. Rev.: Data Min. Knowl. Discov. (2011) 1:14–23. doi: 10.1002/widm.8
21. Sze V, Chen Y-H, Yang T-J, Emer JS. Efficient processing of deep neural networks: a tutorial and survey. Proc IEEE. (2017) 105:2295–329. doi: 10.1109/JPROC.2017.2761740
22. Poggiali E, Zaino D, Immovilli P, Rovero L, Losi G, Dacrema A, et al. Lactate dehydrogenase and C-reactive protein as predictors of respiratory failure in CoVID-19 patients. Clin Chim Acta. (2020) 509:135–8. doi: 10.1016/j.cca.2020.06.012
23. Kim S-W, Kim S-M, Kim YK, Kim J-y, Lee Y-M, Kim B-O, et al. Clinical characteristics and outcomes of COVID-19 cohort patients in Daegu metropolitan city outbreak in 2020. J Korean Med Sci. (2021) 36:e12. doi: 10.3346/jkms.2021.36.e12
24. Lausen B, Schumacher M. Maximally selected rank statistics. Biometrics. (1992) 1992:73–85. doi: 10.2307/2532740
25. Armitage P. Tests for linear trends in proportions and frequencies. Biometrics. (1955) 11:375–86. doi: 10.2307/3001775
26. Weisstein EW. Bonferroni Correction. (2004). Available online at: https://mathworldwolframcom/ (accessed November 4, 2022).
27. Yamashita T, Yamashita K, Kamimura R, A. stepwise AIC method for variable selection in linear regression. Communic Stat Theory Methods. (2007) 36:2395–403. doi: 10.1080/03610920701215639
28. Hwangbo S, Kim SI, Kim J-H, Eoh KJ, Lee C, Kim YT, et al. Development of machine learning models to predict platinum sensitivity of high-grade serous ovarian carcinoma. Cancers. (2021) 13:1875. doi: 10.3390/cancers13081875
29. Tibshirani R. Regression shrinkage and selection via the lasso. J Royal Stat Soc Series B. (1996) 58:267–88. doi: 10.1111/j.2517-6161.1996.tb02080.x
30. Ishwaran H, Lu M, Kogalur UB. Randomforestsrc: Variable Importance (VIMP) with Subsampling Inference Vignette (2021). Available online at: http://randomforestsrc.org/articles/vimp.html
31. Brant R. Assessing proportionality in the proportional odds model for ordinal logistic regression. Biometrics. (1990) 1990:1171–8. doi: 10.2307/2532457
32. Lee J. Cumulative logit modelling for ordinal response variables: applications to biomedical research. Bioinformatics. (1992) 8:555–62. doi: 10.1093/bioinformatics/8.6.555
33. Ruuska S, Hämäläinen W, Kajava S, Mughal M, Matilainen P, Mononen J. Evaluation of the confusion matrix method in the validation of an automated system for measuring feeding behaviour of cattle. Behav Proc. (2018) 148:56–62. doi: 10.1016/j.beproc.2018.01.004
34. Chen W, Zheng KI, Liu S, Yan Z, Xu C, Qiao Z. Plasma CRP level is positively associated with the severity of COVID-19. Ann Clin Microbiol Antimicrob. (2020) 19:1–7. doi: 10.1186/s12941-020-00362-2
35. Yasin R, Gouda W. Chest X-ray findings monitoring COVID-19 disease course and severity. Egyptian J Radiol Nucl Med. (2020) 51:1–18. doi: 10.1186/s43055-020-00296-x
36. Herold T, Jurinovic V, Arnreich C, Lipworth BJ, Hellmuth JC, von Bergwelt-Baildon M, et al. Elevated levels of IL-6 and CRP predict the need for mechanical ventilation in COVID-19. J Allergy Clin Immunol. (2020) 146:128–36. e4. doi: 10.1016/j.jaci.2020.05.008
37. Yu L, Halalau A, Dalal B, Abbas AE, Ivascu F, Amin M, et al. Machine learning methods to predict mechanical ventilation and mortality in patients with COVID-19. PLoS ONE. (2021) 16:e0249285. doi: 10.1371/journal.pone.0249285
38. Tehrani S, Killander A, Åstrand P, Jakobsson J, Gille-Johnson P. Risk factors for death in adult COVID-19 patients: frailty predicts fatal outcome in older patients. Int J Infect Dis. (2021) 102:415–21. doi: 10.1016/j.ijid.2020.10.071
39. Muniyappa R, Wilkins KJ. Diabetes, obesity, and risk prediction of severe COVID-19. J Clin Endocrinol Metabolism. (2020) 105:e3812–4. doi: 10.1210/clinem/dgaa442
40. Wang R, Jiao Z, Yang L, Choi JW, Xiong Z, Halsey K, et al. Artificial intelligence for prediction of COVID-19 progression using CT imaging and clinical data. Eur Radiol. (2022) 32:205–12. doi: 10.1007/s00330-021-08049-8
41. Fang C, Bai S, Chen Q, Zhou Y, Xia L, Qin L, et al. Deep learning for predicting COVID-19 malignant progression. Med Image Anal. (2021) 72:102096. doi: 10.1016/j.media.2021.102096
42. Tabik S, Gómez-Ríos A, Martín-Rodríguez JL, Sevillano-García I, Rey-Area M, Charte D, et al. COVIDGR dataset and COVID-SDNet methodology for predicting COVID-19 based on Chest X-Ray images. IEEE J Biomed Health Inform. (2020) 24:3595–605. doi: 10.1109/JBHI.2020.3037127
43. Ahnach M, Zbiri S, Nejjari S, Ousti F, Elkettani C. C-reactive protein as an early predictor of COVID-19 severity. J Med Biochem. (2020) 39:500. doi: 10.5937/jomb0-27554
44. Bennett TD, Moffitt RA, Hajagos JG, Amor B, Anand A, Bissell MM, et al. Clinical characterization and prediction of clinical severity of SARS-CoV-2 infection among US adults using data from the US national COVID cohort collaborative. JAMA Network Open. (2021) 4:e2116901. doi: 10.1001/jamanetworkopen.2021.16901
45. Li J, Chen Z, Nie Y, Ma Y, Guo Q, Dai X. Identification of symptoms prognostic of COVID-19 severity: multivariate data analysis of a case series in Henan Province. J Med Internet Res. (2020) 22:e19636. doi: 10.2196/19636
46. Zhang C, Qin L, Li K, Wang Q, Zhao Y, Xu B, et al. A novel scoring system for prediction of disease severity in COVID-19. Front Cell Infect Microbiol. (2020) 10:318. doi: 10.3389/fcimb.2020.00318
47. Sun C, Bai Y, Chen D, He L, Zhu J, Ding X, et al. Accurate classification of COVID-19 patients with different severity via machine learning. Clin Transl Med. (2021) 11:e323. doi: 10.1002/ctm2.323
Keywords: COVID-19, artificial intelligence, machine learning, severity, nomogram
Citation: Hwangbo S, Kim Y, Lee C, Lee S, Oh B, Moon MK, Kim S-W and Park T (2022) Machine learning models to predict the maximum severity of COVID-19 based on initial hospitalization record. Front. Public Health 10:1007205. doi: 10.3389/fpubh.2022.1007205
Received: 30 July 2022; Accepted: 07 November 2022;
Published: 28 November 2022.
Edited by:
Reza Lashgari, Shahid Beheshti University, IranReviewed by:
Min Lu, University of Miami, United StatesCopyright © 2022 Hwangbo, Kim, Lee, Lee, Oh, Moon, Kim and Park. This is an open-access article distributed under the terms of the Creative Commons Attribution License (CC BY). The use, distribution or reproduction in other forums is permitted, provided the original author(s) and the copyright owner(s) are credited and that the original publication in this journal is cited, in accordance with accepted academic practice. No use, distribution or reproduction is permitted which does not comply with these terms.
*Correspondence: Shin-Woo Kim, a3N3Mmttc0BrbnUuYWMua3I=; Taesung Park, dHNwYXJrQHN0YXRzLnNudS5hYy5rcg==
†These authors have contributed equally to this work and share first authorship
Disclaimer: All claims expressed in this article are solely those of the authors and do not necessarily represent those of their affiliated organizations, or those of the publisher, the editors and the reviewers. Any product that may be evaluated in this article or claim that may be made by its manufacturer is not guaranteed or endorsed by the publisher.
Research integrity at Frontiers
Learn more about the work of our research integrity team to safeguard the quality of each article we publish.