 Man-Li Du1†
 Tao-Hsin Tung
 Ping Tao
 Ching-Wen Chien
 Yen-Ching Chuang
- 1Huadu District of Guangzhou Maternal and Child Health Hospital (Huzhong Hospital), Guangzhou, China
- 2Enze Medical Research Center, Affiliated Taizhou Hospital of Wenzhou Medical College, Taizhou, China
- 3Department of Medical Affairs and Planning, Section of Medical Fees Kaohsiung Veterans General Hospital, Kaohsiung City, Taiwan
- 4Institute for Hospital Management, Tsing Hua University, Shenzhen, China
- 5Institute of Public Health & Emergency Management, Taizhou University, Taizhou, China
- 6Business College, Taizhou University, Taizhou, China
Purpose: To analyze the key factors and decision-making behaviors affecting overall satisfaction based on perceptual data of outpatients.
Methods: The official satisfaction questionnaire developed by the National Health Commission of the People's Republic of China was used. Rough set theory was used to identify the perception patterns between condition attributes (i.e., service factors) and a decision attribute (i.e., overall service level) and to express them in rule form (i.e., if-then).
Results: The four minimal-coverage rules, with strength exceeding 10% in the good class, and six crucial condition attributes were obtained: “Ease of registration (C1),” “Respected by registered staff (C2),” “Registered staff's listening (C3),” “Respected by doctor (C9),” “Signpost (C12),” and “Privacy (C16).” In addition, the average hit rate for 5-fold cross-validation was 90.86%.
Conclusions: A series of decision rules could help decision-makers easily understand outpatients' situations and propose more suitable programs for improving hospital service quality because these decision rules are based on actual outpatient experiences.
Introduction
Hospitals are a service industry whose medical service directly affects patient's lives, medical treatment, and health care (1). Outpatient service is the main medical service provided by hospitals, and most outpatients usually need medium- or long-term diagnosis and treatment. Furthermore, when a hospital meets the needs of existing patients, it attracts more potential patients (2, 3). For these reasons, it is crucial for hospital management to understand and improve the satisfaction of outpatients (4–8).
Hospital service quality involves both qualitative and quantitative factors, which belong to multi-attribute decision-making (MADM). For example, Altuntas et al. developed a MADM method based on a weighted SERVQUAL scale for measuring the perceived service quality of hospitals (5). Shieh et al. developed the modified Decision Making Trial and Evaluation Laboratory (DEMATEL) method to identify the key factors for medical service quality (9). Fei et al. proposed an extended best–worst multi-criteria decision-making method using belief functions and their applications in hospital service evaluation (4). Then, considering the fuzziness of expert's opinion expression, some scholars proposed various fuzzy MADM models. For example, Chen and Hung developed a fuzzy MADM model with interval type-2 fuzzy sets for hospital service quality assessment (10). Tuzkaya et al. developed a hybrid fuzzy MADM model to evaluate hospital service quality based on the interval-valued intuitionistic fuzzy-preference ranking organization method for enrichment evaluations (IVIF-PROMETHEE) (11). Li and He used the 2-tuple MADM method for hospital service quality assessment with linguistic preferences (12). These models are mainly based on expert knowledge as the decision-making basis of service quality evaluation. This decision-making method can easily obtain evaluation and improvement strategies. However, the results are also easily influenced by expert's practical experience and limited knowledge, which does not necessarily conform to the behavior pattern of patient satisfaction.
To fill the gap, this study applied a data-mining method to establish behavior patterns of outpatient patient satisfaction from hospital service quality survey data. First, the questionnaire developed by the National Health Commission of the People's Republic of China was used to investigate the service quality for a third-level first-class hospital. Then, based on the survey data, the decision model between service factors and overall service level was established using rough set theory (RST). Finally, this decision-making model (i.e., data-driven knowledge model) is helpful for hospital quality management departments to propose various improvement directions and measures.
This paper is structured as follows: Section 2 introduces the questionnaire, RST, and data collection. Section 3 describes the case study results based on RST. Section 4 discusses management practices, model stability, and research limitations. Section 5 presents the conclusions.
Materials and Methods
The Public Hospital Satisfaction Questionnaire
In China, to improve the quality of medical services in nationwide public hospitals, the National Health Commission set up a national satisfaction survey management platform and designed a series of satisfaction questionnaires. The questionnaire includes outpatient, inpatient, and medical staff versions. Subsequently, a large medical satisfaction survey was conducted in all two- and three-level public hospitals in the country. The outpatient satisfaction questionnaire was used as the purpose of this study is to improve the satisfaction of outpatient medical services from the perspective of outpatient behavior patterns. The questionnaire consists of two parts: service quality factors (i.e., condition attributes defined in RST) and overall service level (i.e., decision attribute defined in rough set). In addition, the overall satisfaction value originates from the average value of all service quality factors (i.e., condition attributes) and is divided equally into three levels: the first third (marked as “Good class [D = 1]”), the middle third (marked as “Medium class [D = 2]”), and the bottom third (marked as “Poor class [D = 3]”). The public hospital satisfaction questionnaire in this study is shown in Table 1.
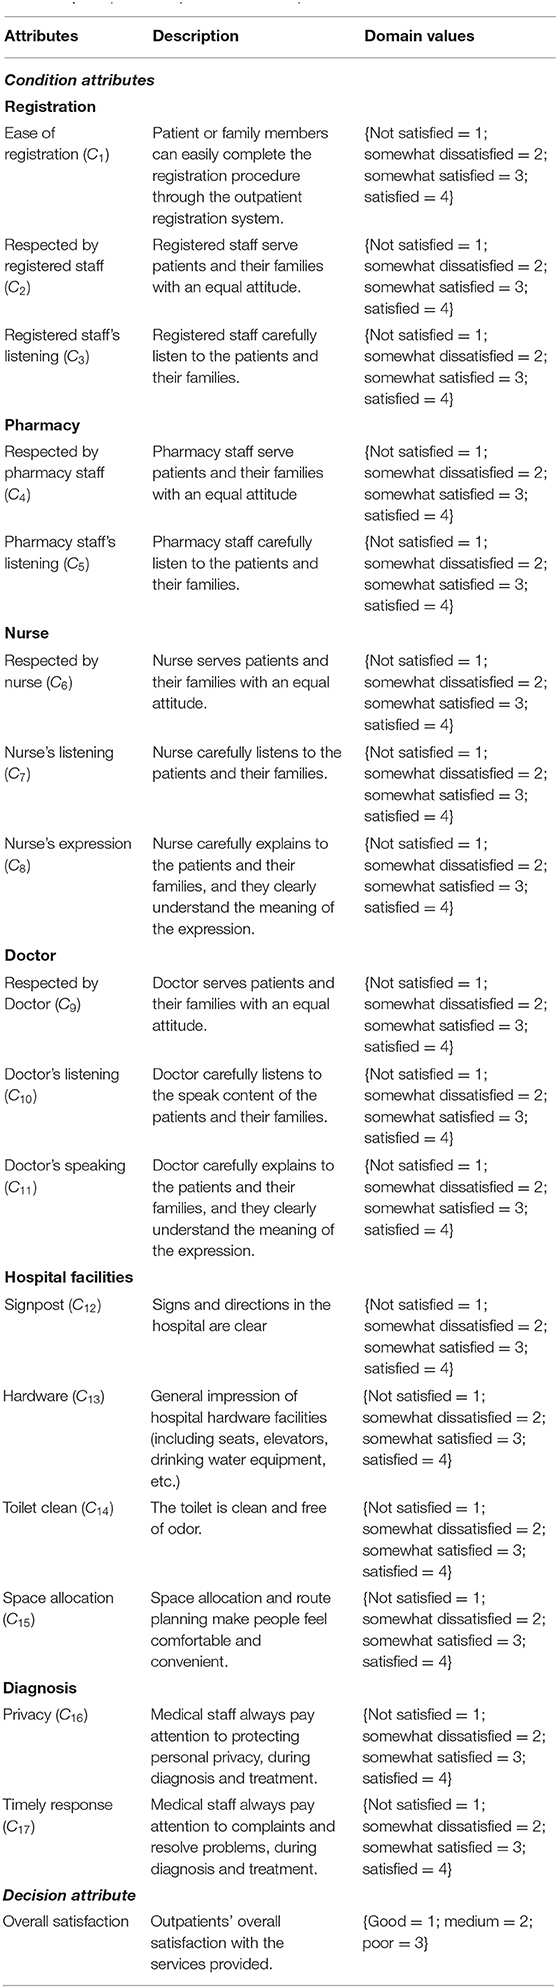
Table 1. The public hospital satisfaction questionnaire.
A Brief Introduction to RST
Pawlak discovered the imprecise fuzzy relations between condition attributes and a decision attribute in classification problems and then developed a data mining method, RST (13). The basic concept of this method is to approximate the goal based on the equivalence relationship between attributes and to show the behavior/decision pattern behind the data in the form of rules (14). Because of this concept, the method has a unique advantage that it can directly evaluate and analyze quantitative and qualitative attributes without knowing the probability distribution of the data (i.e., the probability distribution in statistics) before data analysis (15). Accordingly, this method plays a key role in the fields of artificial intelligence and cognitive science and is applied to many different topics, such as finance investment (16), consumer behavior (17), and human resource development (18). The basic definition and brief calculation of RST are shown in Supplementary Appendix A (17, 19).
Participants and Data Collection
This study was conducted following the principles of the institutional ethics committee and in accordance with the Declaration of Helsinki. All participant's information was kept anonymous. This observational study was approved by the Guangdong Nursing Association on November 1, 2018 (No. hdfyhlbgdhlxueh2019zx113). The questionnaire survey was conducted in March 2019. This study collected 536 questionnaires detailing women's perspectives. After excluding questionnaires with incomplete data (i.e., 11 questionnaires), 525 questionnaires remained as data for this study. Finally, this study uses the rose2 software to do the rough set analysis. The detailed information regarding the background of respondents is shown in Table 2. The research flowchart is shown in Figure 1.
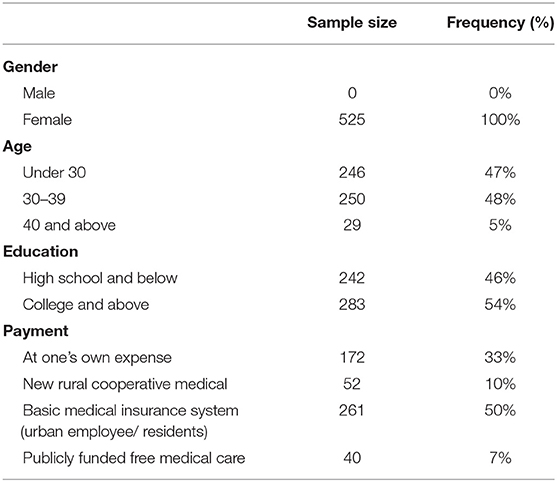
Table 2. Respondent background information for the case study.

Figure 1. The research flow chart.
The Robustness of RST Model
To further determine the reliability of the decision rules generated in this study, a 5-fold cross-validation method was applied to the dataset. First, 80% of the dataset was randomly selected as training samples to generate decision rules. Next, the remaining 20% of the data was used as a test sample to verify the click rate of the generated decision rules (i.e., the percentage of the correct predictions for each decision class). Finally, these processes were repeated five times through RST modeling; their average hit rate is shown in Table 3. In addition, this method was compared with four well-known data mining methods: decision tree, random forest (RF), back-propagation artificial neural network (BPANN), and the support vector machine (SVM).

Table 3. Average hit rates for 5-fold cross-validation.
Results
Quality of Approximation Boundary
The overall quality of the decision class approximation boundary is 0.9733, and the approximation accuracy for each class is shown in Table 4. The results showed that the classification boundary of the global decision has a high approximation quality. First, for “Good class (D = 1),” the lower and upper approximations are 175 objects each for an approximation quality of 1.000 (175/175). Then, for “Medium class (D = 2),” the lower approximation is 166 objects, and the upper approximation is 180 objects for an approximation quality of 0.9222 (166/180). Last, for “Poor class (D = 3),” the lower approximation is 170 objects, and the upper approximation is 184 objects for an approximation quality of 0.9239 (170/184). From the approximation accuracy perspective, the approximate boundary of class 1 is clear and has no ambiguity (i.e., no roughness). In addition, the approximate boundaries of classes 2 and 3 are fuzzy—that is, there is an ambiguous phenomenon (i.e., roughness).
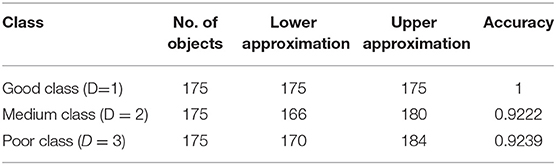
Table 4. Quality approximation of decision classes.
Decision Rules
RST can produce minimal-coverage rules, 52 rules in this dataset. Among these, 8 rules apply to “Good class (D = 1),” 28 apply to “Medium class (D = 2),” and 16 apply to “Poor class (D = 3).” To better achieve the goal of improving outpatient's satisfaction with hospital service quality, this study focused only on “Good class (D = 1),” and the data percentage threshold for this class was set at 10%. The four rules included indicate that, if the requirements of conditional attributes are met, the hospital's overall service satisfaction has a certain probability of reaching “Good class (D = 1).” The rules also represent four ways to improve the quality of hospital services and thus achieve the service levels expected by outpatients. The four rules were selected as shown in Table 5.
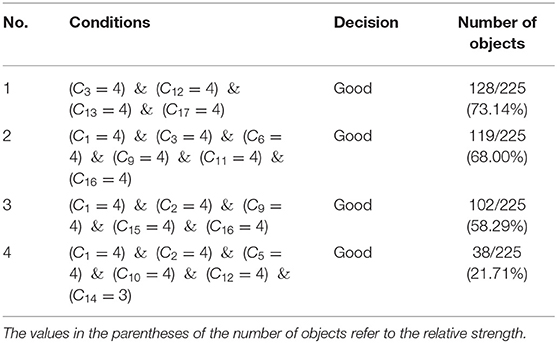
Table 5. Minimal covering rules with strength exceeding 10% in Decision = 1.
Rule 1 indicated that 73.14% of hospital outpatients rated the overall service evaluation of the hospital as “Good class (D = 1),” which has the condition attributes of “Registered staff's listening (C3) = {4},” “Signpost (C12) = {4},” “Hardware (C13) = {4},” and “Timely response (C17) = {4}.” Rule 2 indicated that 68.00% of hospital outpatients associated the “Good class (D = 1)” service rating with “Ease of registration (C1) = {4},” “Registered staff's listening (C3) = {4},” “Respected by nurse (C6) = {4},” “Respected by doctors (C9) = {4},” “Doctor's speaking (C11) = {4},” and “Privacy (C16) = {4}.” Rule 3 indicated that 58.29% of hospital outpatients associated the “Good class (D = 1)” service rating with “Ease of registration (C1) = {4},” “Respected by registered staff (C2) = {4},” “Respected by doctors (C9) = {4},” “Space allocation (C15) = {4},” and “Privacy (C16) = {4}.” Finally, Rule 4 indicated that 21.71% of hospital outpatients associated the “Good class (D = 1)” service rating with “Ease of registration (C1) = {4},” “Respected by registered staff (C2) = {4},” “Pharmacy staff's listening (C5) = {4},” “Doctor's listening (C10) = {4},” “Signpost (C12) = {4},” and “Toilet clean (C14) = {4}.”
To further determine the relative importance of the condition attributes related to “Good (D = 1),” the frequency of these condition attributes was as follows: “Ease of registration (C1),” three times; “Respected by registered staff (C2),” “Registered staff's listening (C3),” “Respected by doctor (C9),” “Signpost (C12),” and “Privacy (C16),” two times; “Pharmacy staff's listening (C5),” “Respected by nurse (C6),” “Doctor's listening (C10),” “Doctor's speaking (C11),” “Hardware (C13),” “Toilet clean (C14),” “Space allocation (C15),” and “Timely response (C17),” one time. These results indicate that “Ease of registration (C1),” “Respected by registered staff (C2),” “Registered staff's listening (C3),” “Respected by doctor (C9),” “Signpost (C12),” and “Privacy (C16)” are several major condition attributes that outpatients recognize in hospitals with good medical quality.
A Correct Classification Rate of age Groups
In order to further understand the classification accuracy of age groups-based data. The 525 data set is divided into two groups according to age: (i) under 30 years old (Sample size: 246, e.g., 47%); and (ii) over 30 years old (Sample size: 279, e.g., 53%). Based on the results of 5-fold cross-validation, the classification accuracy of the former is 83.32%; The latter is 86.4%. Compared with the original classification accuracy (i.e., 90.86%, all sample sizes: 525), the data according to different age groups will really affect the accuracy of classification. Since the interviewees are all women, there are no men. Therefore, this study did not make a comparative analysis of gender on the results. The results are shown in Table 6.
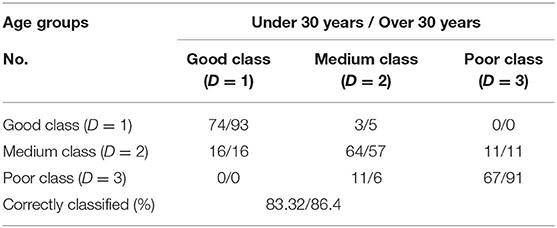
Table 6. The average hit rate of 5-fold cross-validation in different age groups.
Discussion
Management Practice
This study indicates the six most important attributes clinical practice: ease of registration, respected by registered staff, registered staff's listening, respected by doctor, signpost, and privacy. This indicates that patients would like to complete the outpatient process smoothly. First, the online reservation system should be easy to use, and telephone reservation personnel need to be empathetic and listen carefully to the patient's needs so that they can successfully complete the reservation process. This is because, once patients miss their appointment opportunity, they must spend more time waiting for an appointment. In addition, physical condition is a very private issue. Patients hope that clinicians can respect their wishes or opinions in the diagnosis or treatment process and protect their privacy. Finally, the hospital should have a clear movement route with signposts to help patients find the visiting area quickly and save time, especially for pregnant women for whom moving is not convenient. As mentioned above, these six service quality factors are critical and foundational to overall satisfaction with hospitals. In addition, hospital decision-makers can choose rules 1 to 4 to improve the overall service quality of outpatient service according to the actual situation.
The results indicate that the difference in modeling quality between the five methods is not significantly based on the same data. However, the RST used in this study can demonstrate the pattern between condition attributes and a decision attribute through the regular expression. This way of expressing rules can assist hospital decision-makers or managers to more easily understand the decision rules for each decision class and their probability of occurrence. Compared with RST, the BPANN method requires more training time (16, 20, 21). Furthermore, these RF, BPANN, and SVM methods cannot provide this information because they belong to the black-box algorithms category (22).
Research Limitations
The limitations of this study were as follows. (i) The questionnaire items were used by the National Health Commission of the People's Republic of China, without considering other questionnaire scales. (ii) The questionnaire survey was conducted in March 2019, and the analysis of the results was limited to the satisfaction analysis from the female perspective, without considering other factors such as related events, gender, grade, and admission time. The reason is that other factors may affect the change of classification accuracy so they are not within the scope of this study. (iii) The results of RST analysis are limited to the behaviors of the investigated participants and should not be extended to other hospitals.
Conclusions
This is the first time to study the public hospital service quality scale based on the National Health Commission of the People's Republic of China, and apply rough set theory to explore the key attributes and behavior rules that affect the overall service quality from a group of patient behavior data. The key attributes can help decision makers better understand the factors that patients care most about; Behavior rules can help decision-makers put forward specific improvement strategies. As a beginning, this study provides different thinking of data behavior decision-making from expert experience. Chinese public hospitals can take this research model as the research basis, and consider other factors such as related events, gender, grade, and admission time, so as to provide more in-depth results and analysis in the future.
Data Availability Statement
The original contributions presented in the study are included in the article/Supplementary Material, further inquiries can be directed to the corresponding authors.
Ethics Statement
The studies involving human participants were reviewed and approved by Guangdong Nursing Association (No. hdfyhlbgdhlxueh2019zx113). Written informed consent for participation was not required for this study in accordance with the national legislation and the institutional requirements.
Author Contributions
M-LD and PT collected the data and wrote a draft article. Y-CC calculated the RST results, interpreted the results, and revised the article. T-HT and C-WC designed the research process and content and reviewed the final version. All authors have read and agreed to the published version of the manuscript.
Funding
This research was funded by a study on nurse-patient relationship and patient satisfactions in a women and children's hospital, Grant No. gdhlxueh2019zx113.
Conflict of Interest
The authors declare that the research was conducted in the absence of any commercial or financial relationships that could be construed as a potential conflict of interest.
Publisher's Note
All claims expressed in this article are solely those of the authors and do not necessarily represent those of their affiliated organizations, or those of the publisher, the editors and the reviewers. Any product that may be evaluated in this article, or claim that may be made by its manufacturer, is not guaranteed or endorsed by the publisher.
Acknowledgments
We thank for the support of Huadu District of Guangzhou Maternal and Child Health Hospital (Huzhong Hospital), Guangzhou, China.
Supplementary Material
The Supplementary Material for this article can be found online at: https://www.frontiersin.org/articles/10.3389/fpubh.2021.739119/full#supplementary-material
References
1. Pakdil F, Harwood TN. Patient satisfaction in a preoperative assessment clinic: an analysis using SERVQUAL dimensions. Total Qual Manag Bus Excell. (2005) 16:15–30. doi: 10.1080/1478336042000255622
2. Shieh JI, Wu HH, Huang KK. A DEMATEL method in identifying key success factors of hospital service quality. Knowl Based Syst. (2010) 23:277–82. doi: 10.1016/j.knosys.2010.01.013
3. Kucukarslan SN, Nadkarni A. Evaluating medication-related services in a hospital setting using the disconfirmation of expectations model of satisfaction. Res Social Adm Pharm. (2008) 4:12–22. doi: 10.1016/j.sapharm.2007.01.001
4. Fei L, Lu J, Feng Y. An extended best-worst multi-criteria decision-making method by belief functions and its applications in hospital service evaluation. Comput Ind Eng. (2020) 142:106355. doi: 10.1016/j.cie.2020.106355
5. Altuntas S, Dereli T, Yilmaz MK. Multi-criteria decision making methods based weighted SERVQUAL scales to measure perceived service quality in hospitals: a case study from Turkey. Total Qual Manag Bus Excell. (2012) 23:1379–95. doi: 10.1080/14783363.2012.661136
6. Raziei Z, Torabi SA, Tabrizian S, Zahiri B,A. hybrid GDM-SERVQUAL-QFD approach for service quality assessment in hospitals. Eng Manag J. (2018) 30:179–90. doi: 10.1080/10429247.2018.1443670
7. Altuntas S, Kansu S. An innovative and integrated approach based on SERVQUAL, QFD and FMEA for service quality improvement. Kybernetes. (2019) 49:2419–53. doi: 10.1108/K-04-2019-0269
8. Li LX. Relationships between determinants of hospital quality management and service quality performance—a path analytic model. Omega. (1997) 25:535–45. doi: 10.1016/S0305-0483(97)00017-0
9. Shieh JI, Wu HH, Huang KK. Identifying key factors of medical service quality by a modified DEMATEL method based on total sensitivity analysis. J Med Imaging Health Inform. (2016) 6:1844–9. doi: 10.1166/jmihi.2016.1937
10. Chen CT, Hung WZ. Evaluating the service quality of hospital by using TOPSIS with interval type-2 fuzzy sets In: International Conference on Fuzzy Theory and Its Applications (iFUZZY). (2017). p. 1-5. doi: 10.1109/iFUZZY.2017.8311786
11. Tuzkaya G, Sennaroglu B, Kalender ZT, Mutlu M. Hospital service quality evaluation with IVIF-PROMETHEE and a case study. Socio Econ Plann Sci. (2019) 68:100705. doi: 10.1016/j.seps.2019.04.002
12. Li X, He Z. An integrated approach for evaluating hospital service quality with linguistic preferences. Int J Prod Res. (2021) 59:1776–90. doi: 10.1080/00207543.2020.1725681
14. Zhang Q, Xie Q, Wang G,A. survey on rough set theory and its applications. CAAI Trans Intell Technol. (2016) 1:323–33. doi: 10.1016/j.trit.2016.11.001
15. Liou JJH, Chuang YC, Hsu CC. Improving airline service quality based on rough set theory and flow graphs. J Ind Prod Eng. (2016) 33:123–33. doi: 10.1080/21681015.2015.1113571
16. Shyng JY, Shieh HM, Tzeng GH. Compactness rate as a rule selection index based on Rough Set Theory to improve data analysis for personal investment portfolios. Appl Soft Comput. (2011) 11:3671–9. doi: 10.1016/j.asoc.2011.01.038
17. Amin A, Anwar S, Adnan A, Nawaz M, Alawfi K, Hussain A, et al. Customer churn prediction in the telecommunication sector using a rough set approach. Neurocomputing. (2017) 237:242–54. doi: 10.1016/j.neucom.2016.12.009
18. Imai S, Watada J. A rough sets approach to human resource development in IT corporations. In: Pedrycz W, Chen SM, editors. Intelligent Systems Reference Library. (2011) p. 249–73. doi: 10.1007/978-3-642-19820-5_13
19. Yan H, Wu D, Huang Y, Wang G, Shang M, Xu J, et al. Water eutrophication assessment based on rough set and multidimensional cloud model. Chemometr Intell Lab Syst. (2017) 164:103–12. doi: 10.1016/j.chemolab.2017.02.005
20. Li R, Wang ZO. Mining classification rules using rough sets and neural networks. Eur J Oper Res. (2004) 157:439–48. doi: 10.1016/S0377-2217(03)00422-3
21. Grzymala-Busse DM, Grzymala-Busse JW. The usefulness of a machine learning approach to knowledge acquisition. Comp Intell. (1995) 11:268–79. doi: 10.1111/j.1467-8640.1995.tb00032.x
Keywords: service quality, outpatient satisfaction, multiple attribute decision-making (MADM), data mining, rough set theory (RST)
Citation: Du M-L, Tung T-H, Tao P, Chien C-W and Chuang Y-C (2021) Application of Rough Set Theory to Improve Outpatient Medical Service Quality in Public Hospitals Based on the Patient Perspective. Front. Public Health 9:739119. doi: 10.3389/fpubh.2021.739119
Received: 19 July 2021; Accepted: 19 October 2021;
Published: 24 November 2021.
Edited by:
Pedro Ruiz-Lopez, Research Institute Hospital 12 de Octubre, SpainReviewed by:
Jose Mira, Miguel Hernández University of Elche, SpainSusana Lorenzo Martínez, Hospital Universitario Fundación Alcorcón, Spain
Copyright © 2021 Du, Tung, Tao, Chien and Chuang. This is an open-access article distributed under the terms of the Creative Commons Attribution License (CC BY). The use, distribution or reproduction in other forums is permitted, provided the original author(s) and the copyright owner(s) are credited and that the original publication in this journal is cited, in accordance with accepted academic practice. No use, distribution or reproduction is permitted which does not comply with these terms.
*Correspondence: Yen-Ching Chuang, eWVuY2hpbmcuY2h1YW5nQGdtYWlsLmNvbQ==; Ching-Wen Chien, aWhoY2FAc3oudHNpbmdodWEuZWR1LmNu
†These authors have contributed equally to this work