 Dinesh Kumar Barupal
 Sadjad Fakouri Baygi
- Department of Environmental Medicine and Public Health, Icahn School of Medicine at Mount Sinai, New York, NY, United States
Background: An untargeted chemical analysis of bio-fluids provides semi-quantitative data for thousands of chemicals for expanding our understanding about relationships among metabolic pathways, diseases, phenotypes and exposures. During the processing of mass spectral and chromatography data, various signal thresholds are used to control the number of peaks in the final data matrix that is used for statistical analyses. However, commonly used stringent thresholds generate constrained data matrices which may under-represent the detected chemical space, leading to missed biological insights in the exposome research.
Methods: We have re-analyzed a liquid chromatography high resolution mass spectrometry data set for a publicly available epidemiology study (n = 499) of human cord blood samples using the MS-DIAL software with minimally possible thresholds during the data processing steps. Peak list for individual files and the data matrix after alignment and gap-filling steps were summarized for different peak height and detection frequency thresholds. Correlations between birth weight and LC/MS peaks in the newly generated data matrix were computed using the spearman correlation coefficient.
Results: MS-DIAL software detected on average 23,156 peaks for individual LC/MS file and 63,393 peaks in the aligned peak table. A combination of peak height and detection frequency thresholds that was used in the original publication at the individual file and the peak alignment levels can reject 90% peaks from the untargeted chemical analysis dataset that was generated by MS-DIAL. Correlation analysis for birth weight data suggested that up to 80% of the significantly associated peaks were rejected by the data processing thresholds that were used in the original publication. The re-analysis with minimum possible thresholds recovered metabolic insights about C19 steroids and hydroxy-acyl-carnitines and their relationships with birth weight.
Conclusions: Data processing thresholds for peak height and detection frequencies at individual data file and at the alignment level should be used at minimal possible level or completely avoided for mining untargeted chemical analysis data in the exposome research for discovering new biomarkers and mechanisms.
Introduction
Small molecules can function as metabolic substrates and products, signaling molecules, energy equivalents, building blocks, and toxic exposures in the human body (1). Beneficial and harmful changes in the levels of these molecules can occur from the early life to the elderly stage because of genetic and environmental factors (2–5). Inside the human body, a small molecule can be absorbed, circulated, metabolized, degraded, transformed and excreted by organ systems (6, 7). A comprehensive understanding of these changes and how the body's biological pathways react to them can contribute to advancing prevention strategies for human diseases (8, 9). But, contrary to the vast knowledge available on functional roles of genes or proteins, our understanding about the roles of most small molecules in human health remains rudimentary (10, 11). Fortunately, use of sensitive and high-resolution analytical techniques such as a gas or liquid chromatography mass spectrometry (GC/MS or LC/MS) to detect small molecules in bio-fluids in a comprehensive manner can expand our knowledge about relationships between small molecules and human health (5, 11, 12).
Advanced and cost-effective nucleic acid sequencing methods can identify rare DNA variants, RNAs, and protein variants to improve our understanding about the development and spread of diseases (13–15). Similarly, untargeted chemical analyses using a high-resolution LC/MS instrument can detect thousands of small molecules in bio-fluid samples and can generate high quality and rich semi-quantitative data to identify and discover new metabolic hypotheses, biomarkers, and risk factors for diseases and biological phenotypes (16–20). In contrast to a targeted assay (21), an untargeted assay aims to detect in an unbiased manner as many possible chemicals present in a bio-fluid sample using a GC/LC-HRMS instrument (18) and such untargeted assays are key methods in exposome research to identify and discover new risk factors and biomarkers for chronic diseases (21–23).
However, untargeted chemical analyses have mandatory laboratory and computational biases (24) which decide the composition of the data matrix that will be used for association analyses. Laboratory biases include the extraction solvent, sample re-suspension method, type of GC or LC column, chromatography gradient, ionization mode and parameters and mass spectrometry detector (25–27). Computational biases include various data processing thresholds that were used during peak detection, peak annotation, alignment and gap filling steps. For the exposome research, it is important that all possible small molecules in a specimen are reliably captured in the data matrix to characterize the dark matter or missing biology of the etiology of human diseases (11). While it is difficult to fix laboratory biases without re-analyzing the bio-fluid samples, computational biases can be readily addressed by reanalyzing collected raw LC/GC-HRMS data with minimum thresholds during data processing steps. Minimizing the effect of these biases can increase the number of chemical signals that can be tested for having an association with a phenotype as highlighted in computational method optimization studies (28–34).
Intensity and detection frequency thresholds during the peak detection and peak alignment steps have the strongest effect (35–37) on the data matrix composition (Figure 1). During the peak detection step, an intensity threshold TH1 rejects mass to charge (m/z) values in each scan, then a peak height threshold TH2 rejects chromatographic peaks in individual LC/MS file. In the next step, peaks are aligned and gap-filled across multiple files if they pass the peak height threshold TH2 in a minimum number of samples defined by a threshold TH3. During the gap-filling process, relaxed criteria are used to recover peaks from raw data. Then finally peaks are rejected if they were found to be missed at a threshold TH4 on an intensity threshold TH5 (Figure 1). While these thresholds are used in almost every untargeted metabolomics study, there are no guidelines and standards to justify them, leading to a large variation in data matrix sizes from one study to another study for the same type of biospecimen (38).
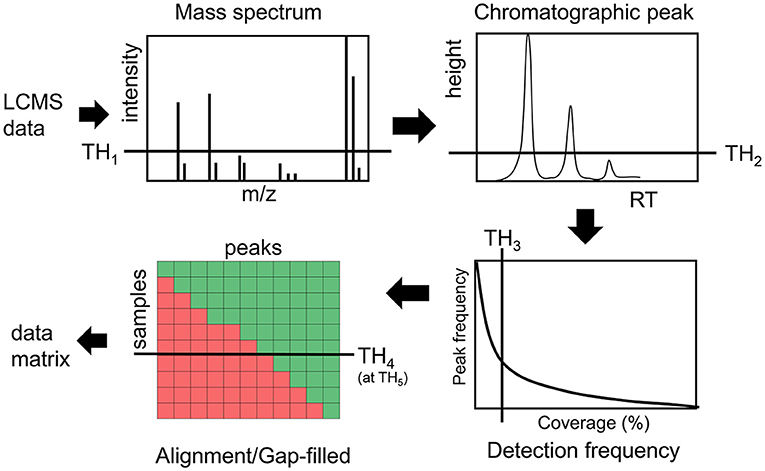
Figure 1. Overview of different thresholds in processing LCMS data in untargeted metabolomics assays.
In this report, we have re-analyzed a publicly available untargeted LC/MS data for 499 cord blood samples (35, 39) using the MS-DIAL software (40) with minimum possible thresholds during data processing, and highlighted how different levels of these thresholds (Figure 2) alter the data matrix composition. We also highlight that a practice of stringent thresholds can miss metabolic hypotheses about a phenotype of interest such as newborn birth weight. Our results underscore the need to avoid or to use minimally possible values for these thresholds when processing untargeted LC/MS datasets for exposomics research.
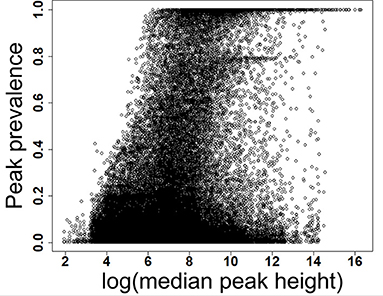
Figure 2. Prevalence of low and high abundant peaks across 499 data files. X-axis shows the scaled detection prevalence, where 1.0 means a peak was detected in all the samples. Y-axis shows the median peak height across all files for a peak. MS-DIAL parameters are available in the Supplementary Table 1.
Methods
Dataset
We have utilized a publicly available large untargeted metabolomics dataset of cord blood (35, 39). The dataset was collected using an Agilent 1290 Infinity Liquid chromatography system connected to an Agilent quadruple time of flight (qToF) 6550 mass spectrometry instrument in the ESI positive mode. The details of the sample preparation, LC and MS conditions are provided in the original article (39) and at the MetaboLights database (accession number MTBLS1684). In brief, metabolites from a cord blood sample were extracted using acetonitrile and separated by ACQUITY UPLC HSS T3 (2.1 × 100 mm, 1.8 μm; Waters) reversed phase column using methanol as solvent B. A pooled QC sample was injected after every 12 injections. The original analysis was conducted using a workflow of the Agilent Qualitative Analysis B.06.00, DA Reprocessor, and Mass Profiler Professional 12.1 software. Briefly, in the original analysis, compounds were detected as proton adducts (M+H)+ using the recursive molecular feature extraction algorithm with a mass intensity threshold of 1,500, a chromatographic peak height threshold of 10,000 and a mass tolerance threshold of 0.0025 for isotope pattern matching. Features that were detected in at least 2% of all the samples were aligned using a RT tolerance of 0.075 and a mass tolerance of 15 ppm + 2 mDA. Aligned features were used as target list for recursive feature extraction using the find by formula algorithm with a mass tolerance of 10 ppm and 0.04 min. Finally, features that would not present in at least 60% of samples were removed.
We have downloaded the raw data files in the Agilent.d format from the EBI MetaboLights database. Data files were converted to the mzML format using the ProteoWizard MSConvert software version 3.0.20183 with binary encoding precision of 64-bit, zlib compression, write index and TPP compatibility enabled. Birth weight data were available for all the samples. Original reported untargeted data matrix was also downloaded from the MetaboLights repository.
LCMS Data Processing
We have used the MS-DIAL software to perform peak-detection, alignment and gap filling for the mzML files. MS-DIAL parameters are provided in the Supplementary Table 1. Key MS-DIAL parameters were—MS1 tolerance: 0.01 Da, Retention time tolerance: 0.05 min, MS1 tolerance: 0.015 Da, N% detected in at least one group: 0, Smoothing method: LinearWeightedMovingAverage, Smoothing level: 3, Minimum Peak Height: 0 and Minimum peak width: 5. Individual peak list for all 499 files and alignment results for peak height were exported tab delimited text files from the MS-DIAL software. Individual peaks lists and the aligned peak table are provided in the Figshare repository at https://doi.org/10.6084/m9.figshare.13564823.v1 and https://doi.org/10.6084/m9.figshare.13564838.v1. MS-DIAL also computed peak height, peak area, signal to noise ratio (S/N) for each detected peak. The % fill value column indicated that proportion of files in which a peak was detected with a high confidence, where 1.0 means the peak was present in all the samples before the gap-filling step. De-isotoping was performed by MS-DIAL with default settings. We did not perform any adduct grouping on the aligned tables, which may have penalized the p-value adjustment for multiple hypotheses testing, however the rank order of top fifty significant peaks and our conclusions are unaffected by it.
Statistics and Graphics
The MS-DIAL generated data matrix was imported in the R software version 4.0.3. For each LC/MS peak, min, max, average and standard deviation were computed after removing the zero values. For the peak list of each file, peak heights were divided into 20 bins and upper boundaries for those bins were obtained. Signal to noise (S/N) ratio as computed by MS-DIAL were extracted from each peak-list and divided into 20 bins similar to the steps taken for peak height summarization. For individual files and the final data-matrix, peak height thresholds of 1,000, 2,000, 5,000, 10,000, and 20,000 were used and corresponding coverage of peaks across all files were obtained. Correlation between the peak height and birth weight was computed using a spearman coefficient for all the peaks. P-values obtained for the spearman analysis were adjusted for multiple hypothesis testing using the Benjamini & Hochberg false discovery rate approach in R. Graphics were prepared by R and Microsoft Excel.
Results
Effect of Peak Height Thresholds on the Peak List at Individual File Level
Descriptive Summary
We have re-analyzed 499 LC/MS data files available from a publicly available cord blood metabolomics study [EBI MetaboLights accession number MTBLS1684 (39)] using MS-DIAL (40), an universal and free software for processing GC and LC/MS data for metabolomics and lipidomics analyses. This study was chosen as a case study because of it's large sample size, but it has a negligible drift in retention time and mass spectrometry signals (Supplementary Figures 1–5). The published data matrix for this study was generated using Agilent Mass Hunter Qual and Mass Profiler Professional software using stringent thresholds for peak detection, alignment, and detection frequency (39) during the data processing workflow (see section Methods). For this case study, MS-DIAL detected an average of 23,156 (±1,385) peaks across all files when the lowest possible thresholds for data processing were used (see section Methods). We have chosen peak height as an abundance indicator for a peak because it is minimally affected by baseline fluctuations in chromatography. For the case study, the highest peak height was 12,392,001, giving the lowest reliable point in the dynamic range as 1,239 peak height because of the four order of dynamic range for Agilent QTOF instruments. Across all the 499 files, 80% of peaks had an average peak height <8,428 (±11.2%), indicating that a vast majority of detected peaks in those files were low abundant (Table 1 and Figure 2) and within the dynamic range of the QTOF instrument.
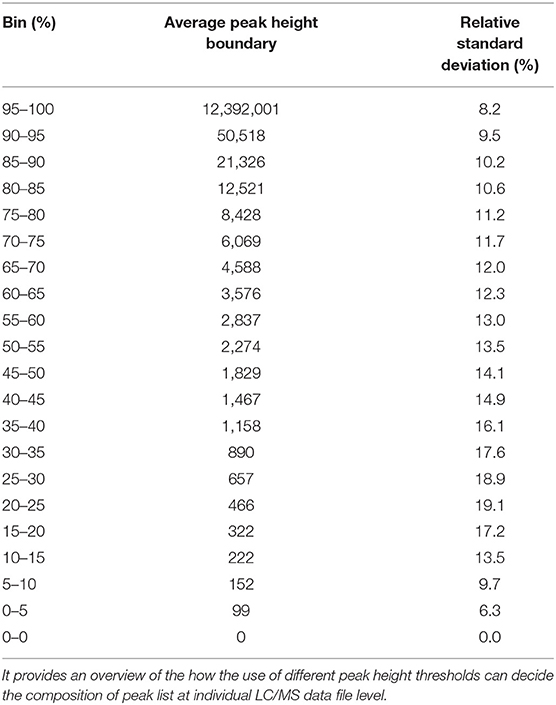
Table 1. Distribution of peak height values across 499 files.
Since, we have used minimally possible thresholds in the data processing to retain low abundant peaks, the data quality of the detected peaks needed to be evaluated. But it is not feasible to manually inspect each peak in each file by plotting an extracted ion chromatogram, so signal to noise ratio (S/N) parameter was used as a gross indicator of the peak quality and tabulated for all detected peaks. We observed that across all the 499 files, at least 50% peaks in each file had a S/N of at least 5, indicating that detected low abundant peaks had a reasonably good quality (Table 2).
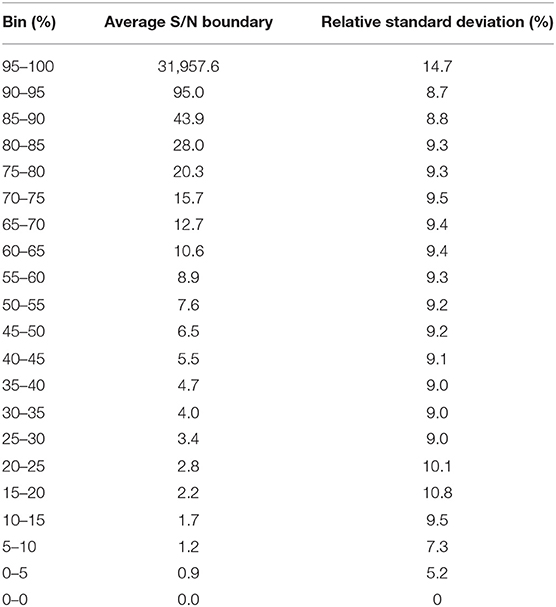
Table 2. Distribution of S/N ratio across 499 files.
Next, we assessed how different peak height thresholds can impact the peak list composition at individual file level by counting the rejected peaks by a threshold and a S/N ratio of at least 2. At the peak height threshold 10,000 which was used by the MassHunter software in the original publication, 64% peaks (Table 3) on average across all files were rejected, suggesting that a majority of low abundant peaks were excluded from the statistical analysis in the original publication.
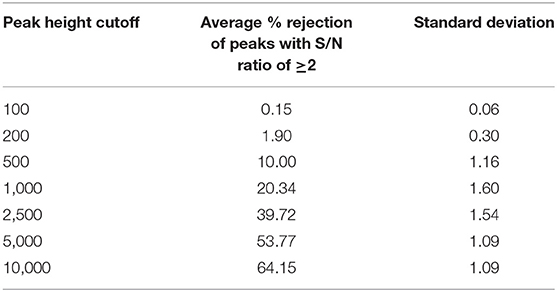
Table 3. Peak rejections by different peak height thresholds on the individual file level.
Effect of Peak Height and Detection Frequency Thresholds on the Aligned Peak Table Composition
For the case study, MS-DIAL generated an aligned and gap filled data matrix which had a total of 63,393 peaks, representing the detected chemical space for the study in a comprehensive manner. We asked how many of those peaks will be rejected from this data matrix if they were not found in at least one LC/MS data file at a peak height threshold (Table 4). At a peak height threshold of 10,000 peak height which was used in the original publication, up to 70% peaks were rejected.
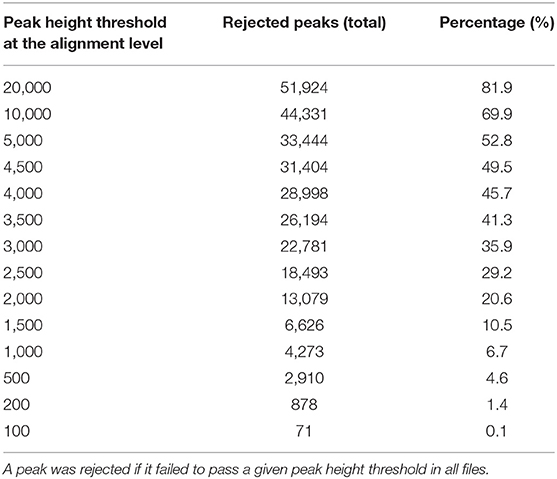
Table 4. Effect of peak height thresholds on the peak rejection at the peak alignment level.
Next, we evaluated that how many peaks will be rejected by a combination of both a detection frequency threshold (TH3) and a peak height threshold (TH2) across all 499 files at the alignment level (Figure 3). We use the MS-DIAL provided % fill property as an indicator of the positive detection of a peak in the sample. On a 2% detection frequency threshold (TH3) along with a 10,000 peak height threshold, as it was used in the original publication, additional 5% peaks were rejected, retaining only 25% peaks at the 10,000 peak height threshold in the aligned peak table.
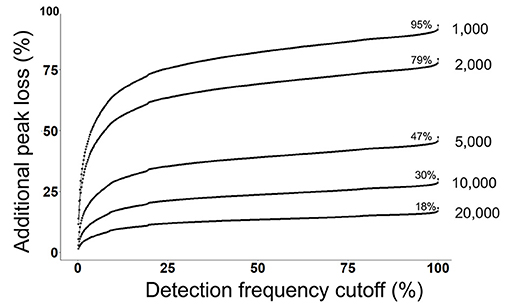
Figure 3. Detection frequency cutoffs and peak rejection in LC/MS data processing. For each peak height cutoff (1,000, 2,000, 5,000, 10,000, and 20,000) (TH2), a count of total retained peaks which were found in at least one sample was obtained as shown by the % values on each curve. Y-axis shows the loss of peaks as a function of detection frequency cutoffs. For example, at a detection frequency cutoff of 50% and peak height cutoff of 10,000, additional 20% peaks will be lost, retaining only 10% peaks.
Commonly used statistical methods and data normalization strategies require that input data matrices are not sparse, therefore missing values are replaced with an imputed value (41). The input for missing value imputation is generated by constraining the aligned peak table by a global peak detection frequency threshold (TH4). Often, peaks that were missing in >50% samples in the aligned table are rejected before the missing value imputation step. For the case study, in the original publication, peaks were rejected if they were not found in at least 60% of samples. At this threshold, 20% additional peaks were rejected, leaving only 10% peaks that have passed the 10,000 peak height cutoffs (Figure 3).
Overall, a combination of peak height (TH2) and detection frequency thresholds (TH3 and TH4) that were used in the original publication has rejected 90% of peaks which were defined by MS-DIAL for the case study. These results suggest that the informatics strategy that was used in the publication may have missed many metabolic hypotheses in relation to birth weight.
Data Processing Thresholds and Missed Biological Insights
Next, we asked if any of the rejected peaks were associated with birth weight by computing spearman correlation co-efficient between peak height of each peak and birth weight data. Since, none of the co-variate data for the study participants were publicly available at the MetaboLights entry for the study, the correlation analysis can be considered as a crude or un-adjusted linear regression model. The correlation analysis suggested that 623 peaks in the complete aligned peak table were significantly associated with birth weight after adjusting for multiple hypothesis testing by a false discovery rate (FDR) cutoff of 0.05. On a peak height threshold of 10,000, 80% of those significant peaks were rejected (Figure 4) which was consistent with the overall peak rejection rate (Figure 3). The results highlighted that a combination of peak height and detection frequency thresholds has rejected peaks that indicated significant associations between metabolic pathways and birth weight.
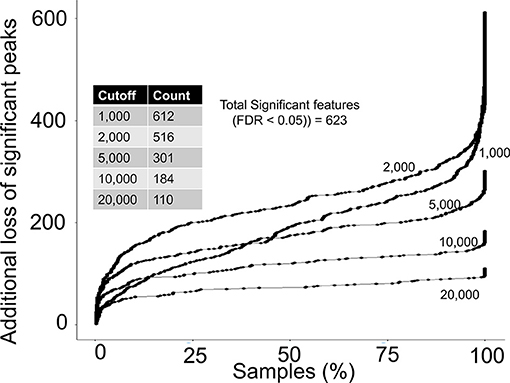
Figure 4. Rejection of biological relevant peaks by peak height and detection frequency thresholds. For each peak height threshold (1,000, 2,000, 5,000, 10,000, and 20,000), a count of total peaks that were associated with birth weight are shown in the inside table. Y-axis shows the additional loss of peaks as a function of detection frequency cutoffs. For example, at a detection frequency cutoff of 50% and peak height cutoff of 10,000, additional 100 significant peaks will be lost, yielding retainment of only 84 peaks.
A complete list of peaks that were significantly associated with birth weight is provided in Supplementary Table 2. Top 50 significant peaks are shown in the Table 5 to demonstrate few examples of missed metabolic insights because of stringent data processing thresholds. First three peaks share the same retention time, suggesting they may have fragmented from a single compound in the ESI ion-source. The peak of m/z 412.3035 and RT 5.75 min is a putative hydroxy acyl-carnitine, indicating that acyl coenzyme A-dehydrogenases may play a role in birth weight. The peak of m/z 289.2162 and RT 4.83 min. is a putative C19 steroid hormone, probably testosterone which have been previously linked with birth weight (42–44). Both of these peaks passed the 60% coverage cutoff (TH4) but failed to pass the 10,000 peak height in 2% sample cutoff (TH3) and therefore were missed in the original publication's statistical analysis (Table 5). Querying the m/z values for top 50 peaks against the Metabolomics Workbench RefMet database (45) suggested that a majority of them belong to lipid, acyl-carnitine and aromatic chemical classes. We cannot confidently annotate these peaks with chemical structures without analyzing the authentic standards using the same analytical conditions, these suggestive chemical annotations can be useful to derive new metabolic hypotheses for the birth weight and to conduct follow up studies.
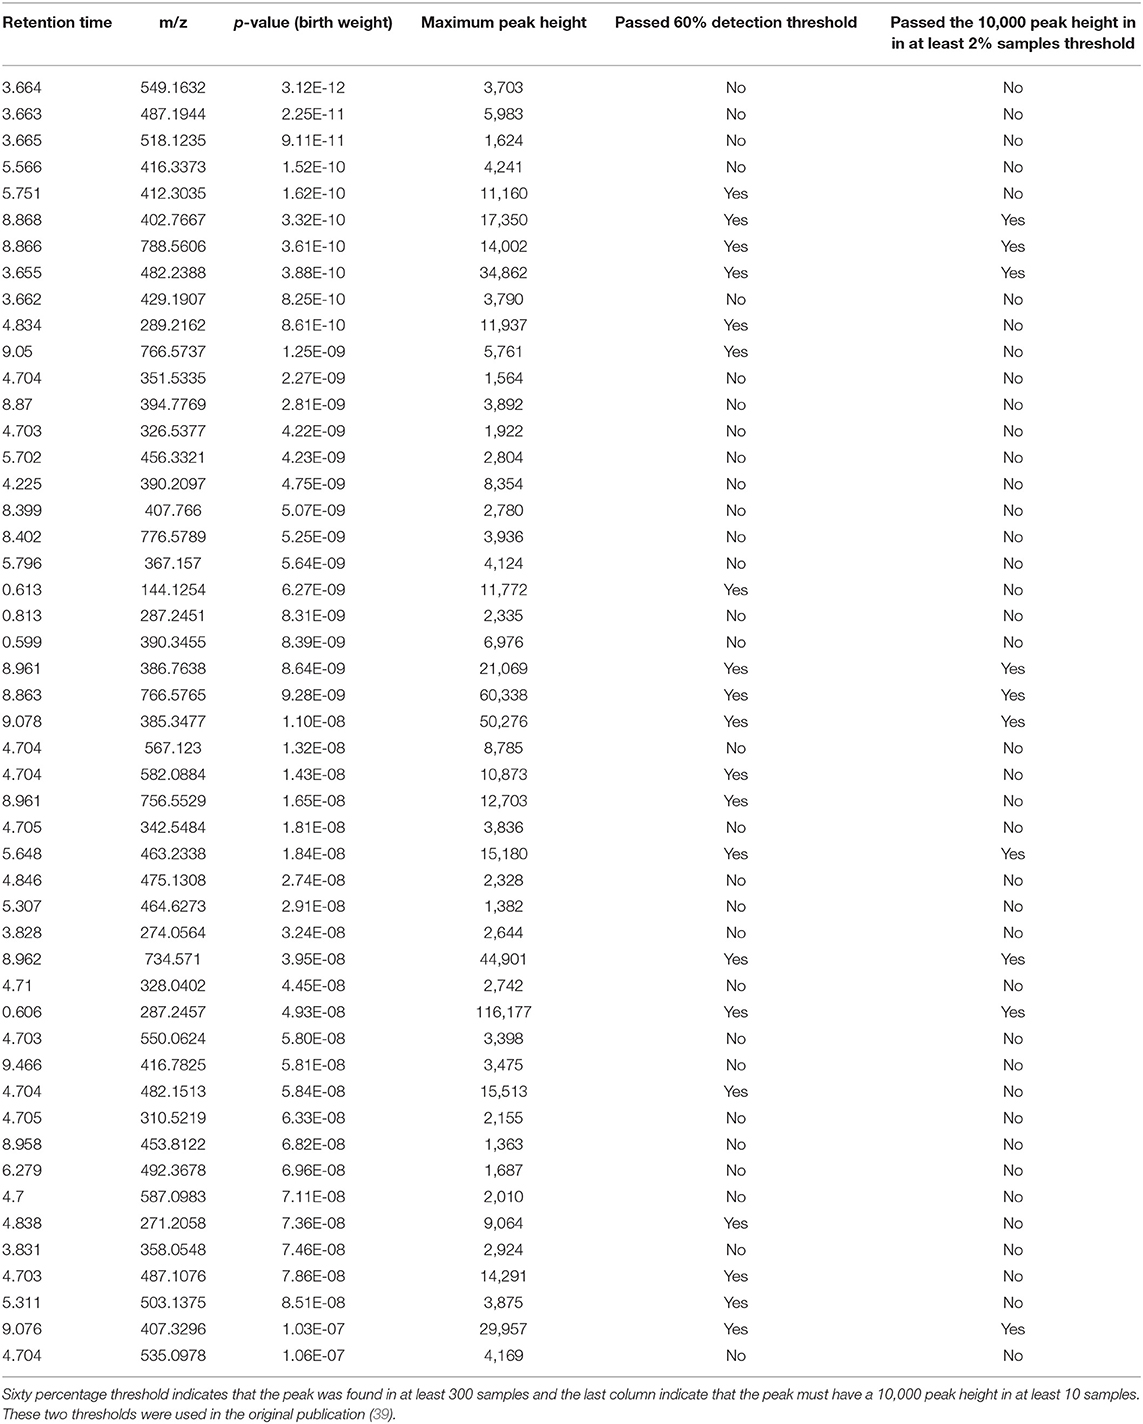
Table 5. Top 50 peaks that were significantly associated with birth weight using a spearman correlation coefficient corrected for multiple hypothesis testing using the FDR approach.
Discussion
Untargeted chemical analysis of blood specimens has a great potential in the exposome research to expand our understanding about the hazardous effect of chemical exposures, to identify risk factors for disease and to identify biomarkers for physiological disturbances. Our analysis highlights how various data processing thresholds affect the comprehensiveness of the data matrix in untargeted chemical analysis of human blood samples in a large epidemiology scale study. Our key conclusion is that to maximize the impact of untargeted chemical analyses in the exposome and in broader metabolomics research, different thresholds that are used in the data processing workflows (Figure 1) should be avoided or used at a minimally possible level. We have shown that how a combination of these thresholds has rejected peaks that could provide new insights into the biological relationships among C19 hormone, hydroxylated acyl-carnitines and birth weight. Poorly explored and under-represented untargeted chemical analysis datasets are missing opportunities to expand our understanding about hazardous effect of chemical on human health.
Low abundant and non-ubiquitous signals precisely reflect the exposome phenotype of an individual (46). Small molecules at a low concentration tends to carry more risk for diseases (47, 48), need regulatory guidelines and biomonitoring (49, 50), are biologically more active and several are toxic. Whereas, high abundant and ubiquitous small molecules in blood are originating from normal endogenous metabolic pathways, carry less risk and are less toxic (11, 51). Data processing thresholds can inappropriately reject peaks for these highly relevant compounds in the former category for exposome research. A previous study has highlighted the negative effect of these thresholds on comprehensiveness (52) of untargeted data matrices, but it has not yet been demonstrated for a large-scale study with ~500 samples.
A highly sparse data matrix with the peak distribution skewed toward low abundant peaks realistically represent the expected blood exposome in an epidemiology study. There are several reasons to support it. (1) limit of detection for the method and analytical instruments so a peak will be detected only in samples in which it was sufficiently abundant (2) many endogenous compounds are found at the low abundant level because of the evolutionary advantages of enzyme promiscuity, providing structurally diverse low abundant compounds (53–55) (3) intermediate substrates in a metabolic pathways have a short life-time and less accumulation because of high affinity of enzymes in non-rate limited steps (4) many compounds are not ubiquitous and show a tissue and organ specificity so they can only be detected in blood samples from individuals with organ specific damages (56). (5) Exogenous compounds correlate with diet, exposures and other lifestyle factors which are known to vary greatly among general population (5). Therefore, for a blood or urine analysis, it is expected that many small molecules will be found in few samples and often on the low abundance levels.
A majority of exposome chemicals are at low abundance and tend to be less ubiquitous (46). It is a common situation that exposures above a threshold level can be present in blood specimens for only a few individuals (57, 58) and majority of the population will not be exposed to certain chemical unless we are studying a focused population such as metal-industry workers and firefighters. It is known that commonly used LC/MS instruments can have a four to five orders of dynamic range (52) and limit of detection (LoD) for an untargeted assay can be 0.02 ng/l for environmental pollutants (59). Any chemical compound present in a human biospecimen can be considered an exposure for an exposome wide-association study and a 11-order magnitude of concentration range is expected for compounds in the human blood (11). An untargeted LC/MS assays using an instrument having 4–5 order dynamic range and an optimized sample preparation can cover a significant portion of the exposome and metabolome, but a use of higher intensity thresholds and detection frequency threshold can miss many relevant compounds that were actually presented in the raw data. Merely, the presence of a hazardous chemical in an untargeted chemical analysis data of a blood specimen can be alarming since it shows that the level is higher than the expected LoD of that assay which can be higher than the safe level of an exposure.
We acknowledge that the annotation of low abundant peaks is a major challenge in the field of metabolomics and exposomics. It needs a holistic approach to get proper experimental MS/MS spectra and to prioritize their candidate structures for a confirmation by authentic standards (60–62). Furthermore, several detected peaks can correspond to in-source fragments, artifact and solvent contaminants, and removal to those peaks require a data filtering strategy such as blank subtraction or filtering by inconsistent intensities in a quality control sample. However, a peak that is strongly associated with a phenotype of interest will unlikely to be corresponding to a non-biological chemical compound. The critical limitation of a quality control (QC) sample based filtering and normalization approach is that it does not work for sparse matrices and excludes compounds that are low abundant and have a lower detection frequency. Our analysis underscores the need for development of data normalization strategies for sparse matrices which may or may not have a compound present in a QC sample.
Because quality control or blank samples were not submitted in the EBI Metabolights entry for the study, we are limited in terms of filtering data by additional methods. But a negligible drift in the ESI signal in total ion chromatograms and extracted ion chromatograms across 499 files was observed (Supplementary Figures 1, 2), suggesting that a QC based correction was not needed for this study and importantly a peak that is significantly associated with a phenotype will have a minimum likelihood of being falsely detected. MS-DIAL may have included some spurious peaks in the data matrix because of lower TH1–TH4 thresholds. However, the gain of using minimum levels of these thresholds out-weighs the risks of having few extra spurious peaks, as it finds more potential biomarkers and the ones that are strongly correlated with a phenotype as we have shown in the manuscript. Since, the primary application of untargeted LC-MS assays is to generate new hypotheses, a false-negative rate is more concerning.
These data processing thresholds were originally developed for processing untargeted chemical analysis data to study central metabolic pathways or universal pathway such as Krebs cycle intermediates (63) or lipid metabolites (64–66), but exposome research warrants that we detect and report all the chemicals present in the untargeted data at any possible level and at even in one sample. There has been development in the direction to build automated workflows that reject peaks using machine learning models (67) and rule based approaches (68), and those tools can be used to filter out low abundant peaks with a poor quality.
Conclusion
Low abundant and less ubiquitous compounds in untargeted chemical analysis is an under-mined repertoire of missing biology and metabolic hypotheses in the metabolomics and exposome research. However, use of different thresholds during peak detection, alignment and statistics steps to reject LC/MS peaks constraints the untargeted analysis to only ubiquitous and core metabolic pathways. Therefore, for the exposome research, untargeted chemical analysis data matrices should be generated using minimally or no thresholds during data processing which can be achieved using MS-DIAL, a freely available software for processing epidemiology scale untargeted LC/MS datasets. A re-analysis of the case study data suggests a role of C19 steroids and acetyl dehydrogenase enzymes in regulating the birth weight, a biological insight that was missed in the original publication.
Data Availability Statement
The case study are available at the Metabolights database with accession number MTBLS1684. Peak lists generated by MS-DIAL are available in the Figshare repository https://doi.org/10.6084/m9.figshare.13564823.v1. Additional data are provided in the Supplementary Material of the paper.
Author Contributions
DB and SB planned and conducted the analysis. All authors contributed to the manuscript writing.
Funding
This work was supported by NIH grant U2CES026561, P30ES009089, U2CES030859, U2CES026555, and UL1TR001433.
Conflict of Interest
The authors declare that the research was conducted in the absence of any commercial or financial relationships that could be construed as a potential conflict of interest.
Supplementary Material
The Supplementary Material for this article can be found online at: https://www.frontiersin.org/articles/10.3389/fpubh.2021.653599/full#supplementary-material
Supplementary Figure 1. A negligible drift in the ESI signal across 499 files. Calibration compound (m/z = 922.0098) was injected on a constant flow rate by a secondary HPLC pump directly into the ESI ion-source. In case of a significant signal drift, a gray to black gradient in this plot would appear according to the injection order. Absence of such gradient shows a negligible signal drift in the study.
Supplementary Figure 2. A negligible drift in the ESI signal across 499 files as demonstrated by overlaying total ion chromatograms. In case of a significant signal drift, a gray to black gradient in this plot would appear according to the injection order. Absence of such gradient shows a negligible signal drift in the study.
Supplementary Figure 3. Demonstration of a negligible drift in retention time for the peak of PC 32:0 (m/z 734.57).
Supplementary Figure 4. Demonstration of a negligible drift in retention time for the peak of tryptophan (m/z 205.0976).
Supplementary Figure 5. Demonstration of a negligible drift in retention time for the peak of AC 16:1 (m/z 398.3264).
Supplementary Table 1. MS-DIAL parameters that were used for processing the LCMS data files.
Supplementary Table 2. Correlation between birth weight and LC/MS peaks as computed by the spearman correlation coefficient.
References
1. Wishart DS, Feunang YD, Marcu A, Guo AC, Liang K, Vazquez-Fresno R, et al. HMDB 4.0: the human metabolome database for 2018. Nucleic Acids Res. (2018) 46:D608–17. doi: 10.1093/nar/gkx1089
2. Dai Y, Huo X, Cheng Z, Faas MM, Xu X. Early-life exposure to widespread environmental toxicants and maternal-fetal health risk: a focus on metabolomic biomarkers. Sci Total Environ. (2020) 739:139626. doi: 10.1016/j.scitotenv.2020.139626
3. Warrington NM, Beaumont RN, Horikoshi M, Day FR, Helgeland O, Laurin C, et al. Maternal and fetal genetic effects on birth weight and their relevance to cardio-metabolic risk factors. Nat Genet. (2019) 51:804–14. doi: 10.1038/s41588-019-0403-1
4. Sovio U, Goulding N, McBride N, Cook E, Gaccioli F, Charnock-Jones DS, et al. A maternal serum metabolite ratio predicts fetal growth restriction at term. Nat Med. (2020) 26:348–53. doi: 10.1038/s41591-020-0804-9
5. Bar N, Korem T, Weissbrod O, Zeevi D, Rothschild D, Leviatan S, et al. A reference map of potential determinants for the human serum metabolome. Nature. (2020) 588:135–40. doi: 10.1038/s41586-020-2896-2
6. van Duynhoven J, Vaughan EE, Jacobs DM, Kemperman RA, van Velzen EJ, Gross G, et al. Metabolic fate of polyphenols in the human superorganism. Proc Natl Acad Sci USA. (2011) 108 (Suppl. 1):4531–8. doi: 10.1073/pnas.1000098107
7. Madeen EP, Ognibene TJ, Corley RA, McQuistan TJ, Henderson MC, Baird WM, et al. Human microdosing with carcinogenic polycyclic aromatic hydrocarbons: in vivo pharmacokinetics of Dibenzo[def,p]chrysene and metabolites by UPLC accelerator mass spectrometry. Chem Res Toxicol. (2016) 29:1641–50. doi: 10.1021/acs.chemrestox.6b00169
8. Vermeulen R, Schymanski EL, Barabasi AL, Miller GW. The exposome and health: where chemistry meets biology. Science. (2020) 367:392–6. doi: 10.1126/science.aay3164
9. Niedzwiecki MM, Walker DI, Vermeulen R, Chadeau-Hyam M, Jones DP, Miller GW. The exposome: molecules to populations. Annu Rev Pharmacol Toxicol. (2019) 59:107–27. doi: 10.1146/annurev-pharmtox-010818-021315
10. Rappaport SM. Genetic factors are not the major causes of chronic diseases. PLoS ONE. (2016) 11:e0154387. doi: 10.1371/journal.pone.0154387
11. Rappaport SM, Barupal DK, Wishart D, Vineis P, Scalbert A. The blood exposome and its role in discovering causes of disease. Environ Health Perspect. (2014) 122:769–74. doi: 10.1289/ehp.1308015
12. Germain A, Barupal DK, Levine SM, Hanson MR. Comprehensive Circulatory metabolomics in ME/CFS reveals disrupted metabolism of acyl lipids and steroids. Metabolites. (2020) 10:34. doi: 10.3390/metabo10010034
13. Bailey MH, Meyerson WU, Dursi LJ, Wang LB, Dong G, Liang WW, et al. Retrospective evaluation of whole exome and genome mutation calls in 746 cancer samples. Nat Commun. (2020) 11:4748. doi: 10.1038/s41467-020-18151-y
14. Foley SB, Rios JJ, Mgbemena VE, Robinson LS, Hampel HL, Toland AE, et al. Use of whole genome sequencing for diagnosis and discovery in the cancer genetics clinic. EBioMedicine. (2015) 2:74–81. doi: 10.1016/j.ebiom.2014.12.003
15. Consortium ITP-CAoWG. Pan-cancer analysis of whole genomes. Nature. (2020) 578:82–93. doi: 10.1038/s41586-020-1969-6
16. Stepien M, Keski-Rahkonen P, Kiss A, Robinot N, Duarte-Salles T, Murphy N, et al. Metabolic perturbations prior to hepatocellular carcinoma diagnosis: findings from a prospective observational cohort study. Int J Cancer. (2021) 148:609–25. doi: 10.1002/ijc.33236
17. Niedzwiecki MM, Walker DI, Howell JC, Watts KD, Jones DP, Miller GW, et al. High-resolution metabolomic profiling of Alzheimer's disease in plasma. Ann Clin Transl Neurol. (2020) 7:36–45. doi: 10.1002/acn3.50956
18. Walker DI, Uppal K, Zhang L, Vermeulen R, Smith M, Hu W, et al. High-resolution metabolomics of occupational exposure to trichloroethylene. Int J Epidemiol. (2016) 45:1517–27. doi: 10.1093/ije/dyw218
19. Liang D, Moutinho JL, Golan R, Yu T, Ladva CN, Niedzwiecki M, et al. Use of high-resolution metabolomics for the identification of metabolic signals associated with traffic-related air pollution. Environ Int. (2018) 120:145–54. doi: 10.1016/j.envint.2018.07.044
20. Vlaanderen JJ, Janssen NA, Hoek G, Keski-Rahkonen P, Barupal DK, Cassee FR, et al. The impact of ambient air pollution on the human blood metabolome. Environ Res. (2017) 156:341–8. doi: 10.1016/j.envres.2017.03.042
21. Gonzalez-Dominguez R, Jauregui O, Queipo-Ortuno MI, Andres-Lacueva C. Characterization of the human exposome by a comprehensive and quantitative large-scale multianalyte metabolomics platform. Anal Chem. (2020) 92:13767–75. doi: 10.1021/acs.analchem.0c02008
22. Andra SS, Austin C, Patel D, Dolios G, Awawda M, Arora M. Trends in the application of high-resolution mass spectrometry for human biomonitoring: an analytical primer to studying the environmental chemical space of the human exposome. Environ Int. (2017) 100:32–61. doi: 10.1016/j.envint.2016.11.026
23. Oresic M, McGlinchey A, Wheelock CE, Hyotylainen T. Metabolic signatures of the exposome-quantifying the impact of exposure to environmental chemicals on human health. Metabolites. (2020) 10:454. doi: 10.3390/metabo10110454
24. Rampler E, Abiead YE, Schoeny H, Rusz M, Hildebrand F, Fitz V, et al. Recurrent topics in mass spectrometry-based metabolomics and lipidomics-standardization, coverage, and throughput. Anal Chem. (2020) 93:519–45. doi: 10.1021/acs.analchem.0c04698
25. Cajka T, Fiehn O. Toward merging untargeted and targeted methods in mass spectrometry-based metabolomics and lipidomics. Anal Chem. (2016) 88:524–45. doi: 10.1021/acs.analchem.5b04491
26. Lu W, Su X, Klein MS, Lewis IA, Fiehn O, Rabinowitz JD. Metabolite measurement: pitfalls to avoid and practices to follow. Annu Rev Biochem. (2017) 86:277–304. doi: 10.1146/annurev-biochem-061516-044952
27. Tulipani S, Llorach R, Urpi-Sarda M, Andres-Lacueva C. Comparative analysis of sample preparation methods to handle the complexity of the blood fluid metabolome: when less is more. Anal Chem. (2013) 85:341–8. doi: 10.1021/ac302919t
28. Chaker J, Gilles E, Leger T, Jegou B, David A. From metabolomics to HRMS-based exposomics: adapting peak picking and developing scoring for MS1 suspect screening. Anal Chem. (2020) 93:1792–800. doi: 10.1021/acs.analchem.0c04660
29. Libiseller G, Dvorzak M, Kleb U, Gander E, Eisenberg T, Madeo F, et al. IPO: a tool for automated optimization of XCMS parameters. BMC Bioinformatics. (2015) 16:118. doi: 10.1186/s12859-015-0562-8
30. Alboniga OE, Gonzalez O, Alonso RM, Xu Y, Goodacre R. Optimization of XCMS parameters for LC-MS metabolomics: an assessment of automated versus manual tuning and its effect on the final results. Metabolomics. (2020) 16:14. doi: 10.1007/s11306-020-1636-9
31. McLean C, Kujawinski EB. AutoTuner: high fidelity and robust parameter selection for metabolomics data processing. Anal Chem. (2020) 92:5724–32. doi: 10.1021/acs.analchem.9b04804
32. von Eyken A, Bayen S. Optimization of the data treatment steps of a non-targeted LC-MS-based workflow for the identification of trace chemical residues in honey. J Am Soc Mass Spectrom. (2019) 30:765–77. doi: 10.1007/s13361-019-02157-y
33. Eliasson M, Rannar S, Madsen R, Donten MA, Marsden-Edwards E, Moritz T, et al. Strategy for optimizing LC-MS data processing in metabolomics: a design of experiments approach. Anal Chem. (2012) 84:6869–76. doi: 10.1021/ac301482k
34. Zheng H, Clausen MR, Dalsgaard TK, Mortensen G, Bertram HC. Time-saving design of experiment protocol for optimization of LC-MS data processing in metabolomic approaches. Anal Chem. (2013) 85:7109–16. doi: 10.1021/ac4020325
35. Robinson O, Keski-Rahkonen P, Chatzi L, Kogevinas M, nawrot t, pizzi c, et al. cord blood Metabolic Signatures of Birth Weight: A Population-Based Study. J Proteome Res. (2018) 17:1235–47. doi: 10.1021/acs.jproteome.7b00846
36. van Veldhoven K, Keski-Rahkonen P, Barupal DK, Villanueva CM, Font-Ribera L, Scalbert A, et al. Effects of exposure to water disinfection by-products in a swimming pool: a metabolome-wide association study. Environ Int. (2018) 111:60–70. doi: 10.1016/j.envint.2017.11.017
37. Tugizimana F, Steenkamp PA, Piater LA, Dubery IA. A conversation on data mining strategies in LC-MS untargeted metabolomics: pre-processing and pre-treatment steps. Metabolites. (2016) 6:40. doi: 10.3390/metabo6040040
38. Sud M, Fahy E, Cotter D, Azam K, Vadivelu I, Burant C, et al. Metabolomics workbench: an international repository for metabolomics data and metadata, metabolite standards, protocols, tutorials and training, and analysis tools. Nucleic Acids Res. (2016) 44:D463–70. doi: 10.1093/nar/gkv1042
39. Alfano R, Chadeau-Hyam M, Ghantous A, Keski-Rahkonen P, Chatzi L, Perez AE, et al. A multi-omic analysis of birthweight in newborn cord blood reveals new underlying mechanisms related to cholesterol metabolism. Metabolism. (2020) 110:154292. doi: 10.1016/j.metabol.2020.154292
40. Tsugawa H, Cajka T, Kind T, Ma Y, Higgins B, Ikeda K, et al. MS-DIAL: data-independent MS/MS deconvolution for comprehensive metabolome analysis. Nat Methods. (2015) 12:523–6. doi: 10.1038/nmeth.3393
41. Do KT, Wahl S, Raffler J, Molnos S, Laimighofer M, Adamski J, et al. Characterization of missing values in untargeted MS-based metabolomics data and evaluation of missing data handling strategies. Metabolomics. (2018) 14:128. doi: 10.1007/s11306-018-1420-2
42. Svensson K, Just AC, Fleisch AF, Sanders AP, Tamayo-Ortiz M, Baccarelli AA, et al. Prenatal salivary sex hormone levels and birth-weight-for-gestational age. J Perinatol. (2019) 39:941–8. doi: 10.1038/s41372-019-0385-y
43. Voegtline KM, Costigan KA, Kivlighan KT, Henderson JL, DiPietro JA. Sex-specific associations of maternal prenatal testosterone levels with birth weight and weight gain in infancy. J Dev Orig Health Dis. (2013) 4:280–4. doi: 10.1017/S2040174413000135
44. Chinnathambi V, Blesson CS, Vincent KL, Saade GR, Hankins GD, Yallampalli C, et al. Elevated testosterone levels during rat pregnancy cause hypersensitivity to angiotensin II and attenuation of endothelium-dependent vasodilation in uterine arteries. Hypertension. (2014) 64:405–14. doi: 10.1161/HYPERTENSIONAHA.114.03283
45. Fahy E, Subramaniam S. RefMet: a reference nomenclature for metabolomics. Nat Methods. (2020) 17:1173–4. doi: 10.1038/s41592-020-01009-y
46. Patel CJ, Pho N, McDuffie M, Easton-Marks J, Kothari C, Kohane IS, et al. A database of human exposomes and phenomes from the US national health and nutrition examination survey. Sci Data. (2016) 3:160096. doi: 10.1038/sdata.2016.96
47. Nemet I, Saha PP, Gupta N, Zhu W, Romano KA, Skye SM, et al. A cardiovascular disease-linked gut microbial metabolite acts via adrenergic receptors. Cell. (2020) 180:862–77.e22. doi: 10.1016/j.cell.2020.02.016
48. Muraleedharan V, Marsh H, Kapoor D, Channer KS, Jones TH. Testosterone deficiency is associated with increased risk of mortality and testosterone replacement improves survival in men with type 2 diabetes. Eur J Endocrinol. (2013) 169:725–33. doi: 10.1530/EJE-13-0321
49. Apel P, Rousselle C, Lange R, Sissoko F, Kolossa-Gehring M, Ougier E. Human biomonitoring initiative (HBM4EU) - strategy to derive human biomonitoring guidance values (HBM-GVs) for health risk assessment. Int J Hyg Environ Health. (2020) 230:113622. doi: 10.1016/j.ijheh.2020.113622
50. Lehmler HJ, Simonsen D, Liu B, Bao W. Environmental exposure to pyrethroid pesticides in a nationally representative sample of U.S. adults and children: The National Health and Nutrition Examination Survey 2007-2012. Environ Pollut. (2020) 267:115489. doi: 10.1016/j.envpol.2020.115489
51. Fages A, Duarte-Salles T, Stepien M, Ferrari P, Fedirko V, Pontoizeau C, et al. Metabolomic profiles of hepatocellular carcinoma in a European prospective cohort. BMC Med. (2015) 13:242. doi: 10.1186/s12916-015-0462-9
52. Zhang X, Dong J, Raftery D. Five easy metrics of data quality for LC-MS-based global metabolomics. Anal Chem. (2020) 92:12925–33. doi: 10.1021/acs.analchem.0c01493
53. Khersonsky O, Tawfik DS. Enzyme promiscuity: a mechanistic and evolutionary perspective. Annu Rev Biochem. (2010) 79:471–505. doi: 10.1146/annurev-biochem-030409-143718
54. Fiehn O, Barupal DK, Kind T. Extending biochemical databases by metabolomic surveys. J Biol Chem. (2011) 286:23637–43. doi: 10.1074/jbc.R110.173617
55. Peracchi A. The limits of enzyme specificity and the evolution of metabolism. Trends Biochem Sci. (2018) 43:984–96. doi: 10.1016/j.tibs.2018.09.015
56. Anthonymuthu TS, Kenny EM, Lamade AM, Gidwani H, Krehel NM, Misse A, et al. Lipidomics detection of brain cardiolipins in plasma is associated with outcome after cardiac arrest. Crit Care Med. (2019) 47:e292–300. doi: 10.1097/CCM.0000000000003636
57. Mahfuz M, Alam MA, Fahim SM, Gazi MA, Raihan MJ, Hossain M, et al. Aflatoxin exposure in children living in Mirpur, Dhaka: data from MAL-ED companion study. J Expo Sci Environ Epidemiol. (2019) 29:655–62. doi: 10.1038/s41370-018-0066-5
58. Gerona RR, Schwartz JM, Pan J, Friesen MM, Lin T, Woodruff TJ. Suspect screening of maternal serum to identify new environmental chemical biomonitoring targets using liquid chromatography-quadrupole time-of-flight mass spectrometry. J Expo Sci Environ Epidemiol. (2018) 28:101–8. doi: 10.1038/jes.2017.28
59. Chen Z, Yang T, Walker DI, Thomas DC, Qiu C, Chatzi L, et al. Dysregulated lipid and fatty acid metabolism link perfluoroalkyl substances exposure and impaired glucose metabolism in young adults. Environ Int. (2020) 145:106091. doi: 10.1016/j.envint.2020.106091
60. Vasilopoulou CG, Sulek K, Brunner AD, Meitei NS, Schweiger-Hufnagel U, Meyer SW, et al. Trapped ion mobility spectrometry and PASEF enable in-depth lipidomics from minimal sample amounts. Nat Commun. (2020) 11:331. doi: 10.1038/s41467-019-14044-x
61. Shen X, Wang R, Xiong X, Yin Y, Cai Y, Ma Z, et al. Metabolic reaction network-based recursive metabolite annotation for untargeted metabolomics. Nat Commun. (2019) 10:1516. doi: 10.1038/s41467-019-09550-x
62. Duhrkop K, Nothias LF, Fleischauer M, Reher R, Ludwig M, Hoffmann MA, et al. Systematic classification of unknown metabolites using high-resolution fragmentation mass spectra. Nat Biotechnol. (2020) 39:462–471. doi: 10.1038/s41587-020-0740-8
63. Fiehn O. Metabolomics by gas chromatography-mass spectrometry: combined targeted and untargeted profiling. Curr Protoc Mol Biol. (2016) 114:30.4.1–4.2. doi: 10.1002/0471142727.mb3004s114
64. Camera E, Ludovici M, Tortorella S, Sinagra JL, Capitanio B, Goracci L, et al. Use of lipidomics to investigate sebum dysfunction in juvenile acne. J Lipid Res. (2016) 57:1051–8. doi: 10.1194/jlr.M067942
65. Perttula K, Schiffman C, Edmands WMB, Petrick L, Grigoryan H, Cai X, et al. Untargeted lipidomic features associated with colorectal cancer in a prospective cohort. BMC Cancer. (2018) 18:996. doi: 10.1186/s12885-018-4894-4
66. Kennedy AD, Pappan KL, Donti TR, Evans AM, Wulff JE, Miller LAD, et al. Elucidation of the complex metabolic profile of cerebrospinal fluid using an untargeted biochemical profiling assay. Mol Genet Metab. (2017) 121:83–90. doi: 10.1016/j.ymgme.2017.04.005
67. Chetnik K, Petrick L, Pandey G. MetaClean: a machine learning-based classifier for reduced false positive peak detection in untargeted LC-MS metabolomics data. Metabolomics. (2020) 16:117. doi: 10.1007/s11306-020-01738-3
Keywords: LC/MS, exposome, metabolomics, untargeted chemical analysis, birth weight
Citation: Barupal DK, Baygi SF, Wright RO and Arora M (2021) Data Processing Thresholds for Abundance and Sparsity and Missed Biological Insights in an Untargeted Chemical Analysis of Blood Specimens for Exposomics. Front. Public Health 9:653599. doi: 10.3389/fpubh.2021.653599
Received: 14 January 2021; Accepted: 19 May 2021;
Published: 10 June 2021.
Edited by:
Alexandros Siskos, Imperial College London, United KingdomReviewed by:
Elizabeth Joy Want, Imperial College London, United KingdomHiroshi Tsugawa, RIKEN, Japan
Copyright © 2021 Barupal, Baygi, Wright and Arora. This is an open-access article distributed under the terms of the Creative Commons Attribution License (CC BY). The use, distribution or reproduction in other forums is permitted, provided the original author(s) and the copyright owner(s) are credited and that the original publication in this journal is cited, in accordance with accepted academic practice. No use, distribution or reproduction is permitted which does not comply with these terms.
*Correspondence: Dinesh Kumar Barupal, ZGluZXNoLmt1bWFyQG1zc20uZWR1