- 1Department of Epidemiology, University Medical Center Groningen, University of Groningen, Groningen, Netherlands
- 2Department of Social Epidemiology and Health Policy, University of Antwerp, Antwerp, Belgium
- 3Department of Public Health and Primary Care, Ghent University, Ghent, Belgium
- 4Center for Cancer Detection, Flanders, Belgium
- 5Department of Radiology, University Medical Center Groningen, University of Groningen, Groningen, Netherlands
- 6Department of Robotics and Mechatronics, University of Twente, Enschede, Netherlands
- 7Research Department, Belgian Cancer Registry, Brussels, Belgium
Background: In Flanders, breast cancer (BC) screening is performed in a population-based breast cancer screening program (BCSP), as well as in an opportunistic setting. Women with different socio-demographic characteristics are not equally covered by BC screening.
Objective: To evaluate the role of socio-demographic characteristics on the lowest 10th and highest 90th quantile levels of BC screening coverage.
Methods: The 2017 neighborhood-level coverage rates of 8,690 neighborhoods with women aged 50–69 and eligible for BCSP and opportunistic screening were linked to socio-demographic data. The association between socio-demographic characteristics and the coverage rates of BCSP and opportunistic screening was evaluated per quantile of coverage using multivariable quantile regression models, with specific attention to the lowest 10th and highest 90th quantiles.
Results: The median coverage in the BCSP was 50%, 33.5% in the 10th quantile, and 64.5% in the 90th quantile. The median coverage of the opportunistic screening was 12, 4.2, and 24.8% in the 10th and 90th quantile, respectively. A lower coverage of BCSP was found in neighborhoods with more foreign residents and larger average household size, which were considered indicators for a lower socioeconomic status (SES). However, a higher average personal annual income, which was considered an indicator for a higher SES, was also found in neighborhoods with lower coverage of BCSP. For these neighborhoods, that have a relatively low and high SES, the negative association between the percentage of foreign residents, average household size, and average personal annual income and the coverage in the BCSP had the smallest regression coefficient and 95% confidence interval (CI) values were −0.75 (95% CI: −0.85, −0.65), −13.59 (95% CI: −15.81, −11.37), and −1.05 (95% CI: −1.18, −0.92), respectively, for the 10th quantile. The neighborhoods with higher coverage of opportunistic screening had a relatively higher average personal annual income, with the largest regression coefficient of 1.72 (95% CI: 1.59, 1.85) for the 90th quantile.
Conclusions: Women from relatively low and high SES neighborhoods tend to participate less in the BCSP, whereas women with a relatively high SES tend to participate more in opportunistic screening. For women from low SES neighborhoods, tailored interventions are needed to improve the coverage of BCSP.
Introduction
Worldwide, breast cancer is the most common cause of cancer death in women (1). In 2018 the global age-standardized incidence and mortality rates of breast cancer were 54.4 and 11.6 per 100,000 women, respectively (1). Randomized controlled trials have confirmed that mammography screening can reduce the risk of breast cancer mortality by 20% for women aged 50–70 who attend this screening (2). The European guideline for quality assurance in breast cancer screening and diagnosis suggests to strive for 70% screening coverage in order to have a significant effect on breast cancer burden in the population. However, this percentage is not obtained in many countries where a breast cancer screening program (BCSP) has been established. In Europe, the mean screening coverage is about 50% (range 28–92%), meaning that a large proportion of women who are eligible for screening are not covered by the population breast cancer screening programs. This does not mean that these women do not receive any form of BC screening, since opportunistic BC screening exists in many countries (3).
To understand the reasons for this low coverage, several studies assessed the determinants of screening coverage. The main reported determinants of low screening coverage were related to low socioeconomic status (SES): lower income level, having an immigrant background, and being a single parent (4–7). The conclusions of these studies are mainly derived from linear regression modeling, in which the change in the mean coverage is estimated as a function of the explanatory variables. However, the determinants of the lowest and highest screening coverage are more of interest to policymakers than the determinants of the average coverage. In order to improve the screening coverage of BCSP, it is important to know the characteristics of the women with the lowest coverage in the BCSP, as well as those of the women with the highest coverage in the opportunistic screening. These insights can assist policy makers to implement specific actions to increase the screening coverage of BCSP, especially for those groups that are not covered by opportunistic screening either.
The aim of this study was therefore to evaluate the effect of socio-demographic factors and indicators for SES at the lower end of screening coverage in the BCSP and the higher end of opportunistic screening coverage. Data of screening coverage in Flanders, Belgium were analyzed with a quantile regression model (8).
Methods
Screening in Flanders
Flanders, the largest and most populated region in Belgium (around 6 million inhabitants), is among the regions with the highest BC incidence in Europe, despite the early implementation of a BCSP in 2001, which offers biennial screening to women between 50 and 69 years (1, 9). Women in Flanders can also choose to be screened for BC in opportunistic screening outside the BCSP. Where the BCSP is fully reimbursed by health insurance, opportunistic screening does not have a systematic quality control such as daily quality checks of mammography equipment, double reading and case-based feedback to readers (10). Although these two screening strategies coexist in Flanders, the combined coverage rate is only 64.1%, with a coverage rate of 50.0% for the BCSP and 14.1% for the opportunistic screening (11).
Data Source
For this analysis, publicly available data of 2017 from the Center for Cancer Detection and regional authorities in Flanders were linked at a statistical sector level. The statistical sector level is the smallest level at which administrative information is systematically collected in Flanders and is comparable to the neighborhood in literature (12). We will therefore use the term neighborhood hereafter. From the Center for Cancer Detection data were received of the screening invitations by the BCSP and attendances at the BCSP. The attendances to the opportunistic screening were identified from reimbursement data of the InterMutualist Agency (IMA). The data of opportunistic screening was sent to the Center for Cancer Detection regularly. These data were collected in a collaboration between the Belgian Cancer Registry and the Center for Cancer Detection, as described by their respective statutes (13, 14). From the regional authorities data on socio-demographic characteristics were retrieved (15). Linkage was performed in a protected environment and provided at an aggregated neighborhood level to mask all the individual level information. To prevent identification of any individual, neighborhoods were excluded with less than five women screened. Due to that, 8,690 of the 9,490 neighborhoods in Flanders that provided the data of screening coverage rate in the BCSP and the opportunistic screening were included in this study. For these reasons, ethical approval was not needed for this study because the above-noted measures were taken for privacy protection.
Study Variables
The primary outcome in this analysis was the coverage rate of screening in the BCSP, which was defined as the percentage of women aged 50–69 screened in the BCSP. The secondary outcome in this analysis was the coverage rate of opportunistic screening which was defined as the percentage of women aged 50–69 screened in the opportunistic screening.
The socio-demographic variables per neighborhood which can characterize the study population from different angles were used as covariates are listed in Table 1 and were defined as follows: (1) Population density: the number of residents per km2; (2) Same address as last year: the percentage of residents with the same address as last year; (3) Single parents: the percentage of unmarried residents that are single and live together with at least one child; (4) Married resident with child(ren) living at home: the percentage of married residents that live together with at least one child; (5) Unmarried cohabiting resident with child(ren) living at home: the percentage of unmarried residents that live together with at least one child; (6) The percentage of foreign residents: the percentage of residents without Belgian nationality; (7) Average personal annual income: the quotient of the total net taxable income and number of residents on January 1 of the tax year; (8) Average household size: the average number of persons in a household.

Table 1. Description of the neighborhood-level socio-demographic variables and the coverage in the BCSP at the 10th (Q10) to the 90th (Q90) quantiles*.
Statistical Analysis
Women were categorized into two groups, the group that was screened in the BCSP and the group that was screened in the opportunistic screening. In the first step of the analysis, the included neighborhoods in the analysis were ranked based on the coverage rates in the BCSP and in the opportunistic screening, respectively, and categorized in 9 quantiles (Q10–Q90). Then the socio-demographic variables were described per quantile. As we have aggregated data, these descriptions reflect the median estimates per quantile.
For each socio-demographic variable, to evaluate the deviations per quantile from the median regression, which is an indicator for the central tendency of the data, multivariable quantile regression models were performed. The quantile regression does not make any assumptions on the distribution of the observations neither on the residuals of the regression model (Supplementary Material Figure 1). The significance of the quantile regression coefficients was tested first to determine if the coefficients were significantly different from 0, then they were tested to determine if the coefficients were significantly different from the median regression coefficient. The quantile regression was considered to provide more information if both tests were significant (8, 16). All statistical tests were two-sided and considered statistically significant at 0.05. All analyses were performed in R 4.0.2.
Results
Description of the Coverage and Neighborhoods
Of the 8,690 included neighborhoods in the analysis, the median coverage in the BCSP was 50%. The coverage in the 10th quantile (Q10) was 33.5% and in the 90th quantile (Q90), it was 64.5%. The median percentage of single-parents, the median percentage of foreign residents, and the median average personal annual income decreased with increasing quantiles of BCSP coverage: for Q10–Q90 of the BCSP coverage, the median per quantile decreased from 3.8 to 3.0%, 11.1 to 3.9%, and €21,100 to 19,500, respectively (Table 1). The median coverage of the opportunistic screening was 12%, and for the Q10–Q90 this increased from 4.2 to 24.8%. The median average personal annual income increased with increasing quantiles of the coverage of opportunistic screening from €18,700 to 21,700 for the Q10 to Q90 (Table 2).
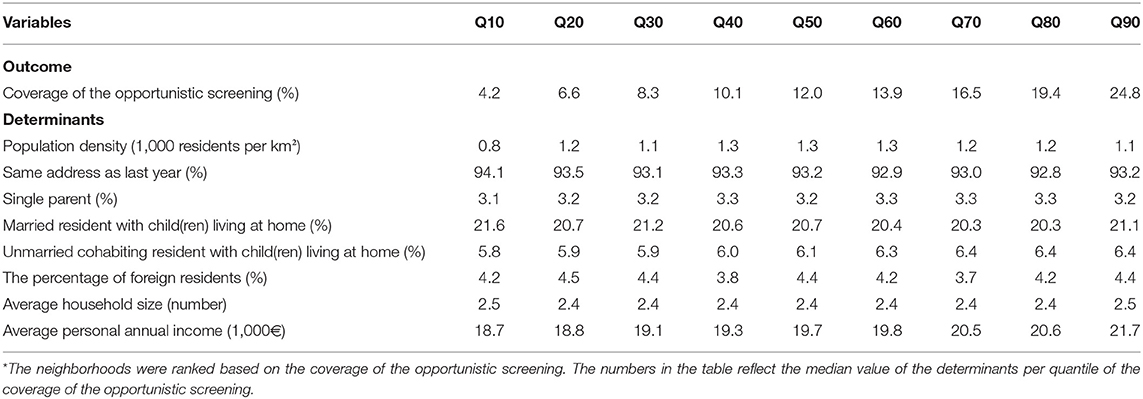
Table 2. Description of the neighborhood-level socio-demographic variables and coverage of the opportunistic screening at the 10th (Q10) to the 90th (Q90) quantiles*.
Determinants of the Coverage in the BCSP
A significant difference between the coefficients of the quantile regression and the median regression was observed for the population density, the percentage of foreign residents, the average household size, and the average personal annual income (Figure 1) (Supplementary Material Figure 2). These four determinants were all negatively associated with the coverage of BCSP with median regression coefficients of −0.97 (95% CI: −1.09, −0.85), −0.20 (95% CI: −0.27, −0.13), −10.38 (95% CI: −12.84, −7.92), and −0.86 (95% CI: −0.97, −0.76), respectively (Table 3). At Q10, the statistically significant association of the quantile regression of the percentage of foreign residents, average household size, and average personal annual income was stronger than the median regression, and the difference was statistically significant (Table 3). Of these three determinants, the regression coefficients and 95% CI for the Q10 of the coverage were −0.75 (95% CI: −0.85, −0.65), −13.59 (95% CI: −15.81, −11.37), and −1.05 (95% CI: −1.18, −0.92), respectively.
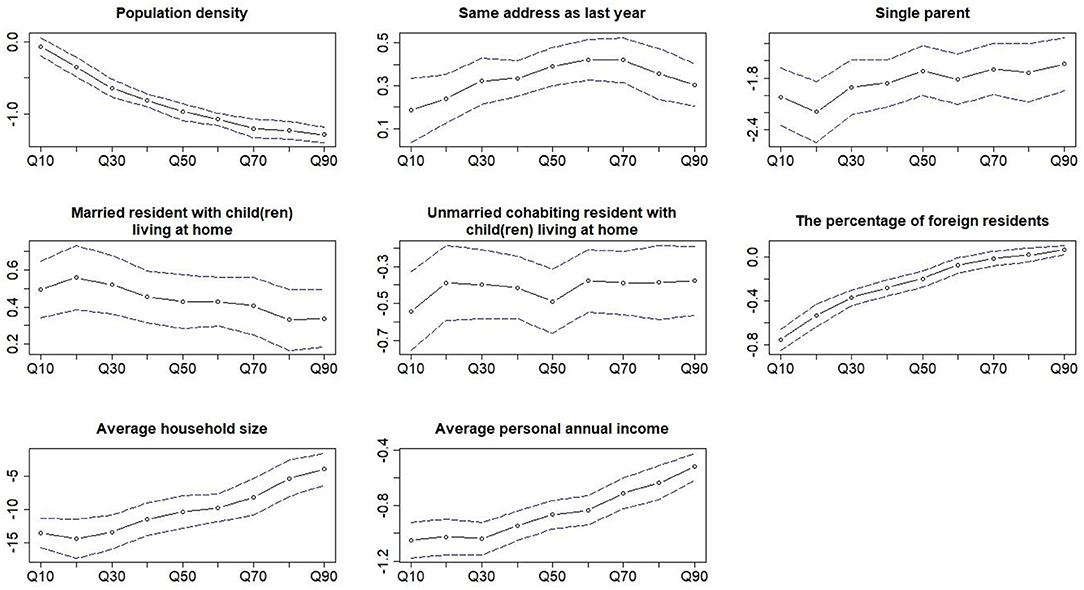
Figure 1. Coefficients of the multivariable quantile regression of all the covariates as a function of the different quantiles of the coverage in the BCSP. The dotted line and the blue dash lines are the coefficient and the 95% CI of quantile regression at the different quantiles of the outcome.
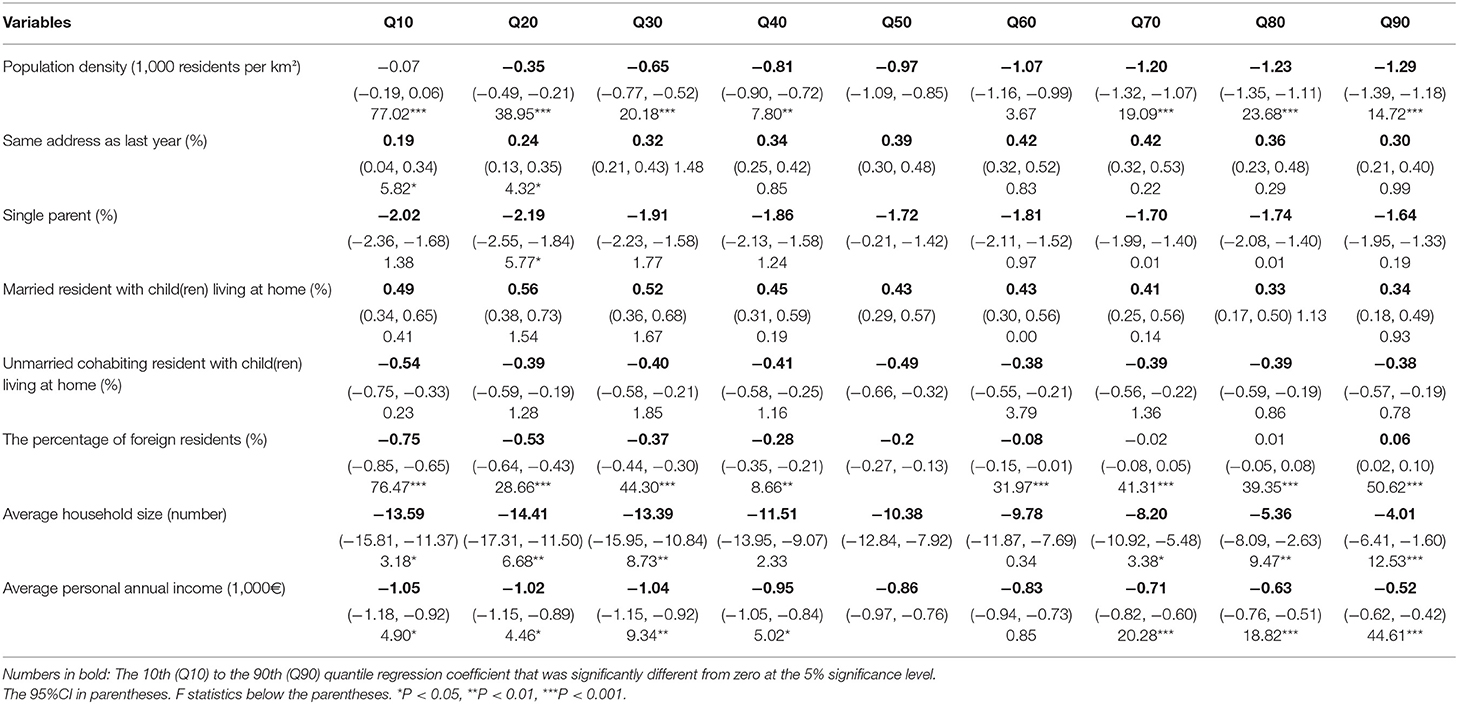
Table 3. Multivariable quantile regression coefficient and 95%CI of the determinants of coverage in the BCSP at the 10th (Q10) to the 90th (Q90) quantiles.
Determinants of Coverage of the Opportunistic Screening
The coefficients of the quantile regression for most of the determinants were significantly different from the median regression (Figure 2) (Supplementary Material Figure 3). The percentage of single parent, average household size, and average personal annual income were positively associated with the coverage of opportunistic screening. For these three variables, the coefficients and 95% CI of the quantile regression for the Q90 were 1.61 (95% CI: 1.28, 1.94), 17.15 (95% CI: 14.66, 19.63), and 1.72 (95% CI: 1.59, 1.85), respectively, which was significantly larger than the median regression coefficients 0.83 (95% CI: 0.64, 1.03), 7.86 (95% CI: 6.34, 9.38), and 1.10 (95% CI: 1.02, 1.17), respectively (Table 4).
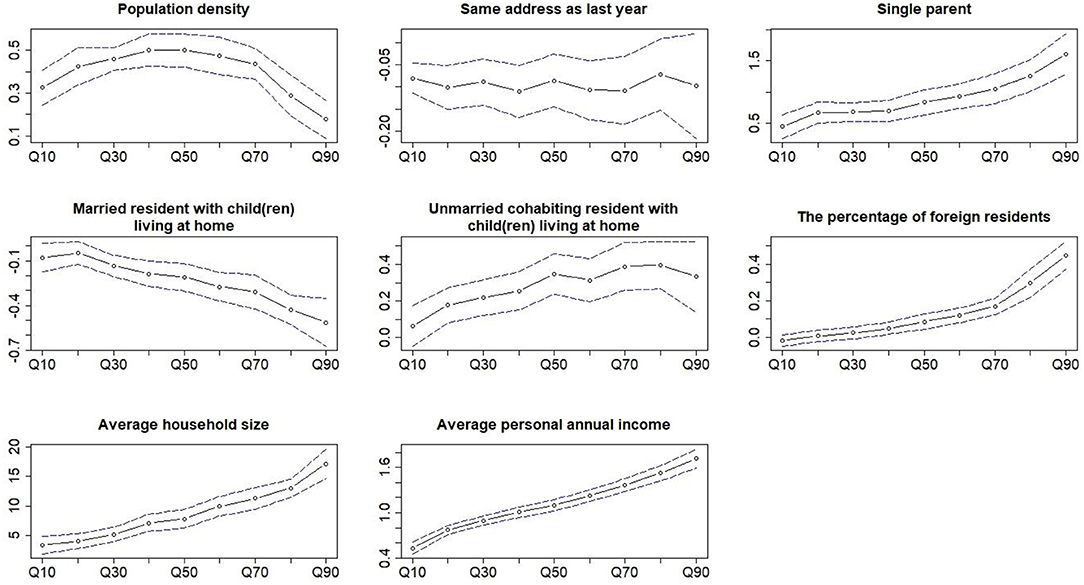
Figure 2. Coefficients of the multivariable quantile regression of all the covariates as a function of the different quantiles of the coverage of the opportunistic screening. The dotted line and the blue dash lines are the coefficient and the 95% CI of quantile regression at the different quantiles of the outcome.
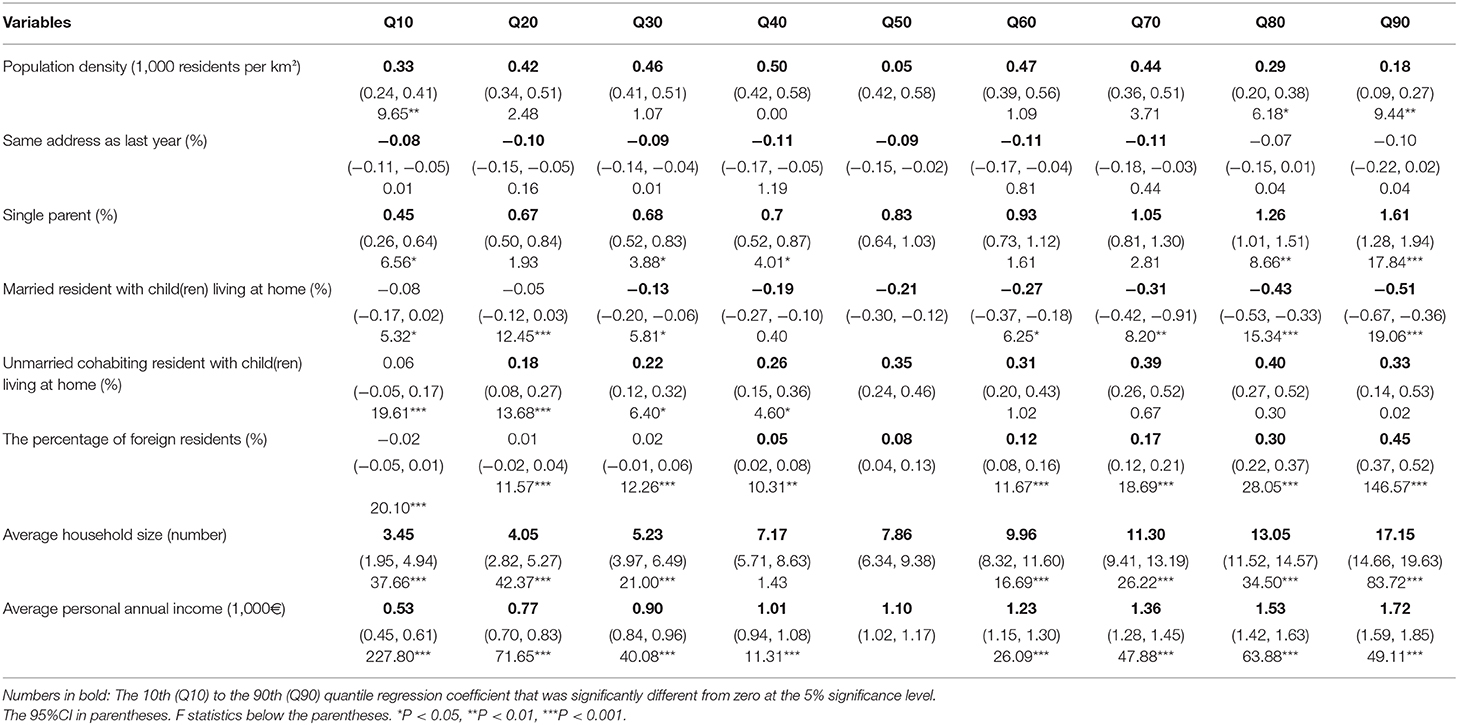
Table 4. Multivariable quantile regression coefficient and 95%CI of the determinants of coverage of the opportunistic screening at the 10th (Q10) to the 90th (Q90) quantiles.
Discussion
We found that a larger percentage of foreign residents and a larger average household size as indicators for lower SES were found in neighborhoods with a lower coverage in the BCSP. However, a higher average personal annual income as an indicator for a higher SES was also found in neighborhoods with a lower coverage in the BCSP. For these neighborhoods, the negative association between SES and coverage in the BCSP was stronger than in the neighborhoods with a relatively middle SES level. The neighborhoods with a higher coverage of opportunistic screening had a relatively higher average personal annual income and the positive association between SES and coverage of the opportunistic screening was stronger than in neighborhoods with a relatively lower SES level.
The median coverage in the BCSP for all neighborhoods was 50%. The median coverage for neighborhoods in the lowest and the highest quantile was 33.5 and 64.5%, respectively. The coverage in the BCSP in Flanders was lower than in countries like the Netherlands and the United Kingdom where BC screening is mainly performed in the BCSP, but it was close to countries like France and Germany where both BCSP and opportunistic screening are performed for BC screening (17). As the median coverage of the opportunistic screening was 12%, with 4.2% coverage in the neighborhoods in the lowest quantile and 24.8% coverage in the neighborhoods in the highest quantile, the combined coverage in the BCSP and the opportunistic screening was relatively close to the BC screening coverage in other Western European countries (3, 17).
We observed that women in neighborhoods with a lower SES, as indicated by a crowded housing condition (18, 19) or being an immigrant with a foreign nationality (20), tended to participate less in the BCSP than women in neighborhoods with middle level SES. The negative association between these variables and the coverage in the BCSP was previously also found in other European countries (21, 22). An explanation for this phenomenon is that women with a relatively low SES have a possible lack of health literacy, leaving them less informed on the benefit of BCSP (23). Other reasons may include language barriers for women with an immigration background (24), and the fact that the hardship of life for women with relatively low SES may require more time to work than high SES women and reduce the attention to health care (25).
Interestingly, we also found that women in neighborhoods with a higher income as indicated by a higher average personal annual income also tend to participate less in the BCSP than the women in neighborhoods with middle level income. However, these women tend to participate more in the opportunistic screening than the women in neighborhoods with middle level income. Studies in France, where BCSP and opportunistic screening coexist as in Flanders, also found that women in the most affluent group tend to participate more in opportunistic screening (26). A possible explanation for this phenomenon is that women who belong to the neighborhoods with a relatively high SES may prefer the opportunistic screening which has a more flexible time schedule and more personalized service than the BCSP (2, 27).
Strength and Limitation
The strength of this study is that the validity of the screening coverage data was warranted by the administrative database of the screening program in Flanders. The recall bias in self-reported surveys was avoided in our data (28). Moreover, the determinants of screening coverage were evaluated for the full distribution of the coverage in the BCSP and the opportunistic screening. The heterogeneous effect of the determinants of screening coverage in different quantiles can provide a more specific target for the potential interventions to improve the screening coverage rate. A limitation of this study was that all data were aggregated at a neighborhood level. It was therefore not possible to explore the variation within the neighborhoods due to the aggregated nature of the data. Moreover, the aggregated data in the current data do not contain factors that have a potential impact on the implementation of the screening, such as women's contract information with general practitioners which might play an important role in the implementation of opportunistic screening. However, studies have shown that residents who live in the same neighborhood share similar SES and health behavior (29, 30) and the association between the determinants in our study and the screening coverage was consistent with the literature. Therefore, the findings in this study can demonstrate the disproportional impact of SES on women who have different breast cancer screening rate and can inform the resource allocation in policymaking. Another potential limitation of this study was the exclusion of neighborhoods that have less than five screened women, which was mainly related to the small size of a neighborhood. This measure was taken by the breast cancer screening program administrators with the aim to protect privacy and is mandatory by the Flemish government. However, we think that the effect of this exclusion was limited due to the fact that we included 92% of all neighborhoods (31).
Conclusion
Women in neighborhoods that have a relatively low SES, that are characterized by being an immigrant with a foreign nationality, and having a large average household size, as well as women in neighborhoods that have a relatively high SES, that are characterized by a high average personal annual income, participate less frequently in the BCSP. On the other hand, women who belong to neighborhoods with a relatively high SES tend to participate more in the opportunistic screening. Tailored intervention that aims to increase the coverage of BCSP should pay more attention to women in these neighborhoods.
Data Availability Statement
The original contributions presented in the study are included in the article/Supplementary Material, further inquiries can be directed to the corresponding author/s.
Ethics Statement
Ethical review and approval was not required for the study on human participants in accordance with the local legislation and institutional requirements. Written informed consent for participation was not required for this study in accordance with the national legislation and the institutional requirements.
Author Contributions
LD, MJG, GB, and GV conceived the study, performed the data analysis, and wrote the manuscript. SJ was involved in the data curation and review of the manuscript. KV, MG, HD, and PM wrote the manuscript and verified the analysis. All authors discussed and interpreted the results and contributed to the final manuscript.
Conflict of Interest
The authors declare that the research was conducted in the absence of any commercial or financial relationships that could be construed as a potential conflict of interest.
Acknowledgments
LD was supported by the China Scholarship Council (CSC) Ph.D. scholarship (File No. 201808320439) for his research and study at the University of Groningen, University Medical Center Groningen, Groningen, The Netherlands. The scholarship had no role in study design, data analysis, and interpretation, the writing of the manuscript, and the decision to submit the article for publication. We would like to extend our sincere gratitude to Prof. Dr. Pieter U. Dijkstra, who provided many kind suggestions to improve this manuscript during the coach sessions of the Science Writing course.
Supplementary Material
The Supplementary Material for this article can be found online at: https://www.frontiersin.org/articles/10.3389/fpubh.2021.648278/full#supplementary-material
References
1. Bray F, Ferlay J, Soerjomataram I, Siegel RL, Torre LA, Jemal A. Global cancer statistics 2018: GLOBOCAN estimates of incidence and mortality worldwide for 36 cancers in 185 countries. CA Cancer J Clin. (2018) 68:394–424. doi: 10.3322/caac.21492
2. Marmot M, Altman DG, Cameron DA, Dewar JA, Thompson SG, Wilcox M. The benefits and harms of breast cancer screening: an independent review. Lancet. (2012) 380:1778–86. doi: 10.1016/S0140-6736(12)61611-0
3. Giordano L, Von Karsa L, Tomatis M, Majek O, De Wolf C, Lancucki L, et al. Mammographic screening programmes in Europe: organization, coverage and participation. J Med Screen. (2012) 19:72–82. doi: 10.1258/jms.2012.012085
4. Schueler KM, Chu PW, Smith-Bindman R. Factors associated with mammography utilization: a systematic quantitative review of the literature. J Womens Health. (2008) 17:1477–98. doi: 10.1089/jwh.2007.0603
5. Leung J, McKenzie S, Martin J, McLaughlin D. Effect of rurality on screening for breast cancer: a systematic review and meta-analysis comparing mammography. Rural Remote Health. (2014) 14:2730.
6. Massat NJ, Douglas E, Waller J, Wardle J, Duffy SW. Variation in cervical and breast cancer screening coverage in England: a cross-sectional analysis to characterise districts with atypical behaviour. BMJ Open. (2015) 5:7. doi: 10.1136/bmjopen-2015-007735
7. Douglas E, Waller J, Duffy SW, Wardle J. Socioeconomic inequalities in breast and cervical screening coverage in England: are we closing the gap?. J Med Screen. (2016) 23:98–103. doi: 10.1177/0969141315600192
8. Koenker R, Hallock KF. Quantile regression. J Econ Perspect. (2001) 15:143–56. doi: 10.1257/jep.15.4.143
9. Willems B, Bracke P. The impact of regional screening policies on the diffusion of cancer screening participation in Belgium: time trends in educational inequalities in Flanders and Wallonia. BMC Health Serv Res. (2018) 18:1–3. doi: 10.1186/s12913-018-3746-x
10. Goossens M, Van Hal G, Van der Burg M, Kellen E, Van Herck K, De Grève J, et al. Quantifying independent risk factors for failing to rescreen in a breast cancer screening program in Flanders, Belgium. Prev Med. (2014) 69:280–6. doi: 10.1016/j.ypmed.2014.10.019
11. Goossens M, De Brabander I, De Grève J, Van Ongeval C, Martens P, Van Limbergen E, et al. Flemish breast cancer screening programme: 15 years of key performance indicators (2002-2016). BMC Cancer. (2019) 19:1012. doi: 10.1186/s12885-019-6230-z
12. Neutens T, Vyncke V, De Winter D, Willems S. Neighborhood differences in social capital in Ghent (Belgium): a multilevel approach. Int J Health Geogr. (2013) 12:52. doi: 10.1186/1476-072X-12-52
13. CVKO. Population Survey in Numbers. Available online at: https://bevolkingsonderzoek.incijfers.be//jive?cat_open_code=bk_extern (accessed Decemebr 13, 2020).
14. Belgian Cancer Registry - Welcome to the Belgian Cancer Registry!. Available online at: https://kankerregister.org/ (accessed December 31, 2020).
15. Provincies in Cijfers - Nieuw. Available online at: https://provincies.incijfers.be/databank (accessed December 13, 2020).
16. Gowlland C, Xiao Z, Zeng Q. Beyond the central tendency: quantile regression as a tool in quantitative investing. J Portf Manag. (2009) 35:106–19. doi: 10.3905/JPM.2009.35.3.106
17. Deandrea S, Molina-Barceló A, Uluturk A, Moreno J, Neamtiu L, Peiró-Pérez R, et al. Presence, characteristics and equity of access to breast cancer screening programmes in 27 European countries in 2010 and 2014. Results from an international survey. Prev Med. (2016) 91:250–63. doi: 10.1016/j.ypmed.2016.08.021
18. Melki IS, Beydoun HA, Khogali M, Tamim H, Yunis KA. Household crowding index: a correlate of socioeconomic status and inter-pregnancy spacing in an urban setting. J Epidemiol Commun Health. (2004) 58:476–80. doi: 10.1136/jech.2003.012690
19. Peichl A, Pestel N, Schneider H. Does size matter? The impact of changes in household structure on income distribution in Germany. Rev Income Wealth. (2012) 58:118–41. doi: 10.1111/j.1475-4991.2011.00448.x
20. Raphael S, Smolensky E. Immigration and poverty in the United States. Am Econ Rev. (2009) 99:41–4. doi: 10.1257/aer.99.2.41
21. Zackrisson S, Andersson I, Manjer J, Janzon L. Non-attendance in breast cancer screening is associated with unfavourable socio-economic circumstances and advanced carcinoma. Int J Cancer. (2004) 108:754–60. doi: 10.1002/ijc.11622
22. Ouédraogo S, Dabakuyo-Yonli TS, Roussot A, Pornet C, Sarlin N, Lunaud P, et al. European transnational ecological deprivation index and participation in population-based breast cancer screening programmes in France. Prev Med. (2014) 63:103–8. doi: 10.1016/j.ypmed.2013.12.007
23. Stormacq C, Van Den Broucke S, Wosinski J. Does health literacy mediate the relationship between socioeconomic status and health disparities? Integrative review. Health Promot Int. (2019) 34:E1–17. doi: 10.1093/heapro/day062
24. Bhargava S, Moen K, Qureshi SA, Hofvind S. Mammographic screening attendance among immigrant and minority women: a systematic review and meta-analysis. Acta Radiol. (2018) 59:1285–91. doi: 10.1177/0284185118758132
25. Pampel FC, Krueger PM, Denney JT. Socioeconomic disparities in health behaviors. Annu Rev Sociol. (2010) 36:349–70. doi: 10.1146/annurev.soc.012809.102529
26. Ouédraogo S, Dabakuyo-Yonli TS, Amiel P, Dancourt V, Dumas A, Arveux P. Breast cancer screening programmes: challenging the coexistence with opportunistic mammography. Patient Educ Couns. (2014) 97:410–7. doi: 10.1016/j.pec.2014.08.016
27. Population Screening for Breast Cancer: Expectations and Developments. Advisory Report. The Health Council of the Netherlands. Available online at: https://www.healthcouncil.nl/documents/advisory-reports/2014/01/22/population-screening-for-breast-cancer-expectations-and-developments (accessed Decemeber 31, 2020).
28. Rauscher GH, Johnson TP, Young IC, Walk JA. Accuracy of self-reported cancer-screening histories: a meta-analysis. Cancer Epidemiol Biomark Prev. (2008) 17:748–57. doi: 10.1158/1055-9965.EPI-07-2629
29. Adler NE, Newman K. Socioeconomic disparities in health: pathways and policies. Health Aff. (2002) 21:60–76. doi: 10.1377/hlthaff.21.2.60
30. Tulin M, Volker B, Lancee B. The same place but different: how neighborhood context differentially affects homogeneity in networks of different social groups. J Urban Aff. (2019) 43:1–20. doi: 10.1080/07352166.2019.1578176
Keywords: breast cancer, mammography screening, coverage, social inequality, determinant, quantile regression
Citation: Ding L, Jidkova S, Greuter MJW, Van Herck K, Goossens M, De Schutter H, Martens P, Van Hal G and de Bock GH (2021) The Role of Socio-Demographic Factors in the Coverage of Breast Cancer Screening: Insights From a Quantile Regression Analysis. Front. Public Health 9:648278. doi: 10.3389/fpubh.2021.648278
Received: 31 December 2020; Accepted: 17 March 2021;
Published: 15 April 2021.
Edited by:
MinJae Lee, University of Texas Southwestern Medical Center, United StatesReviewed by:
Salah El Adlouni, Université de Moncton, CanadaAnthony Bernard Miller, University of Toronto, Canada
Mina Suh, EpidStrategies, United States
Copyright © 2021 Ding, Jidkova, Greuter, Van Herck, Goossens, De Schutter, Martens, Van Hal and de Bock. This is an open-access article distributed under the terms of the Creative Commons Attribution License (CC BY). The use, distribution or reproduction in other forums is permitted, provided the original author(s) and the copyright owner(s) are credited and that the original publication in this journal is cited, in accordance with accepted academic practice. No use, distribution or reproduction is permitted which does not comply with these terms.
*Correspondence: Geertruida H. de Bock, Zy5oLmRlLmJvY2tAdW1jZy5ubA==
 Lilu Ding
 Svetlana Jidkova
 Marcel J. W. Greuter5,6
 Guido Van Hal