
95% of researchers rate our articles as excellent or good
Learn more about the work of our research integrity team to safeguard the quality of each article we publish.
Find out more
ORIGINAL RESEARCH article
Front. Public Health , 04 June 2021
Sec. Aging and Public Health
Volume 9 - 2021 | https://doi.org/10.3389/fpubh.2021.634751
This article is part of the Research Topic Healthy Aging and the Community Environment View all 16 articles
 Chanam Lee1*
 Chunkeun Lee1Orion T. Stewart2,3Heather A. Carlos4,5
 Anna Adachi-Mejia4Ethan M. Berke6,7Mark P. Doescher8
Introduction: Walking has the potential to promote health across the life span, but age-specific features of the neighborhood environment (NE), especially in rural communities, linked with walking have not been adequately characterized. This study examines the relationships between NE and utilitarian walking among older vs. younger adults living in US rural towns.
Methods: Data for this cross-sectional study came from telephone interviews in 2011–2012 with 2,140 randomly sampled younger (18–64 years, n = 1,398) and older (65+ years, n = 742) adults, collecting personal and NE perception variables. NE around each participant's home was also measured objectively using geographic information system techniques. Separate mixed-effects logistic regression models were estimated for the two age groups, predicting the odds of utilitarian walking at least once a week.
Results: Perceived presence of crosswalks and pedestrian signals was significantly related to utilitarian walking in both age groups. Among older adults, unattended dogs, lighting at night, and religious institutions were positively while steep slope was negatively associated with their walking. For younger adults, traffic speed (negative, –), public transportation (positive, +), malls (–), cultural/recreational destinations (+), schools (+), and resource production land uses such as farms and mines (–) were significant correlates of utilitarian walking.
Conclusion: Different characteristics of NE are associated with utilitarian walking among younger vs. older adults in US rural towns. Optimal modifications of NE to promote walking may need to reflect these age differences.
Walking, with all of its health benefits particularly for older adults, has the potential to promote health outcomes as adults age (1). According to the 2014 Behavioral Risk Factor Surveillance System (BRFSS) data, 26.9% of older adults aged 65–74 years reported no physical activity outside of work during the last month, and the number increased to 35.3% as age increased to 75 years and above (2). A growing body of research has begun to illuminate the differing roles that the neighborhood environment (NE) plays in promoting or, as is often the case, hindering walking as adults age (3).
Most studies to date about environment–walking relationships among older or general adults have been limited to metropolitan or urban areas. However, rural towns are home to 10% of the US population, have a disproportionately large number of older adults, and are aging more rapidly than the rest of the United States (4). Several recently published studies carried out in rural communities reported both similarities and differences in the correlates of walking between urban and rural residents (5–7). The study of Stewart et al. comparing one urban community and nine small rural towns in the United States found that the same land use (i.e., restaurants) can be positively associated with utilitarian walking in urban settings while negatively associated in rural settings, and NE is more strongly associated with utilitarian walking in urban communities. They also observed a higher prevalence of recreational walking in rural towns, and traffic speed was a significant predictor of recreational walking only in rural communities. The study of Doescher et al., further examining the same nine rural towns, reported that crosswalks, pedestrian signals, park/natural recreational areas, and manufacturing land uses were positively correlated with utilitarian walking in these communities (5). Another study in Japan explored the roles of street layout design and found that street intersection density was linked with increased walking for errands in urban areas, while street integration was positively associated with walking for commuting in rural areas (6). All of these studies were based on the general adult population. Little is known about the age-varying associations between walking and NE in these rural/small towns that are also known to be subject to significant health inequities (8).
Substantial empirical evidence based on general adult studies suggests that walkable neighborhoods typically feature compact development patterns, proximately located destinations, connected street/sidewalk networks, and safety from traffic and crime (9, 10). The roles of walkable neighborhood features, however, may differ among people from different age groups. One study indicated that NE may play a less significant role in walking for older adults compared to their younger counterparts (11). Another older adult study suggested that NE may be more important for influencing the amount of walking among those who already walk than encouraging non-walkers to walk (12). Age differences in transportation walking were found to be greater in lower walkability neighborhoods than in higher walkability neighborhoods (13). Other research pointed to the synergistic effects of NE and personal factors (e.g., socioeconomic status, self-efficacy, and personal barriers) on walking among older adults (14, 15). Studies examining self-report barriers and facilitators of walking and route choice models suggested that the characteristics of NE that influence walking behaviors in older adults might be highly fine-grained and location-specific (3, 16). One study found that the decline in walking for transport over a 4-year period was less among those living in walkable neighborhoods (17). A review study suggested that proximity to destinations, connected street networks, and safety from traffic were associated with older adults' mobility (18). Studies also showed that people with a longer residential history tend to be less fearful of their neighborhood (19) and walk more for exercise (20). These studies indicate that walkable NE has some potential to support mobility and aging in place.
The purpose of this study was to identify NE characteristics that are associated with utilitarian walking among older vs. younger adults living in US rural towns. This study focuses on utilitarian walking because it is associated more strongly with NE and less strongly with personal factors than recreational walking (7, 9) and because it is more likely to bring long-term lifestyle changes, is easily incorporated into the daily routine, helps preserve independent mobility of aging populations, and accompanies additional economic and environmental benefits resulting from reduced automobile use (21). Utilitarian walking is especially important for increasing or maintaining mobility and independence among older adults, supporting the aging in place initiatives (22, 23).
NE is the target setting of this study due to the increasing importance of the residential neighborhood among older adults, as they spend most of their time at home and rely more on proximately available resources within the neighborhood for their physical and psychosocial needs (24, 25). Furthermore, older adults tend to be more vulnerable to environmental challenges or barriers. For example, older adults walk at slower speeds and thus may have more difficulty crossing busy streets, especially when there are no crosswalks or when the crosswalk signals are too short (3).
The social ecological framework provides a theoretical foundation and guidance for this paper. It emphasizes the dynamic interplays between people and their environments (26). Compared to other common theories in the health promotion or behavior change literature that tend to focus on intrapersonal factors, the social ecological model draws attention to the social and physical environments as key determinants of individual health/behavioral outcomes (27). Lawton applies an ecological theory to describe the aging process as an evolving process of human adaptation to their environment (28). His theory highlights the importance of immediate contexts (social, physical, and technological) in determining such process and outcomes (28, 29). Both theories recognize the importance of environmental contexts such as neighborhoods in determining health behaviors such as walking and physical activity. They also agree that the nature of the environment–behavior relationships is highly dependent on the specific behavior, population, and the community context being targeted (30). These theories offer useful insights and support for environment–behavior studies to examine the population- and context-specific correlates of an explicit target outcome, such as utilitarian walking. Both theories further recognize the multilevel characteristics of the environment, including interpersonal, sociocultural, institutional, and physical environments; proximal to distal environments; and the interplay within and between factors at different levels (23). This study focuses on age (intrapersonal variable) and NE (both perceived and objectively measured environmental variables) to explore their roles in promoting or hindering utilitarian walking in US rural towns as the understudied settings for this type of study.
This cross-sectional study examines the correlates of utilitarian walking in neighborhoods among 2,140 randomly sampled younger (18–64 years, n = 1,398) and older (65+ years, n = 742) adults. We used the age of 65 as the threshold in this study as it is the most commonly used and accepted threshold for defining older adults in the United States (e.g., Census Bureau, National Institutes of Health). Utilitarian walking in this paper is defined as walking to or from any destinations including recreational ones (e.g., grocery store, school, and park). Two separate mixed-effects multivariable logistic regression models were estimated for the two age groups, adjusting for the town-level clustering effect.
In order to represent a diversity of rural towns in the United States, this study was carried out in nine towns from three diverse geographic regions: the Northwest (Washington), the Northeast (New Hampshire and New York), and the South (Texas) (Table 1). The selection criteria included: (a) geographically isolated rural towns located in counties classified as “micropolitan statistical areas” based on the US Census (31) with sufficient population (10,000–40,000) to support services for daily living; (b) clustered residential areas to permit walking between homes and routine destinations; (c) diverse racial/ethnic composition and education/income levels; and (d) availability of geographic information systems (GIS) data. More information about the study setting and data collection methods can be found elsewhere (Blinded for Review, 2016).
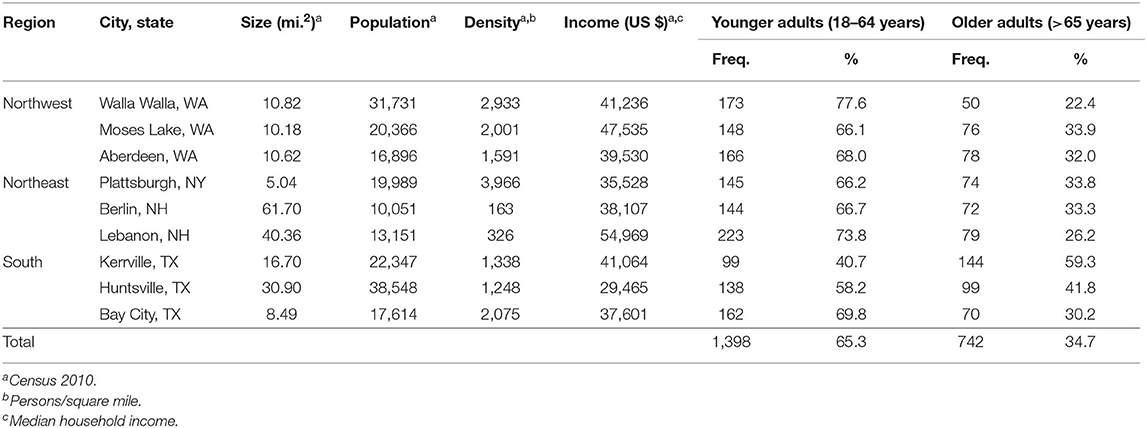
Table 1. Survey respondents by town and by age group.
All personal variables were obtained from an ~20-min-long telephone survey administered in 2011 in both English and Spanish. The survey instrument was developed by taking items used in previous peer-reviewed research, including the International Physical Activity Questionnaire (32), the Neighborhood Environment Walkability Scale (33), the Behavioral Risk Factor Surveillance System (34), and the Rural Active Living Perceived Environment Support Scale (35), and by pilot testing it with 50 randomly sampled respondents from the same study population. The final survey instrument included demographics, race and ethnicity, health and socioeconomic status, barriers and facilitators of walking, walking and sedentary behaviors, and neighborhood perceptions. The survey protocol and instrument were approved at each of the investigators' universities.
The study used a spatial sampling strategy that involved random sampling of residential units from those selected into the sample frame (36). The sample frame was spatially delineated to include all census blocks that contained the top 80% of the population in each study town. This excluded very low-density residential areas often located in farmland and undeveloped areas wherein no nearby destinations were available for utilitarian walking. Phone numbers were identified through a reverse directory landline lookup for the selected units, which yielded an approximate matching rate of 40%. The phone interviews were conducted over four months in 2011 when the weather was most favorable for walking in each region, with a maximum of nine callbacks and an estimated response rate of 18.8%. The respondent eligibility criteria were (a) aged 18 years or older; (b) resided at the current address for at least 1 year; and (c) being able to walk without special equipment for 5 minutes.
GIS was used to generate the objective measures of NE related to walkability. Raw data were obtained from each jurisdiction, and additional data were collected from aerial photos, online maps, and various agencies (e.g., tax assessor's office, parks and recreation department, and transit agency). A detailed protocol and definition for each GIS measure was developed and followed to ensure valid and consistent measures across all nine towns. GIS measurements were carried out in 2013 and included buffer-based measures (e.g., total number of banks and average residential unit density), which were taken from a 1-km street network “sausage” buffer (37) around each survey respondent's home, and proximity measures (e.g., distance to the closest park) taken as the shortest distance from the home to each target destination along the road network up to 2 km. The sausage buffer method is similar to the standard street network buffer, but it excludes interior areas inside the street block where pedestrians are not likely to see or get to. Details about the GIS method, measures, and protocols used in this study can be found in a previously published paper (Blinded for Review, 2016).
The outcome was a binary variable, walking at least once a week vs. not. It was generated from the survey questions asking about the number of times per month walked from home to a series of common destinations, which were converted to weekly frequencies. Predictor variables included personal and environmental variables. Descriptive statistics and the coding schemes of only those that retained statistical significance at the 0.1 level in the final multivariable models are included in Tables 2 and 3. All personal variables were derived from the survey data and consisted of five domains: demographics, health and socioeconomic status, behavior, barrier to walking, and residential self-selection. The environmental variables came from both survey (neighborhood perception) and GIS (objective built environment). Neighborhood perception variables (11 variables considered) included safety, street/traffic conditions, visual quality, sidewalk availability, shade condition, and presence of destinations. The GIS variables included eight sub-domains: generalized land use (19 variables), destination land use (102), residential density (six), transportation infrastructure (52), economic environment (nine), employment (six), regional location (two), and natural environment (six).
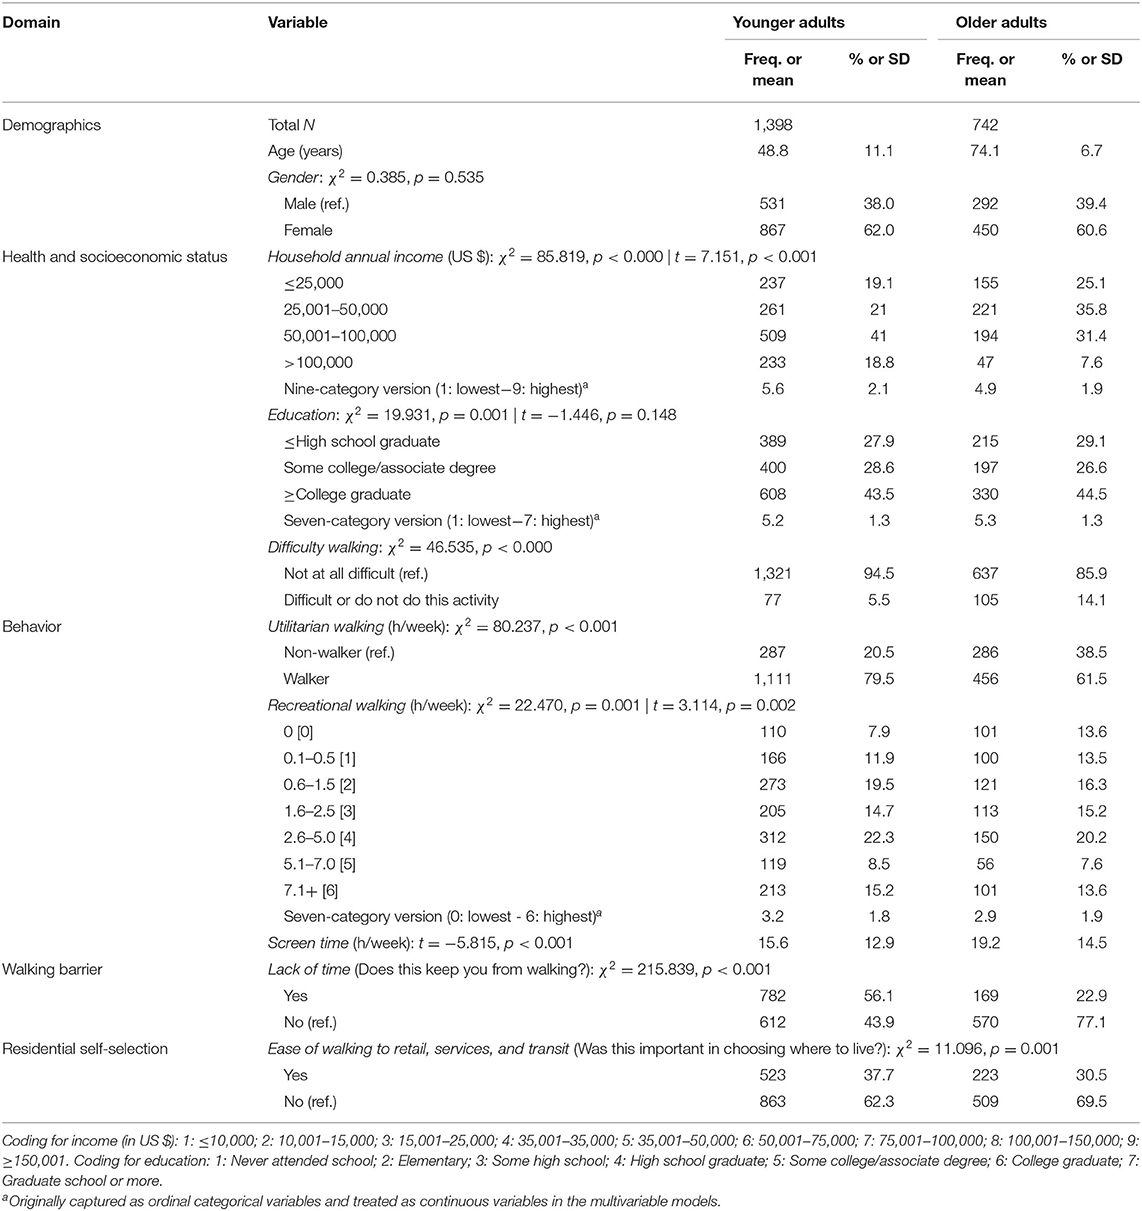
Table 2. Descriptive statistics and bivariate tests of the study variables used in the final models: personal variables (survey).
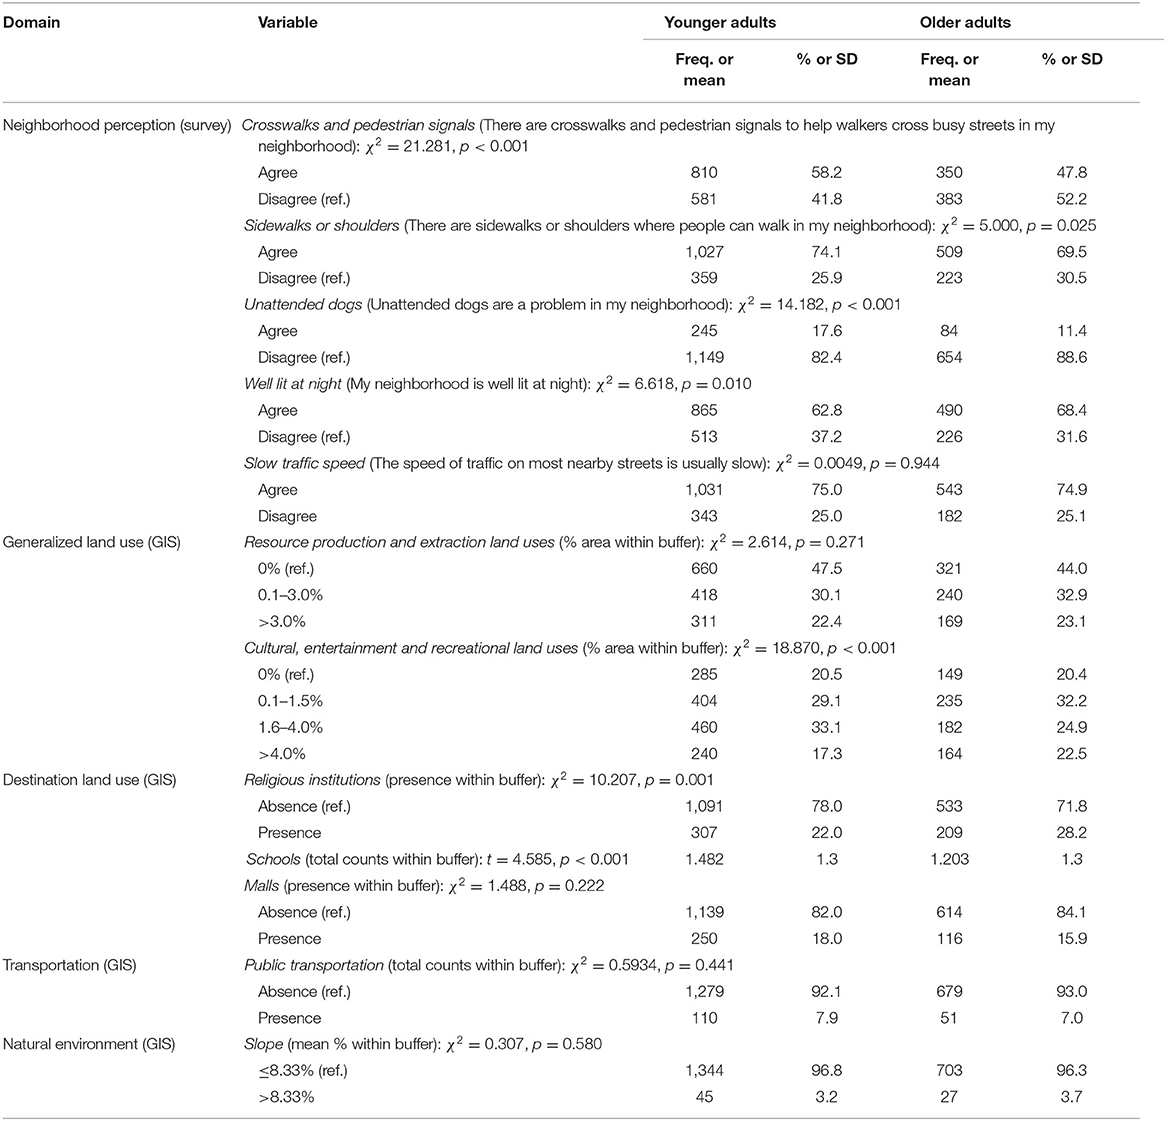
Table 3. Descriptive statistics and bivariate tests of the study variables used in the final models: environmental variables (survey and GIS).
We used mixed-effects multivariable logistic regression models to account for the town-level data clustering and identified the factors significantly associated with the odds of walking at least once a week in the neighborhood to reach a destination. The interclass correlation coefficient (ICC) values of the final multivariable models were 0.048 in the older adult model and 0.011 in the younger adult model. This means that the town-level effect accounts for 4.8% and 1.1% of the total variances explained in the older and younger adult models, respectively.
Due to the lack/shortage of theoretical foundations to guide the selection of the environmental variables, especially the GIS variables that tend to be highly correlated with each other, a three-step modeling process was employed to systematically test and isolate the most significant variables: (1) estimation of the base model with the personal variables only; (2) one-by-one test of the environmental variables by adding one environmental variable at a time to the base model; and (3) estimation of the final model by considering all the significant variables identified in step 2. To further examine the moderation effect of the age variable, we carried out a formal moderator test (38). It involved adding the interaction terms between age and the predictor variables, one at a time, to the final model. The statistical significance was set to p < 0.10 in steps 1 and 2 for more thorough considerations of all potential predictors and given the data-driven nature of the screening process (step 2) that was necessary, although not ideal, for the environmental variables. In the final models, we stayed with the standard alpha level of 0.05 for reporting and discussing the significant findings. All statistical analyses were carried out in 2013 using STATA version 12.0 (StataCorp LP, College Station, TX).
The participants (1,398 younger and 742 older adults) were primarily white and non-Hispanic, with 80.0% of the younger adults and 91.5% of the older adults being white and 85.5% and 97.0%, respectively, reporting a non-Hispanic origin. Based on the body mass index estimated from the self-reported weight and height, 26.1% of the younger adults belonged to the obese category compared to only 17.5% among the older adults. About 4.5% of the older adults, compared to 3.7% among the younger adults, lived in a household without a car; 57.1% of the older and 72.8% of the younger adults were married or lived with a partner. Table 4 displays the significant correlates of walking identified for each age group after adjusting for other significant covariates.
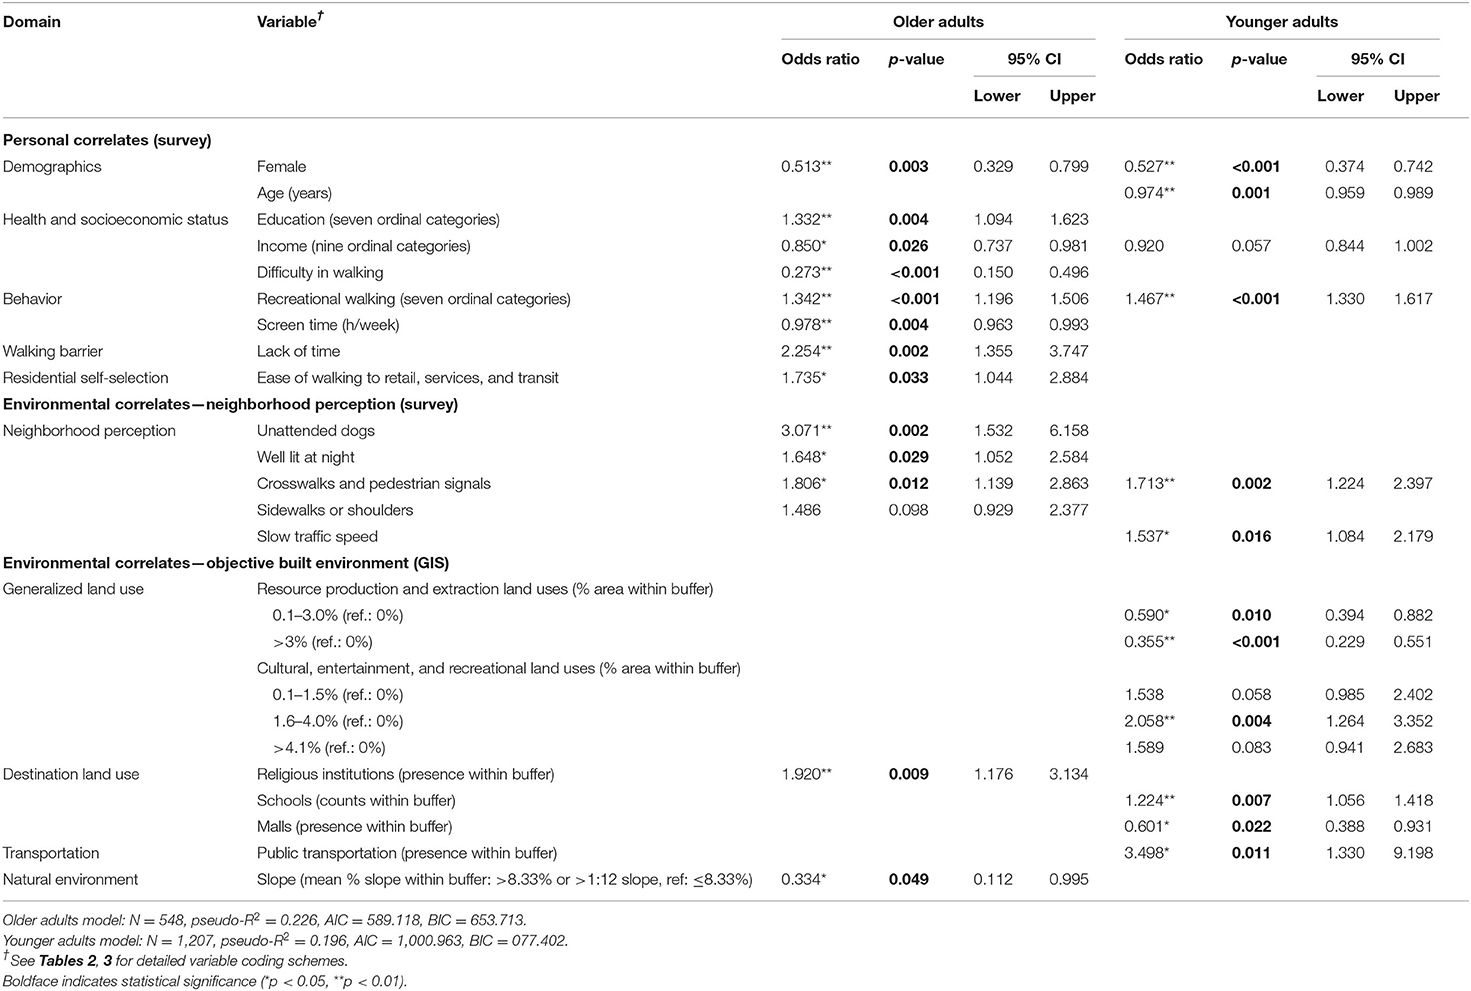
Table 4. Multilevel correlates of neighborhood utilitarian walking among younger vs. older adults: results from multivariable mixed-effects models.
From the multivariable analyses, we found two personal variables associated with home-based utilitarian walking regardless of age. Females were less likely to walk to destinations than males in both age groups, with odds ratios (ORs) of 0.53 (p < 0.001) for the younger adults and 0.51 (p = 0.003) for the older adults. Those who walked for utilitarian purposes also walked more for recreational purposes regardless of their age group (p < 0.001 in both models).
Age was negatively associated with walking in the younger adult model only (OR = 0.98, p = 0.001). A 1-year increase in age was associated with an ~2.5% decrease in the odds of walking for utilitarian purposes. On the other hand, education (OR = 1.33, p = 0.004) and time barrier (OR = 2.25, p = 0.002) were positively while income (OR = 0.85 and p = 0.026), difficulty in walking (OR = 0.27, p < 0.001), and screen time (OR = 0.98, p = 0.004) were negatively associated with walking among the older adults only. The ease of walking to retail, services, and transit being considered when choosing where to reside served as a proxy for residential self-selection and showed a positive relationship with walking in the older adults only.
One environmental variable was significant in predicting the odds of home-based utilitarian walking in both age groups: perceived presence of crosswalks and pedestrian signals (OR = 1.81, p = 0.012, for the older adults; OR = 1.71, p = 0.002, for the younger adults).
For the older adults, perceptions related to having more unattended dogs (OR = 3.07, p = 0.002) and better lighting conditions (OR = 1.65, p = 0.029) were positively associated with utilitarian walking. The presence of religious institutions within the 1-km home buffer (OR = 1.92, p = 0.009) was positively while more sloped (>8.33% or >1:12 slope) areas within the buffer (OR = 0.33, p = 0.049) were negatively associated with walking among the older adults.
For the younger adults, perceptions of slow traffic speed in the neighborhood were positively associated with walking (OR = 1.54, p = 0.016). From the objective variables, the amounts of cultural–entertainment–recreational land use (e.g., public parks, private resorts, and places of assembly) were positively while resource production and extraction land uses (e.g., farms and mines) were negatively associated with utilitarian walking. Objective measured availability of public transportation captured as the presence of intercity transit stops (OR = 3.50, p = 0.011) and the presence of schools (OR = 1.22, p = 0.007) within the 1-km buffer from home were positive predictors; the presence of malls (OR = 0.60, p = 0.022) within the buffer was a negative predictor of walking among the younger adults.
No significant interaction terms were found for the younger age model. For the older adults, two interaction terms were significant: age*income and age*recreational walking. Figures 1, 2 show the predicted probability of becoming a utilitarian walker across the different age ranges (within the older adult group) by income and by recreational walking. The results indicate that age intensifies the negative relationship between annual household income and the probability of utilitarian walking, while age attenuates the positive relationship between hours of recreational walking and the probability of utilitarian walking.

Figure 1. Moderating effect of age: predicted probability of becoming a utilitarian walker by age and income (older adult model). Age (OR = 1.096, p = 0.046, 95% CI = 1.002–1.200); income (OR = 4.623, p = 0.019, 95% CI = 1.286–16.613); age*income (OR = 0.977, p = 0.008, 95% CI = 0.960–0.994).

Figure 2. Moderating effect of age: predicted probability of becoming a utilitarian walker by age and recreational walking (older adult model). Age (OR = 1.025, p = 0.360, 95% CI = 0.972–1.080); recreational walking (OR = 1.348, p < 0.001, 95% CI = 1.197–1.518); age*recreational walking (OR = 0.982, p = 0.029, 95% CI = 0.966–0.998).
We found that both personal and environmental characteristics were associated with adults' utilitarian walking in rural US towns. The findings suggest that walkable NE for older adults could focus on safety-related features. All four significant environmental variables, including lighting, unattended dogs, crosswalks/pedestrian signals, and slope, were directly or indirectly related to the multifaceted concept of safety (39). In addition, perceived availability of sidewalks/shoulders (OR = 1.49, p = 0.098) which approached the significant level is relevant to pedestrian safety. This finding is consistent with previous studies reporting environmental factors associated with utilitarian walking in neighborhoods, in which safety has been one of the most frequently documented domains of correlates (9, 40, 41). Furthermore, older adults are more vulnerable to safety-related environmental challenges due to their functional and cognitive declines (28), and therefore providing safe and barrier-free environments may hold even greater importance to support their walking. One specific finding on unattended dogs that had a positive relationship with walking may be considered counterintuitive, but this can be attributable to the likelihood that those who walk more are more likely to observe unattended dogs. The findings on unattended dogs from previous studies have been inconsistent. For example, a study on the correlates of physical activity among African American women in South Carolina found no significant relations between stray dogs and physical activity (42), while another study among middle-aged and older women reported positive relationships between unattended dogs and physical activity (43).
Steep slope was negatively associated with older adults' utilitarian walking in this study, which was defined as >8.33% (1:12 slope), the maximum slope allowed for wheelchair ramps (44). Previous studies on recreational or exercise walking have reported positive roles of slope among older adults (45) and among adults in general (46). The positive relationships with recreational/exercise walking could potentially be due to hilly areas' co-occurring features and benefits such as attractive views and increased exercise benefits, while hilly terrains may function as a barrier to utilitarian walking in which the walker is primarily interested in reaching the destination easily.
Among the land use-related GIS variables examined in this study, only one variable, having one or more religious institutions within 1 km from their home, was shown to be positively associated with walking among the older adults. This finding suggests limited roles of the land use domain for older adults' walking while also suggesting the strong potential for religious institutions to serve as multifunctional destinations not only for religious services but also for other sociocultural and service activities among older adults. The health beneficial roles of religious involvement have been previously reported, including mortality, well-being, and social support (47, 48). This study's finding on the role of religious institutions as walking-friendly destinations suggests that these institutions may also serve to bring additional health benefits to community-dwelling older adults.
The moderator test for the age effect revealed that two age interaction terms were significant. The age and recreational interaction effect suggests that the positive relationship between hours of recreational walking and the probability of utilitarian walking was weakened with older age. This finding also implies that the two different purposes of walking, recreational and utilitarian, in our study are mutually reinforcing (rather than replacing), but its magnitude is attenuated with age. Income showed an opposite pattern of association. For example, at the age of 65, income is estimated to have little impact on the probably of utilitarian walking. At the age of 80, income is expected to have a strong negative association with the probably of walking (ranging from 0.80 of walking probability for those with less than US $10,000 per year of household income to about 0.35 among those earning more than US $150,000).
More environmental factors, compared to the personal factors and to older adults, were found to be significant for younger adults' walking. From the neighborhood perception domain, perceptions of slow traffic speed and presence of crosswalks and pedestrian signals in the neighborhood were positively associated with their walking. Perceived presence of crosswalks and pedestrian signals was the only environmental variable that showed significance in both age groups and, therefore, worth attention as an intervention target given its consistent significance and its relative affordability for installation. We would anticipate effective interventions from combining crosswalks with raised traffic tables to reduce the traffic speed and/or with pedestrian signals to further enhance pedestrian safety. In addition, recreational walking showed a positive relationship with utilitarian walking in both age groups. Specific relationships (reinforcing, substituting, etc.) between the different types/purposes of walking have not been fully explored in previous studies, and this study adds helpful insights on their relationships.
Land uses were important for the younger adults' walking, more so than for the older adults. The results suggested that incorporating cultural, entertainment, and recreational land uses (e.g., public parks, private resorts, and places of assembly) and schools with walking/running tracks and other recreational facilities open to the public into residential communities could facilitate younger adults' utilitarian walking. However, resource production/extraction land uses (e.g., farms and mines) and malls, which tend to occupy large land areas with extensive surface parking and limited pedestrian accessibility, could discourage their walking. This finding is consistent with previous studies that reported generally positive roles of destinations, measured as land use mix, accessibility to places, etc., in promoting adults' utilitarian walking (9, 49).
The findings from this study may not be generalizable to areas other than the study towns. However, this study went beyond most previous studies that were carried out in a single community by including nine towns from three diverse regions. As a cross-sectional study, only correlational associations among the variables can be established, and there are likely missing covariates not captured in our study, such as additional correlates that may be important to one or the other age group only. The response rate could have been higher with different or additional survey methods, but not feasible for this multi-year, multi-region study. Our respondents had lower representations of younger, male, and Latino populations when compared to the Census data (Blinded for Review, 2014), possibly due to its participant recruitment through landline phone numbers. No formal reliability or validity test results are available for our survey instrument. However, most survey items were adopted directly or modified from existing surveys, and the instrument was finalized after a series of pilot testing. While we considered residential preferences and attitudinal factors related to walking, it is still possible that respondents, compared to non-respondents, comprised those who were more likely to walk or over-reported their walking. However, we do not believe that such possibilities vary by the NE characteristics, which are the key independent variables in this study (Blinded for Review, 2014). We found that perceived lack of time was associated with higher amounts of walking among the older adults. We were not able to use these data to further explore this puzzling finding, but it is possible that those who engage in walking are more likely to be aware of or sensitive to barriers to walking, such as a lack of time.
Our findings suggest that, in rural US towns, NE influences home-based utilitarian walking for all adults. However, safety and slope are important primarily for the older adults, while the availability of recreational opportunities and the absence of malls have more prominent roles for the younger adults. For the older adults, relatively low-cost NE features such as crosswalks and lighting appear effective in stimulating their walking, making them appealing intervention targets especially given the growing number of older adults in the United States. For younger adults, additional interventions requiring longer-term land use changes appear necessary. Increased attention to NE by policymakers and professionals in aging, public health, transportation, and urban planning sectors could lead to increased walking among older and younger adults in rural towns.
The raw data supporting the conclusions of this article will be made available by the authors, without undue reservation.
This study was reviewed and approved by the Institutional Review Boards at the three participating institutions: Texas A&M University, University of Washington, and Dartmouth College.
ChaL: conceptualization, research design, data analysis and interpretation, manuscript writing, and review and finalization. ChuL: data analysis, data interpretation, and manuscript writing. OS: conceptualization, research design, manuscript writing, and data interpretation. HC: conceptualization, data collection, and manuscript review. AA-M: research design, data interpretation, and manuscript review. EB: conceptualization, data interpretation, and manuscript review. MD: research design, conceptualization, data interpretation, and manuscript review. All authors contributed to the article and approved the submitted version.
This study was supported by a grant from the National Institutes of Health (1R01HL103478).
The authors declare that the research was conducted in the absence of any commercial or financial relationships that could be construed as a potential conflict of interest.
The authors wish to acknowledge additional members of this research team—Anne Vernez Moudon, Brian Saelens, Davis Patterson, Glen Duncan, Barbara Matthews, Chuck Huber, Li Li, Phil Hurvitz, Woosung Lee, and Zhipeng Lu—for their inputs and guidance on this research.
1. Taylor AH, Cable NT, Faulkner G, Hillsdon M, Narici M, Van der Bij AK. Physical activity and older adults: a review of health benefits and the effectiveness of interventions. J Sports Sci. (2004) 22:703–25. doi: 10.1080/02640410410001712421
2. Watson KB. Physical inactivity among adults aged 50 years and older—United States, 2014. MMWR. (2016) 65:954–8. doi: 10.15585/mmwr.mm6536a3
3. Lee C, Ory MG, Yoon J, Forjuoh SN. Neighborhood walking among overweight and obese adults: age variations in barriers and motivators. J Commun Health. (2013) 38:12–22. doi: 10.1007/s10900-012-9592-6
4. U.S. Census Bureau. Patterns of Metropolitan and Micropolitan Population Change: 2000 to 2010. (2012). Available online at: https://www.census.gov/prod/cen2010/reports/c2010sr-01.pdf (accessed March 22, 2014).
5. Doescher MP, Lee C, Berke EM, Adachi-Mejia AM, Lee CK, Stewart O, et al. The built environment and utilitarian walking in small US towns. Prevent Med. (2014) 69:80–6. doi: 10.1016/j.ypmed.2014.08.027
6. Koohsari MJ, Sugiyama T, Shibata A, Ishii K, Liao Y, Hanibuchi T, et al. Associations of street layout with walking and sedentary behaviors in an urban and a rural area of Japan. Health Place. (2017) 45:64–9. doi: 10.1016/j.healthplace.2017.03.003
7. Stewart OT, Moudon AV, Saelens BE, Lee C, Kang B, Doescher MP. Comparing associations between the built environment and walking in rural small towns and a large metropolitan area. Environ Behav. (2016) 48:13–36. doi: 10.1177/0013916515612253
8. Hartley D. Rural health disparities, population health, and rural culture. Am J Public Health. (2004) 94:1675–8. doi: 10.2105/AJPH.94.10.1675
9. Saelens BE, Handy SL. Built environment correlates of walking: a review. Med Sci Sports Exer. (2008) 40:S550–66. doi: 10.1249/MSS.0b013e31817c67a4
10. Smith M, Hosking J, Woodward A, Witten K, MacMillan A, Field A, et al. Systematic literature review of built environment effects on physical activity and active transport–an update and new findings on health equity. Int J Behav Nutr Phys Act. (2017) 14:158. doi: 10.1186/s12966-017-0613-9
11. Shigematsu R, Sallis JF, Conway TL, Saelens BE, Frank LD, Cain KL. et al. Age differences in the relation of perceived neighborhood environment to walking. Med Sci Sports Exer. (2009) 41:314. doi: 10.1249/MSS.0b013e318185496c
12. Nagel CL, Carlson NE, Bosworth M, Michael YL. The relation between neighborhood built environment and walking activity among older adults. Am J Epidemiol. (2008) 168:461–8. doi: 10.1093/aje/kwn158
13. Ghani F, Rachele JN, Washington S, Turrell G. Gender and age differences in walking for transport and recreation: are the relationships the same in all neighborhoods? Prevent Med Rep. (2016) 4:75–80. doi: 10.1016/j.pmedr.2016.05.001
14. Hall KS, McAuley E. Individual, social environmental and physical environmental barriers to achieving 10 000 steps per day among older women. Health Educ Res. (2010) 25:478–88. doi: 10.1093/her/cyq019
15. Notthoff N, Carstensen LL. Promoting walking in older adults: perceived neighborhood walkability influences the effectiveness of motivational messages. J Health Psychol. (2015) 22:834–43. doi: 10.1177/1359105315616470
16. Borst HC, de Vries SI, Graham JMA, van Dongen JEF, Bakker I, Miedema HME. Influence of environmental street characteristics on walking route choice of elderly people. J Environ Psychol. (2009) 29:477–84. doi: 10.1016/j.jenvp.2009.08.002
17. Shimura H, Sugiyama T, Winkler E, Owen N. High neighborhood walkability mitigates declines in middle-to-older aged adults' walking for transport. J Phys Act Health. (2012) 9:1004–8. doi: 10.1123/jpah.9.7.1004
18. Rosso AL, Auchincloss AH, Michael YL. The urban built environment and mobility in older adults: a comprehensive review. J Aging Res. (2011) 2011:816106. doi: 10.4061/2011/816106
19. Roman CG, Chalfin A. Fear of walking outdoors. A multilevel ecologic analysis of crime and disorder. Am J Prevent Med. (2008) 34:306–12. doi: 10.1016/j.amepre.2008.01.017
20. Hannon L 3rd, Sawyer P, Allman RM. Housing, the neighborhood environment, and physical activity among older African Americans. J Health Disparities Res Pract. (2012) 5:27–41.
21. Maizlish N, Woodcock J, Co S, Ostro B, Fanai A, Fairley D. Health cobenefits and transportation-related reductions in greenhouse gas emissions in the San Francisco Bay area. Am J Public Health. (2013) 103:703–9. doi: 10.2105/AJPH.2012.300939
22. Clarke P, Gallagher NA. Optimizing mobility in later life: the role of the urban built environment for older adults aging in place. J Urban Health. (2013) 90:997–1009. doi: 10.1007/s11524-013-9800-4
23. Greenfield EA. Using ecological frameworks to advance a field of research, practice, and policy on aging-in-place initiatives. Gerontologist. (2012) 52:1–12. doi: 10.1093/geront/gnr108
24. Alidoust S, Bosman C, Holden G. Talking while walking: an investigation of perceived neighbourhood walkability and its implications for the social life of older people. J Housing Built Environ. (2018) 33:133–50. doi: 10.1007/s10901-017-9558-1
25. Gardner PJ. Natural neighborhood networks—Important social networks in the lives of older adults aging in place. J Aging Stud. (2011) 25:263–71. doi: 10.1016/j.jaging.2011.03.007
26. Stokols D. Translating social ecological theory into guidelines for community health promotion. Am J Health Promot. (1996) 10:282–98. doi: 10.4278/0890-1171-10.4.282
27. McLeroy KR, Bibeau D, Steckler A, Glanz K. An ecological perspective on health promotion programs. Health Educ Behav. (1988) 15:351–77. doi: 10.1177/109019818801500401
28. Lawton MP, Nahemow L. Ecology and the Aging Process. Washington, DC: American Psychological Association (1973).
29. Wahl HW. Theories of Environmental Influences on Aging and Behavior Encyclopedia of Geropsychology. Singapore: Springer (2015). p. 1–8.
30. Golden SD, McLeroy KR, Green LW, Earp JAL, Lieberman LD. Upending the social ecological model to guide health promotion efforts toward policy and environmental change. Health Educ Behav. (2015) 42:8S−14S. doi: 10.1177/1090198115575098
32. Craig C, Marshall A, Sjostrom M. International physical activity questionnaire: 12-country reliability and validity. Med Sci Sports Exer. (2003) 35:1381–95. doi: 10.1249/01.MSS.0000078924.61453.FB
33. Saelens BE, Sallis JF, Black JB, Chen D. Neighborhood-based differences in physical activity: an environment scale evaluation. Am J Public Health. (2003) 93:1552–8. doi: 10.2105/AJPH.93.9.1552
34. Centers for Disease Control and Prevention. Behavioral Risk Factor Surveillance System Survey Questionnaire. Atlanta, Georgia: Centers for Disease Control and Prevention (2019).
35. Umstattd MR, Baller SL, Hennessy E, Hartley D, Economos CD, Hyatt RR, et al. Development of the rural active living perceived environmental support scale (RALPESS). J Phys Act Health. (2012) 9:724–30. doi: 10.1123/jpah.9.5.724
36. Lee C, Moudon AV, Courbois JYP. Built environment and behavior: spatial sampling using parcel data. Ann Epidemiol. (2006) 16:387–94. doi: 10.1016/j.annepidem.2005.03.003
37. Forsyth A, Van Riper D, Larson N, Wall M, Neumark-Sztainer D. Creating a replicable, valid cross-platform buffering technique: the sausage network buffer for measuring food and physical activity built environments. Int J Health Geogr. (2012) 22:14. doi: 10.1186/1476-072X-11-14
38. Fairchild AJ, MacKinnon DP. A general model for testing mediation and moderation effects. Prevent Sci. (2009) 10:87–99. doi: 10.1007/s11121-008-0109-6
39. Loukaitou-Sideris A. Is it safe to walk? Neighborhood safety and security considerations and their effects on walking. J Plan Liter. (2006) 20:219–32. doi: 10.1177/0885412205282770
40. Mirzaei E, Kheyroddin R, Behzadfar M, Mignot D. Utilitarian and hedonic walking: examining the impact of the built environment on walking behavior. Eur Trans Res Rev. (2018) 10:20. doi: 10.1186/s12544-018-0292-x
41. Thomson JL, Goodman MH, Landry AS. Assessment of neighborhood street characteristics related to physical activity in the Lower Mississippi Delta. Health Promot Perspect. (2019) 9:24. doi: 10.15171/hpp.2019.03
42. Ainsworth BE, Wilcox S, Thompson WW, Richter DL, Henderson KA. Personal, social, and physical environmental correlates of physical activity in African-American women in South Carolina. Am J Prevent Med. (2003) 25:23–9. doi: 10.1016/S0749-3797(03)00161-2
43. King AC, Castro C, Wilcox S, Eyler AA, Sallis JF, Brownson RC. Personal and environmental factors associated with physical inactivity among different racial–ethnic groups of US middle-aged and older-aged women. Health Psychol. (2000) 19:354. doi: 10.1037/0278-6133.19.4.354
44. Americans With Disabilities Act of 1990. Public Law 101-336. 108th Congress, 2nd Session (1990).
45. Joseph A, Zimring C. Where active older adults walk understanding the factors related to path choice for walking among active retirement community residents. Environ Behav. (2007) 39:75–105. doi: 10.1177/0013916506295572
46. Lee C, Moudon AV. The 3Ds+ R: quantifying land use and urban form correlates of walking. Trans Res Part D Trans Environ. (2006) 11:204–15. doi: 10.1016/j.trd.2006.02.003
47. Strawbridge WJ, Sheman SJ, Cohen RD, Kaplan GA. Religious attendance increases survival by improving and maintaining good health behaviors, mental health, and social relationships. Ann Behav Med. (2001) 23:68–74. doi: 10.1207/S15324796ABM2301_10
48. Yen HY, Lin LJ. Quality of life in older adults: benefits from the productive engagement in physical activity. J Exer Sci Fitness. (2018) 16:49–54. doi: 10.1016/j.jesf.2018.06.001
Keywords: physical activity, neighborhood environment, rural communities, older adults, walking
Citation: Lee C, Lee C, Stewart OT, Carlos HA, Adachi-Mejia A, Berke EM and Doescher MP (2021) Neighborhood Environments and Utilitarian Walking Among Older vs. Younger Rural Adults. Front. Public Health 9:634751. doi: 10.3389/fpubh.2021.634751
Received: 28 November 2020; Accepted: 13 April 2021;
Published: 04 June 2021.
Edited by:
Katherine Henrietta Leith, University of South Carolina, United StatesReviewed by:
Clas-Håkan Anders Nygård, Tampere University, FinlandCopyright © 2021 Lee, Lee, Stewart, Carlos, Adachi-Mejia, Berke and Doescher. This is an open-access article distributed under the terms of the Creative Commons Attribution License (CC BY). The use, distribution or reproduction in other forums is permitted, provided the original author(s) and the copyright owner(s) are credited and that the original publication in this journal is cited, in accordance with accepted academic practice. No use, distribution or reproduction is permitted which does not comply with these terms.
*Correspondence: Chanam Lee, Y2hhbmFtQHRhbXUuZWR1
Disclaimer: All claims expressed in this article are solely those of the authors and do not necessarily represent those of their affiliated organizations, or those of the publisher, the editors and the reviewers. Any product that may be evaluated in this article or claim that may be made by its manufacturer is not guaranteed or endorsed by the publisher.
Research integrity at Frontiers
Learn more about the work of our research integrity team to safeguard the quality of each article we publish.