 M. Abbas Virji
 Laura Kurth
95% of researchers rate our articles as excellent or good
Learn more about the work of our research integrity team to safeguard the quality of each article we publish.
Find out more
MINI REVIEW article
Front. Public Health , 08 January 2021
Sec. Occupational Health and Safety
Volume 8 - 2020 | https://doi.org/10.3389/fpubh.2020.611693
This article is part of the Research Topic Occupational Exposure Assessment In The Evolving World Of Work View all 8 articles
Peak exposures are of concern because they can potentially overwhelm normal defense mechanisms and induce adverse health effects. Metrics of peak exposure have been used in epidemiologic and exposure studies, but consensus is lacking on its definition. The relevant characteristics of peak exposure are dependent upon exposure patterns, biokinetics of exposure, and disease mechanisms. The objective of this review was to summarize the use of peak metrics in epidemiologic and exposure studies. A comprehensive search of Medline, Embase, Web of Science, and NIOSHTIC-2 databases was conducted using keywords related to peak exposures. The retrieved references were reviewed and selected for indexing if they included a peak metric and met additional criteria. Information on health outcomes and peak exposure metrics was extracted from each reference. A total of 1,215 epidemiologic or exposure references were identified, of which 182 were indexed and summarized. For the 72 epidemiologic studies, the health outcomes most frequently evaluated were: chronic respiratory effects, cancer and acute respiratory symptoms. Exposures were frequently assessed using task-based and full-shift time-integrated methods, qualitative methods, and real-time instruments. Peak exposure summary metrics included the presence or absence of a peak event, highest exposure intensity and frequency greater than a target. Peak metrics in the 110 exposure studies most frequently included highest exposure intensity, average short-duration intensity, and graphical presentation of the real-time data (plots). This review provides a framework for considering biologically relevant peak exposure metrics for epidemiologic and exposure studies to help inform risk assessment and exposure mitigation.
Exposures vary considerably over time however, exposure dynamics are not consistently incorporated in epidemiologic exposure-response modeling; instead, summary metrics are used. Summary metrics ideally reflect the underlying biological processes linking exposure to dose and ultimately to the adverse health outcome (1, 2). More commonly, summary metrics used in epidemiologic studies are driven by the types of exposure measurements and data available and are therefore often surrogates of dose including qualitative and quantitative metrics of peak exposure. Peak exposures, i.e., high-intensity exposures over short-duration, are of concern because they can potentially overwhelm the capacity of normal biological defense mechanisms and induce adverse acute and chronic health effects (3).
Peak exposure metrics are often used in studies of acute respiratory effects (4) and some chronic disease outcomes (5). Acute or irritant effects of peak exposures are well-recognized and correspondingly, short-term exposure limits (STEL) or ceiling limits have been established for many substances to protect against the effects of intermittent high exposures (6). Peak exposure to ammonia or hydrogen chloride can result in mild but not trivial effects such as respiratory irritation, while peak exposure to hydrogen cyanide or hydrogen sulfide can cause serious acute effects which can be fatal (7). Epidemiologic studies have also observed associations of peak exposures with chronic conditions such as cancers or asthma, in which intense exposure over a short-duration during a relevant time window in the disease process surpasses a threshold, and initiates biological responses that subsequently result in adverse health outcomes (8, 9). Recent outbreaks of acute or accelerated silicosis and rapidly progressive pneumoconiosis associated with short-term high silica-content dust exposures in coal miners or engineered stone fabrication workers exemplify chronic effects of high exposures over short periods (10–12).
While the concept of peak exposure is well-recognized, there is little consensus in the literature on characterizing peak exposure, specifically identifying relevant peak exposure characteristics such as exposure intensity, duration, time interval between peaks, frequency of peaks, aggregation of peaks or absolute (exposures above a target value) vs. relative peaks (exposures above average of the series) (8, 13, 14). Since peak exposure metrics are not consistently defined or utilized, they may be overlooked as an exposure metric in epidemiological studies where average or cumulative exposure metrics are used instead, potentially leading to bias in estimates of exposure-response associations (15). Selecting an inappropriate summary metric results in a form of non-differential exposure misclassification not often discussed in epidemiologic studies (2), that likely includes both random and systematic errors. While non-differential exposure misclassification often leads to attenuation bias, i.e., bias toward the null in the measure of association (16), systematic errors can lead to bias toward or away from the null depending on the direction of the systematic error. For example in two separate studies, cumulative exposure, a commonly used summary metric in chronic disease epidemiology was not associated with toluene diisocyanate (TDI)-related occupational asthma or beryllium sensitization, but significant associations were observed with metrics of TDI peak exposure events and average or highest beryllium job exposures, respectively (17, 18). Thus, use of inappropriate summary metric may have led studies to miss important associations.
The relationship between exposure and adverse health outcomes is complex, varies over time, and is linked through two processes, exposure-burden (toxicokinetics) and burden-effect (pharmacodynamics) relationships (1, 2, 7). Inhaled exposure undergoes absorption, distribution, metabolism and excretion, with burden at the target tissue accumulating over a relevant period (dose) leading to repair processes and accumulation of damage at the cellular level which ultimately determines the health outcome (19, 20). The rate of accumulation at the target tissue can affect the type and the severity of the outcome, and is in part dependent upon exposure variability and physicochemical characteristics of the substance; a high dose rate may alter metabolism (e.g., via saturation), overload repair mechanisms and amplify response leading to non-linear (not proportional to exposure) effects (3). Peak exposures are important when exposures are variable, and this variability is transmitted to variability in burden through rapid kinetics and short half-times as in the case of irritant and acute respiratory effects, as well as for some chronic outcomes with non-linear effects; examples of non-linear effects include changes in uptake or susceptibility, synergism or antagonism, and allergies, all leading to amplification of response (6, 8). In the latter case, highest exposure, exposure excursions or upper percentiles of exposure distribution during a biologically-relevant time window may be more appropriate (3). The dose and the rate of accumulation at the target tissue can be estimated using toxicokinetic models to understand exposure kinetics and develop relevant exposure or dose metrics for epidemiologic studies (3, 6, 21). Smith and Kriebel propose that appropriate summary metrics of the time-varying exposure or dose can be selected from one of four simplified dose-effect process models obtained by combining the time course of effects (reversible vs. non-reversible) with whether the effect is proportional to dose (discrete vs. proportional); episodic asthma exacerbation is an example of a reversible, discrete disease process with a short etiologic time interval for which peak exposure is a relevant summary metric (20).
Exposure assessment ideally includes measurement data, which are variable in time scales (e.g., minutes, years) with different implications for exposure assessment depending on the health outcome. Peak exposure measurements for acute effects may be collected in the time scale of minutes to hours over days to weeks, whereas for chronic effects, full-shift measurements and their distributions over months to years may be relevant, depending on the observation period of the study (8). There is limited guidance from standard setting agencies or health and safety associations on exposure assessment strategies to define, measure, or interpret peak exposure (22, 23). Additionally, the little guidance that exists on sampling duration to assess peak exposures for comparison to STELs often call for 15-min sampling or averaging times, an approach historically based on the limitations of exposure monitoring (3). Sampling duration determinations should ideally account for the kinetics of the substance and the capabilities of analytical methods or real-time instruments (7, 19).
Peaks can arise from normal process variation (regular peaks) or from process upset conditions and non-routine operations (irregular peaks) (24, 25). Regular peaks are more likely identified using exposure data from routine monitoring, whereas irregular peaks can be missed without continuous monitoring to account for unplanned events, non-routine operations, or less-frequently performed tasks. Irregular peaks are more frequently identified qualitatively through inquiries of events/activities in questionnaire surveys or during investigations of occupational illnesses or accidents. Quantitative peak metrics are ideally obtained from real-time measurements however, they are often unavailable. Additional considerations include autocorrelation among successive measurements (6, 7) which can amplify health effects (3), limitations of sampling and analytical methods for short-duration measurements and performance capabilities of real-time instruments.
A variety of approaches using different averaging times or methods have been used to define peak exposure (4, 26). For the most part, the definitions of peak exposure are not based on explicit biological mechanisms and the toxicokinetics of the substance is generally not reported. These metrics are most useful when they are correlated with the true, biologically-relevant peak measure. This literature review aims to summarize peak exposure metrics commonly used in epidemiologic and exposure studies to improve our understanding of peak exposures and the considerations for defining peaks such as health outcome of interest, disease mechanism, kinetics of substance and sampling, and analytical capabilities of methods and instruments.
A comprehensive search of the published literature was conducted to identify potentially relevant literature using peak exposure metrics in epidemiological and exposure studies. An initial literature search was conducted in 2014 and updated in 2017 and 2019 utilizing multiple databases including Medline, Embase, and Web of Science to identify articles with the search keywords “environmental monitoring,” “maximum allowable concentration,” “occupational exposure,” “threshold limit values,” “peak exposure(s),” “short-term exposure,” “highest exposures,” “exposure-tails,” “spills,” “accidental exposures,” “acute exposures,” “exposure excursions,” “irregular exposures,” and “intermittent exposures.” The final list of keywords was drawn in part from how peaks were referenced in the published literature. Bibliographies of selected articles were also searched for relevant literature to include, as well as articles obtained from personal archives. Overall, 652 references retrieved from these searches were combined in an Endnote library and duplicate references were removed resulting in 588 references. We also searched NIOSHTIC-2, a bibliographic database of occupational safety and health publications supported by the National Institute for Occupational Safety and Health (NIOSH) using the search term “peak exposure.” The search in NIOSHTIC-2 identified 563 NIOSH-supported abstracts, reports and publications.
Full text versions of the references were obtained and reviewed by two reviewers. The first reviewer excluded studies that were not available in English or did not meet inclusion criteria. References were excluded if they used the term “peak” in the wrong context, e.g., “peak” season, “peak” expiratory flow; evaluated the impact of an intervention or prevention strategy without a defined “peak”; studied a non-adult population; lacked detailed peak metric data; or had ≤5 subjects. Literature identified through NIOSHTIC-2 were reviewed using the above exclusion criteria. NIOSH Health Hazard Evaluation and Survey reports (27) were excluded. Included studies were categorized as either epidemiological or exposure studies.
A second reviewer examined the studies to define the scope of the review and made a final determination on study inclusion. For the epidemiologic studies, the review was focused on all health outcomes associated with occupational chemical or particulate exposures. For the exposure studies, the scope was broadened beyond occupational chemical or particulate exposures to also include exposure to noise, electromagnetic radiation, and environmental pollutants. The first reviewer then examined full text, published articles and reports, and selected articles for indexing if the concept of peak exposure was mentioned together with peak characteristics e.g., sampling strategy, duration, summary metric, described in data extraction section below; articles were excluded if they referred to highest exposure as “exposure peaks” but did not use a peak exposure metric in epidemiologic analysis. If a full text version was not available but all relevant information could be extracted from the abstract, then the reference was included. Conference abstracts identified in the search were also included if all relevant information could be extracted from the conference abstract. The combined search strategies resulted in 1,215 studies from which 182 relevant studies were indexed and summarized.
Data were extracted from each reference to create a database summarizing the health outcome for epidemiological studies and specific exposure characteristics for all studies. For epidemiological studies, the database included information on epidemiologic study design, industry and occupation, health outcome measure and classification, method and frequency of measuring health outcome, the observation period of the health outcome, and details on peak exposure including the substance, sample type, sampling strategy, exposure assessment period and frequency, averaging time, sampling instrument, and peak exposure summary metric. For exposure studies, the database included only information on exposure characteristics noted above. The final step was to group all epidemiologic studies into groups of similar health outcomes, and the exposure studies into groups of classes of exposure.
After exclusions, 72 epidemiologic studies and 110 exposure studies were retained, and relevant details, including peak metrics and exposure characteristics, were extracted and reported in Supplementary Tables 1, 2, respectively.
Table 1 summarizes the 72 epidemiological studies that evaluated relationships between peak chemical or particulate exposures and health outcomes. Chronic respiratory effects were most frequently examined (28%) followed by various cancers (21%) and acute respiratory and irritation effects (17%). Most studies (82%) evaluated a chronic health outcome and ascertained health outcomes using questionnaire (61%) and/or physiological, functional, or biochemical testing (54%). Studies evaluated peak exposure to particulates, gases, metals, solvents, or other substances often using personal sampling methods and task-based (36%) or full-shift (33%) time-integrated monitoring, qualitative assessments (28%), or real-time monitoring (25%). The most common peak exposure summary metrics included “Yes/No event” to an event or measurements above a target (62%) and the highest measured exposures (33%).
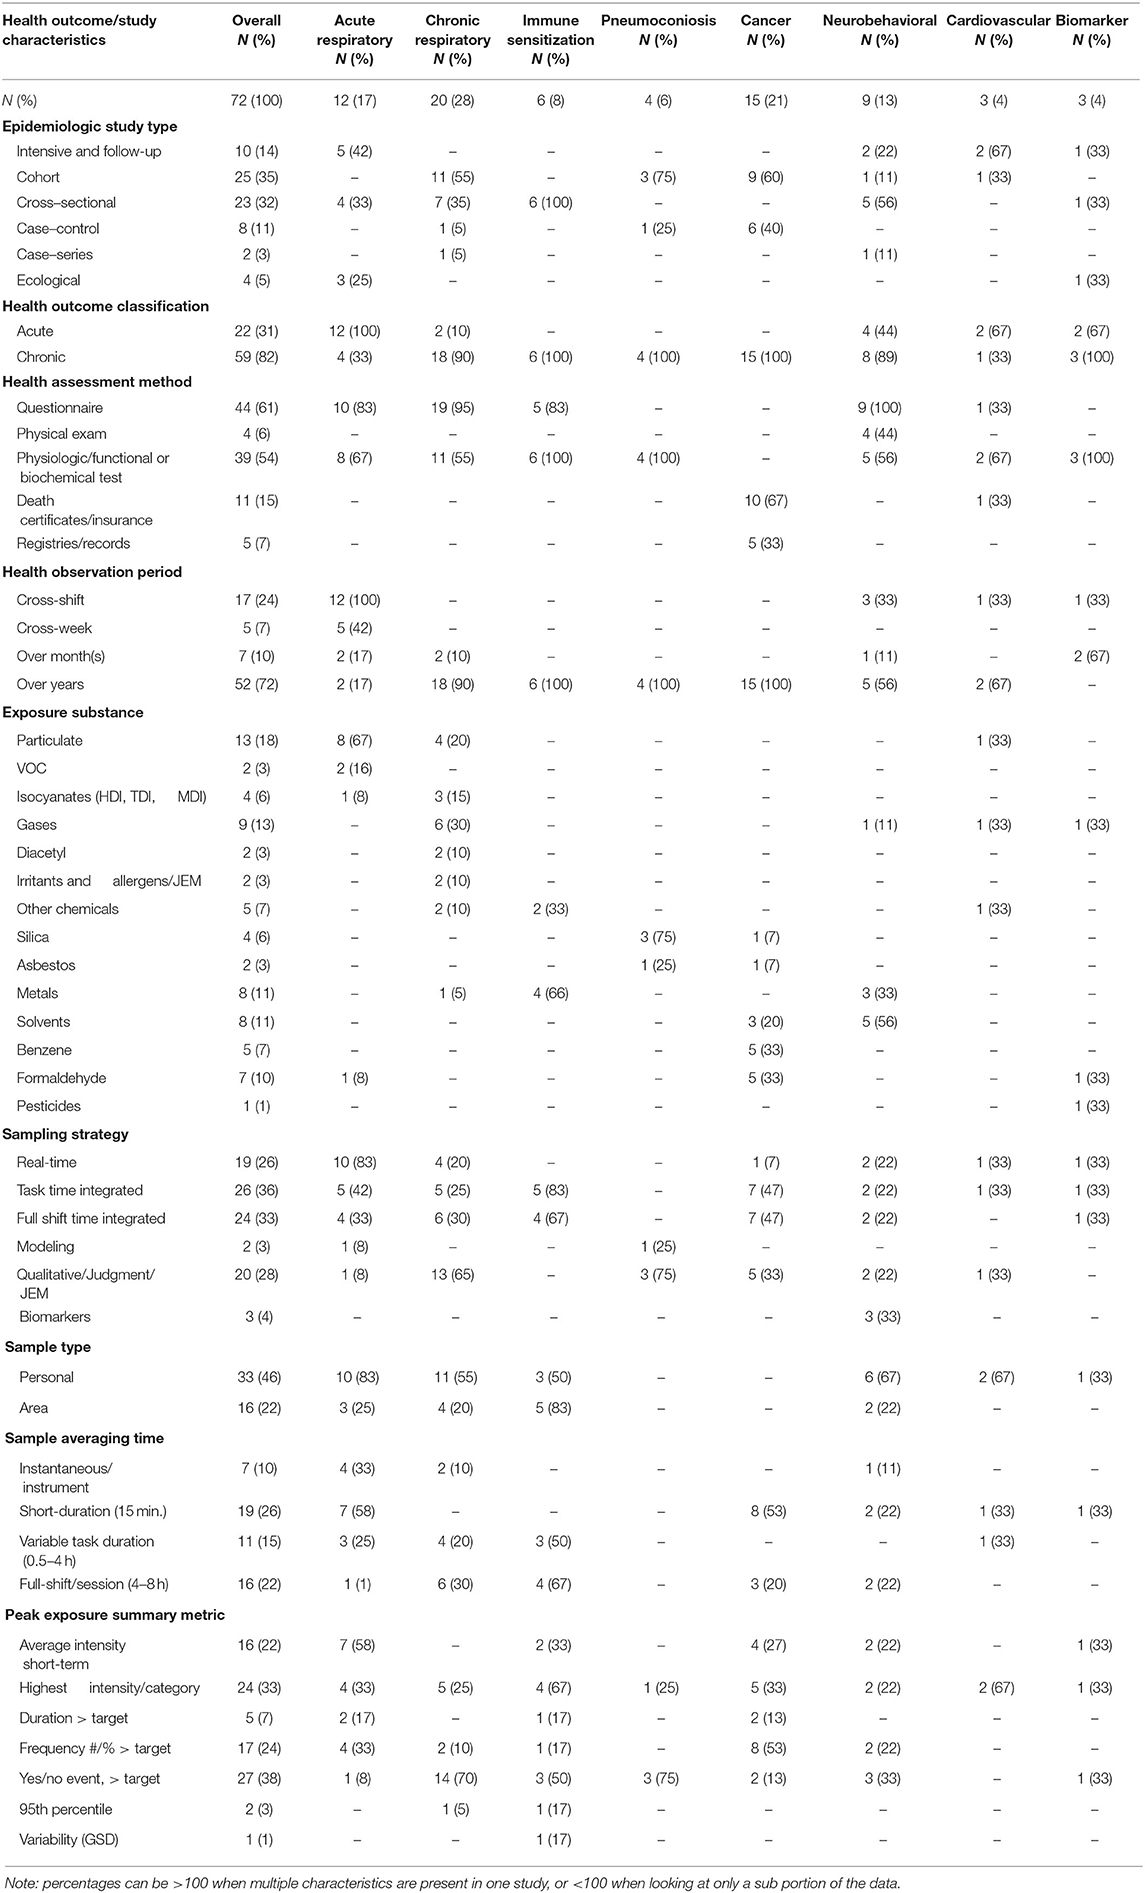
Table 1. Characteristics of peak exposures metrics used in epidemiologic studies.
Of the 12 studies evaluating acute respiratory and irritation effects (4, 28–38), all studies evaluated cross-shift acute effects while four studies also evaluated chronic effects by follow-up assessments. Questionnaires were commonly used to assess health outcomes (83%), while spirometry or biochemical tests were conducted in 67% of studies. Most studies (67%) evaluated exposures to particulate matter including dust, welding fumes, wood dust, nano materials, and sodium borate, using personal monitoring (83%) and real-time instruments (83%). For averaging times, 92% of studies utilized 15-min averages or instantaneous measurements (recording interval depended on the instrument). Peak metrics used included average short-duration intensity (58%), highest intensity (33%), and frequency greater than a target concentration (33%).
Most of the 20 studies evaluating chronic respiratory effects (39–58) were cohort studies (55%) focused on asthma (55%), and two also evaluated acute health effects. Questionnaires were used to assess health outcomes in most studies (95%) along with spirometry or biochemical tests (55%). Asthma, respiratory symptoms, and other acute respiratory diseases were most frequently inferred through questionnaire or self-reports. Studies most frequently (30%) evaluated exposure to gases (ozone, sulfur dioxide, and chlorine), and the remainder included particulates (soy dust, metal dust, rayon, and nylon flock dust), isocyanates, diacetyl, other chemicals, and irritants and allergens from a job-exposure matrix (JEM). Qualitative assessment of peak events (65%) was common, as was personal monitoring (55%) using full-shift (30%) sampling. Peak metrics used included Yes/No event (70%) and highest intensity (25%). Some studies collected real-time particulate measurements (42, 44, 45) or real-time or time-integrated diacetyl measurements (51, 52) to characterize peak exposures during specific tasks, but used qualitative metrics indicating the performance or frequency of a task in the analysis.
All six sensitization studies (18, 59–63) were cross-sectional and evaluated sensitization from beryllium (67%) and hexahydrophthalic anhydride or methylhexahydrophthalic anhydride (33%) via serological testing. All studies conducted either personal (50%) or area monitoring (83%), using full-shift sampling (67%) or short duration task sampling (83%); real-time instruments were not used in any of the studies. Frequently reported peak metrics included highest intensity (67%) and Yes/No event (50%).
The four pneumoconioses studies (8, 64–66) evaluated silicosis and pneumoconiosis from silica and dust exposures (75%) and pleural plaques from asbestos exposure (25%) via radiographic methods. Some exposure monitoring was conducted to create qualitative peak metrics but was not directly used in epidemiologic studies. Peak metrics used included Yes/No event (75%) and highest intensity (25%).
Of the 15 studies evaluating cancer (67–81), most (67%) were mortality studies from death certificates and insurance records, and 33% identified cases from cancer registries and medical records. Studies evaluated exposures to formaldehyde, benzene, silica, asbestos, total hydrocarbons, styrene, and acrylonitrile. The most common exposure assessment methods were short duration task and full-shift monitoring (47% each) and 53% of studies had averaging times of 15 min or less. The most used summary metric was frequency greater than a target concentration (53%) and highest intensity (33%). Several studies (67, 69, 70, 79, 81) did not report details of exposure assessment methods e.g., measurement type or type of sampling. Most studies examined multiple peak exposure metrics.
Of the nine neurobehavioral studies (82–90), eight studies (89%) evaluated a chronic outcome, while four studies (44%) also evaluated acute effects. All studies assessed health effects by questionnaire and a combination of clinical evaluation and physiological or functional testing. Exposures most frequently evaluated included organic solvents (vinyl chloride, trichloro ethylene, styrene, etc., n = 5), while three studies (33%) evaluated metals exposures (mercury, lead). Personal monitoring was conducted in 67% of studies and over half (55%) reported 15-min averages or full-shift exposures. A variety of summary peak exposure metrics were used including Yes/No event (33%), yet several studies (82, 84) did not utilize the exposure metrics in epidemiological analysis.
Of the three studies on cardiovascular outcomes (91–93), two were panel studies and one was a historical cohort evaluating cardiovascular mortality from death certificates. Substances evaluated included PM2.5, carbon disulfide and dioxin. Two studies conducted personal exposure monitoring utilizing 24-h real-time monitoring and short duration sampling. Peak metrics included highest intensity (67%) and Yes/No event (33%).
Of the three studies assessing biomarkers (94–96), all were assessed via physiologic or biochemical testing. Substances evaluated included pesticides, carbon monoxide, and formaldehyde. Two studies conducted exposure monitoring, one utilizing real-time monitoring and one short-duration/full-shift sampling. Peak metrics included highest intensity (33%), average short duration (33%), and Yes/No event (33%).
Table 2 summarizes the 110 studies that evaluated a peak exposure to a chemical, particulate, or physical exposure in occupational or environmental settings. Exposures evaluated included environmental exposures (31%), organic chemicals (28%), particulates (22%), gases (12%), and physical agents (12%). Exposure studies most frequently assessed exposure by personal monitoring sampling (66%), using real-time sampling strategies (76%), and short-duration sample averaging time (24%). Averaging times varied and highest exposure intensity (93%) was the most frequently reported peak exposure summary metric.
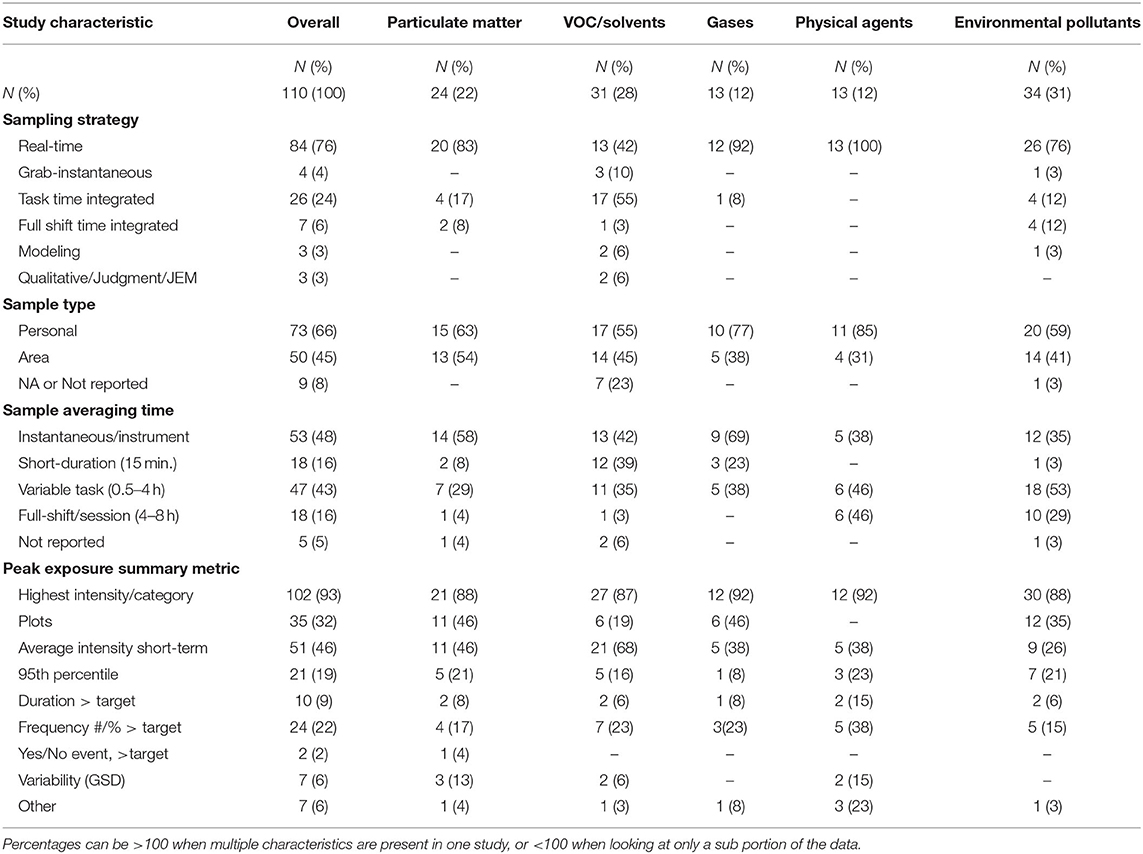
Table 2. Characteristics of peak exposures metrics described in exposure studies.
The 24 (22%) studies measuring peak particulate matter exposure (14, 26, 97–118) included assessments for fine, ultrafine, and nanoscale particulates (50%), respirable, inhalable or total dust (38%), or specific substances (21%) (e.g., beryllium, black carbon). For quantitative exposure, 63% conducted personal monitoring mostly using real-time instruments (83%). Over half (58%) reported instantaneous measurements and 29% reported variable short-duration average intensity. The most frequently reported peak metrics included highest intensity (88%), plots (46%), and average short-duration intensity (46%).
The 31 (28%) studies measuring peak exposure to organic chemicals (13, 116, 119–147) included assessments for volatile organic compounds (VOCs) (29%), solvents (32%), formaldehyde (16%), and other hydrocarbons (19%). Personal monitoring was conducted in 55% of studies using short-duration (55%) and real-time monitoring (42%). Time intervals for sampling included instantaneous measurements (42%), 15-min (39%) and variable short-duration (25%) average exposures, and peak metrics included highest intensity (87%) and average short-duration intensity (68%).
The 13 (12%) studies measuring peak exposure to gases (104, 108, 119, 123, 148–155) included assessments for carbon monoxide (46%), oxides of nitrogen (31%), carbon dioxide and ammonia (23% each), hydrogen sulfide (15%), and sulfur dioxide and chlorine (8% each). Personal monitoring was conducted in 77% of studies most frequently utilizing real-time instruments (92%) and instantaneous measurements (69%). Peak metrics used most frequently included highest intensity (92%), plots (46%), and average short-duration intensity (38%).
The 13 (12%) studies measuring peak exposure to physical agents (110, 156–167) included assessments for noise (46%) and electromagnetic frequency (54%). Personal monitoring was conducted in 85% of studies, all utilizing real-time instruments. Studies reported variable short-duration average intensity (46%), full-shift measurements (46%), and instantaneous measurements (38%). Most frequently reported peak metrics included highest intensity (92%), average short-duration intensity (38%), and frequency greater than a target concentration (38%).
One occupational study (168) developed a qualitative (Yes/No event) peak accidental exposure metric based on professional judgment for a JEM, which did not fit into any of the above exposure categories and was not included in Table 2.
Environmental exposure studies reported a variety of peak exposure metrics. The 34 (31%) studies measuring peak exposure to environmental pollutants (125, 169–201) included assessments for particulate matter (53%), polycyclic aromatic hydrocarbons (PAH)/VOCs (21%), oxides of nitrogen, carbon monoxide/dioxide and black carbon (12% each), ozone (6%) and ammonia, metal and noise (3% each). Personal monitoring was conducted in 59% of studies most often utilizing real-time instruments (76%) and short-duration monitoring (12%). Most studies (53%) reported variable short-duration average intensity or instantaneous measurements (35%). The most reported peak metrics included highest intensity (88%) and plots (35%).
A comprehensive literature review was conducted to summarize peak exposures in epidemiologic and exposure studies in order to better understand peak exposures and instill consistency in measuring and creating peak metrics for future studies. Most epidemiologic studies evaluated a chronic effect, and fewer considered acute effects for which peak or short-duration exposures would be relevant and advantageous, and for which STELs are more often specified. Interestingly, quantitative exposure data were available for most studies, but were not of adequate quality or detail to construct more complex metrics beyond binary, maximum or average exposure metrics. Most studies did not explicitly note the disease mechanism or biological basis for the postulated peak exposure-response relationships which are necessary to construct biologically valid peak exposure summary metrics to ensure valid health risk estimates (9, 20). Future studies could benefit from multi-disciplinary collaborations in developing novel metrics of peak exposure and to better capture the biological processes underpinning the exposure-response relationships.
The expanded search of exposure studies to include physical hazards and environmental pollutants provided a broader context of peak characterization. Most exposure studies utilized real-time or short-duration task-based sampling with sampling duration ≤15 min. Highest exposure intensity was the most frequently reported peak exposure summary metric, but average short-duration intensity and plots were also common. Statistical methods that account for non-stationary autocorrelation or measurements below the detection limit in real-time exposure data were not considered, instead favoring examples of plots and highest measured exposure. Peak metrics can be used in epidemiologic studies, or in industrial hygiene applications to make decisions on interventions, or to evaluate the efficacy of control measures (112). Peak exposures during specific tasks can have a substantial impact on full-shift average exposures, and this information can be used to design efficient control strategies focused on limited high-exposure tasks (14) and to demonstrate the benefits of changing work practices when linked to video exposure monitoring.
Epidemiologic studies of acute effects were predominantly for respiratory outcomes utilizing personal real-time exposure measurements summarized over 15 min or less. The most common peak exposure summary metrics were average and highest short-duration exposure, as well as the frequency and duration of measurements above a target value. Even within this narrower class of health outcomes focused on acute respiratory effects, there was little consistency in exposure data used or summary metrics created, and little discussion on biological basis for defining peak exposure and the underlying biological processes linking exposure to health outcome. Notable exceptions include a set of studies on the acute respiratory effects of sodium borate dust which measured real-time exposures of 106 participants on 4 consecutive days and real-time self-reported symptoms and their severity, as well as symptoms and spirometry at hourly interval during work hours (4, 26, 29, 37, 202). These studies used 15-min average exposure and nasal dose estimates and explained their choice of averaging time in terms of the underlying biological processes and the time course of experiencing respiratory irritation (29, 38). From the review of exposure studies, novel and interesting metrics of peak exposures based on intensity, duration, time interval between peaks, frequency, and aggregation of peaks, and absolute vs. relative peaks from real-time data have been proposed but not utilized in epidemiologic studies. A study of healthcare workers utilized a Bayesian approach to model VOC exposure time-series to estimate 5- and 15-min, task-specific exposure summaries including (posterior distributions of) geometric means (GM), geometric standard deviations (GSD), and quantiles such as 95th percentile (P95) (147). In another study of electric utility workers exposed to extremely low-frequency magnetic fields, exposure patterns were described by conducting a frequency-domain time-series analysis and grouping workers based on the frequency patterns of exposure time series (203). Studies of VOC exposures in spray painting operators (13) and dust exposures in flour processing workers (14), created a range of relative or absolute peaks using 5-s, 1- or 15-min moving averages, including: number of peaks per hour, duration of peaks, average, and maximum concentrations of the peaks and their ratios, and average duration between peaks. Understanding the effect of short-duration exposures, there are efforts to develop task or job-task exposure matrix for use in epidemiological studies (204, 205).
Epidemiologic studies of chronic effects evaluated various health outcomes including respiratory, cancer, cardiovascular and neurobehavioral outcomes. Quantitative measurements were available for many studies, however, most used peak exposure summary metrics including Yes/No to an event and the highest or average intensity. Notably, a study of beryllium manufacturing workers created and evaluated a range of qualitative and quantitative peak exposure metrics including summaries (GM, GSD, Maximum, P95, frequency > target, duration of exposure, duration > target) from full-shift and short-duration exposure measurements; qualitative metrics included company recorded events such as leaks and upset conditions, ventilation or equipment failure and reportable spills, and instances of evacuations, and self-reported high exposures, and participation in decontamination and spills clean-ups, to assess their utility in predicting beryllium sensitization (61). This study reported the biological processes underpinning the relationship between peak exposure and sensitization and found moderate to high correlation among the various metrics with most performing equivalently in epidemiological analyses. Notably, the reviews by Checkoway et al. (8, 9) highlight the challenges of assessing peak exposures for chronic disease where the timing of exposure is often important and detailed information on peak exposures over a period of years is often lacking.
Of the 72 epidemiologic studies, 52 evaluated multiple metrics in their study, such as peak, average or cumulative (Supplementary Table 1). Of these studies, many did not observe significant associations between the health outcome and any of the exposure metrics or did not report all measures of association. However, in 10 studies, peak metrics were reported to perform better than average or cumulative exposure metrics in terms of the magnitude of effect, albeit not always statistically or clinically significant. In these studies, exposure-response relationships based on accepted biological plausibility often demonstrated significant associations with peak metrics (44, 64, 66, 69, 75, 87). For example, risk of silicosis was better predicted by brief, short-term quartz exposure (64) and relative peak quartz exposures (as well as average non-peak exposures) compared to cumulative exposures (69). Likewise, high dust levels from peak quartz measures were a better predictor of pneumoconiosis than average exposures in a study of iron ore mine and beneficiation plant workers (66). Many studies evaluating multiple exposure metrics reported moderate to high correlations between average and peak exposure metrics that often resulted in either an association with all exposure metrics or no association with any exposure metrics. Ultimately, consideration of biological processes that underlie the exposure-response relationship in creating or selecting exposure metrics will lead to a more systematic and justified approach to defining peak metrics, though not necessarily a unified definition of peaks.
The often-used time-integrated sampling methods, while specific, are not time-resolved and do not capture peaks, requiring use of peak surrogates. There is renewed and growing interest in the development of direct reading instruments that have improved sensitivity, detection limit, specificity, multiplexing capability, and other enhanced performance characteristics (206), which hold tremendous promise of novel peak exposure metrics for use in epidemiologic studies of acute effects (13, 14, 203, 207). Real-time exposure monitoring provides flexibility in post-hoc definitions of peaks, and in examining the correlations among the various peak metrics and their utility in predicting risk of health effects. To emphasize the importance of developing and using direct reading real-time instrumentation in exposure assessment, NIOSH launched the direct reading exposure assessment methods (DREAM) initiative and established the NIOSH Center for Direct Reading and Sensor Technologies (NCDRST) to coordinate research and develop guidance on direct reading and sensor technologies. Despite the historical use and renewed interest in direct reading instruments for exposure assessment, there is limited quantitative exposure metrics generated by these instruments for use in occupational exposure assessment and epidemiology. As shown in this review, while real-time data are often used in exposure and epidemiologic studies, they are not appropriately summarized or fully utilized, often resorting to calculating averages, selecting highest exposures, or displaying plots of typical profiles. Some studies have provided guidance on extracting various metrics of peak exposure in the time or frequency domains of real-time data based on intensity, duration, time interval between peaks, frequency, aggregation of peaks, and patterns based on the frequencies at which high amplitude (peaks) occur (13, 14, 203). Principal components analysis of these peak metrics revealed three independent factors related to intensity, variability, and duration that sufficiently characterized peak exposures (13), which is consistent with their expression in terms of real-time exposure distribution parameters and autocorrelation, i.e., the GM, GSD, and autocorrelation coefficient (207). Recently, a statistically rigorous method was proposed to analyze real-time data that simultaneously accounts for censored data, fixed-effects covariates, hierarchical random-effects, and non-stationary autocorrelation and was fit using Markov-Chain Monte Carlo within a Bayesian context; the model provides a range of summary measures such as the mean, standard deviation and various quantiles of interest for a choice of short-durations e.g., 15-min (208). This method was used in a study of healthcare workers' exposure to VOCs in which peaks were quantified as the median of the posterior distributions of the 95th percentile of short-duration (15-min averages) task, a metric that is easy to interpret when used in epidemiologic studies, to make decisions on interventions, or to evaluate the efficacy of control measures (147). While limited guidance and examples exist on analyzing real-time data, these methods are complex, requiring familiarity with advanced statistical methods and packages making their wide-spread use unlikely. More user-friendly tools are needed to encourage more regular use and application of such complex methods to analyze real-time data.
Certain limitations exist in this study. While a comprehensive literature search was conducted involving searching multiple databases and references of identified studies to protect against selection bias, the search was not exhaustive. In addition, we found peak metrics to be highly diverse and inconsistent across studies resulting in challenges summarizing the reviewed studies and deriving generalizable definition of peaks and performance of various peak metrics. Only one reviewer selected studies for the review; two independent reviewers may have decreased the chance of systemic error and bias. The search terms were designed to be more inclusive of studies, especially given the variety of terms used to describe the concept of peak exposure; the search also included abstracts with sufficient information on the peak exposure metrics to complete the data extraction table (Supplementary Tables 1, 2) e.g., sampling strategy, duration, summary metric. However, studies of short-duration task exposures that did not address the concept of peak exposures were excluded. Studies were included without consideration of the magnitude or statistical significance of association, as the objective was to summarize the metrics used and not the strength of any particular exposure-response relationship. Restricting this review to epidemiologic studies of chemical and particulate peak exposures kept the scope of the review manageable but limited its comprehensiveness as peak exposures to physical and environmental hazards in epidemiological studies were not assessed.
Peak or short-duration exposures are important in studying acute effects as well as some chronic conditions, but peaks are not consistently defined or used in epidemiologic studies and limited guidance exists on strategies for monitoring peak exposures. This review provides an overview of peak exposure metrics commonly used in epidemiologic and exposure studies and identifies the challenges of conducting exposure assessments. While consensus recommendations are not provided or a single peak metric is not recommended, examples of peak exposure approaches and considerations for defining peak are provided. Exposure assessment for epidemiologic studies requires consideration of the complex biological processes underlying exposure-response relationships, which are often unknown. Numerous factors determine the assessment of peak exposures including exposure patterns and variability, physicochemical properties of the exposure substance, the disease mechanism and time course, as well as exposure levels at which effects occur. This review summarizes peak exposure metrics, highlights examples of studies, and identifies factors to consider in developing peak exposure metrics for epidemiologic exposure-response studies that will result in accurate estimates of health risks and appropriate exposure mitigation strategies to reduce morbidity and mortality.
MV and LK contributed to all stages of the manuscript from conception and design of the literature search to review of selected papers, extraction summarization of papers, drafted, revised, and approved the submitted version of the manuscript. All authors contributed to the article and approved the submitted version.
This work was supported by the National Institute for Occupational Safety and Health (NIOSH).
The findings and conclusions in this report are those of the authors and do not necessarily represent the views of the National Institute for Occupational Safety and Health (NIOSH). Mention of any company or product does not constitute endorsement by NIOSH.
The authors declare that the research was conducted in the absence of any commercial or financial relationships that could be construed as a potential conflict of interest.
The authors wish to thank librarians at the CDC Public Health Library and Information Center, including Joanna Taliano, and Anand Ranpara for their help performing the literature search for this review, as well as Drs. Aleksandr Stefaniak and Ethan Fechter-Leggett for critical review of this manuscript prior to submission to the journal.
The Supplementary Material for this article can be found online at: https://www.frontiersin.org/articles/10.3389/fpubh.2020.611693/full#supplementary-material
1. Kriebel D, Checkoway H, Pearce N. Exposure and dose modelling in occupational epidemiology. Occup Environ Med. (2007) 64:492–8. doi: 10.1136/oem.2006.030031
2. Smith TJ, Kriebel D. A Biologic Approach to Environmental Assessment and Epidemiology. New York, NY: Oxford University Press. (2010). doi: 10.1093/acprof:oso/9780195141566.001.0001
3. Smith TJ. Studying Peak Exposure: Toxicology and Exposure Statistics. X-Exposure Assessment in Epidemiology Practice. Stockholm: National Institute for Working Life. (2001). p. 207–9.
4. Wegman DH, Eisen EA, Hu X, Woskie SR, Smith RG, Garabrant DH. Acute and chronic respiratory effects of sodium borate particulate exposures. Environ Health Perspect. (1994) 102(Suppl. 7):119–28. doi: 10.1289/ehp.94102s7119
5. Busby CC. Very low dose fetal exposure to Chernobyl contamination resulted in increases in infant leukemia in Europe and raises questions about current radiation risk models. Int J Environ Res Public Health. (2009) 6:3105–14. doi: 10.3390/ijerph6123105
6. Rappaport SM. Assessment of long-term exposures to toxic substances in air. Ann Occup Hyg. (1991) 35:61–121
7. Rappaport SM, Selvin S, Spear RC, Keil C. Air sampling in the assessment of continuous exposures to acutely-toxic chemicals. Part I-strategy. Am Ind Hyg Assoc J. (1981) 42:831–8. doi: 10.1080/15298668191420765
8. Checkoway H, Rice CH. Time-weighted averages, peaks and other indexes of exposure in occupational epidemiology. Am J Ind Med. (1992) 21:25–33. doi: 10.1002/ajim.4700210106
9. Checkoway H, Lees PSJ, Dell LD, Gentry PR, Mundt KA. Peak exposures in epidemiologic studies and cancer risks: considerations for regulatory risk assessment. Risk Analysis. (2019) 39:1441–64. doi: 10.1111/risa.13294
10. Barnes H, Goh NS, Leong TL, Hoy R. Silica-associated lung disease: an old-world exposure in modern industries. Respirology. (2019) 24:1165–75. doi: 10.1111/resp.13695
11. Leso V, Fontana L, Romano R, Gervetti P, Iavicoli I. Artificial stone associated silicosis: a systematic review. Int J Environ Res Public Health. (2019) 16:568. doi: 10.3390/ijerph16040568
12. Rose C, Heinzerling A, Patel K, Sack C, Wolff J, Zell-Baran L, et al. Severe silicosis in engineered stone fabrication workers-California, Colorado, Texas, and Washington, 2017-2019. Morb Mortal Wkly Rep. (2019) 68:813. doi: 10.15585/mmwr.mm6838a1
13. Preller L, Burstyn I, De Pater N, Kromhout H. Characteristics of peaks of inhalation exposure to organic solvents. Ann Occup Hyg. (2004) 48:643–52. doi: 10.1093/annhyg/meh045
14. Meijster T, Tielemans E, Schinkel J, Heederik D. Evaluation of peak exposures in the dutch flour processing industry: implications for intervention strategies. Ann Occup Hyg. (2008) 52:587–96. doi: 10.1093/annhyg/men049
15. Armstrong B, Basagaña X. Exposure Measurement Error: Consequences and Design Issues. In: Exposure Assessment in Occupational and Environmental Epidemiology. New York, NY: Oxford University Press (2004). p. 181–200. doi: 10.1093/acprof:oso/9780198528616.003.0012
16. Dosemeci M, Wacholder S, Lubin JH. Does nondifferential misclassification of exposure always bias a true effect toward the null value? Am J Epidemiol. (1990) 132:746–8. doi: 10.1093/oxfordjournals.aje.a115716
17. Plehiers PM, Chappelle AH, Spence MW. Practical learnings from an epidemiology study on TDI-related occupational asthma: Part II-Exposure without respiratory protection to TWA-8 values indicative of peak events is a good indicator of risk. Toxicol Ind Health. (2020) 2020:748233720947203. doi: 10.1177/0748233720947203
18. Schuler CR, Virji MA, Deubner DC, Stanton ML, Stefaniak AB, Day GA, et al. Sensitization and chronic beryllium disease at a primary manufacturing facility, part 3: exposure-response among short-term workers. Scand J Work Environ Health. (2012) 38:270–81. doi: 10.5271/sjweh.3192
19. Rappaport SM. Smoothing of exposure variability at the receptor: implications for health standards. Ann Occup Hyg. (1985) 29:201–14.
20. Smith TJ, Kriebel D. Biologically based exposure assessment for epidemiology. In: Venables K, editor. Current Topics in Occupational Epidemiology. New York, NY: Oxford University Press (2013) p. 199. doi: 10.1093/med/9780199683901.003.0016
21. Smith TJ. Issues in exposure and dose assessment for epidemiology and risk assessment. Hum Ecol Risk Assess. (2002) 8:1267–93. doi: 10.1080/20028091057358
22. Leidel NA, Busch KA, Lynch J. Occupational exposure sampling strategy manual. Cincinnati, OH: U.S. Dept. of Health, Education and Welfare. (1977)
23. Jahn SD, Bullock WH, Ignacio JS. A Strategy for Assessing and Managing Occupational Exposures. Fairfax, VA: AIHA (2015).
24. Deubner DC. Implications of common and special variation for occupational health: examples from beryllium manufacturing. J Occup Environ Med. (2013) 55:839–45. doi: 10.1097/JOM.0b013e31828dc94e
25. Bullock WH, Ignacio JS. A Strategy for Assessing and Managing Occupational Exposures. Fairfax, VA: AIHA (2006). doi: 10.3320/978-1-931504-69-0
26. Woskie SR, Shen P, Eisen EA, Finkel MH, Smith TJ, Smith R, et al. The real-time dust exposures of sodium borate workers: examination of exposure variability. Am Ind Hyg Assoc J. (1994) 55:207–17. doi: 10.1080/15428119491019041
27. NIOSH. Health Hazard Evaluations (HHEs) Available online at: https://www.cdc.gov/niosh/hhe/default.html (accessed December 12, 2020).
28. Ahman M, Alexandersson R, Ekholm U, Bergstrom B, Dahlqvist M, Ulfvarson U. Impeded lung function in moulders and coremakers handling furan resin sand. Int Arch Occup Environ Health. (1991) 63:175–80. doi: 10.1007/BF00381565
29. Eisen EA, Wegman DH, Kriebel D, Woskie SR, Hu X. An epidemiologic approach to the study of acute reversible health effects in the workplace. Epidemiology. (1991) 2:263–70. doi: 10.1097/00001648-199107000-00005
30. Holcroft CA, Wegman DH, Woskie S, Song MY, Naparstek P. Initial respiratory responses in welding apprentices. Atlanta, GA: NIOSH (2004).
31. Hu X, Wegman DH, Eisen EA, Woskie SR, Smith RG. Dose related acute irritant symptom responses to occupational exposure to sodium borate dusts. Br J Ind Med. (1992) 49:706–13. doi: 10.1136/oem.49.10.706
32. Khatri M, Bello D, Gaines P, Martin J, Pal AK, Gore R, et al. Nanoparticles from photocopiers induce oxidative stress and upper respiratory tract inflammation in healthy volunteers. Nanotoxicology. (2013) 7:1014–27. doi: 10.3109/17435390.2012.691998
33. Lofstedt H, Hagstrom K, Bryngelsson IL, Holmstrom M, Rask-Andersen A. Respiratory symptoms and lung function in relation to wood dust and monoterpene exposure in the wood pellet industry. Upsala J Med Sci. (2017) 122:78–84. doi: 10.1080/03009734.2017.1285836
34. Redlich CA, Stowe MH, Wisnewski AV, Eisen EA, Karol MH, Lemus R, et al. Subclinical immunologic and physiologic responses in hexamethylene diisocyanate-exposed auto body shop workers. Am J Ind Med. (2001) 39:587–97. doi: 10.1002/ajim.1058
35. Ryan TJ, Burroughs GE, Taylor K, Kovein RJ. Video exposure assessments demonstrate excessive laboratory formaldehyde exposures. Appl Occup Environ Hyg. (2003) 18:450–7. doi: 10.1080/10473220301424
36. Uba G, Pachorek D, Bernstein J, Garabrant DH, Balmes JR, Wright WE, et al. Prospective study of respiratory effects of formaldehyde among healthy and asthmatic medical students. Am J Ind Med. (1989) 15:91–101
37. Wegman DH, Eisen EA, Woskie SR, Hu XH. Measuring exposure for the epidemiologic study of acute effects. Am J Ind Med. (1992) 21:77–89. doi: 10.1002/ajim.4700210110
38. Woskie SR, Eisen EE, Wegman DH, Hu X, Kriebel D. Worker sensitivity and reactivity: indicators of worker susceptibility to nasal irritation. Am J Ind Med. (1998) 34:614–22. doi: 10.1002/(SICI)1097-0274(199812)34:6<614::AID-AJIM10>3.0.CO;2-S
39. Abrahamsen R, Fell AKM, Svendsen MV, Anderson E, Toren K, Henneberger P, et al. Association of respiratory symptoms and asthma with occupational exposures: findings from a population-based cross-sectional survey in Telemark, Norway. BMJ Open. (2017) 7:e014018. doi: 10.1136/bmjopen-2016-014018
40. Andersson E, Knutsson A, Hagberg S, Nilsson T, Karlsson B, Alfredsson L, et al. Incidence of asthma among workers exposed to sulphur dioxide and other irritant gases. Eur Respir J. (2006) 27:720–5. doi: 10.1183/09031936.06.00034305
41. Andersson E, Olin AC, Hagberg S, Nilsson R, Nilsson T, Toren K. Adult-onset asthma and wheeze among irritant-exposed bleachery workers. Am J Ind Med. (2003) 43:532–8. doi: 10.1002/ajim.10203
42. Antao VC, Piacitelli CA, Miller WE, Pinheiro GA, Kreiss K. Rayon flock: a new cause of respiratory morbidity in a card processing plant. Am J Ind Med. (2007) 50:274–84. doi: 10.1002/ajim.20440
43. Collins JJ, Anteau S, Conner PR, Cassidy LD, Doney B, Wang ML, et al. Incidence of occupational asthma and exposure to toluene diisocyanate in the united states toluene diisocyanate production industry. J Occup Environ Med. (2017) 59(Suppl. 12):S22–S7. doi: 10.1097/JOM.0000000000000890
44. Cummings KJ, Gaughan DM, Kullman GJ, Beezhold DH, Green BJ, Blachere FM, et al. Adverse respiratory outcomes associated with occupational exposures at a soy processing plant. Eur Respir J. (2010) 36:1007–15. doi: 10.1183/09031936.00151109
45. Daroowalla F, Wang ML, Piacitelli C, Attfield MD, Kreiss K. Flock workers' exposures and respiratory symptoms in five plants. Am J Ind Med. (2005) 47:144–52. doi: 10.1002/ajim.20120
46. Gadon ME, Melius JM, McDonald GJ, Orgel D. New-onset asthma after exposure to the steam system additive 2-diethylaminoethanol. A descriptive study. J Occup Med. (1994) 36:623–6.
47. Goodman M, Paustenbach D, Sipe K, Malloy CD, Chapman P, Burke ML, et al. Epidemiologic study of pulmonary obstruction in workers occupationally exposed to ethyl and methyl cyanoacrylate. J Toxicol Environ Health A. (2000) 59:135–63. doi: 10.1080/009841000156943
48. Hauser R, Elreedy S, Hoppin JA, Christiani DC. Airway obstruction in boilermakers exposed to fuel oil ash. A prospective investigation. Am J Respir Crit Care Med. (1995) 152:1478–84
49. Henneberger PK, Olin AC, Andersson E, Hagberg S, Toren K. The incidence of respiratory symptoms and diseases among pulp mill workers with peak exposures to ozone and other irritant gases. Chest. (2005) 128:3028–37. doi: 10.1378/chest.128.4.3028
50. Hoffman CD, Henneberger PK, Olin AC, Mehta A, Toren K. Exposure to ozone gases in pulp mills and the onset of rhinitis. Scand J Work Environ Health. (2004) 30:445–9. doi: 10.5271/sjweh.833
51. Kanwal R, Kullman G, Fedan KB, Kreiss K. Occupational lung disease risk and exposure to butter-flavoring chemicals after implementation of controls at a microwave popcorn plant. Public Health Rep. (2011) 126:480–94. doi: 10.1177/003335491112600405
52. Kanwal R, Kullman G, Piacitelli C, Boylstein R, Sahakian N, Martin S, et al. Evaluation of flavorings-related lung disease risk at six microwave popcorn plants. J Occup Environ Med. (2006) 48:149–57. doi: 10.1097/01.jom.0000194152.48728.fb
53. Lillienberg L, Dahlman-Hoglund A, Schioler L, Toren K, Andersson E. Exposures and asthma outcomes using two different job exposure matrices in a general population study in Northern Europe. Ann Occup Hyg. (2014) 58:469–81. doi: 10.1093/annhyg/meu002
54. Lindberg E, Hedenstierna G. Chrome plating: symptoms, findings in the upper airways, and effects on lung function. Arch Environ Health. (1983) 38:367–74. doi: 10.1080/00039896.1983.10545822
55. Mehta AJ, Henneberger PK, Toren K, Olin AC. Airflow limitation and changes in pulmonary function among bleachery workers. Eur Respir J. (2005) 26:133–9. doi: 10.1183/09031936.05.00083604
56. Meredith SK, Bugler J, Clark RL. Isocyanate exposure and occupational asthma: a case-referent study. Occup Environ Med. (2000) 57:830–6. doi: 10.1136/oem.57.12.830
57. Murgia N, Toren K, Kim JL, Andersson E. Risk factors for respiratory work disability in a cohort of pulp mill workers exposed to irritant gases. BMC Public Health. (2011) 11:689. doi: 10.1186/1471-2458-11-689
58. Ott MG, Klees JE, Poche SL. Respiratory health surveillance in a toluene di-isocyanate production unit, 1967-97: clinical observations and lung function analyses. Occup Environ Med. (2000) 57:43–52. doi: 10.1136/oem.57.1.43
59. Henneberger PK, Cumro D, Deubner DD, Kent MS, McCawley M, Kreiss K. Beryllium sensitization and disease among long-term and short-term workers in a beryllium ceramics plant. Int Arch Occup Environ Health. (2001) 74:167–76. doi: 10.1007/s004200100237
60. Rosenman K, Hertzberg V, Rice C, Reilly MJ, Aronchick J, Parker JE, et al. Chronic beryllium disease and sensitization at a beryllium processing facility. Environ Health Perspect. (2005) 113:1366–72. doi: 10.1289/ehp.7845
61. Virji MA, Schuler CR, Cox-Ganser J, Stanton ML, Kent MS, Kreiss K, et al. Associations of metrics of peak inhalation exposure and skin exposure indices with beryllium sensitization at a beryllium manufacturing facility. Ann Work Exposures Health. (2019) 63:856–69. doi: 10.1093/annweh/wxz064
62. Welinder HE, Jonsson BA, Nielsen JE, Ottosson HE, Gustavsson CA. Exposure-response relationships in the formation of specific antibodies to hexahydrophthalic anhydride in exposed workers. Scand J Work Environ Health. (1994) 20:459–65. doi: 10.5271/sjweh.1374
63. Yokota K, Johyama Y, Yamaguchi K. A cross-sectional survey of 32 workers exposed to hexahydrophthalic and methylhexahydrophthalic anhydrides. Ind Health. (2002) 40:36–41. doi: 10.2486/indhealth.40.36
64. Buchanan D, Miller BG, Soutar CA. Quantitative relations between exposure to respirable quartz and risk of silicosis. Occup Environ Med. (2003) 60:159–64. doi: 10.1136/oem.60.3.159
65. Mastrangelo G, Ballarin MN, Bellini E, Bicciato F, Zannol F, Gioffre F, et al. Asbestos exposure and benign asbestos diseases in 772 formerly exposed workers: dose-response relationships. Am J Ind Med. (2009) 52:596–602. doi: 10.1002/ajim.20713
66. Moore E, Martin JR, Edwards AC, Anderson HA, MacLaughlin EA, editors. Dust Exposure Indices at the Earliest Appearance of Pneumoconiosis. Atlanta, GA: NIOSH (1990).
67. Beane Freeman L, A B, JH L, Stewart PA, Hayes RB, Hoover RN, et al. Mortality from lymphohematopoietic malignancies among workers in formaldehyde industries: the national cancer institute cohort. J Natl Cancer Inst. (2009) 101:751–61. doi: 10.1093/jnci/djp096
68. Blair A, Stewart PA, Zaebst DD, Pottern L, Zey JN, Bloom TF, et al. Mortality of industrial workers exposed to acrylonitrile. Scand J Work Environ Health. (1998) 24(Suppl. 2):25–41.
69. Checkoway H, Dell LD, Boffetta P, Gallagher AE, Crawford L, Lees PS, et al. Formaldehyde exposure and mortality risks from acute myeloid leukemia and other lymphohematopoietic malignancies in the US national cancer institute cohort study of workers in formaldehyde industries. J Occup Environ Med. (2015) 57:785–94. doi: 10.1097/JOM.0000000000000466
70. Collins JJ, Bodner KM, Bus JS. Cancer mortality of workers exposed to styrene in the U.S. Reinforced plastics and composite industry. Epidemiology. (2013) 24:195–203. doi: 10.1097/EDE.0b013e318281a30f
71. Collins JJ, Ireland B, Buckley CF, Shepperly D. Lymphohaematopoeitic cancer mortality among workers with benzene exposure. Occup Environ Med. (2003) 60:676–9. doi: 10.1136/oem.60.9.676
72. Glass DC, Schnatter AR, Tang G, Armstrong TW, Rushton L. Exposure to benzene in a pooled analysis of petroleum industry case-control studies. J Occup Environ Hyg. (2017) 14:863–72. doi: 10.1080/15459624.2017.1339162
73. Glass DC, Schnatter AR, Tang G, Irons RD, Rushton L. Risk of myeloproliferative disease and chronic myeloid leukaemia following exposure to low-level benzene in a nested case-control study of petroleum workers. Occup Environ Med. (2014) 71:266–74. doi: 10.1136/oemed-2013-101664
74. Hauptmann M, Stewart PA, Lubin JH, Beane Freeman LE, Hornung RW, Herrick RF, et al. Mortality from lymphohematopoietic malignancies and brain cancer among embalmers exposed to formaldehyde. J Natl Cancer Inst. (2009) 101:1696–708. doi: 10.1093/jnci/djp416
75. Kamiya H, Peters S, Sodhi-Berry N, Reid A, Gordon L, de Klerk N, et al. Validation of an asbestos job-exposure matrix (AsbJEM) in Australia: exposure-response relationships for malignant mesothelioma. Ann Work Exposures Health. (2019) 63:719–28. doi: 10.1093/annweh/wxz038
76. Lewis SJ, Bell GM, Cordingley N, Pearlman ED, Rushton L. Retrospective estimation of exposure to benzene in a leukaemia case-control study of petroleum marketing and distribution workers in the United Kingdom. Occup Environ Med. (1997) 54:167–75. doi: 10.1136/oem.54.3.167
77. Mahboubi A, Koushik A, Siemiatycki J, Lavoue J, Rousseau MC. Assessment of the effect of occupational exposure to formaldehyde on the risk of lung cancer in two Canadian population-based case-control studies. Scand J Work Environ Health. (2013) 39:401–10. doi: 10.5271/sjweh.3344
78. Partanen T, Kauppinen T, Nurminen M, Nickels J, Hernberg S, Hakulinen T, et al. Formaldehyde exposure and respiratory and related cancers. A case-referent study among Finnish woodworkers. Scand J Work Environ Health. (1985) 11:409–15. doi: 10.5271/sjweh.2206
79. Rinsky RA, Hornung RW, Silver SR, Tseng CY. Benzene exposure and hematopoietic mortality: a long-term epidemiologic risk assessment. Am J Ind Med. (2002) 42:474–80. doi: 10.1002/ajim.10138
80. Ulm K, Gerein P, Eigenthaler J, Schmidt S, Ehnes H. Silica, silicosis and lung-cancer: results from a cohort study in the stone and quarry industry. Int Arch Occup Environ Health. (2004) 77:313–8. doi: 10.1007/s00420-004-0513-6
81. Wong O, Trent L, Harris F. Nested case-control study of leukaemia, multiple myeloma, and kidney cancer in a cohort of petroleum workers exposed to gasoline. Occup Environ Med. (1999) 56:217–21. doi: 10.1136/oem.56.4.217
82. Aaserud O, Hommeren OJ, Tvedt B, Nakstad P, Mowe G, Efskind J, et al. Carbon disulfide exposure and neurotoxic sequelae among viscose rayon workers. Am J Ind Med. (1990) 18:25–37. doi: 10.1002/ajim.4700180104
83. Albers JW, Kallenbach LR, Fine LJ, Langolf GD, Wolfe RA, Donofrio PD, et al. Neurological abnormalities associated with remote occupational elemental mercury exposure. Ann Neurol. (1988) 24:651–9.
84. Horstman SW, Browning SR, Szeluga R, Burzycki J, Stebbins A. Solvent exposures in screen printing shops. J Environ Sci Health Part A Tox Hazard Subst Environ Eng. (2001) 36:1957–73. doi: 10.1081/ESE-100107440
85. Landrigan PJ, Kominsky JR, Stein GF, Ruhe RL, Watanabe AS. Common-source community and industrial exposure to trichloroethylene. Arch Environ Health. (1987) 42:327–32. doi: 10.1080/00039896.1987.9934354
86. Langauer-Lewowicka H, Kurzbauer H, Byczkowska Z, Wocka-Marek T. Vinyl chloride disease-neurological disturbances. Int Arch Occup Environ Health. (1983) 52:151–7. doi: 10.1007/BF00405418
87. Langworth S, Almkvist O, Soderman E, Wikstrom BO. Effects of occupational exposure to mercury vapour on the central nervous system. Br J Ind Med. (1992) 49:545–55. doi: 10.1136/oem.49.8.545
88. Maizlish NA, Parra G, Feo O. Neurobehavioural evaluation of Venezuelan workers exposed to inorganic lead. Occup Environ Med. (1995) 52:408–14. doi: 10.1136/oem.52.6.408
89. Morrow LA, Ryan CM, Hodgson MJ, Robin N. Risk factors associated with persistence of neuropsychological deficits in persons with organic solvent exposure. J Nerv Mental Dis. (1991) 179:540–5.
90. Vyskocil A, El Majidi N, Thuot R, Beaudy C, charest-Tardif G, Tardif R, et al. Effects of Concentration Peaks on Styrene Neurotoxicity in the Fibreglass Reinforced Plastics Industry-Phase II. Montreal, QC: IRSST (2012).
91. Fan ZH, Meng QY, Weisel C, Laumbach R, Ohman-Strickland P, Shalat S, et al. Acute exposure to elevated PM2.5 generated by traffic and cardiopulmonary health effects in healthy older adults. J Exposure Sci Environ Epidemiol. (2009) 19:525–33. doi: 10.1038/jes.2008.46
92. Guidotti TL, Hoffman H. Indicators of cardiovascular risk among workers exposed to high intermittent levels of carbon disulphide. Occup Med. (1999) 49:507–15. doi: 10.1093/occmed/49.8.507
93. Zack JA, Suskind RR. The mortality experience of workers exposed to tetrachlorodibenzodioxin in a trichlorophenol process accident. J Occup Med. (1980) 22:11–4.
94. Hernandez AF, Amparo Gomez M, Perez V, Garcia-Lario JV, Pena G, Gil F, et al. Influence of exposure to pesticides on serum components and enzyme activities of cytotoxicity among intensive agriculture farmers. Environ Res. (2006) 102:70–6. doi: 10.1016/j.envres.2006.03.002
95. Niza S, Jamal HH. Carbon monoxide exposure assessment among toll operators in Klang Valley, Kuala Lumpur, Malaysia. Int J Environ Health Res. (2007) 17:95–103. doi: 10.1080/09603120701219303
96. Suruda AJ, Steenland-K; S-PB-MH-RL-G, Fingerhut-MA S-PH-RD-D. Cytogenetic effects of formaldehyde exposure in students of mortuary science. In: Proceedings of the 9th International Symposium on Epidemiology in Occupational Health. Cincinnati, OH: NIOSH (1994).
97. Asmi E, Antola M, Yli-Tuomi T, Jantunen M, Aarnio P, Makela T, et al. Driver and passenger exposure to aerosol particles in buses and trams in Helsinki, Finland. Sci Total Environ. (2009) 407:2860–7. doi: 10.1016/j.scitotenv.2009.01.004
98. Bauer K, Bosker T, Dirks KN, Behrens P. The impact of seating location on black carbon exposure in public transit buses: implications for vulnerable groups. Transport Res Part D Trans Environ. (2018) 62:577–83. doi: 10.1016/j.trd.2018.04.009
99. Bello A, Mugford C, Murray A, Shepherd S, Woskie SR. Characterization of occupational exposures to respirable silica and dust in demolition, crushing, and chipping activities. Ann Work Exposures Health. (2019) 63:34–44. doi: 10.1093/annweh/wxy089
100. Burkhart J, Piacitelli C, Schwegler-Berry D, Jones W. Environmental study of nylon flocking process. J Toxicol Environ Health A. (1999) 57:1–23. doi: 10.1080/009841099157836
101. Couch JR, Petersen M, Rice C, Schubauer-Berigan MK. Development of retrospective quantitative and qualitative job-exposure matrices for exposures at a beryllium processing facility. Occup Environ Med. (2011) 68:361–5. doi: 10.1136/oem.2010.056630
102. Demou E, Stark WJ, Hellweg S. Particle emission and exposure during nanoparticle synthesis in research laboratories. Ann Occup Hyg. (2009) 53:829–38. doi: 10.1093/annhyg/mep061
103. Edman K, Lofstedt H, Berg P, Eriksson K, Axelsson S, Bryngelsson I, et al. Exposure assessment to alpha- and beta-pinene, delta(3)-carene and wood dust in industrial production of wood pellets. Ann Occup Hyg. (2003) 47:219–26. doi: 10.1093/annhyg/meg024
104. Foreland S, Bye E, Bakke B, Eduard W. Exposure to fibres, crystalline silica, silicon carbide and sulphur dioxide in the norwegian silicon carbide industry. Ann Occup Hyg. (2008) 52:317–36. doi: 10.1093/annhyg/men029
105. Freund A, Zuckerman N, Baum L, Milek D. Submicron particle monitoring of paving and related road construction operations. J Occup Environ Hyg. (2012). 9:298–307. doi: 10.1080/15459624.2012.672924
106. Jorgensen RB, Buhagen M, Foreland S. Personal exposure to ultrafine particles from PVC welding and concrete work during tunnel rehabilitation. Occup Environ Med. (2016) 73:467–73. doi: 10.1136/oemed-2015-103411
107. Kim B, Kim H, Yu IJ. Assessment of nanoparticle exposure in nanosilica handling process: including characteristics of nanoparticles leaking from a vacuum cleaner. Ind Health. (2014) 52:152–62. doi: 10.2486/indhealth.2013-0087
108. Laitinen J, Koponen H, Sippula O, Korpijarvi K, Jumpponen M, Laitinen S, et al. Peak exposures to main components of ash and gaseous diesel exhausts in closed and open ash loading stations at biomass-fuelled power plants. Chemosphere. (2017) 185:183–91. doi: 10.1016/j.chemosphere.2017.07.012
109. Lillienberg L, Burdorf A, Mathiasson L, Thorneby L. Exposure to metalworking fluid aerosols and determinants of exposure. Ann Occup Hyg. (2008) 52:597–605. doi: 10.1093/annhyg/men043
110. Marcias G, Casula MF, Uras M, Falqui A, Miozzi E, Sogne E, et al. Occupational fine/ultrafine particles and noise exposure in aircraft personnel operating in airport taxiway. Environments. (2019) 6:35. doi: 10.3390/environments6030035
111. McGarry P, Morawska L, He C, Jayaratne R, Falk M, Tran Q, et al. Exposure to particles from laser printers operating within office workplaces. Environ Sci Technol. (2011) 45:6444–52. doi: 10.1021/es200249n
112. McGarry P, Morawska L, Knibbs LD, Morris H. Excursion guidance criteria to guide control of peak emission and exposure to airborne engineered particles. J Occup Environ Hyg. (2013) 10:640–51. doi: 10.1080/15459624.2013.831987
113. Nieuwenhuijsen MJ, Sandiford CP, Lowson D, Tee RD, Venables KM, Newman Taylor AJ. Peak exposure concentrations of dust and flour aeroallergen in flour mills and bakeries. Ann Occup Hyg. (1995) 39:193–201. doi: 10.1016/0003-4878(94)00107-C
114. Ragde SF, Jorgensen RB, Foreland S. Characterisation of exposure to ultrafine particles from surgical smoke by use of a fast mobility particle sizer. Ann Occup Hyg. (2016) 60:860–74. doi: 10.1093/annhyg/mew033
115. Shepard MN, Brenner S. An occupational exposure assessment for engineered nanoparticles used in semiconductor fabrication. Ann Occup Hyg. (2014) 58:251–65. doi: 10.1093/annhyg/met064
116. Smith TJ, Davis ME, Hart JE, Blicharz A, Laden F, Garshick E, et al. Potential air toxics hot spots in truck terminals and cabs. Res Rep Health Eff Inst. (2012):5–82.
117. Virji MA, Stefaniak AB, Park JH, Day GA, Stanton ML, Kent MS, editors et al. Considerations of peak exposure indices for epidemiology of beryllium sensitization. ISEE 22nd Annual Conference. Seoul (2010). doi: 10.1097/01.ede.0000391743.00807.68
118. Zhang M, Jian L, Bin P, Xing M, Lou J, Cong L, et al. Workplace exposure to nanoparticles from gas metal arc welding process. J Nanoparticle Res. (2013) 15:2016. doi: 10.1007/s11051-013-2016-4
119. Bello A, Quinn MM, Perry MJ, Milton DK. Quantitative assessment of airborne exposures generated during common cleaning tasks: a pilot study. Environ Health. (2010) 9:76. doi: 10.1186/1476-069X-9-76
120. Bessonneau V, Thomas O. Assessment of exposure to alcohol vapor from alcohol-based hand rubs. Int J Environ Res Public Health. (2012) 9:868–79. doi: 10.3390/ijerph9030868
121. Bloom TF, Egeland GM. Evaluation of exposures to fluorocarbon 113 in a horizontal and a vertical laminar airflow clean room. Am Ind Hyg Assoc J. (1999) 60:486–94. doi: 10.1080/00028899908984469
122. Cummings BJ, Booth KS. Industrial hygiene sampling for airborne TDI in six flexible slabstock foam manufacturing facilities in the United States: a comparison of the short-term and long-term sampling data. Appl Occup Environ Hyg. (2002) 17:863–71. doi: 10.1080/10473220290107066
123. De Vos AJ, Reisen F, Cook A, Devine B, Weinstein P. Respiratory irritants in Australian bushfire smoke: air toxics sampling in a smoke chamber and during prescribed burns. Arch Environ Contam Toxicol. (2009) 56:380–8. doi: 10.1007/s00244-008-9209-3
124. Deer HM, McJilton CE, Harein PK. Respiratory exposure of grain inspection workers to carbon tetrachloride fumigant. Am Ind Hyg Assoc J. (1987) 48:586–93. doi: 10.1080/15298668791385255
125. Fedoruk MJ, Bronstein R, Kerger BD. Ammonia exposure and hazard assessment for selected household cleaning product uses. J Expo Anal Environ Epidemiol. (2005) 15:534–44. doi: 10.1038/sj.jea.7500431
126. Fevotte J, Charbotel B, Muller-Beaute P, Martin JL, Hours M, Bergeret A. Case-control study on renal cell cancer and occupational exposure to trichloroethylene. Part I: Exposure assessment. Ann Occup Hyg. (2006) 50:765–75. doi: 10.1093/annhyg/mel039
127. Hallock MF, Hammond SK, Kenyon E, Smith TJ, Smith ER. Assessment of task and peak exposures to solvents in the microelectronics fabrication industry. Appl Occup Environ Hyg. (1993) 8:945–54. doi: 10.1080/1047322X.1993.10388229
128. Hansen AM, Olsen IL, Poulsen OM. Polycyclic aromatic hydrocarbons in air samples of meat smokehouses. Sci Total Environ. (1992) 126:17–26. doi: 10.1016/0048-9697(92)90480-G
129. Huizer D, Van Rooij JGM, Urbanus J, Pizzella G, Banton M, Dudzina T, et al. Regular short-term peak exposure to benzene in the supply chain of petroleum products. Concawe Rep. (2018) 1–52. Available online at: https://www.concawe.eu/wp-content/uploads/2018/05/Rpt-18-9.pdf
130. Kauppinen TP, Niemela RI. Occupational exposure to chemical agents in the particleboard industry. Scand J Work Environ Health. (1985) 11:357–63. doi: 10.5271/sjweh.2212
131. Keer S, Taptiklis P, Glass B, McLean D, McGlothlin JD, Douwes J. Determinants of airborne solvent exposure in the collision repair industry. Ann Work Exposures Health. (2018) 62:871–83. doi: 10.1093/annweh/wxy047
132. Ludwig HR, Meister MV, Roberts DR, Cox C. Worker exposure to perchloroethylene in the commercial dry cleaning industry. Am Ind Hyg Assoc J. (1983) 44:600–5. doi: 10.1080/15298668391405391
133. Macaluso M, Larson R, Lynch J, Lipton S, Delzell E. Historical estimation of exposure to 1,3-butadiene, styrene, and dimethyldithiocarbamate among synthetic rubber workers. J Occup Environ Hyg. (2004) 1:371–90. doi: 10.1080/15459620490452004
134. Morshed MM, Omar D, Mohamad R, Wahed S, Rahman MA. Airborne paraquat measurement and its exposure to spray operators in treated field environment. Int J Agricult Biol. (2010) 12:679–84. Available online at: https://www.cabdirect.org/cabdirect/FullTextPDF/2010/20103309325.pdf
135. Paustenbach D, Burke ML, Shum M, Kalmes R. Airborne concentrations of ethyl and methyl cyanoacrylate in the workplace. Aihaj. (2001) 62:70–9. doi: 10.1080/15298660108984612
136. Persoons R, Maitre A, Bicout DJ. Modelling occupational inhalation exposure to concentration peaks of chemicals and associated health risk assessment. Ann Occup Hyg. (2012) 56:934–47. doi: 10.1093/annhyg/mes021
137. Persoons R, Parat S, Stoklov M, Perdrix A, Maitre A. Critical working tasks and determinants of exposure to bioaerosols and MVOC at composting facilities. Int J Hyg Environ Health. (2010) 213:338–47. doi: 10.1016/j.ijheh.2010.06.001
139. Raisanen J, Niemela R, Rosenberg C. Tetrachloroethylene emissions and exposure in dry cleaning. J Air Waste Manage Assoc. (2001) 51:1671–5. doi: 10.1080/10473289.2001.10464396
140. Rushton L. Benzene exposure in the petroleum distribution industry associated with leukemia in the United Kingdom: overview of the methodology of a case-control study. Environ Health Perspect. (1996) 104(Suppl. 6):1371–4. doi: 10.2307/3433192
141. Scheepers PTJ, Graumans MHF, Beckmann G, van Dael M, Anzion RBM, Melissen M, et al. Changes in work practices for safe use of formaldehyde in a university-based anatomy teaching and research facility. Int J Environ Res Public Health. (2018) 15:19. doi: 10.3390/ijerph15092049
142. Svedberg U, Galle B. Assessment of terpene levels and workers' exposure in sawmills with long path FTIR. Appl Occup Environ Hyg. (2000) 15:686–94. doi: 10.1080/10473220050110103
143. Svedberg U, Johanson G. Work inside ocean freight containers–personal exposure to off-gassing chemicals. Ann Occup Hyg. (2013) 57:1128–37. doi: 10.1093/annhyg/met033
144. Vayghani SA, Weisel C. The MTBE air concentrations in the cabin of automobiles while fueling. J Expo Anal Environ Epidemiol. (1999) 9:261–7. doi: 10.1038/sj.jea.7500037
145. Vetter R, Stewart PA, Dosemeci M, Blair A. Validity of exposure in one job as a surrogate for exposure in a cohort study. Am J Ind Med. (1993) 23:641–51. doi: 10.1002/ajim.4700230411
146. Viegas S, Prista J, Gomes M. Exposure assessment: the influence of environmental monitoring methodology. In: Brebbia CA, editor. Environmental Health Risk V. WIT Transactions on Biomedicine and Health. 14. Southampton: Wit Press/Computational Mechanics Publications (2009). p. 353–9. doi: 10.2495/EHR090341
147. Virji MA, Liang X, Su FC, LeBouf RF, Stefaniak AB, Stanton ML, et al. Peaks, means, and determinants of real-time TVOC exposures associated with cleaning and disinfecting tasks in healthcare settings. Ann Work Exposures Health. (2019) 63:759–72. doi: 10.1093/annweh/wxz043
148. Gwin KK, Wallingford KM, Morata TC, Van Campen LE, Dallaire J, Alvarez FJ. Ototoxic occupational exposures for a stock car racing team: II. chemical surveys. J Occup Environ Hyg. (2005) 2:406–13. doi: 10.1080/15459620500203798
149. Hovland KH, Thomassen Y, Skaugset NP, Skyberg K, Skogstad M, Bakke B. Characterisation of occupational exposure to air contaminants in a nitrate fertiliser production plant. J Environ Monit. (2012) 14:2092–9. doi: 10.1039/c2em30370a
150. Mc Donnell PE, Coggins MA, Hogan VJ, Fleming GT. Exposure assessment of airborne contaminants in the indoor environment of Irish swine farms. Ann Agric Environ Med. (2008) 15:323–6. doi: 10.1038/jes.2013.83
151. Mokogwu N, Semple S. Investigating the use of a portable carbon monoxide exposure monitor among commercial food vendors in Benin City, Nigeria: A pilot survey. Am J Respir Crit Care Med. (2017) 195:A5991.
152. Monse C, Broding HC, Sucker K, Berresheim H, Jettkant B, Hoffmeyer F, et al. Exposure assessment of potash miners at elevated CO2 levels. Int Arch Occup Environ Health. (2014) 87:413–21. doi: 10.1007/s00420-013-0880-y
153. Tang UW, Wang Z. Determining gaseous emission factors and driver's particle exposures during traffic congestion by vehicle-following measurement techniques. J Air Waste Manag Assoc. (2006) 56:1532–9. doi: 10.1080/10473289.2006.10464567
154. Velusami B, Curran TP, Grogan HM. Hydrogen sulfide gas emissions during disturbance and removal of stored spent mushroom compost. J Agric Saf Health. (2013) 19:261–75. doi: 10.13031/jash.19.10351
155. Westberg H, Egelrud L, Ohlson CG, Hygerth M, Lundholm C. Exposure to nitrous oxide in delivery suites at six Swedish hospitals. Int Arch Occup Environ Health. (2008) 81:829–36. doi: 10.1007/s00420-007-0271-3
156. Bracken TD, Rankin RF, Senior RS, Kavet R, Geissinger LG. Magnetic-field exposures of cable splicers in electrical network distribution vaults. Appl Occup Environ Hyg. (2001) 16:369–79. doi: 10.1080/10473220118938
157. Breysse PN, Matanoski GM, Elliott EA, Francis M, Kaune W, Thomas K. 60 Hertz magnetic-field exposure assessment for an investigation of leukemia in telephone line workers. Am J Ind Med. (1994). 26:681–91. doi: 10.1002/ajim.4700260510
158. de Vocht F, Muller F, Engels H, Kromhout H. Personal exposure to static and time-varying magnetic fields during MRI system test procedures. J Magn Reson Imaging. (2009) 30:1223–8. doi: 10.1002/jmri.21952
159. Fitzgerald G, O'Donnell B. In somno securitas" anaesthetists' noise exposure in Orthopaedic operating theatres. Ir Med J. (2012). 105:239–41.
160. Forssen UM, Mezei G, Nise G, Feychting M. Occupational magnetic field exposure among women in Stockholm County, Sweden. Occup Environ Med. (2004) 61:594–602. doi: 10.1136/oem.2003.009654
161. Fuentes MA, Trakic A, Wilson SJ, Crozier S. Analysis and measurements of magnetic field exposures for healthcare workers in selected MR environments. IEEE Trans Biomed Eng. (2008) 55:1355–64. doi: 10.1109/TBME.2007.913410
162. Landon P, Breysse P, Chen Y. Noise exposures of rail workers at a North American chemical facility. Am J Ind Med. (2005) 47:364–9. doi: 10.1002/ajim.20152
163. Park D, Cha W, Choi S, Kim W, Yoon C, Ha K, et al. O47-2Evaluation of peak exposure to extremely low-frequency magnetic fields during the semiconductor manufacturing process. Occup Environ Med. (2016) 73(Suppl. 1):A89. doi: 10.1136/oemed-2016-103951.239
164. Schaap K, Portengen L, Kromhout H. Exposure to MRI-related magnetic fields and vertigo in MRI workers. Occup Environ Med. (2016) 73:161–6. doi: 10.1136/oemed-2015-103019
165. Schmidt JH, Pedersen ER, Juhl PM, Christensen-Dalsgaard J, Andersen TD, Poulsen T, et al. Sound exposure of symphony orchestra musicians. Ann Occup Hyg. (2011) 55:893–905. doi: 10.1093/annhyg/mer05
166. Seixas N, Neitzel R, Sheppard L, Goldman B. Alternative metrics for noise exposure among construction workers. Ann Occup Hyg. (2005) 49:493–502. doi: 10.1093/annhyg/mei009
167. Voitl P, Sebelefsky C, Mayrhofer C, Woditschka A, Schneeberger V. Noise levels in general pediatric facilities: a health risk for the staff? PLoS ONE. (2019) 14:e0213722. doi: 10.1371/journal.pone.0213722
168. Henneberger PK, Kurth LM, Doney B, Liang X, Andersson E. Development of an asthma-specific job exposure matrix for use in the United States. Ann Work Exposures Health. (2019) 20:20. doi: 10.1093/annweh/wxz089
169. Bartonova A, Clench-Aas J, Gram F, Gronskei KE, Guerreiro C, Larssen S, et al. Air pollution exposure monitoring and estimation. Part V. Traffic exposure in adults. J Environ Monit. (1999) 1:337–40. doi: 10.1039/a902780g
170. Luengo-Oroz J, Reis S. Assessment of cyclists' exposure to ultrafine particles along alternative commuting routes in Edinburgh. Atmospheric Pollut Res. (2019) 10:1148–58. doi: 10.1016/j.apr.2019.01.020
171. Li HC, Chiueh PT, Liu SP, Huang YY. Assessment of different route choice on commuters' exposure to air pollution in Taipei, Taiwan. Environ Sci Pollut Res. (2017) 24:3163–71. doi: 10.1007/s11356-016-8000-7
172. Brauer M, Hirtle R, Lang B, Ott W. Assessment of indoor fine aerosol contributions from environmental tobacco smoke and cooking with a portable nephelometer. J Expo Anal Environ Epidemiol. (2000) 10:136–44. doi: 10.1038/sj.jea.7500076
173. Franklin P, Runnion T, Farrar D, Dingle P. Comparison of peak and average nitrogen dioxide concentrations inside homes. Atmospheric Environ. (2006) 40:7449–54. doi: 10.1016/j.atmosenv.2006.06.042
174. Boogaard H, Montagne DR, Brandenburg AP, Meliefste K, Hoek G. Comparison of short-term exposure to particle number, PM10 and soot concentrations on three (sub) urban locations. Sci Total Environ. (2010) 408:4403–11. doi: 10.1016/j.scitotenv.2010.06.022
175. Lefebvre MA, Meuling WJA, Engel R, Coroama MC, Renner G, Pape W, et al. Consumer inhalation exposure to formaldehyde from the use of personal care products/cosmetics. Regul Toxicol Pharmacol. (2012) 63:171–6. doi: 10.1016/j.yrtph.2012.02.011
176. Wallace L, Williams R, Rea A, Croghan C. Continuous weeklong measurements of personal exposures and indoor concentrations of fine particles for 37 health-impaired North Carolina residents for up to four seasons. Atmospheric Environ. (2006) 40:399–414. doi: 10.1016/j.atmosenv.2005.08.042
177. Su FC, Jia C, Batterman S. Extreme value analyses of VOC exposures and risks: A comparison of RIOPA and NHANES datasets. Atmospheric Environ. (2012) 62:97–106. doi: 10.1016/j.atmosenv.2012.06.038
178. Adams HS, Nieuwenhuijsen MJ, Colvile RN, McMullen MA, Khandelwal P. Fine particle (PM2.5) personal exposure levels in transport microenvironments, London, UK. Sci Total Environ. (2001) 279:29–44. doi: 10.1016/S0048-9697(01)00723-9
179. Schlink U, Röder S, Kohajda T, Wissenbach DK, Franck U, Lehmann I. A framework to interpret passively sampled indoor-air VOC concentrations in health studies. Build Environ. (2016) 105:198–209. doi: 10.1016/j.buildenv.2016.05.033
180. Gibicar D, Horvat M, Logar M, Fajon V, Falnoga I, Ferrara R, et al. Human exposure to mercury in the vicinity of chlor-alkali plant. Environ Res. (2009) 109:355–67. doi: 10.1016/j.envres.2009.01.008
181. Saksena S, Subida R, Buttner L, Ahmed L. Indoor air pollution in coastal houses of southern Philippines. Indoor Built Environ. (2007) 16:159–68. doi: 10.1177/1420326X07076783
182. Reisen F, Powell JC, Dennekamp M, Johnston FH, Wheeler AJ. Is remaining indoors an effective way of reducing exposure to fine particulate matter during biomass burning events? J Air Waste Manag Assoc. (2019) 69:611–22. doi: 10.1080/10962247.2019.1567623
183. Brauer M, Hirtle RD, Hall AC, Yip TR. Monitoring personal fine particle exposure with a particle counter. J Expo Anal Environ Epidemiol. (1999) 9:228–36. doi: 10.1038/sj.jea.7500040
184. Yao C, Ma AK, Cushing SL, Lin VYW. Noise exposure while commuting in Toronto - a study of personal and public transportation in Toronto. J Otolaryngol. (2017) 46:62. doi: 10.1186/s40463-017-0239-6
185. Hu S, Paulson SE, Fruin S, Kozawa K, Mara S, Winer AM. Observation of elevated air pollutant concentrations in a residential neighborhood of Los Angeles California using a mobile platform. Atmospheric Environ. (2012) 51:311–9. doi: 10.1016/j.atmosenv.2011.12.055
186. Kurmi OP, Semple S, Steiner M, Henderson GD, Ayres JG. Particulate matter exposure during domestic work in Nepal. Ann Occup Hyg. (2008) 52:509–17. doi: 10.1093/annhyg/men026
187. Di Marco GS, Kephalopoulos S, Ruuskanen J, Jantunen M. Personal carbon monoxide exposure in Helsinki, Finland. Atmospheric Environ. (2005) 39:2697–707. doi: 10.1016/j.atmosenv.2004.07.039
188. de Kluizenaar Y, Kuijpers E, Eekhout I, Voogt M, Vermeulen RCH, Hoek G, et al. Personal exposure to UFP in different micro-environments and time of day. Build Environ. (2017) 122:237–46. doi: 10.1016/j.buildenv.2017.06.022
189. Wallace L, Ott W. Personal exposure to ultrafine particles. J Expo Sci Environ Epidemiol. (2011) 21:20–30. doi: 10.1038/jes.2009.59
190. Edwards RD, Schweizer C, Jantunen M, Lai HK, Bayer-Oglesby L, Katsouyanni K, et al. Personal exposures to VOC in the upper end of the distribution - relationships to indoor, outdoor and workplace concentrations. Atmospheric Environ. (2005) 39:2299–307. doi: 10.1016/j.atmosenv.2004.12.026
191. Ng SP, Dimitroulopoulou C, Grossinho A, Chen LC, Kendall M. PM2.5 exposure assessment of the population in lower Manhattan area of New York city after the world trade center disaster. Atmospheric Environ. (2005) 39:1979–92. doi: 10.1016/j.atmosenv.2004.11.043
192. Curto A, Donaire-Gonzalez D, Manaca MN, Gonzalez R, Sacoor C, Rivas I, et al. Predictors of personal exposure to black carbon among women in southern semi-rural Mozambique. Environ Int. (2019) 131:104962. doi: 10.1016/j.envint.2019.104962
193. Chan LY, Lau WL, Wang XM, Tang JH. Preliminary measurements of aromatic VOCs in public transportation modes in Guangzhou, China. Environ Int. (2003) 29:429–35. doi: 10.1016/S0160-4120(02)00189-7
194. Semple S, Apsley A, Galea KS, MacCalman L, Friel B, Snelgrove V. Secondhand smoke in cars: assessing children's potential exposure during typical journey conditions. Tob Control. (2012) 21:578–83. doi: 10.1136/tobaccocontrol-2011-050197
195. Brace S, Peterson DL. Spatial patterns of tropospheric ozone in the mount rainier region of the cascade mountains, U.S.A. Atmospheric Environ. (1998) 32:3629–37. doi: 10.1016/S1352-2310(98)00077-6
196. Cheng KC, Acevedo-Bolton V, Jiang RT, Klepeis NE, Ott WR, Kitanidis PK, et al. Stochastic modeling of short-term exposure close to an air pollution source in a naturally ventilated room: an autocorrelated random walk method. J Exposure Sci Environ Epidemiol. (2014) 24:311–8. doi: 10.1038/jes.2013.63
197. Dons E, Laeremans M, Orjuela JP, Avila-Palencia I, de Nazelle A, Nieuwenhuijsen M, et al. Transport most likely to cause air pollution peak exposures in everyday life: evidence from over 2000 days of personal monitoring. Atmospheric Environ. (2019) 213:424–32. doi: 10.1016/j.atmosenv.2019.06.035
198. Bhangar S, Mullen NA, Hering SV, Kreisberg NM, Nazaroff WW. Ultrafine particle concentrations and exposures in seven residences in northern California. Indoor Air. (2011) 21:132–44. doi: 10.1111/j.1600-0668.2010.00689.x
199. Mila C, Salmon M, Sanchez M, Ambros A, Bhogadi S, Sreekanth V, et al. When, where, and what? Characterizing personal PM2.5 exposure in Periurban India by integrating GPS. wearable camera, and ambient and personal monitoring data. Environ Sci Technol. (2018) 52:13481–90. doi: 10.1021/acs.est.8b03075
200. Dasgupta S, Huq M, Khaliquzzaman M, Pandey K, Wheeler D. Who suffers from indoor air pollution? Evidence from Bangladesh. Health Policy Plan. (2006) 21:444–58. doi: 10.1093/heapol/czl027
201. Hu S, Fruin S, Kozawa K, Mara S, Paulson SE, Winer AM. A wide area of air pollutant impact downwind of a freeway during pre-sunrise hours. Atmospheric Environ. (2009) 43:2541–9. doi: 10.1016/j.atmosenv.2009.02.033
202. Hu X, Wegman DH, Eisen EA, Woskie SR. Application of an event marker in the occupational epidemiologic study of acute irritant symptoms. Epidemiology. (1993) 4:266–70. doi: 10.1097/00001648-199305000-00011
203. Mihlan GJ, Todd LA, Truong KN. Assessment of occupational exposure patterns by frequency-domain analysis of time series data. Appl Occup Environ Hyg. (2000) 15:120–30. doi: 10.1080/104732200301944
204. Quinot C, Dumas O, Henneberger PK, Varraso R, Wiley AS, Speizer FE, et al. Development of a job-task-exposure matrix to assess occupational exposure to disinfectants among US nurses. Occup Environ Med. (2017) 74:130–7. doi: 10.1136/oemed-2016-103606
205. Benke G, Sim M, Fritschi L, Aldred G. Beyond the job exposure matrix (JEM): the task exposure matrix (TEM). Ann Occup Hyg. (2000) 44:475–82. doi: 10.1016/S0003-4878(00)00004-1
206. Sadik OA, Zhou AL, Kikandi S, Du N, Wang Q, Varner K. Sensors as tools for quantitation, nanotoxicity and nanomonitoring assessment of engineered nanomaterials. J Environ Monit. (2009) 11:1782–800. doi: 10.1039/b912860c
207. Kumagai S. Peaks of inhalation exposure. Ann Occup Hyg. (2004) 48:653–4. doi: 10.1093/annhyg/meh059
Keywords: peak metrics, epidemiologic studies, exposure assessment (EA), acute effects, chronic effects
Citation: Virji MA and Kurth L (2021) Peak Inhalation Exposure Metrics Used in Occupational Epidemiologic and Exposure Studies. Front. Public Health 8:611693. doi: 10.3389/fpubh.2020.611693
Received: 29 September 2020; Accepted: 07 December 2020;
Published: 08 January 2021.
Edited by:
Amy L. Hall, Veterans Affairs Canada, CanadaReviewed by:
David Kriebel, University of Massachusetts Lowell, United StatesCopyright © 2021 Virji and Kurth. This is an open-access article distributed under the terms of the Creative Commons Attribution License (CC BY). The use, distribution or reproduction in other forums is permitted, provided the original author(s) and the copyright owner(s) are credited and that the original publication in this journal is cited, in accordance with accepted academic practice. No use, distribution or reproduction is permitted which does not comply with these terms.
*Correspondence: M. Abbas Virji, bXZpcmppQGNkYy5nb3Y=
Disclaimer: All claims expressed in this article are solely those of the authors and do not necessarily represent those of their affiliated organizations, or those of the publisher, the editors and the reviewers. Any product that may be evaluated in this article or claim that may be made by its manufacturer is not guaranteed or endorsed by the publisher.
Research integrity at Frontiers
Learn more about the work of our research integrity team to safeguard the quality of each article we publish.