 Hongli Sun
 Wei He
 Jingyu Bu3
 Huifang Zhang
 Huimei Huang
 Kai Ma
95% of researchers rate our articles as excellent or good
Learn more about the work of our research integrity team to safeguard the quality of each article we publish.
Find out more
ORIGINAL RESEARCH article
Front. Psychiatry , 10 March 2025
Sec. Public Mental Health
Volume 16 - 2025 | https://doi.org/10.3389/fpsyt.2025.1533819
Background: The relationship between the triglyceride-glucose (TyG) index, its combination with obesity indicators, and depression remains understudied in the American population.
Methods: This cross-sectional study analyzed data from 10,423 adults in the National Health and Nutrition Examination Survey (NHANES) conducted between 2005 and 2020. We employed multivariable logistic regression analysis, smoothing techniques, generalized additive models, stratified analyses, and sensitivity analyses to examine the relationship between TyG, its combination (TyG-WC, TyG-WHtR, TyG-BMI) with obesity indicators, and depression.
Results: The results indicate that the TyG index, TyG-WC, TyG-WHtR, TyG-BMI, and depression exhibited a significant statistical association with depressive symptoms (all P for trend < 0.001). Specifically, a one-unit increase in the TyG index correlated with a 37% increase in the risk of depressive symptoms (95% CI: 1.21–1.55), a one-unit increase in TyG-WC correlated with a 3.26 times increase in the risk of depressive symptoms (95% CI: 2.22–4.80), a one-unit increase in TyG-WHtR correlated with a 27% increase in the risk of depressive symptoms (95% CI: 1.18–1.36), and a one-unit increase in TyG-BMI correlated with a 2.30 times increase in the risk of depressive symptoms (95% CI: 1.72–3.08). There was a significant nonlinear correlation between TyG-WC, TyG-WHtR, and TyG-BMI with depressive symptoms (all P for nonlinearity < 0.001), except for a linear correlation between the TyG index and depressive symptoms (P for linearity < 0.001).
Conclusion: Monitoring the TyG index, TyG-WC, TyG-WHtR, TyG-BMI may facilitate depression risk assessment and prevention.
Depression, affecting approximately 280 million people worldwide, represents a significant global health concern according to the World Health Organization (WHO) (1). This condition not only impairs daily functioning but also has profound consequences for individuals and society (2). Depression is closely associated with chronic health problems such as cardiovascular diseases (3), obesity (4), and diabetes (5), and is a leading risk factor for suicide (6). The economic burden of depression is substantial, contributing to lost productivity, increased absenteeism, and higher healthcare expenditures (7). Effective intervention and early detection are crucial for managing depression’s long-term consequences (8). Identifying predictive factors for depression risk can help target high-risk individuals, emphasizing the importance of early disease prevention through mental health screenings and proactive support.
Recent studies have demonstrated an association between the triglyceride glucose (TyG) index and depression (9–13). The TyG index, calculated as Ln (fasting triglycerides [TG, mg/dL] × fasting blood glucose [FBG, mg/dL]/2), is a measure of insulin resistance. Insulin resistance, characterized by reduced cellular sensitivity to insulin, can lead to type 2 diabetes (14), obesity (15) and depression (16). Some studies have confirmed a U-shaped relationship between TyG index and depression, suggesting that both low and high levels of TyG index may increase depressive symptoms risk (9, 17, 18). However, recent research indicates that TyG index combined with obesity indices may be more effective in assessing depression than the TyG index alone (10).
Obesity rates are rising globally, posing significant health risks including cardiovascular diseases (19), type 2 diabetes (20), and mental health disorders (21). TyG index combined with obesity indices is closely associated with depression (10, 22, 23). Previous reports have focused on body mass index (BMI), waist-to-height ratio (WHtR), and waist circumference. The calculation formulas for TyG index combined with obesity indices are as follows (1): TyG-BMI = TyG × body mass (kg)/height² (m²) (2); TyG-WHtR = TyG × waist circumference (cm)/height (cm) (3); TyG-WC = TyG × waist circumference (cm) (24).
Despite some studies reporting correlations between TyG index combined with obesity indices and depression, these studies have not adequately addressed population selection and the dose-dependent relationship between these indices and depression (10, 11, 17). Therefore, our study aims to expand the sample size to accurately investigate these relationships and explore their dose-dependent nature.
This study utilized data from the National Health and Nutrition Examination Survey (NHANES) conducted between 2005 and 2020. NHANES employs a complex, multistage, probabilistic sampling design to ensure national representativeness. The initial study population included participants with complete data on TyG index, obesity indicators, and depression measures. Exclusion criteria included missing data on TyG index, TyG-WC, TyG-WHtR, TyG-BMI, depression, and covariates. The final analytical cohort consisted of 10,423 individuals. Flowchart depicting the participants’ selection was shown in Figure 1. The Ethics Review Committee of the National Center for Health Statistics (NCHS) approved the NHANES research plan, and all participants provided written informed consent.
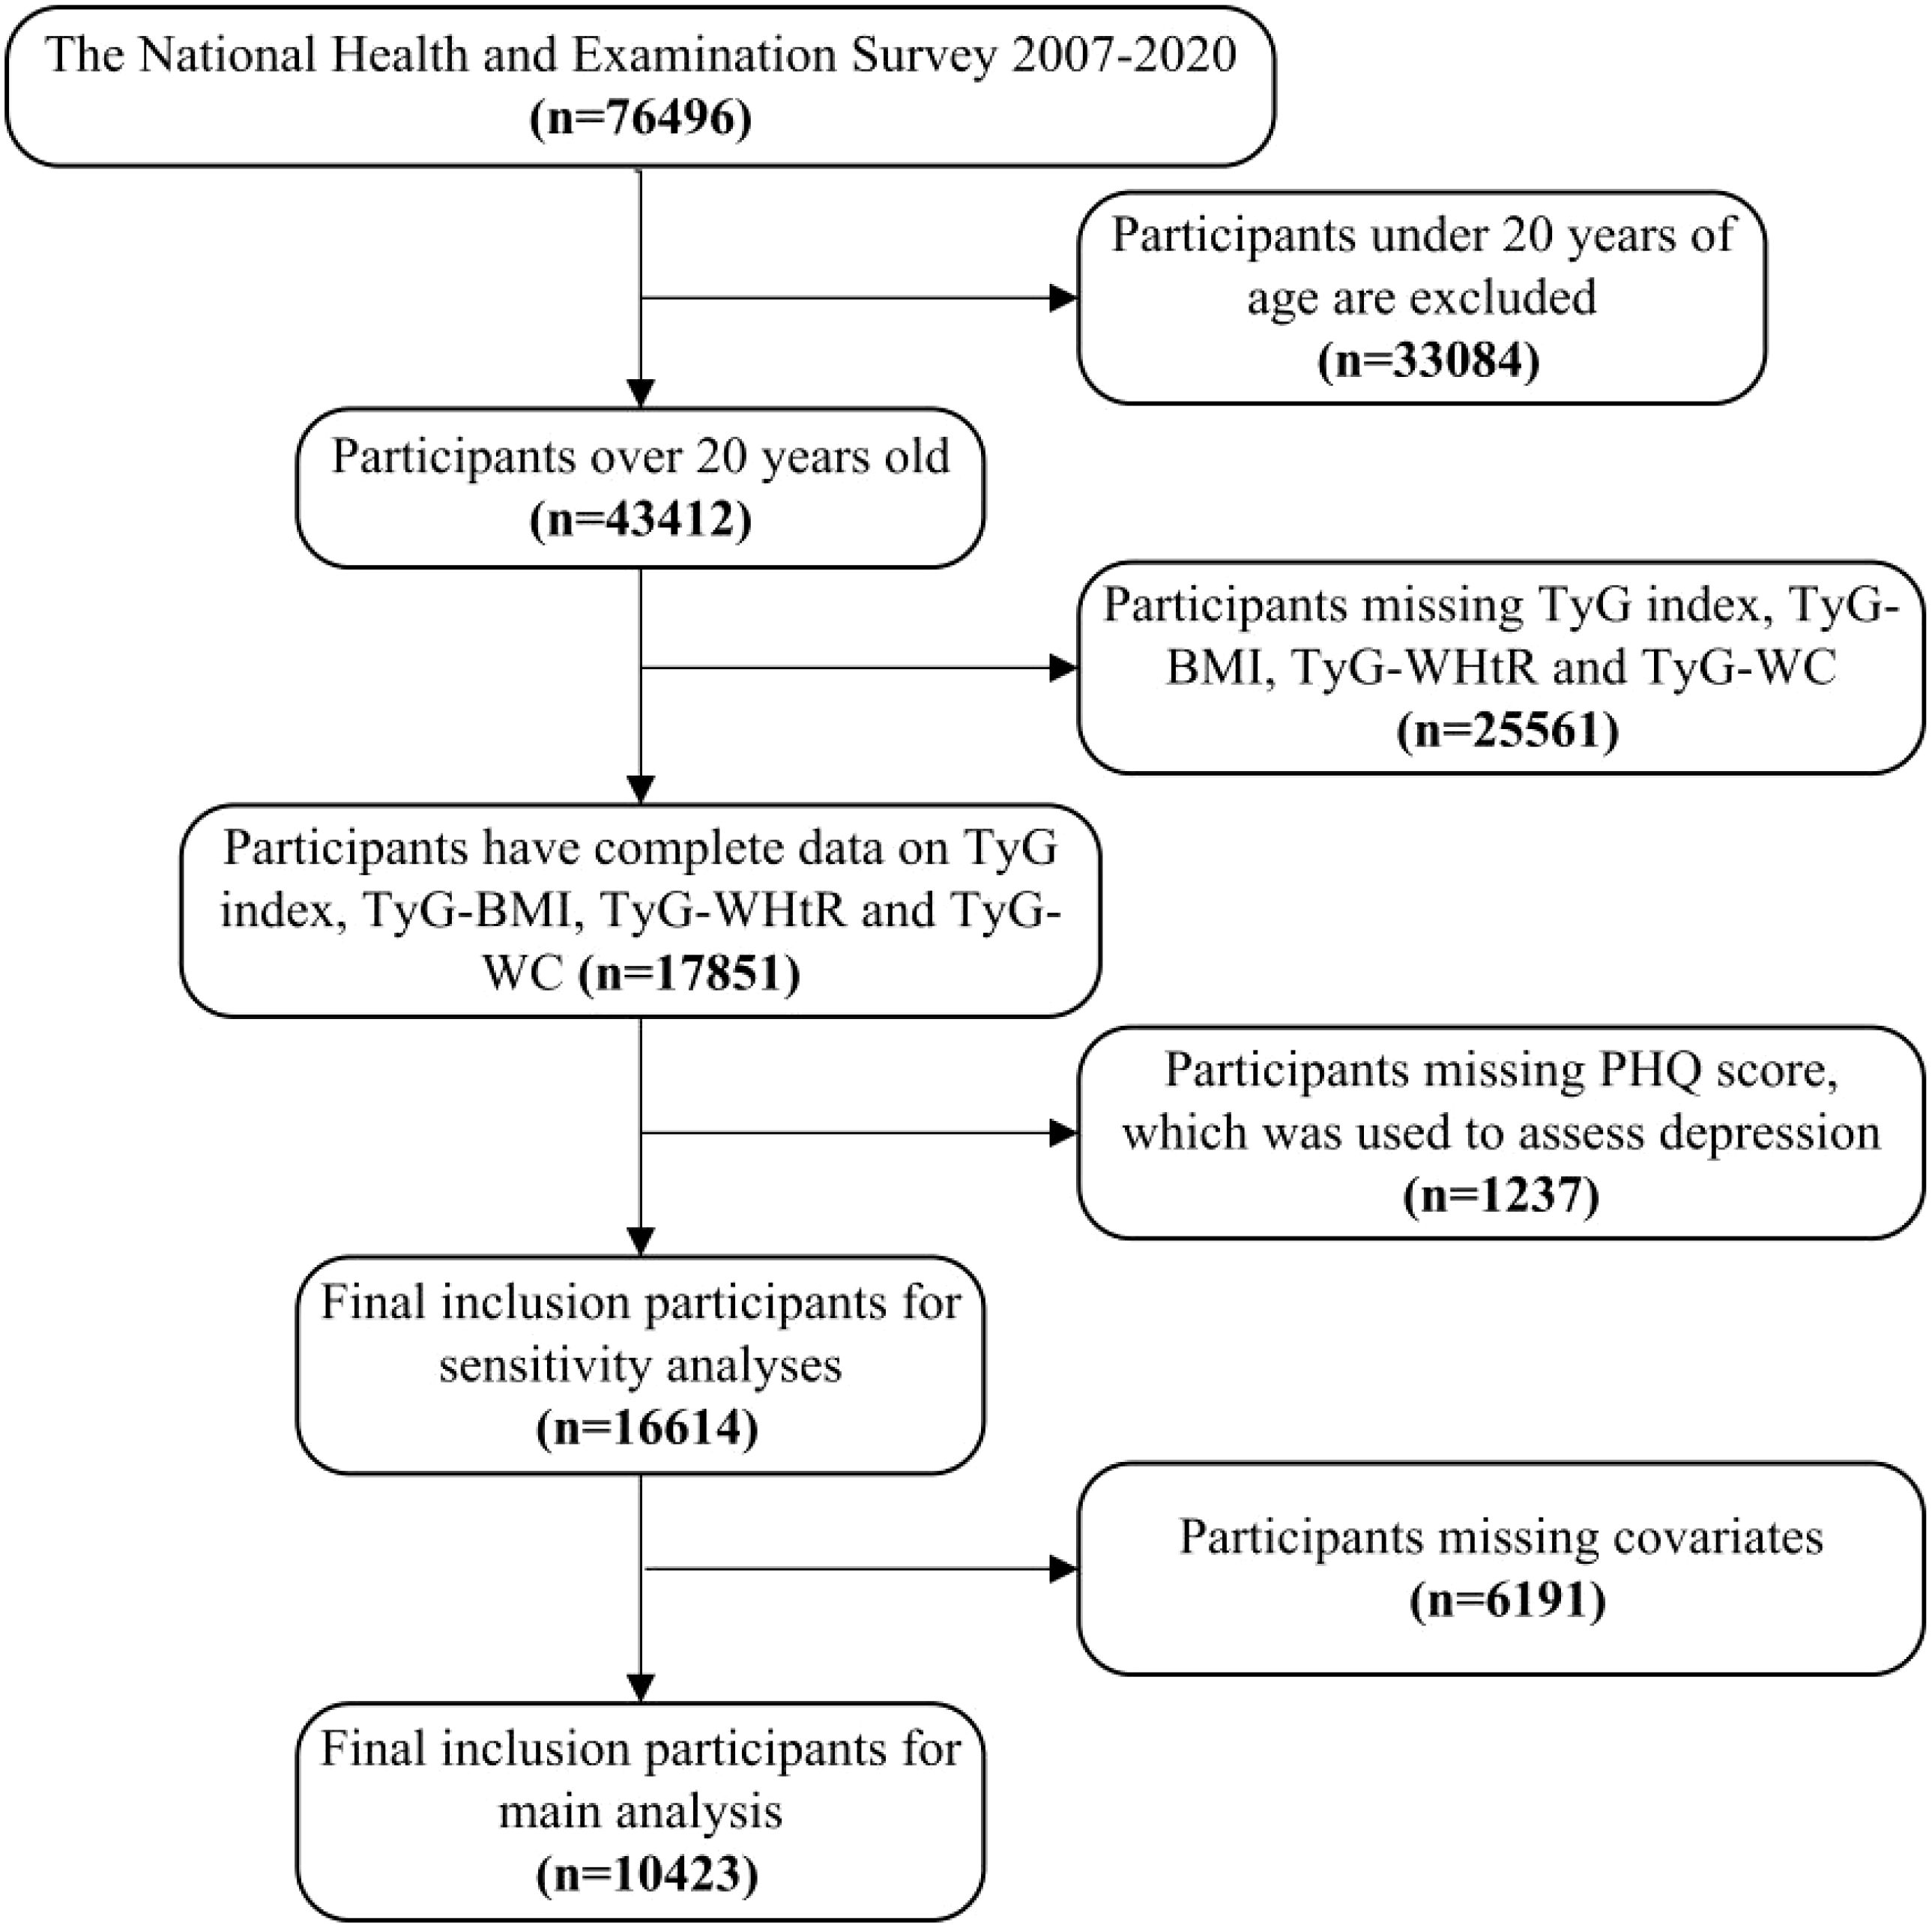
Figure 1. Flowchart depicting the participants’ selection. TyG, Triglyceride-glucose index; TyG-WC, Triglyceride-glucose-waist circumference; TyG-WHtR, Triglyceride-glucose-waist height ratio; TyG-BMI, Triglyceride-glucose-body mass index.
Fasting blood glucose (FBG) and triglyceride levels were assessed through blood samples. Body weight, height, and waist measurements were recorded during physical examinations. BMI and waist-to-height ratio were calculated from these measurements. The exposure variables were calculated as follows (1): TyG = ln[triglycerides (mg/dl) × glucose (mg/dl)/2] (25) (2); BMI = body mass (kg)/height² (m²) (3); WHtR = waist circumference/height (4); TyG-WC = TyG × waist circumference; TyG-WHtR = TyG × WHtR; TyG-BMI = TyG × BMI (24). Participants were divided into quartiles (Q1, Q2, Q3, Q4) based on these indices, with Q1 as the reference group.
Depressive symptoms were identified using the Patient Health Questionnaire-9 (PHQ-9), administered two weeks prior to examination. The PHQ-9 is a reliable self-report screening tool assessing depressive symptoms severity based on DSM criteria. It has been extensively validated, demonstrating a sensitivity and specificity of 88% (26).It consists of 9 items scored from 0 (not at all) to 3 (nearly every day), with a total score ranging from 0 to 27. Scores ≥ 10 indicate depressive symptoms (27).
The following covariates that may influence the association between TyG index, TyG-WC, TyG-WHtR, and TyG-BMI and depression were included. The characteristics included gender, age, race (including Mexican American, other Hispanic, non-Hispanic White, non-Hispanic Black, non-Hispanic Asian, and other races), education level (<9 years, 9–11 years, ≥12 years), marital status (married/cohabiting, widowed/divorced/separated, never married), and the ratio of family income to poverty (PIR), and waist circumference, BMI, smoking (yes/no), alcohol drinking (mild, moderate and heavy), and diabetes status (yes/no).
BMI was categorized on the basis of the WHO’s standard as < 25, 25-29.9, and ≥ 30 kg/m2, corresponding to a healthy weight, excess weight, and obesity, respectively (28). Smoking was defined as having smoked at least 100 cigarettes in a lifetime (29). Alcohol drinking was divided into three categories: For alcohol drinking group, current heavy alcohol use (≥3 drinks per day for females, ≥4 drinks per day for males, or binge drinking [≥4 drinks on same occasion for females, ≥5 drinks on same occasion for males] on 5 or more days per month); current moderate alcohol use (≥2 drinks per day for females, ≥3 drinks per day for males, or binge drinking ≥2 days per month); all other cases are mild (29). A fasting blood glucose (FBG) level of ≥ 125 mg/dL was considered indicators of diabetes (30).
Continuous variables conforming to a normal distribution were expressed as mean ± standard deviation (SD), or as median (range). Categorical variables were expressed as percentages. Baseline characteristics were described according to the quartiles of the TyG index, TyG-WC, TyG-WHtR, and TyG-BMI, respectively. Kruskal-Wallis H test were used to compare continuous variables and Fisher exact tests were used to compare categorical variables. Multivariable logistic regression analysis was performed to assess TyG index, TyG-WC, TyG-WHtR, TyG-BMI and depression. To standardize the odds ratios (OR) corresponding to the TyG-WC and TyG-BMI, we performed a Ln-transformation on the TyG-WC and TyG-BMI. Results presented as OR with 95% confidence intervals (95% CI). Initially, an unadjusted model 1 was analyzed, after which a crude adjusted model 2 was developed to account for variables including survey year, age, gender, race. Subsequently, a refined adjusted model 3 was created that incorporated additional factors, including education level, family PIR, marital status, diabetes, smoke, alcohol drinking. Smoothing techniques and generalized additive models were performed to account for any potential nonlinear relationship between TyG index, TyG-WC, TyG-WHtR, TyG-BMI and depression. In addition, stratified analyses were conducted to assess potential moderating effects of age (20-39/40-59/≥60), gender (male/female), education level (<9/9-11/≥12), family PIR (≤1.3/1.3), marital status (Married/Living with partner, Widowed/divorced/separated, Never married), smoke (yes/no), alcohol drinking (mild/moderate/heavy), and diabetes (yes/no). Interactions between the TyG index, TyG-WC, TyG-WHtR, TyG-BMI and each of the above variables were tested. After excluding missing values for independent variables and dependent variable, we used multiple imputation, based on 5 replications and a chained equation approach method in the R MI procedure, to account for missing data on education, marital status, family PIR, smoke and alcohol drinking.
All statistical analyses were performed using R (http://www.r-project.org, The R Foundation) and EmpowerStats (http://www.empowwerstats.com, X&Y Solutions, Inc., Boston, MA) software. A 2-tailed P < 0.05 was considered statistically significant.
Basic demographic characteristics are shown in Table 1. The analysis included 10,423 participants (53.45% male, 46.55% female), aged 20-85 years (mean 46.84 ± 16.95). Significant differences were observed between non-depressive symptoms and depressive symptoms groups for gender, race, education level, family PIR, marital status, BMI, WC, smoking, alcohol drinking, diabetes, PHQ score, TyG index, TyG-WC, TyG-WHtR, and TyG-BMI (all P < 0.05). Survey year showed no significant difference.
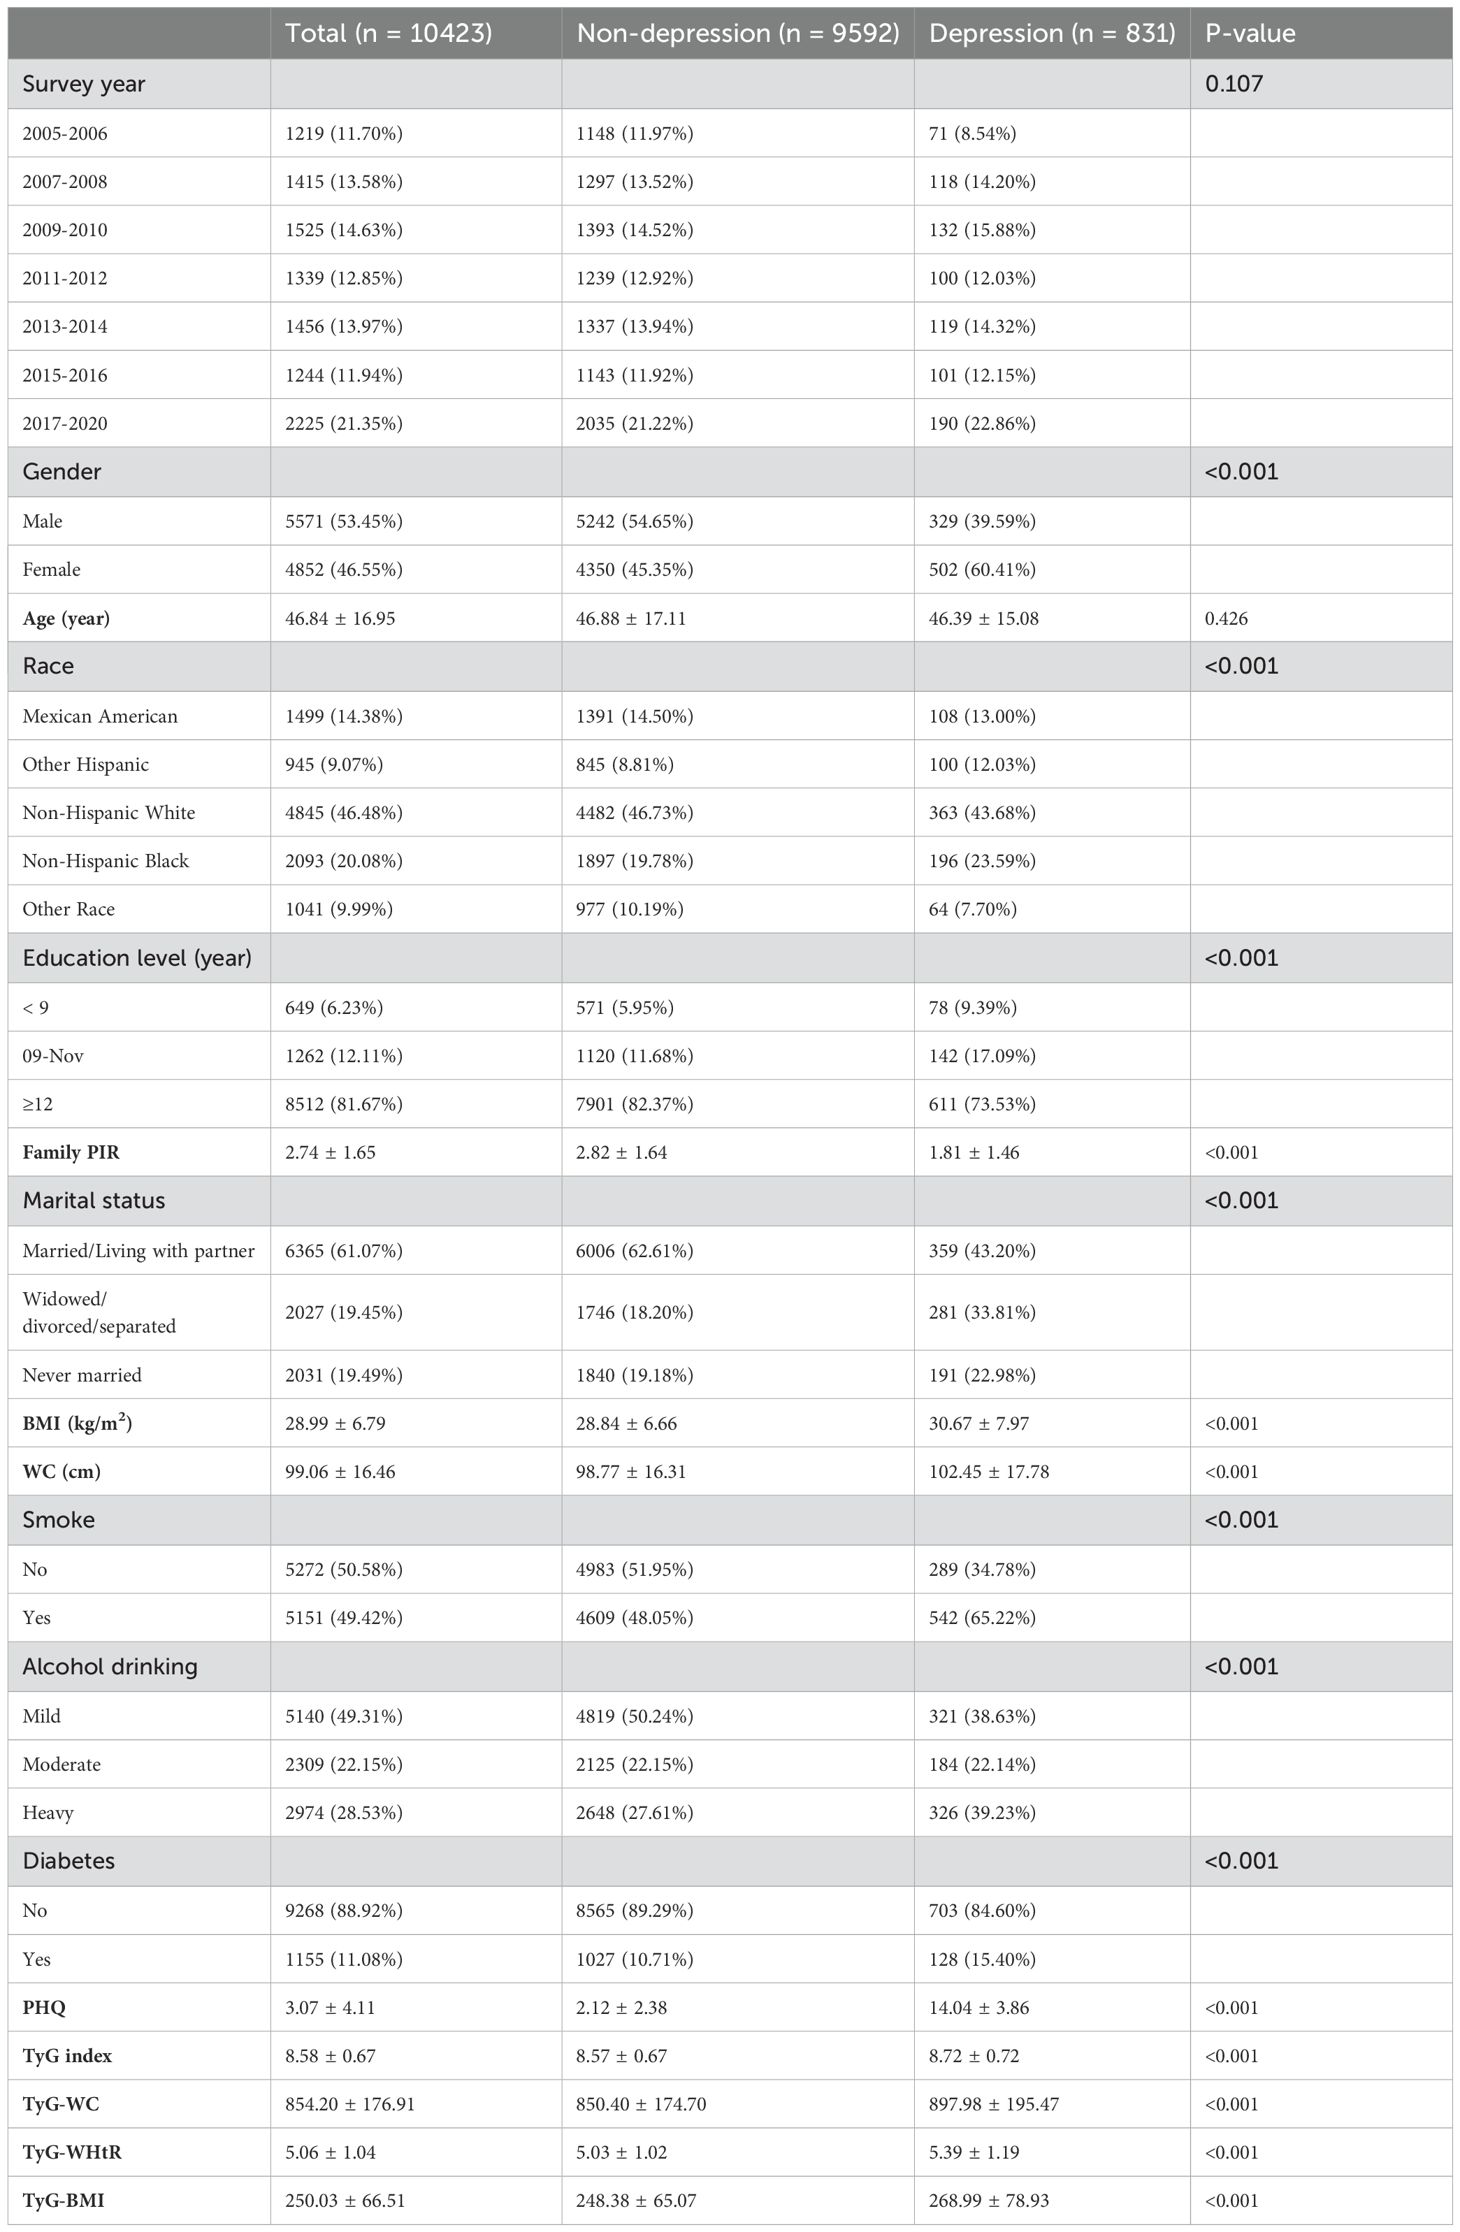
Table 1. Baseline characteristics of American adults aged 20–85 years stratified by depression and non-depression, NHANES 2005–2020.
The association of TyG index, TyG−WC, TyG−WHtR, TyG−BMI with depressive symptoms are shown in Table 2. The association between the TyG index, TyG−WC, TyG−WHtR, TyG−BMI and depressive symptoms was examined through multiple regression analyses, considering the TyG index TyG−WC, TyG−WHtR, TyG−BMI as both a continuous and categorical variable (divided into quartiles, with the first quartile as the reference). In the non-adjusted model, adjust I model and adjust II model, the TyG index, TyG−WC, TyG−WHtR, TyG−BMI and depressive symptoms exhibited a significant statistical association with depressive symptoms (all P for trend < 0.001). Specifically, a one-unit increase in the TyG index correlated with a 37% increase in the risk of depressive symptoms (95% CI: 1.21-1.55), a one-unit increase in the TyG-WC correlated with a 3.26 times increase in the risk of depressive symptoms (95% CI: 2.22-4.80), a one-unit increase in the TyG−WHtR correlated with a 27% increase in the risk of depressive symptoms (95% CI: 1.18-1.36), and a one-unit increase in the TyG−BMI correlated with a 2.30 times increase in the risk of depressive symptoms (95% CI: 1.72-3.08). Furthermore, when compared to participants in the lowest TyG index quartile, those in the highest quartile had a 72% increase in the risk of depressive symptoms (95% CI: 1.37-2.17). When compared to participants in the lowest TyG-WC quartile, those in the highest quartile had a 82% increase in the risk of depressive symptoms (95% CI: 1.46-2.27). When compared to participants in the lowest TyG-WHtR quartile, those in the highest quartile had a 72% increase in the risk of depressive symptoms (95% CI: 1.37-2.15). When compared to participants in the lowest TyG−BMI quartile, those in the highest quartile had a 60% increase in the risk of depressive symptoms (95% CI: 1.29-1.97).
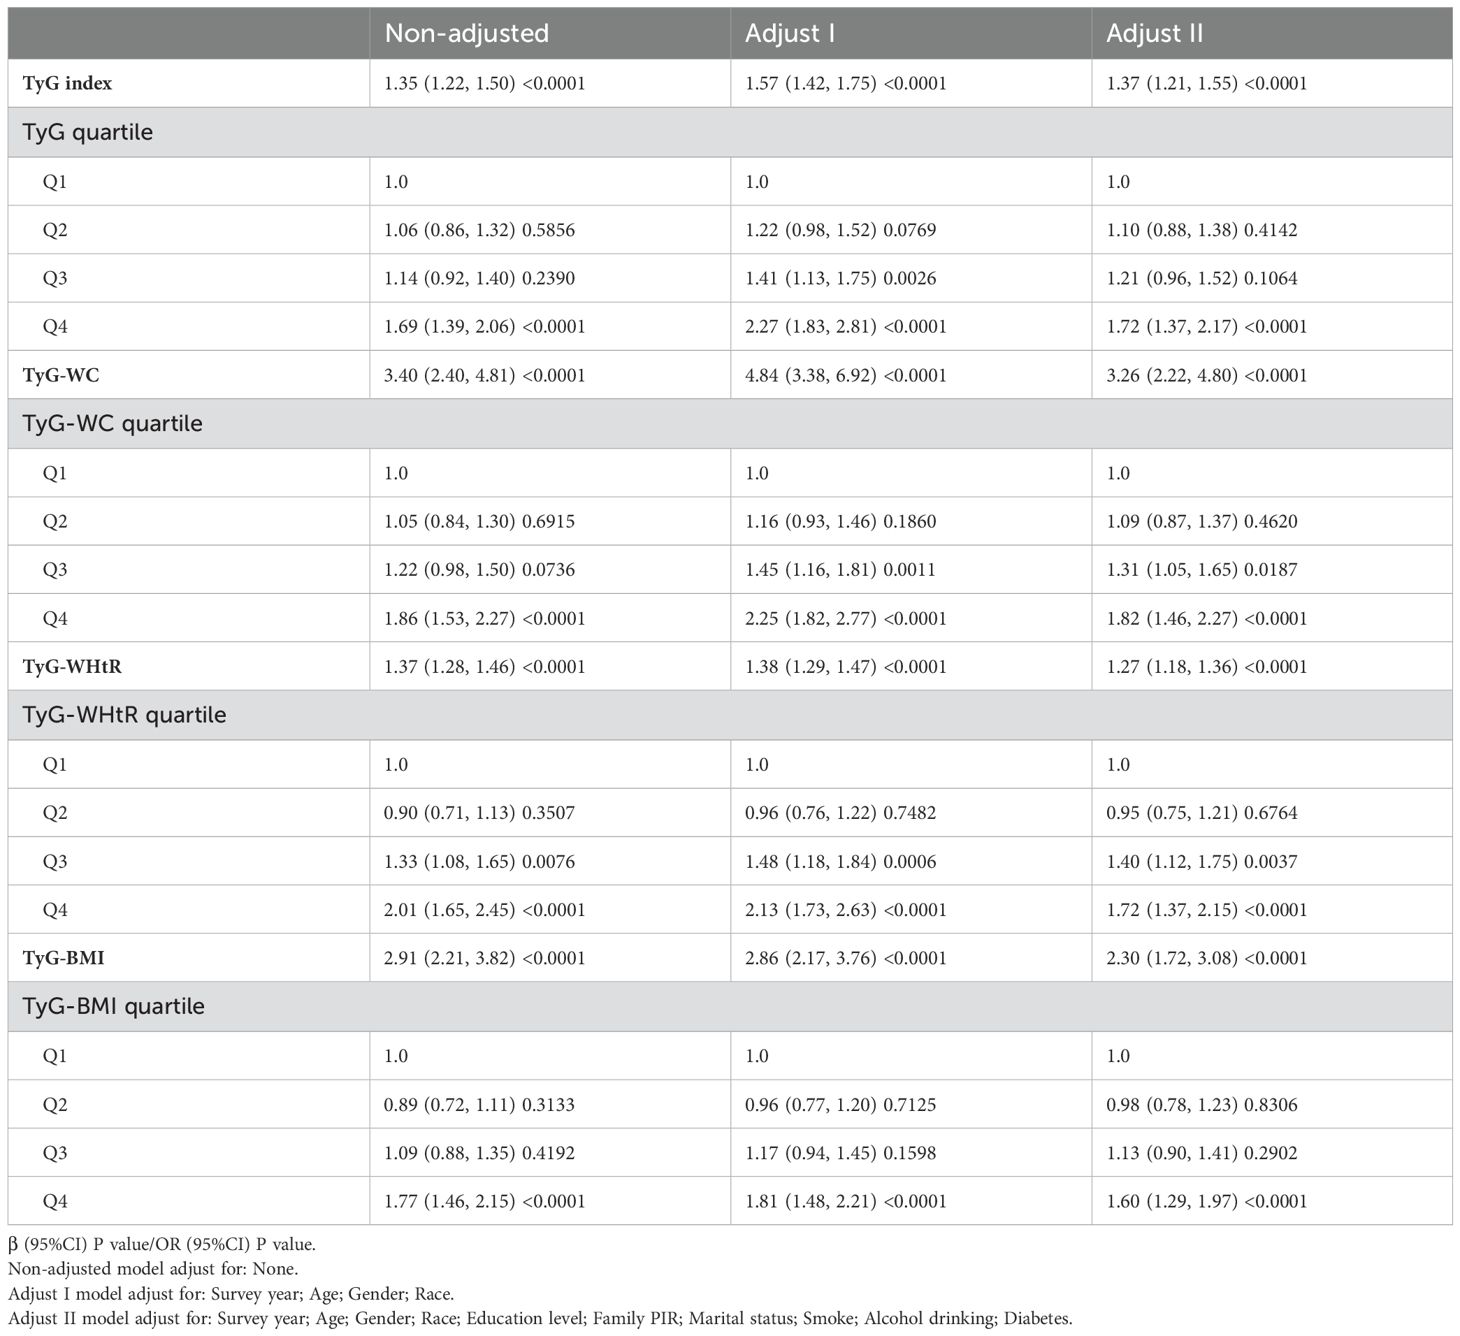
Table 2. Multivariate-adjusted association of TyG and its combination with obesity indicators and depression in US adults 18–85 years, NHANES 2005–2020.
A smooth curve fitting approach and threshold effect analysis were used to detect the potentially non-linear relationship between TyG index, TyG−WC, TyG−WHtR, TyG−BMI with depressive symptoms (Figure 2; Table 3). There was a significant nonlinear correlation between TyG-WC, TyG−WHtR, TyG−BMI with depressive symptoms (all P for nonlinearity < 0.001) except for a linear correlation between TyG and depressive symptoms (P for linearity < 0.001). The results of threshold effect analysis were shown in Table 3. The two-piecewise regression model showed the inflection point of TyG index, TyG-WC, TyG−WHtR, TyG−BMI was 8.51, 6.66, 4.14, and 5.47 respectively, after fully adjusted for covariates (survey year, age, gender, race, education level, family PIR, marital status, diabetes, smoke, alcohol drinking). On the left side of the inflection point, the effect size had no statistical significance on TyG index (OR, 1.25; 95% CI, 0.95–1.64; P = 0.1062), TyG-WC (OR, 1.02; 95% CI, 0.39-2.66; P = 0.9691), TyG−WHtR (OR, 0.79; 95% CI, 0.52-1.19; P = 0.2600), TyG−BMI (OR, 0.81; 95% CI, 0.43-1.54; P = 0.5227). On the right side of the inflection point, the risk of depressive symptoms increased 44% in one-unit of TyG index (OR, 1.44; 95% CI, 1.21-1.71; P < 0.0001), increased 5.73 times in one-unit of TyG-WC (OR, 5.37; 95% CI, 3.22-10.21; P < 0.0001), increased 33% in one-unit of TyG−WHtR (OR, 1.33; 95% CI, 1.22-1.45; P = 0.0233), increased 4.47 times in one-unit of TyG−BMI (OR, 4.47; 95% CI,2.80-7.15; P = 0.0005).
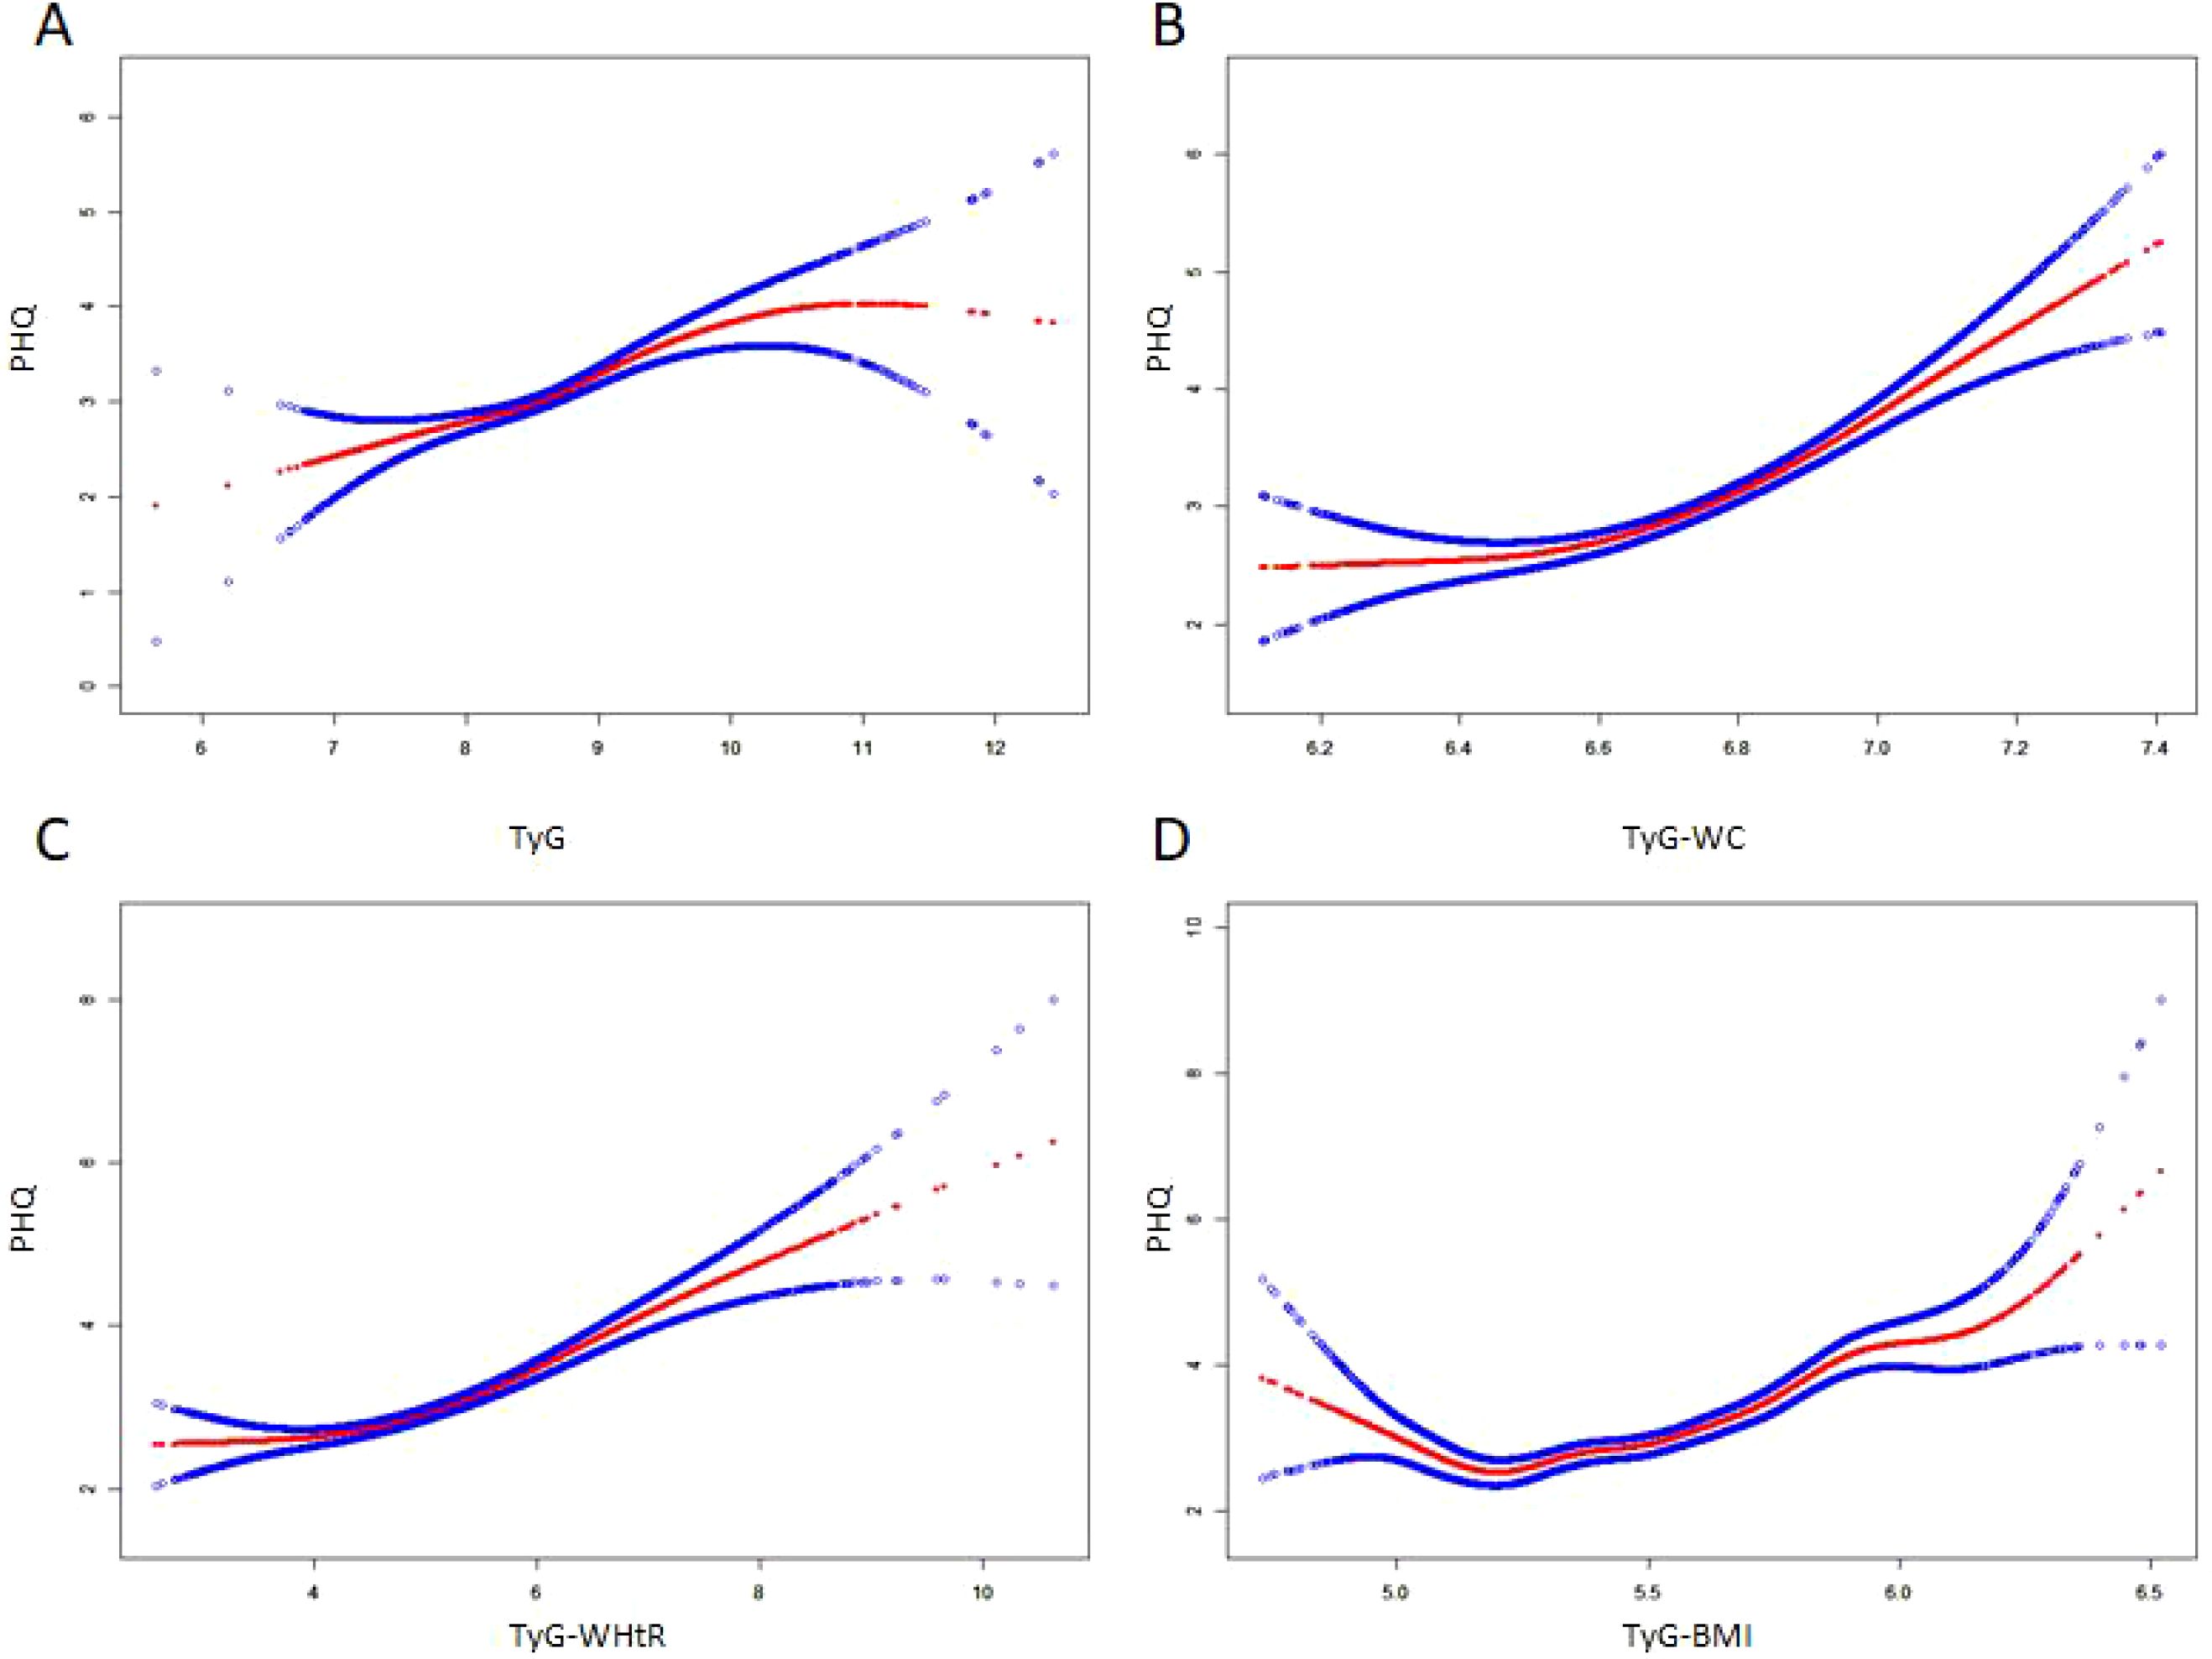
Figure 2. The non-linear relationship between TyG index and its combination with obesity indicators and depressive symptoms. A non-linear relationship between them was identified after adjusting for survey year; age; gender; race; education level; family pir; marital status; smoke; alcohol drinking; diabetes. The solid red line represents the smooth curve fit between variables. Blue bands represent the 95% of confidence interval from the fit. (A) TyG, Triglyceride-glucose index; (B) TyG-WC, Triglyceride-glucose-waist circumference; (C) TyG-WHtR, Triglyceride-glucose-waist height ratio; (D) TyG-BMI, Triglyceride-glucose-body mass index.
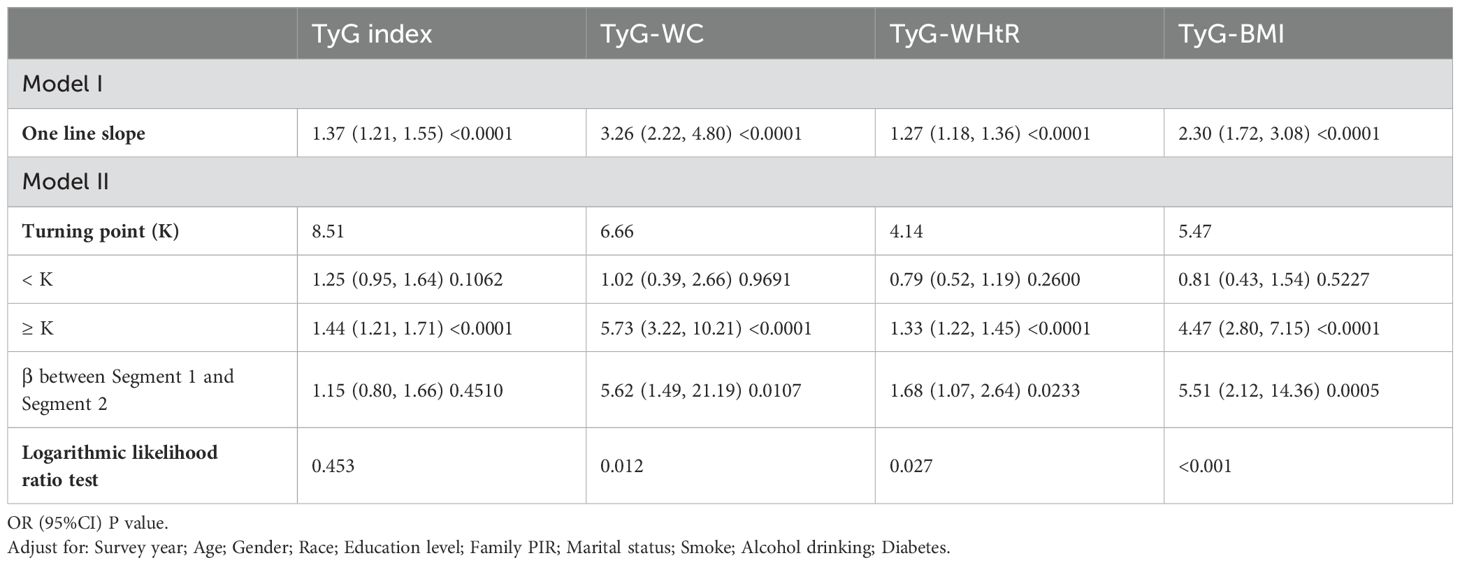
Table 3. Threshold analysis for the association of TyG and its combination with obesity indicators and depression in US adults 18–85 years, NHANES 2005–2020.
Subgroup and interaction analysis showed significant associations between TyG index, TyG-WC, TyG-WHtR, TyG-BMI, and depression across various subgroups. No significant interactions were observed except for diabetes (Figure 3).
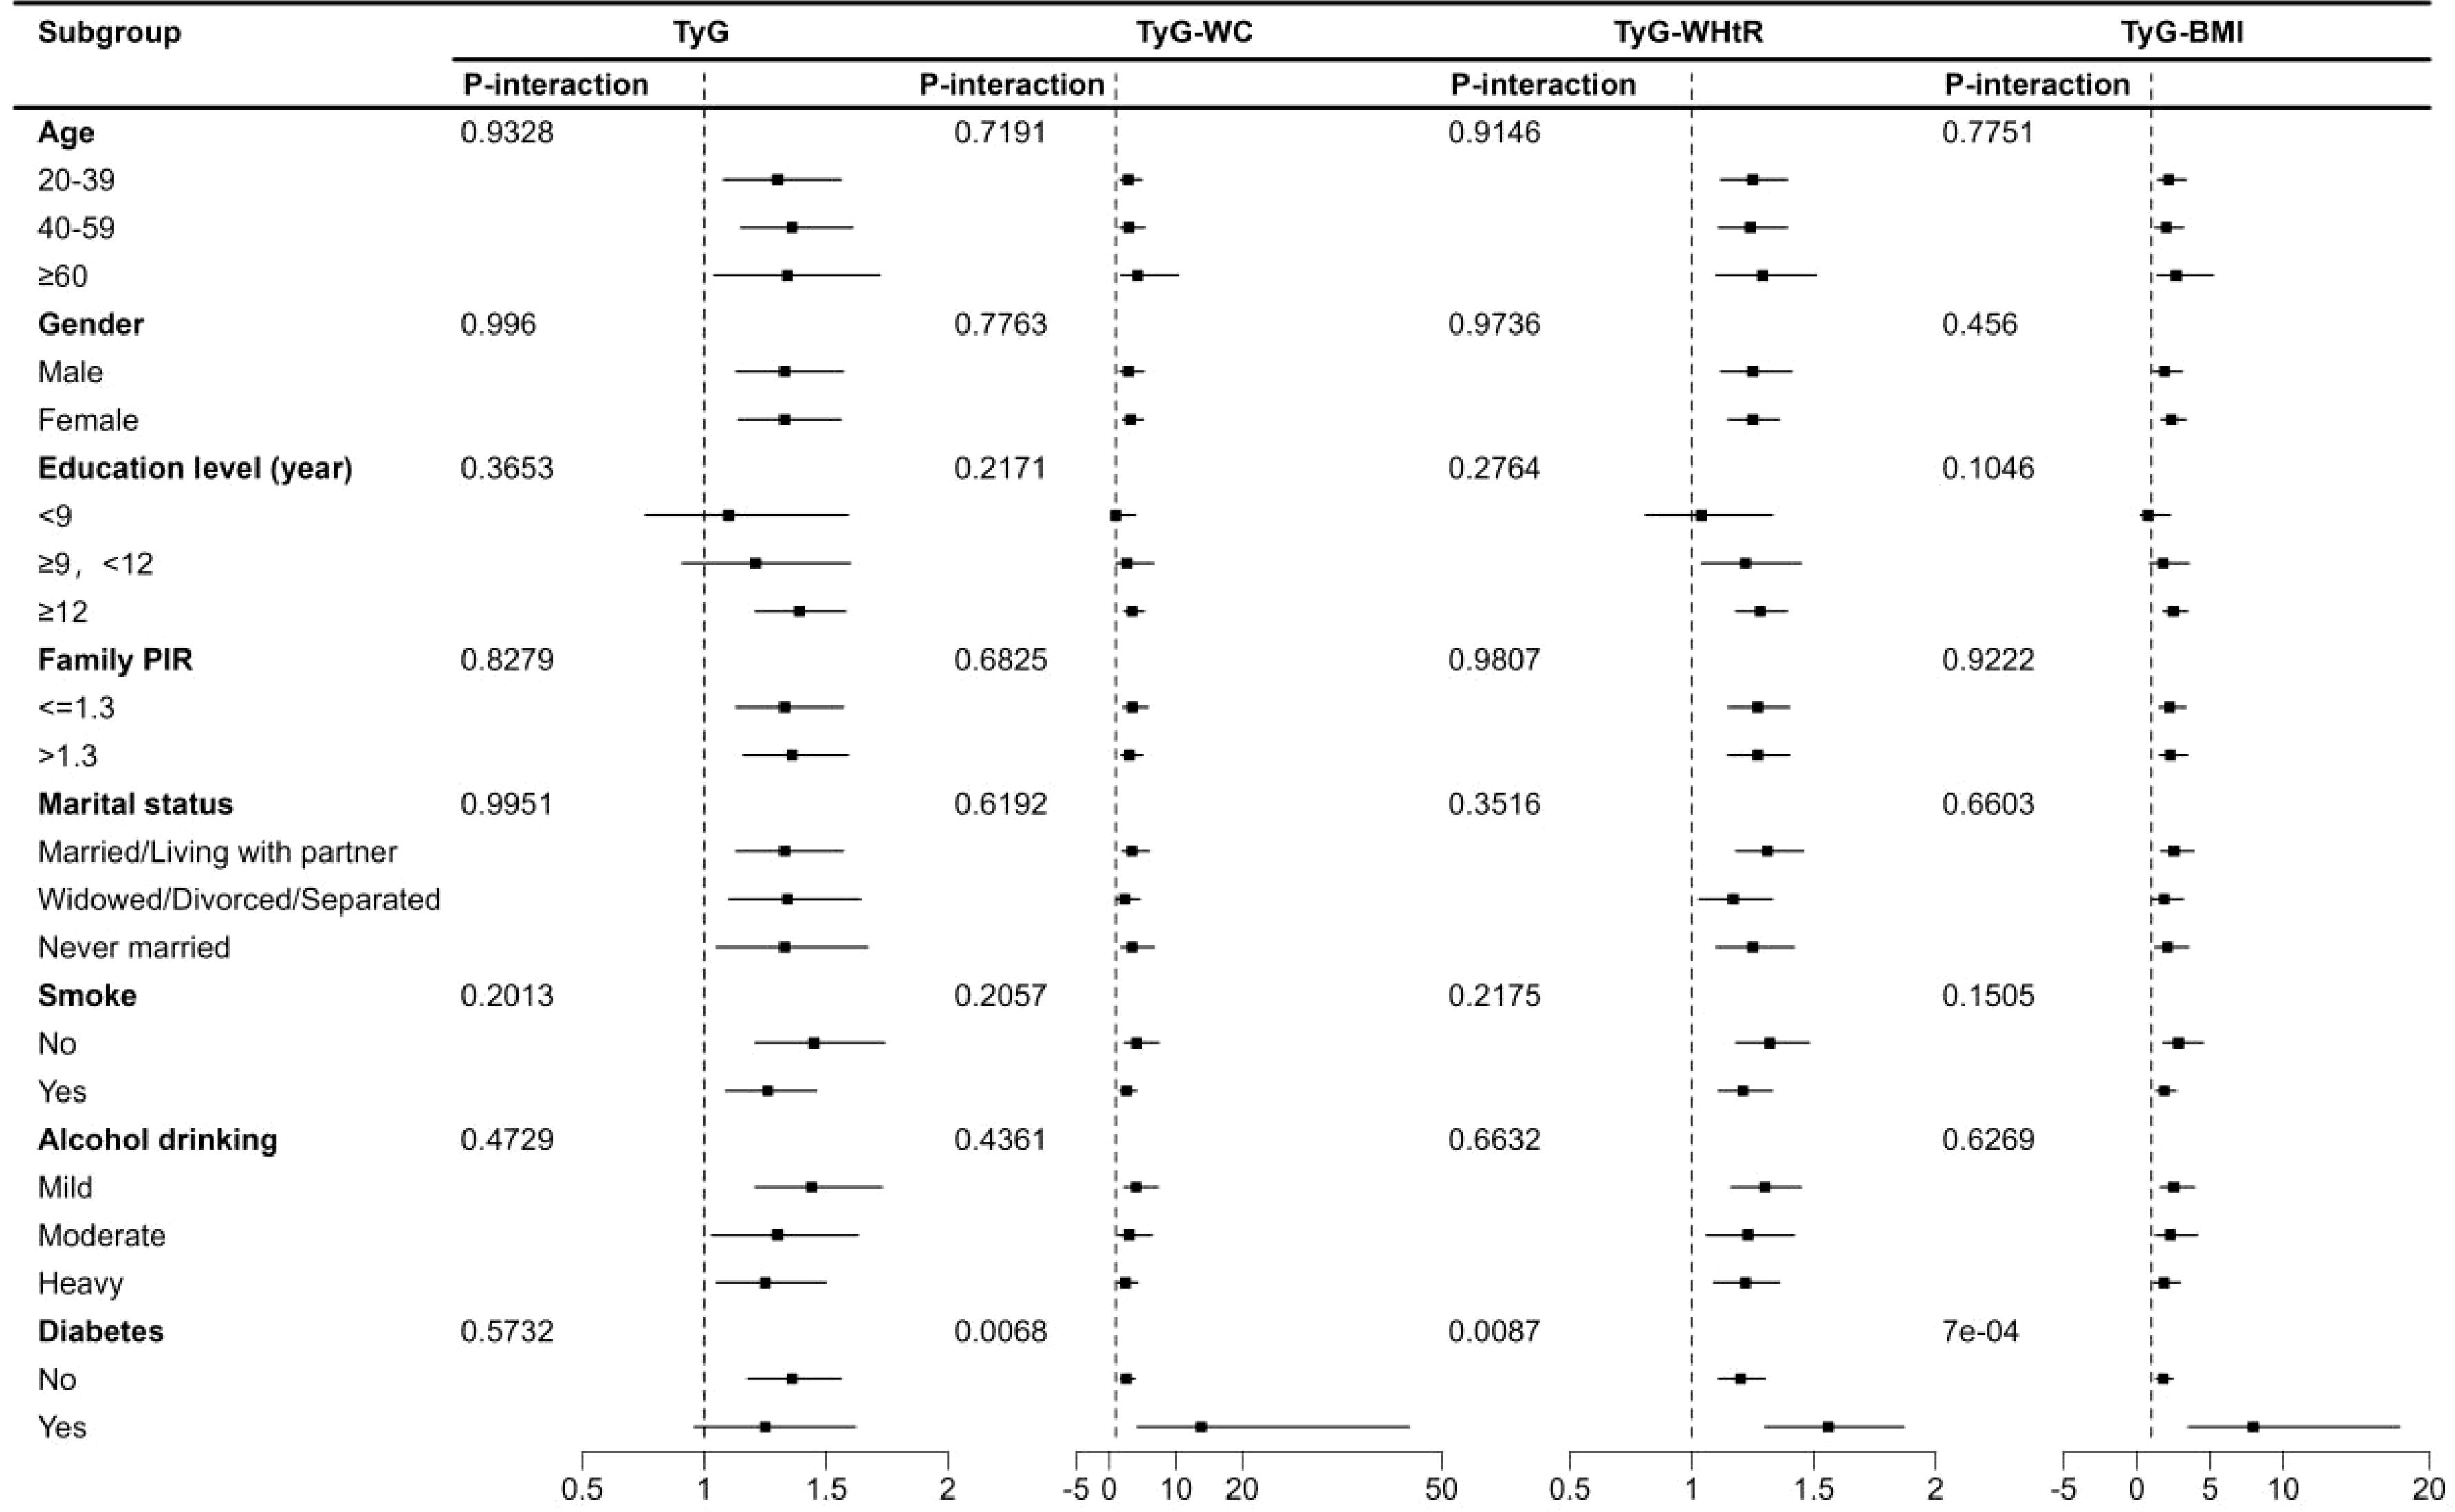
Figure 3. Subgroup analysis of TyG index and its combination with obesity indicators and depression in US adults 18–85 years, NHANES 2005–2020. TyG, Triglyceride-glucose index; TyG-WC, Triglyceride-glucose-waist circumference; TyG-WHtR, Triglyceride-glucose-waist height ratio; TyG-BMI, Triglyceride-glucose-body mass index.
The study used multiple interpolations to impute the education, marital status, family PIR, smoke and alcohol drinking values for sensitivity analysis. Supplementary Table 1 showed the distribution of missing variables. The direction of the results of the sensitivity analyses (Supplementary Tables 2, 3) was stable consistent with the formal results.
This study aimed to explore the association between the triglyceride glucose (TyG) index, combined obesity indices (TyG-WC, TyG-WHtR, TyG-BMI), and depression among a national representative sample of individuals from the NHANES dataset. Our findings indicate a significant association between the TyG index and its combined obesity indices with depressive symptoms. Specifically, we observed a dose-dependent relationship in which higher TyG, TyG-WC, TyG-WHtR, and TyG-BMI levels were correlated with an increased risk of depressive symptoms. These findings offer critical insights into the potential role of insulin resistance and obesity in the etiology of depression, underscoring the relevance of metabolic health in mental well-being.
Our results align with previous research indicating a positive relationship between TyG index and depression risk (31, 32). This risk could be explained by the complex relationship between metabolic disturbances and neuropsychological health. Insulin promotes glutamate neurotransmitter release by boosting the phosphorylation and membrane localization of NMDA receptor subunits (33, 34), while also promoting the surface expression of GluR1-containing AMPA receptors (35). The glutamate system plays a key role in depression, with dysregulation leading to neurotoxicity and reduced synaptic plasticity, which contribute to depressive symptoms (36–38). Additionally, high TyG values might reflect underlying metabolic syndrome (39) or inflammatory processes (40), which are known risk factors for depression (41, 42). Recent studies using advanced techniques such as high-plex protein and whole transcriptome co-mapping at cellular resolution with spatial CITE-seq have further elucidated the complex interplay between metabolic dysregulation and neuroinflammation, providing additional mechanistic insights into the link between metabolic health and depression (43, 44).
Notably, we found that combining the TyG index with obesity indicators (WC, WHtR, BMI) enhances the predictive accuracy for depression risk. This finding suggests that assessing metabolic and obesity-related markers jointly could be more effective in identifying individuals at high risk for depression than using TyG index alone. Obesity is well-documented to contribute to depression through mechanisms like chronic low-grade inflammation, oxidative stress, and altered hypothalamic-pituitary-adrenal (HPA) axis function (4, 45), which could amplify the depressive effects of metabolic dysregulation. Thus, our study highlights the potential of the TyG index-obesity combined indices as novel screening tools for depression in populations with metabolic and weight-related risk factors. The nonlinear relationship between TyG index, TyG-WC, TyG-WHtR, TyG-BMI and depression revealed threshold effects. While TyG index showed a linear correlation, TyG-WC, TyG-WHtR, and TyG-BMI demonstrated nonlinear associations. Threshold analysis identified inflection points: TyG index (8.51), TyG-WC (6.66), TyG-WHtR (4.14), and TyG-BMI (5.47). Below these points, no significant association with depression was found. However, beyond the thresholds, the risk of depression increased substantially: TyG index (44% increase), TyG-WC (5.73-fold increase), TyG-WHtR (33% increase), and TyG-BMI (4.47-fold increase). These findings suggest that metabolic health, particularly waist circumference and BMI, plays a crucial role in depression risk. Early monitoring and intervention for metabolic dysfunction could help prevent depression.
Our study has several strengths, including a large sample size and a robust statistical analysis that controlled for potential confounders. However, there are limitations to consider. First, the cross-sectional design precludes causative inference, as we cannot determine whether metabolic disturbances lead to depression or vice versa. Second, while we accounted for multiple confounders, other factors, such as dietary habits, physical activity, and medication use, which might influence both metabolic and mental health, were not included. Finally, the data are based on a U.S. population, limiting the generalizability of findings to other populations with different sociodemographic or genetic profiles. Additionally, we acknowledge that the PHQ-9 is a validated screening instrument rather than a clinical diagnostic tool for depression. Due to the nature of NHANES data, formal clinical diagnoses of depression were not available, which limited our ability to use clinician-assessed diagnostic criteria. We have clarified this point in the Methods and Discussion sections and explicitly stated that our study assesses “depressive symptoms” rather than “clinical depression” to avoid potential misinterpretation. We also recognize that diseases such as hypothyroidism and Parkinson’s disease may influence depressive symptoms. While NHANES does not provide comprehensive data on all potential comorbid conditions, we have now explicitly mentioned this limitation in the Discussion section and acknowledged the potential impact of undiagnosed or unadjusted comorbid conditions on our findings.
In conclusion, this study adds to the growing body of literature linking metabolic health and depressive symptoms, suggesting that TyG index combined with obesity indices may serve as a valuable predictor of depressive symptoms. Our findings support integrating metabolic and obesity assessments into mental health screenings, particularly for high-risk groups. Future longitudinal studies should investigate the causal relationship between TyG index, obesity indices, and depressive symptoms, and explore the impact of lifestyle interventions targeting metabolic health on mental health outcomes. Additionally, incorporating longitudinal data that captures various economic cycles can provide deeper insights into how different economic conditions affect mental health over time. We believe that this interdisciplinary approach will not only enhance the robustness of our findings but also offer more actionable insights for policymakers and healthcare providers. Furthermore, future research may benefit from the use of advanced statistical models that account for the dynamic interplay between economic variables and mental health outcomes. By doing so, we can better isolate the specific economic factors contributing to depression and develop targeted interventions to mitigate their impact. This holistic approach will ensure that our research remains relevant and impactful in addressing the mental health challenges posed by fluctuations in economic conditions.
The original contributions presented in the study are included in the article/Supplementary Material. Further inquiries can be directed to the corresponding author.
The studies involving humans were approved by Ethics Review Committee of the National Center for Health Statistics (NCHS). The studies were conducted in accordance with the local legislation and institutional requirements. Written informed consent for participation in this study was provided by the participants’ legal guardians/next of kin.
HS: Conceptualization, Formal analysis, Funding acquisition, Writing – original draft. WH: Formal analysis, Funding acquisition, Data curation, Methodology, Writing – review & editing. JB: Formal analysis, Methodology, Writing – review & editing. HZ: Methodology, Writing – review & editing. HM: Writing – review & editing, Data curation, Funding acquisition. KM: Writing – review & editing, Conceptualization.
The author(s) declare that financial support was received for the research, authorship, and/or publication of this article. This study was financially supported by Shaanxi Provincial Key Research plan general project - Social development field (2024SF-YBXM-313), (2024SF-YBXM-299), (2021SF-201) and Xi’an Municipal Health Commission Research Project - Youth Training Program (2024qn07).
All authors thank the NHANES 2003-2018 participants for their invaluable contributions.
The authors declare that the research was conducted in the absence of any commercial or financial relationships that could be construed as a potential conflict of interest.
The author(s) declare that no Generative AI was used in the creation of this manuscript.
All claims expressed in this article are solely those of the authors and do not necessarily represent those of their affiliated organizations, or those of the publisher, the editors and the reviewers. Any product that may be evaluated in this article, or claim that may be made by its manufacturer, is not guaranteed or endorsed by the publisher.
The Supplementary Material for this article can be found online at: https://www.frontiersin.org/articles/10.3389/fpsyt.2025.1533819/full#supplementary-material
1. World Health Organization. Depression (2023). Available online at: https://www.who.int/news-room/fact-sheets/detail/depression (Accessed December 31, 2024).
2. World Health Organization. Depression and other common mental disorders: global health estimates (2017). Available online at: https://www.who.int/publications/i/item/depression-global-health-estimates (Accessed December 31, 2024).
3. Wolfe HL, Boyer TL, Henderson ER, Streed CG Jr., Blosnich JR. The association of depression with all-cause and cardiovascular disease mortality risk among transgender and gender diverse and cisgender patients. J Affect Disord. (2024) 366:364–69. doi: 10.1016/j.jad.2024.08.174
4. Milaneschi Y, Simmons WK, van Rossum EFC, Penninx BW. Depression and obesity: evidence of shared biological mechanisms. Mol Psychiatry. (2019) 24:18–33. doi: 10.1038/s41380-018-0017-5
5. Maina JG, Balkhiyarova Z, Nouwen A, Pupko I, Ulrich A, Boissel M, et al. Bidirectional mendelian randomization and multiphenotype GWAS show causality and shared pathophysiology between depression and type 2 diabetes. Diabetes Care. (2023) 46:1707–14. doi: 10.2337/dc22-2373
6. Paljärvi T, Tiihonen J, Lähteenvuo M, Tanskanen A, Fazel S, Taipale H. Psychotic depression and deaths due to suicide. J Affect Disord. (2023) 321:28–32. doi: 10.1016/j.jad.2022.10.035
7. Greenberg PE, Fournier AA, Sisitsky T, Pike CT, Kessler RC. The economic burden of adults with major depressive disorder in the United States (2005 and 2010). J Clin Psychiatry. (2015) 76:155–62. doi: 10.4088/JCP.14m09298
8. Cuijpers P, Beekman AT, Reynolds CF. 3rd. Preventing depression: Global priority. JAMA. (2012) 307:1033–4. doi: 10.1001/jama.2012.271
9. Liu D, Wei D. Relationship between the triglyceride-glucose index and depression in individuals with chronic kidney disease: A cross-sectional study from National Health and Nutrition Examination Survey 2005-2020. Med (Baltimore). (2024) 103:e39834. doi: 10.1097/md.0000000000039834
10. Liu X, Li J, He D, Zhang D, Liu X. Association between different triglyceride glucose index-related indicators and depression in premenopausal and postmenopausal women: NHANES, 2013-2016. J Affect Disord. (2024) 360:297–304. doi: 10.1016/j.jad.2024.05.084
11. Ren J, Lv C, Wang J. Association between triglyceride-glucose index and depression in patients with type 2 diabetes: A cross-sectional study from NHANES. Med (Baltimore). (2024) 103:e39258. doi: 10.1097/md.0000000000039258
12. Wan W, Yu Y. Association between the triglyceride glucose index and depression: a meta-analysis. Front Psychiatry. (2024) 15:1390631. doi: 10.3389/fpsyt.2024.1390631
13. Zhao W, Wang J, Chen D, Ding W, Hou J, Gui Y, et al. Triglyceride-glucose index as a potential predictor of major adverse cardiovascular and cerebrovascular events in patients with coronary heart disease complicated with depression. Front Endocrinol (Lausanne). (2024) 15:1416530. doi: 10.3389/fendo.2024.1416530
14. Pierce DR, McDonald M, Merone L, Becker L, Thompson F, Lewis C, et al. Effect of experimental hookworm infection on insulin resistance in people at risk of type 2 diabetes. Nat Commun. (2023) 14:4503. doi: 10.1038/s41467-023-40263-4
15. Kahn BB, Flier JS. Obesity and insulin resistance. J Clin Invest. (2000) 106:473–81. doi: 10.1172/jci10842
16. Krupa AJ, Chrobak AA, Sołtys Z, Dudek D, Szewczyk B, Siwek M. Insulin resistance, clinical presentation and resistance to selective serotonin and noradrenaline reuptake inhibitors in major depressive disorder. Pharmacol Rep. (2024) 76:1100–13. doi: 10.1007/s43440-024-00621-5
17. Ding C, Kong Z, Cheng J, Huang R. Development of a predictive model for the U-shaped relationship between the triglyceride glycemic index and depression using machine learning (NHANES 2009-2018). Heliyon. (2024) 10:e38615. doi: 10.1016/j.heliyon.2024.e38615
18. Shi YY, Zheng R, Cai JJ, Qian SZ. The association between triglyceride glucose index and depression: data from NHANES 2005-2018. BMC Psychiatry. (2021) 21:267. doi: 10.1186/s12888-021-03275-2
19. Pakhare M, Anjankar A. Critical correlation between obesity and cardiovascular diseases and recent advancements in obesity. Cureus. (2024) 16:e51681. doi: 10.7759/cureus.51681
20. Axelrod CL, Hari A, Dantas WS, Kashyap SR, Schauer PR, Kirwan JP. Metabolomic fingerprints of medical therapy versus bariatric surgery in patients with obesity and type 2 diabetes: the STAMPEDE trial. Diabetes Care. (2024) 47:2024–32. doi: 10.2337/dc24-0859
21. Romain AJ, Marleau J, Baillot A. Association between physical multimorbidity, body mass index and mental health/disorders in a representative sample of people with obesity. J Epidemiol Community Health. (2019) 73:874–80. doi: 10.1136/jech-2018-211497
22. Wang Y, Zhang X, Li Y, Gui J, Mei Y, Yang X, et al. Predicting depressive symptom by cardiometabolic indicators in mid-aged and older adults in China: a population-based cross-sectional study. Front Psychiatry. (2023) 14:1153316. doi: 10.3389/fpsyt.2023.1153316
23. Zhang Y, Li S, Li R, Rong F, Yu W, Zhang Z, et al. Effects of social-ecological risk factors and resilience on the relationship between metabolic metrics and mental health among young adults. Psychiatry Res. (2024) 337:115909. doi: 10.1016/j.psychres.2024.115909
24. Dang K, Wang X, Hu J, Zhang Y, Cheng L, Qi X, et al. The association between triglyceride-glucose index and its combination with obesity indicators and cardiovascular disease: NHANES 2003–2018. Cardiovasc Diabetology. (2024) 23. doi: 10.1186/s12933-023-02115-9
25. Sánchez-í?igo L, Navarro-González D, Fernández-Montero A, Pastrana-Delgado J, Martínez JA. The TyG index may predict the development of cardiovascular events. Eur J Clin Invest. (2016) 46:189–97. doi: 10.1111/eci.2016.46.issue-2
26. Levis B, Benedetti A, Thombs BD. Accuracy of Patient Health Questionnaire-9 (PHQ-9) for screening to detect major depression: individual participant data meta-analysis. BMJ. (2019) 365:l1476. doi: 10.1136/bmj.l1476
27. Kroenke K, Spitzer RL, Williams JBW. The PHQ-9: validity of a brief depression severity measure. J Gen Internal Med. (2001) 16:606–13. doi: 10.1046/j.1525-1497.2001.016009606.x
28. Li M, Gong W, Wang S, Li Z. Trends in body mass index, overweight and obesity among adults in the USA, the NHANES from 2003 to 2018: a repeat cross-sectional survey. BMJ Open. (2022) 12:e065425. doi: 10.1136/bmjopen-2022-065425
29. Fang L, Sheng H, Tan Y, Zhang Q. Prevalence of diabetes in the USA from the perspective of demographic characteristics, physical indicators and living habits based on NHANES 2009-2018. Front Endocrinol (Lausanne). (2023) 14:1088882. doi: 10.3389/fendo.2023.1088882
30. Mathur P, Leburu S, Kulothungan V. Prevalence, awareness, treatment and control of diabetes in India from the countrywide national NCD monitoring survey. Front Public Health. (2022) 10:748157. doi: 10.3389/fpubh.2022.748157
31. Behnoush AH, Mousavi A, Ghondaghsaz E, Shojaei S, Cannavo A, Khalaji A. The importance of assessing the triglyceride-glucose index (TyG) in patients with depression: A systematic review. Neurosci Biobehav Rev. (2024) 159:105582. doi: 10.1016/j.neubiorev.2024.105582
32. Zheng L, Cui C, Yue S, Yan H, Zhang T, Ding M, et al. Longitudinal association between triglyceride glucose index and depression progression in middle-aged and elder adults: A national retrospective cohort study. Nutr Metab Cardiovasc Dis. (2023) 33:507–15. doi: 10.1016/j.numecd.2022.11.015
33. Skeberdis VA, Lan J, Zheng X, Zukin RS, Bennett MV. Insulin promotes rapid delivery of N-methyl-D- aspartate receptors to the cell surface by exocytosis. Proc Natl Acad Sci U S A. (2001) 98:3561–6. doi: 10.1073/pnas.051634698
34. Christie JM, Wenthold RJ, Monaghan DT. Insulin causes a transient tyrosine phosphorylation of NR2A and NR2B NMDA receptor subunits in rat hippocampus. J Neurochem. (1999) 72:1523–8. doi: 10.1046/j.1471-4159.1999.721523.x
35. Passafaro M, Piëch V, Sheng M. Subunit-specific temporal and spatial patterns of AMPA receptor exocytosis in hippocampal neurons. Nat Neurosci. (2001) 4:917–26. doi: 10.1038/nn0901-917
36. Wang Y, He W, Zhang H, Yao Z, Che F, Cao Y, et al. mGluR5 mediates ketamine antidepressant response in susceptible rats exposed to prenatal stress. J Affect Disord. (2020) 272:398–408. doi: 10.1016/j.jad.2020.03.104
37. Zhang XH, Jia N, Zhao XY, Tang GK, Guan LX, Wang D, et al. Involvement of pGluR1, EAAT2 and EAAT3 in offspring depression induced by prenatal stress. Neuroscience. (2013) 250:333–41. doi: 10.1016/j.neuroscience.2013.04.031
38. Sun H, Guan L, Zhu Z, Li H. Reduced levels of NR1 and NR2A with depression-like behavior in different brain regions in prenatally stressed juvenile offspring. Prog Neuropsychopharmacol Biol Psychiatry. (2013) 8:e81775. doi: 10.1371/journal.pone.0081775
39. Son DH, Lee HS, Lee YJ, Lee JH, Han JH. Comparison of triglyceride-glucose index and HOMA-IR for predicting prevalence and incidence of metabolic syndrome. Nutr Metab Cardiovasc Dis. (2022) 32:596–604. doi: 10.1016/j.numecd.2021.11.017
40. Liu Y, Yao J, Xue X, Lv Y, Guo S, Wei P. Triglyceride-glucose index in the prediction of new-onset arthritis in the general population aged over 45: the first longitudinal evidence from CHARLS. Lipids Health Dis. (2024) 23:79. doi: 10.1186/s12944-024-02070-8
41. Jiang R, Noble S, Rosenblatt M, Dai W, Ye J, Liu S, et al. The brain structure, inflammatory, and genetic mechanisms mediate the association between physical frailty and depression. Nat Commun. (2024) 15:4411. doi: 10.1038/s41467-024-48827-8
42. Dregan A, Rayner L, Davis KAS, Bakolis I, Arias de la Torre J, Das-Munshi J, et al. Associations between depression, arterial stiffness, and metabolic syndrome among adults in the UK biobank population study: A mediation analysis. JAMA Psychiatry. (2020) 77:598–606. doi: 10.1001/jamapsychiatry.2019.4712
43. Liu Y, DiStasio M, Su G, Asashima H, Enninful A, Qin X, et al. High-plex protein and whole transcriptome co-mapping at cellular resolution with spatial CITE-seq. Nat Biotechnol. (2023) 41:1405–09. doi: 10.1038/s41587-023-01676-0
44. Liu Y, DiStasio M, Su G, Asashima H, Enninful A, Qin X, et al. Spatial-CITE-seq: spatially resolved high-plex protein and whole transcriptome co-mapping. Res Sq. (2022). doi: 10.21203/rs.3.rs-1499315/v1
Keywords: depression, triglyceride-glucose (TyG) index, triglyceride-glucose-waist circumference (TyG-WC), triglyceride-glucose-waist height ratio (TyG-WHtR), triglyceride-glucose-body mass index (TyG-BMI)
Citation: Sun H, He W, Bu J, Zhang H, Huang H and Ma K (2025) Association between triglyceride-glucose index and its combination with obesity indicators and depression: findings from NHANES 2005–2020. Front. Psychiatry 16:1533819. doi: 10.3389/fpsyt.2025.1533819
Received: 25 November 2024; Accepted: 17 February 2025;
Published: 10 March 2025.
Edited by:
Lei Huang, University of Massachusetts Medical School, United StatesReviewed by:
Fu Gao, Yale University, United StatesCopyright © 2025 Sun, He, Bu, Zhang, Huang and Ma. This is an open-access article distributed under the terms of the Creative Commons Attribution License (CC BY). The use, distribution or reproduction in other forums is permitted, provided the original author(s) and the copyright owner(s) are credited and that the original publication in this journal is cited, in accordance with accepted academic practice. No use, distribution or reproduction is permitted which does not comply with these terms.
*Correspondence: Kai Ma, TWFyazg3MzYwM0Bob3RtYWlsLmNvbQ==
Disclaimer: All claims expressed in this article are solely those of the authors and do not necessarily represent those of their affiliated organizations, or those of the publisher, the editors and the reviewers. Any product that may be evaluated in this article or claim that may be made by its manufacturer is not guaranteed or endorsed by the publisher.
Research integrity at Frontiers
Learn more about the work of our research integrity team to safeguard the quality of each article we publish.