
94% of researchers rate our articles as excellent or good
Learn more about the work of our research integrity team to safeguard the quality of each article we publish.
Find out more
ORIGINAL RESEARCH article
Front. Psychiatry , 20 January 2025
Sec. Neuroimaging
Volume 15 - 2024 | https://doi.org/10.3389/fpsyt.2024.1438085
This article is part of the Research Topic Brain-body Interactions Underlying Comorbid Depression and Other Mood Disorders View all 6 articles
 Yang Zhang1,2†
 Yihui He3,4†
 Yuan Fang1,2†Miaotian Cai5Guangqiang Sun6,7Rui Wang1,2
 Jiaxin Zhen1,2
 Yulin Zhang5
 Zhen Li1,8*
 Yundong Ma6,7*
 Tong Zhang1,2*
Background: Depressive disorders are highly prevalent among people with HIV (PWH) and are related to aberrant inflammation and immune responses. However, there is currently a lack of investigation into the neurological, inflammatory, endocrine, and immune aspects of HIV-associated depressive disorders (HADD).
Methods: The study involved 33 HIV-positive men who have sex with men with depressive disorders (HADD group) and 47 without neuropsychiatric disorders (HIV control group). Participants underwent resting-state functional magnetic resonance imaging (rs-fMRI) scans and assessments of peripheral blood. Peripheral blood cytokines, plasma concentrations of hormone and neurotrophic factors, and immune cell levels were determined using liquid chip, enzyme-linked immunosorbent assay, and flow cytometry, respectively. The correlation of imaging alterations with clinical variables and peripheral blood indicators was assessed.
Results: Compared to the HIV control group, the HADD group exhibited a higher fractional amplitude of low-frequency fluctuations in the left superior parietal gyrus, lower regional homogeneity in the left precentral gyrus, and reduced voxel-wise functional connectivity for the seed region in the right precentral gyrus with clusters in the right cuneus, etc. Furthermore, the HADD group had higher levels of interferon-gamma, a higher frequency of non-classical monocytes, and higher expression levels of perforin and CD38 on specific cells. These imaging results were significantly correlated with peripheral blood indicators and clinical variables.
Conclusion: This rs-fMRI study provides considerable evidence for abnormal intrinsic brain activity in people with HADD. Furthermore, our data also indicate the detrimental effects of depression-related inflammation on PWH. Therefore, it is imperative to increase attention to HADD and implement effective preventive interventions accordingly.
HIV-associated depressive disorders (HADD) are highly prevalent in the era of potent antiretroviral therapy, even when patients are virally suppressed (1). The presence of depressive disorders negatively affects medication adherence, disease progression, and mortality in people with HIV (PWH), placing a serious burden on patients, their families, and society (2). Several factors associated with HIV/acquired immunodeficiency syndrome (AIDS) status contribute to the high prevalence of depressive disorders, including infectious-immunological, psychosocial, and external factors (3–5). Substantial evidence suggests that HIV reservoirs in the central nervous system (CNS) may cause brain injury through chronic inflammation (6). Chronic inflammation and immune activation significantly contribute to non-AIDS-related neuropsychiatric adverse events (including HADD) in PWH (7, 8). Nonetheless, the pathogenesis of HADD is highly complex and the relationship between the neurological, inflammation, and immune systems of HADD is unclear. Investigations of brain function may help clarify the impact of HADD on the brain.
Magnetic resonance imaging (MRI) is the most frequently employed method in depressive disorder studies, and it has provided invaluable insights into the neuropathology of HIV (9). Previous studies have illustrated that PWH present brain activation abnormalities and gray matter atrophy compared to healthy controls (10, 11). Nevertheless, current studies on HADD by MRI are lacking. Firstly, more attention has been paid to the neuropsychiatric conditions in PWH. However, depressive disorders are extremely underdiagnosed in HIV/AIDS largely due to the lack of professional evaluation by highly-trained psychiatrists. Some clinicians prefer to use scales and questionnaires rather than specialized diagnostic tools for neuropsychiatric disorders. Secondly, in the field of HIV research, studies mainly focus on patients with HIV infection as well as those without infection. In particular, there have been numerous studies on HIV-associated neurocognitive disorders using MRI in this area. However, there is limited research on HIV-associated neuropsychiatric conditions such as depressive disorders in imaging. Thus, empirical data on brain imaging alterations in people with HADD is scarce.
To investigate changes in brain function among people with HADD, we examined the resting-state functional MRI (rs-fMRI) in a cohort of men who have sex with men (MSM) with HADD, comparing them to a well-matched group of HIV-positive MSM without neuropsychiatric disorders. Additionally, given the association between depression, inflammation, neurotrophins, endocrine, and immunity (12–15), we aimed to explore the effects of these factors on brain imaging as well as depressive disorders among PWH. Finally, correlation analyses were conducted to explore the relationships between imaging alterations, clinical data, inflammation-related markers, neurotrophic factors, endocrine indicators, and immune variables. The results of this investigation can provide potential theoretical foundations and data support for future studies on neuronal imaging and inflammation related to HADD.
This cross-sectional study obtained approval from the Institutional Ethics Committee of Beijing Youan Hospital, Capital Medical University (2023/057). Prior to signing a written informed consent form, all participants were informed of the entire process and potential risks. The inclusion criteria for this study were as follows: (1) virologically suppressed HIV-infected individuals; (2) Chinese MSM; (3) aged at least 18 years; (4) right-handed; (5) not taking antidepressants; and (6) capable of signing an informed consent form. The exclusion criteria were: (1) individuals with current or previous opportunistic CNS infections; (2) individuals with a history of neurological disorders such as epilepsy, multiple sclerosis, Parkinson’s disease, or dementia; (3) individuals with MRI contraindications or claustrophobia; (4) previously experienced head injury with loss of consciousness for more than 30 minutes; and (5) substance abuse. Eventually, 106 participants were enrolled in our research project between May 2022 and November 2022.
We selected participants with HADD (defined as the HADD group) and those without neuropsychiatric disorders (defined as the HIV control group) for subsequent analysis. Sixteen participants with other types of neuropsychiatric disorders were excluded from the study. All participants underwent clinical, MRI, and peripheral blood assessments on the same day.
Psychiatric diagnoses were determined by a psychiatrist following the diagnostic criteria in the Diagnostic and Statistical Manual of Mental Disorders, 5th edition (16).
Neurocognitive function assessment was conducted using the Montreal Cognitive Assessment (MoCA) (17). Anxiety and depression levels of all participants were evaluated using the Self-Anxiety Scale (SAS) and the Self-Depression Scale (SDS), respectively (18, 19). Psychological health status was evaluated using the Symptom Checklist 90 (SCL-90) (20, 21). Sleep quality was assessed by the Pittsburgh Sleep Quality Index (PSQI) (22).
Childhood maltreatment history was evaluated utilizing the Childhood Trauma Questionnaire (CTQ) (23). The assessment of alcohol craving included the administration of the Alcohol Urge Questionnaire (AUQ) and the Visual Analogue Scale (VAS) (24, 25).
All imaging data were obtained using a 1.5 T MRI scanner (Philips, Amsterdam, The Netherlands) at the Second Hospital of Beijing. Foam cushions were utilized to restrain head movement. All participants were instructed to lie down, relax, close their eyes, and not think about anything specific to avoid falling asleep.
Whole-brain resting-state functional MRI data were acquired using a gradient echo planar imaging sequence. The acquisition parameters were as follows: repetition time/echo time (TR/TE) = 4019.8/30 ms, slices = 40, matrix = 64 × 62, flip angle = 90°, slice thickness = 3.5 mm, no gap, volumes = 102, and scanning time = 6 min 52 s. The structural images were used for the registration process of functional images, with the following acquisition parameters: shortest TR/TE = 8.3/3.9 ms, matrix = 256 × 227, field of view = 256 mm × 256 mm, flip angle = 12°, slice thickness = 1 mm, and slice number = 384.
Image preprocessing and statistical analyses were conducted using Matlab R2023a (The MathWorks, Natick, MA, USA). Initially, the raw data were inspected for anatomical abnormalities and scanner artifacts. All image data obtained in digital imaging and communications in medicine format were converted to neuroimaging informatics technology initiative format for further processing and analysis.
The rs-fMRI data were preprocessed using Statistical Parametric Mapping 12 (SPM12, https://www.fil.ion.ucl.ac.uk/spm/software/spm12/) and the Rs-fMRI Data Analysis Toolkit (REST, http://www.restfmri.net) (26). The processing pipeline included the following steps: first, removal of initial volumes (n = 5), followed by slice timing correction and motion correction. Then, the functional images were co-registered with individual T1-weighted structural images and spatially normalized by the Montreal Neurological Institute brain template (27). The normalized functional images were resampled to an isotropic voxel size (3.0 × 3.0 × 3.0 mm), smoothed with a full-width half maxima (FWHM) Gaussian kernel (6 mm), and underwent linear drift removal. The Friston 24-parameter head motion model was applied to eliminate the impacts of head motion (28, 29). To further remove nuisance signals, regression was performed on the average white matter and cerebrospinal fluid signals. Finally, a temporal band-pass filter (0.01-0.08 Hz) was applied to eliminate drifts and physiological noise.
Nine participants were removed from further analysis due to excessive head motion (displacements > 2.0 mm or rotations > 2.0°).
The ALFF value of each voxel was obtained by computing the mean square root of the power spectrum within the frequency range (0.01-0.08 Hz). The ALFF maps of all participants were computed to measure spontaneous brain activity (30). The fALFF measures the ratio of the power spectrum within a specific frequency range to the power spectrum across the entire frequency range. In order to standardize the variation between participants, the ALFF/fALFF maps of each individual were normalized to the mean ALFF/fALFF map and used for between-group comparisons.
The ReHo value for each voxel was computed using Kendall’s coefficient of concordance for that voxel and its 26 neighboring voxels (31). Subsequently, Gaussian smoothing with a FWHM of 6 mm was applied to ReHo maps to diminish residual differences and noise in gyral anatomy. To mitigate the overall impact of differences between subjects, we computed the mean ReHo for each subject for group comparison.
Previous neuroimaging studies have indicated that depressive disorders are related to focal functional and structural abnormalities in various brain regions, including the precentral gyrus, dorsolateral prefrontal cortex, medial prefrontal cortex, insula, hippocampus, anterior cingulate cortex, posterior cingulate cortex, precuneus, and caudate nucleus (32, 33). For FC analysis, the average blood-oxygen level-dependent time series from twenty-two seed regions were calculated. These seed regions included the bilateral precentral gyrus, medial part of the superior frontal gyrus, dorsolateral part of the superior frontal gyrus, medial orbital part of the superior frontal gyrus, anterior cingulate and paracingulate gyri, median cingulate and paracingulate gyri, posterior cingulate gyrus, insula, hippocampus, amygdala, precuneus, and caudate nucleus. In addition, brain regions showing group differences in ALFF, fALFF, and ReHo analyses were also selected as seed regions for FC analysis. The detailed information of these seed regions is shown in Supplementary Table 1. These seed region masks were derived from the automated anatomical labeling atlas (34). Before conducting intergroup comparisons using these FC maps, Fisher r-to-z conversion was applied to elevate the normality of the FC maps.
Inflammation has been reported to be associated with depression as well as some brain functional alterations (35–37). We examined the plasma levels of 37 cytokines and chemokines in the participants. The cytokine and chemokine assays on plasma samples were conducted using the MILLIPLEX® MAP Human Cytokine/Chemokine/Growth Factor Panel A MAGNETIC BEAD PANEL 96-Well Plate Assay (EMD Millipore, Billerica, MA, USA), which is based on the cutting-edge Luminex® xMAP® technology. All steps were conducted according to the manufacturer’s instructions. Detailed methods can be found in the Supplementary Material.
The correlations of endocrine hormones and neurotrophic factors were determined using enzyme-linked immunosorbent assay kits. We primarily analyzed seven hormones and neurotrophic factors. For detailed information on these analyses, please refer to Supplementary Table 2. All measurements were conducted according to the manufacturers’ protocols.
This study used 23 custom antibodies to identify various immune cells. These antibodies were purchased preconjugated from Fluidigm (South San Francisco, USA). Detailed information about the antibodies and reporter isotopes is available in Supplementary Table 3. The cell labeling process followed established protocols (38). Please refer to the methods section of the Supplementary Material for detailed methods and operational procedures. Using a doublet-filtering approach, the raw data of each pre-processed sample was de-barcoded utilizing distinct mass-tagged barcodes. The.fcs files produced by various batches were standardized using the bead normalization technique. Subsequently, meticulous gating was performed using FlowJo software (version 10.9.0) to remove debris and dead cells. Lymphocytes and monocytes were then artificially gated for further analysis using the R language. The PhenoGraph clustering technique was used to separate the cells into many clusters based on the expression levels of surface markers. To reduce dimensionality and visualize the high-dimensional data, a visual dimensionality reduction approach called t-distributed stochastic neighbor embedding was used. The distribution of each cluster, the expression of markers, and differences between groups or sample types were analyzed using R software (version 4.2.3).
The statistical analysis was conducted using SPSS software (version 25.0; IBM Corp., Armonk, New York, USA). The significance threshold (α) was set at 0.05. The normality of the data was assessed using the Kolmogorov-Smirnov and Shapiro-Wilk tests. For normally distributed data, continuous variables were expressed as mean ± standard deviation; for non-normally distributed data, continuous variables were expressed as median and interquartile range. Based on the results of the normality test, a two-sample t-test or Mann-Whitney U-test was employed to compare continuous variables between groups. Categorical data were presented as proportions. Chi-square tests and Fisher’s exact tests were employed to compare categorical variables between groups. In correlation analysis, Pearson correlation analysis was performed for normally distributed data, and Spearman correlation analysis was performed for non-normally distributed data. An additional analysis was conducted to explore whether the observed group differences were attributable to the primary effects of depressive disorders, ART regimens, or the interaction between them.
In voxel-based comparisons, two sample t-tests were used to examine differences between the two groups in terms of ALFF, fALFF, ReHo, and FC. Age and years of education were used as covariates in the analysis process. The significance level was determined using a voxel threshold of P < 0.001 and a cluster threshold of P < 0.05 (corrected for multiple comparisons using false discovery rate (FDR), Gaussian random field, and AlphaSim correction). For further exploratory analyses, a threshold of P < 0.001 was applied (uncorrected for multiple comparisons). Imaging results were displayed using MRIcroGL software (https://www.nitrc.org/projects/mricrogl/). The imaging results were correlated with clinical data and peripheral blood metrics. Statistical results were graphed using GraphPad Prism software (version 9.5.1; GraphPad Software, San Diego, CA, USA).
A total of 80 participants successfully completed the study, with 33 participants (41.25%) in the HADD group and 47 participants (58.75%) in the HIV control group. Most demographic variables were well-matched between the two groups. The demographics and clinical characteristics are comprehensively outlined in Table 1.

Table 1. Demographic and clinical characteristics of all participants.
In comparison to the HIV control group, the HADD group exhibited significantly higher SAS scores (P < 0.001), SDS scores (P < 0.001), PSQI scores (P = 0.004), and SCL-90 scores (P < 0.001) (see Table 1 and Supplementary Table 4 for details). There were no differences between the two groups in CTQ, AUQ, VAS for alcohol craving, MoCA, or medication status (Table 1).
The HADD group exhibited higher fALFF in the left superior parietal gyrus compared to the HIV control group (FDR correction, voxel-level P < 0.001, cluster-level P < 0.05; see Figure 1 and Supplementary Table 5 for details). In this final result, the largest cluster size consists of less than 10 continuous voxels, and there was no difference in the ALFF comparison between the two groups.
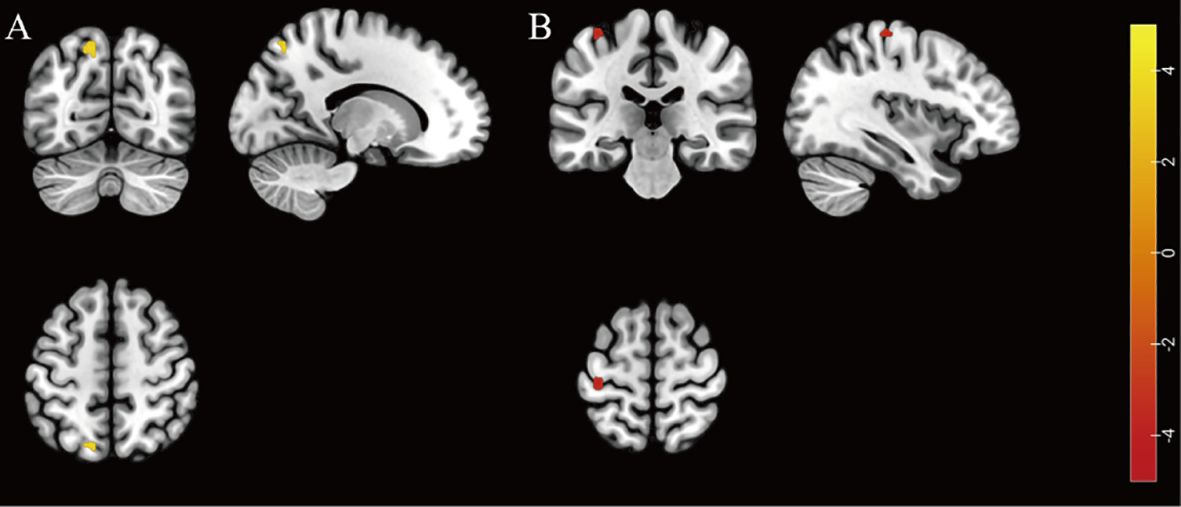
Figure 1. Individuals with HIV-associated depressive disorders exhibit abnormal functional activity in their brains. (A) The brain region with higher fALFF was located at the left superior parietal gyrus in the HADD group compared to the HIV control group (FDR correction, voxel-level P < 0.001, cluster-level P < 0.05). (B) The brain region with lower ReHo was located at the left precentral gyrus in the HADD group compared to the HIV control group (voxel-level uncorrected P < 0.001). fALFF, fractional amplitude of low-frequency fluctuation; ReHo, regional homogeneity; HADD, HIV-associated depressive disorders; HIV control, HIV-infected individuals without neuropsychiatric disorders; FDR, false discovery rate. The color bars indicate T-statistics (red/yellow).
The HADD group exhibited lower ReHo in the left precentral gyrus compared to the HIV control group (voxel-level uncorrected P < 0.001; see Figure 1 and Supplementary Table 6 for details).
Compared to the HIV control group, the HADD group displayed decreased voxel-wise FC for the seed region in the right precentral gyrus with clusters in the right cuneus, the right medial orbital part of the superior frontal gyrus with clusters in the left inferior parietal, but supramarginal and angular gyri, and the right insula with clusters in the right calcarine fissure and surrounding cortex. (AlphaSim correction, voxel-level P < 0.001, cluster-level P < 0.05; Table 2).
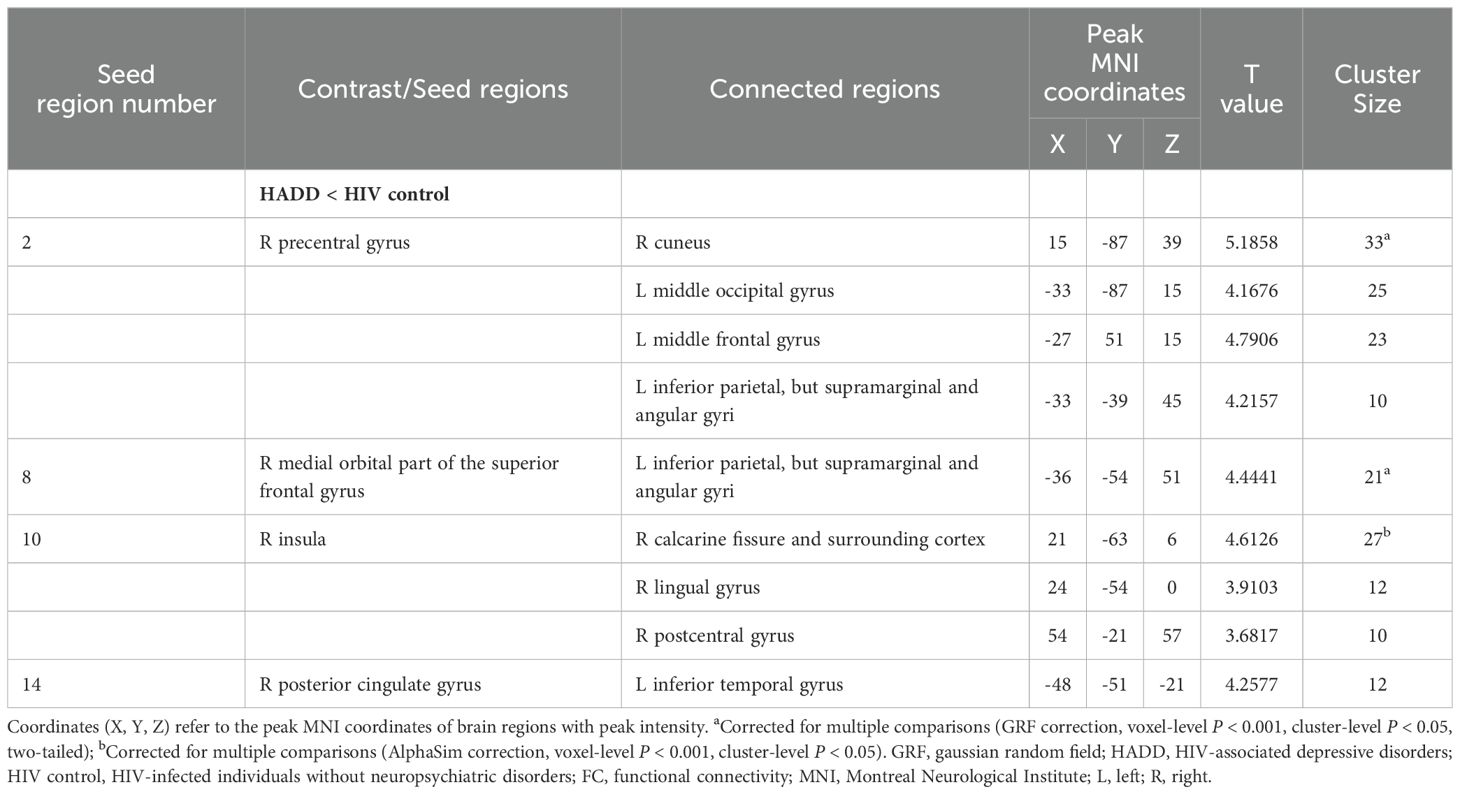
Table 2. Functional connectivity differences between the HADD and HIV control groups.
Higher plasma levels of interferon-gamma (IFN-γ) were found in the HADD group compared to the HIV control group (Figure 2).

Figure 2. Differences in inflammatory, endocrine, and neurotrophic indicators between the HADD and HIV control groups. HADD, HIV-associated depressive disorders; HIV control, HIV-infected individuals without neuropsychiatric disorders; IL, interleukin; IL-1RA, interleukin-1 receptor antagonist; G/M-CSF, granulocyte/macrophage colony-stimulating factor; IFN, interferon; sCD40L, soluble CD40 ligand; TNF, tumor necrosis factor; PDGF, platelet-derived growth factor; TGF, transforming growth factor; FGF, fibroblast growth factor; VEGF, vascular endothelial growth factor; IP, interferon-inducible protein; MCP, monocyte chemotactic protein; MIG, monokine induced by gamma interferon; MIP, macrophage inflammatory protein; BDNF, brain-derived neurotrophic factor; BNGF, beta-nerve growth factor; GDNF, glial-derived neurotrophic factor; IGF-1, insulin-like growth factor-1; CRH, corticotropin-releasing hormone; ACTH, adrenocorticotropic hormone; CORT, cortisol; ns, non-significant. *P<0.05.
Compared to the HIV control group, we observed an elevated frequency of non-classical monocytes (NCM) in the HADD group. The results showed that the HADD group expressed greater levels of perforin (in cluster 3, which represents the CD8+ effector memory T cells (TEM); cluster 5, which represents the NCM; cluster 12, which represents the double-negative T cells (DNT)) and CD38 (in cluster 1, which represents the classical monocytes (CM); cluster 3; cluster 4, which represents the CD8+ naïve T cells (TN); cluster 14, which represents the NCM; cluster 19, which represents the NCM) compared to the HIV control group (Figure 3).
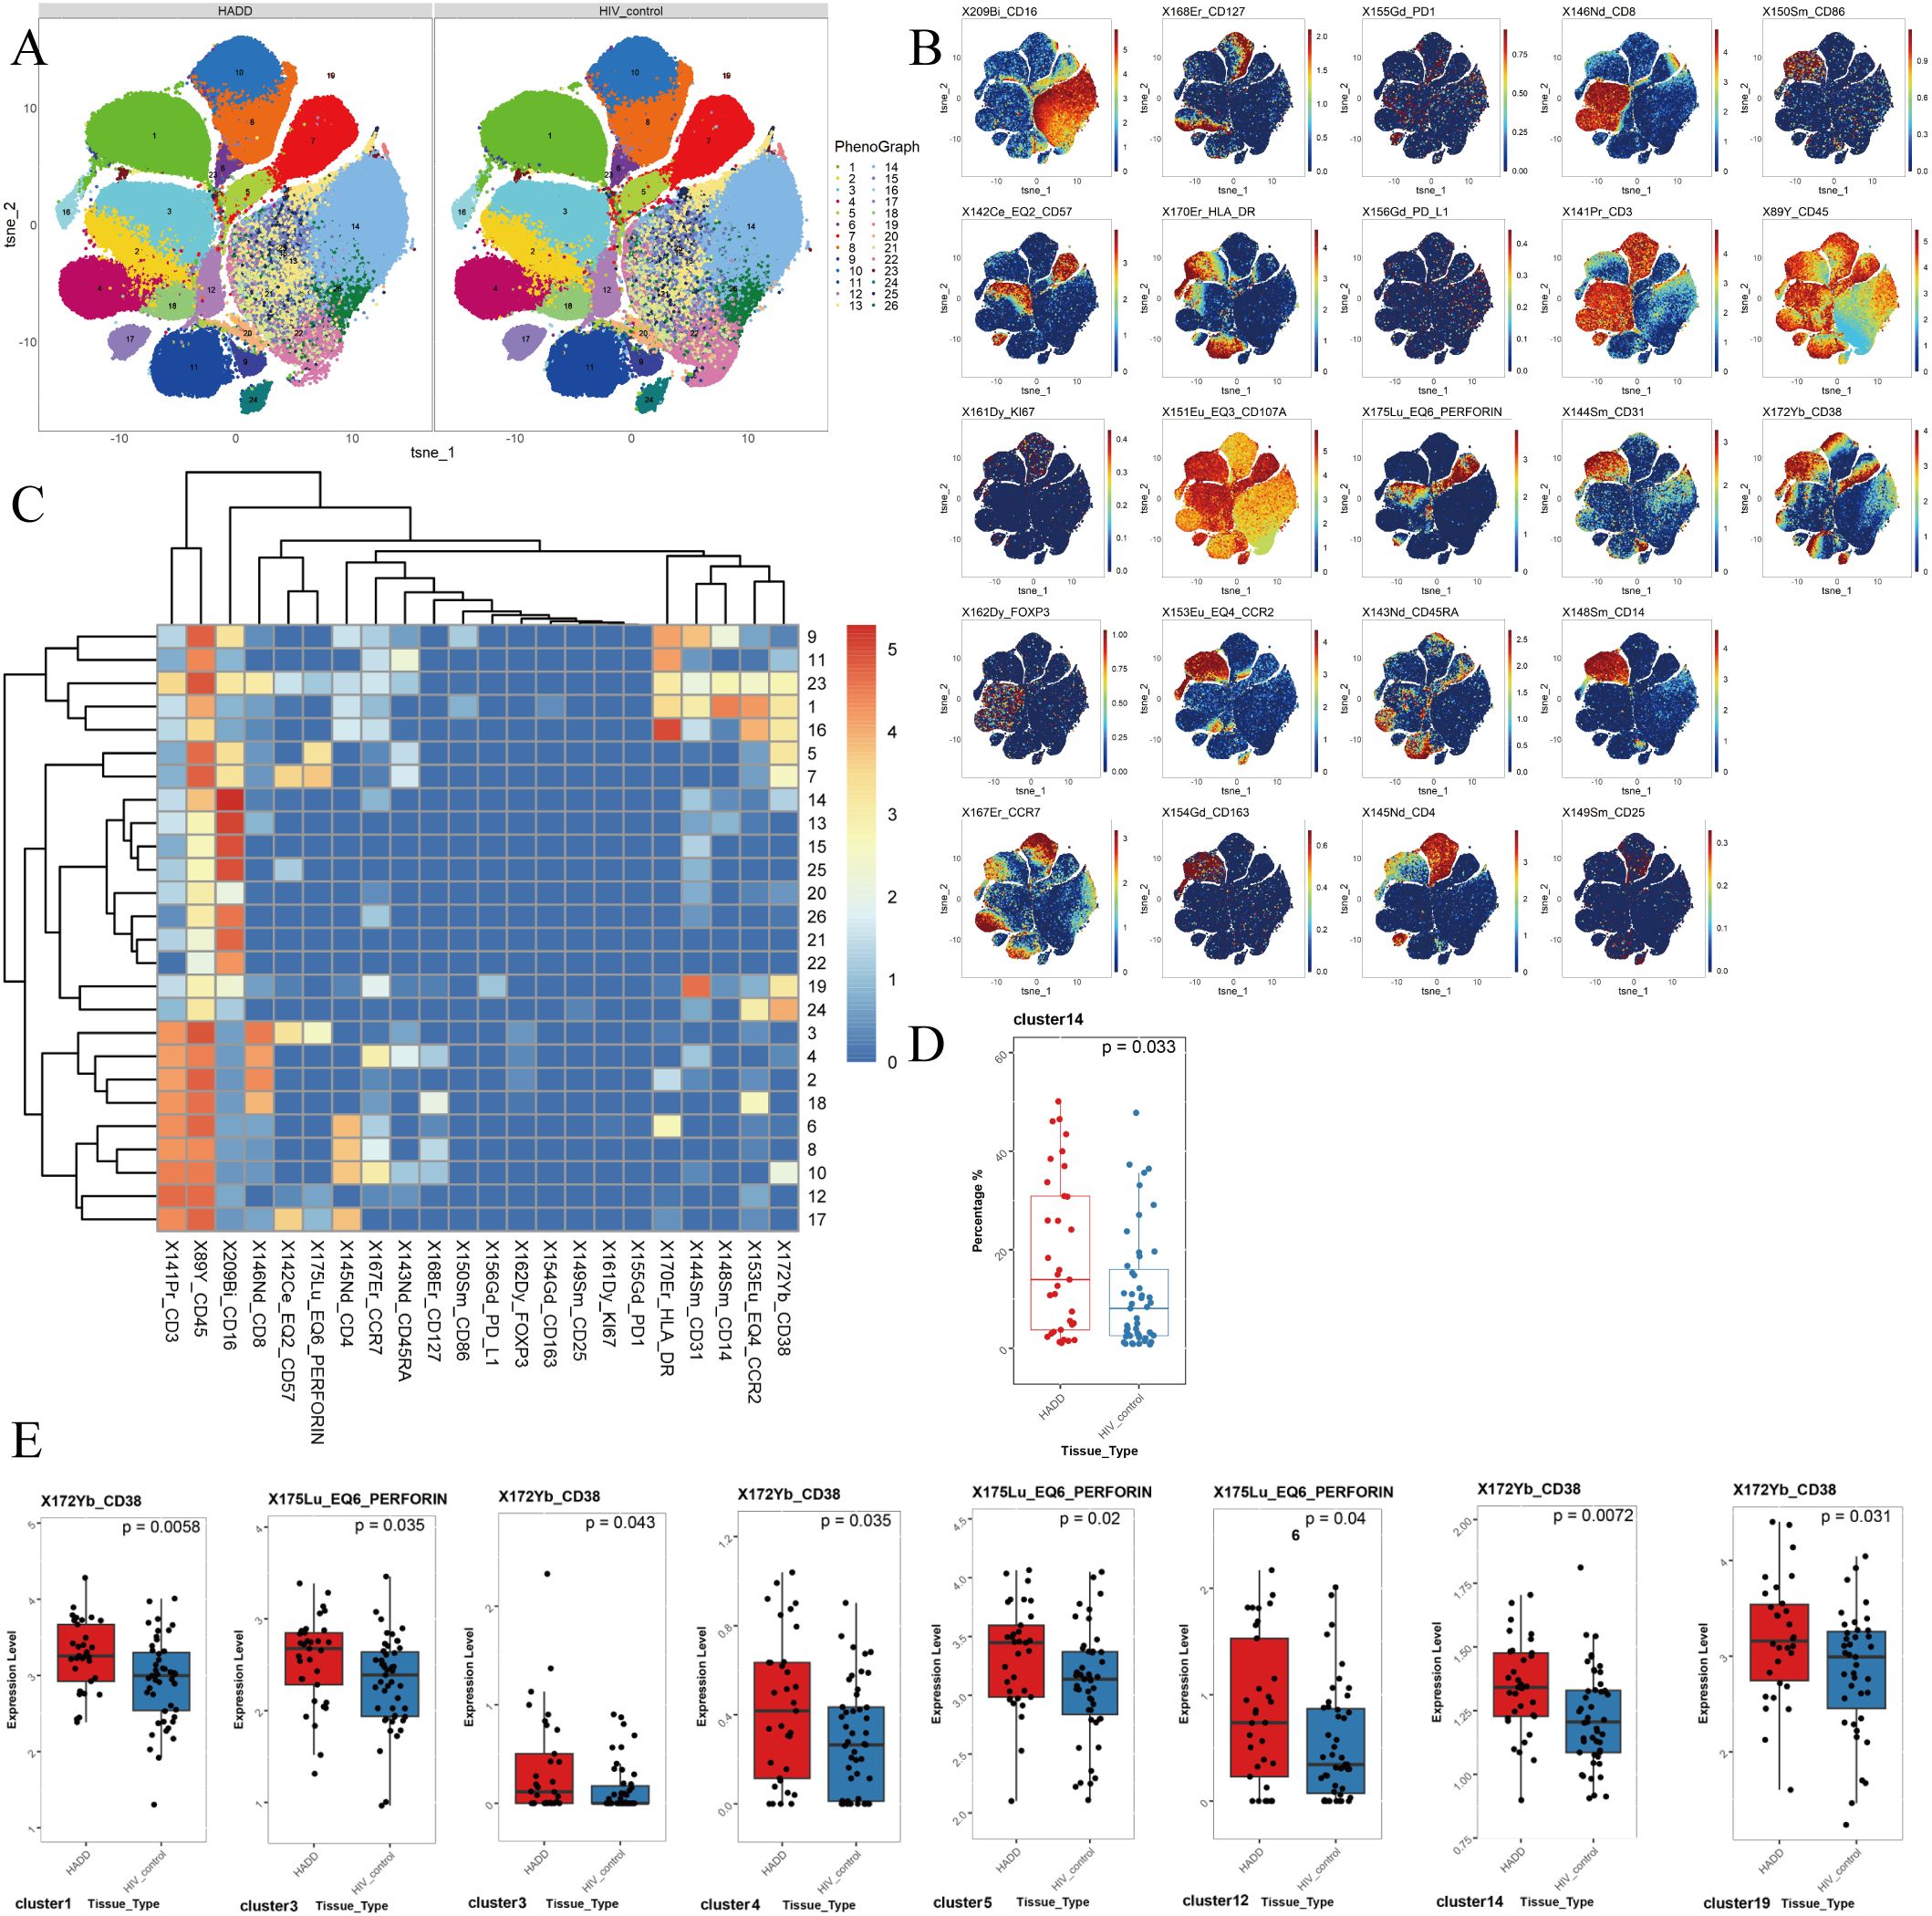
Figure 3. The results of flow cytometric analysis. (A) t-SNE plots of monocytes and CD3+ T cells in HADD and HIV control groups. (B) Expression distribution of selected markers across clusters. Dark red color: high expression; dark blue color: no expression. (C) Heatmap of marker expression for 26 monocytes and CD3+ T cell clusters. Among the 26 clusters of monocytes and CD3+ T cells, cluster 1 represented classical monocytes (CD14+ CD16-); cluster 2, 3, 18 represented CD8+ effector memory T cells (CD3+ CD4- CD8+ CD45RA- CCR7-); cluster 4, 23 represented CD8+ naïve T cells (CD3+ CD4- CD8+ CD45RA+ CCR7+); cluster 5, 7, 11, 13, 14, 15, 19, 20, 21, 22, 24, 25, 26 represented nonclassical monocytes (CD14- CD16+); cluster 17 represented CD4+ effector memory T cells (CD3+ CD4+ CD8- CD45RA- CCR7-); cluster 9 represented intermediate monocytes (CD14+ CD16+); cluster 10 represented CD4+ naïve T cells (CD3+ CD4+ CD8- CD45RA+ CCR7+); cluster 12 represented double negative T cells (CD3+ CD4- CD8-); cluster 6, 8, 16 represented CD4+ central memory T cells (CD3+ CD4+ CD8- CD45RA- CCR7+). (D) Different frequencies of cluster 14 (nonclassical monocytes) were observed between the HADD and HIV control groups. (E) Cluster showing significant differences in perforin and CD38 expression levels between the HADD and HIV control groups. Statistical significance was defined as a P value < 0.05. HADD, HIV-associated depressive disorders; HIV control, HIV-infected individuals without neuropsychiatric disorders; t-SNE, t-distributed stochastic neighbor embedding.
Depressive disorder showed significant main effects on the intergroup differences in most imaging, cytokine, and immunological indicators between the two groups. No main effects of ART regimens or interactions between groups and ART regimens were identified in the results (Supplementary Table 7).
In the analysis of all participants, there was a positive correlation between the brain-derived neurotrophic factor (BDNF) levels and ReHo values in the left precentral gyrus. The FC values (voxel-wise FC for the seed region in the right precentral gyrus with clusters in the left middle occipital gyrus) were negatively correlated with SAS scores, etc. (Figure 4).
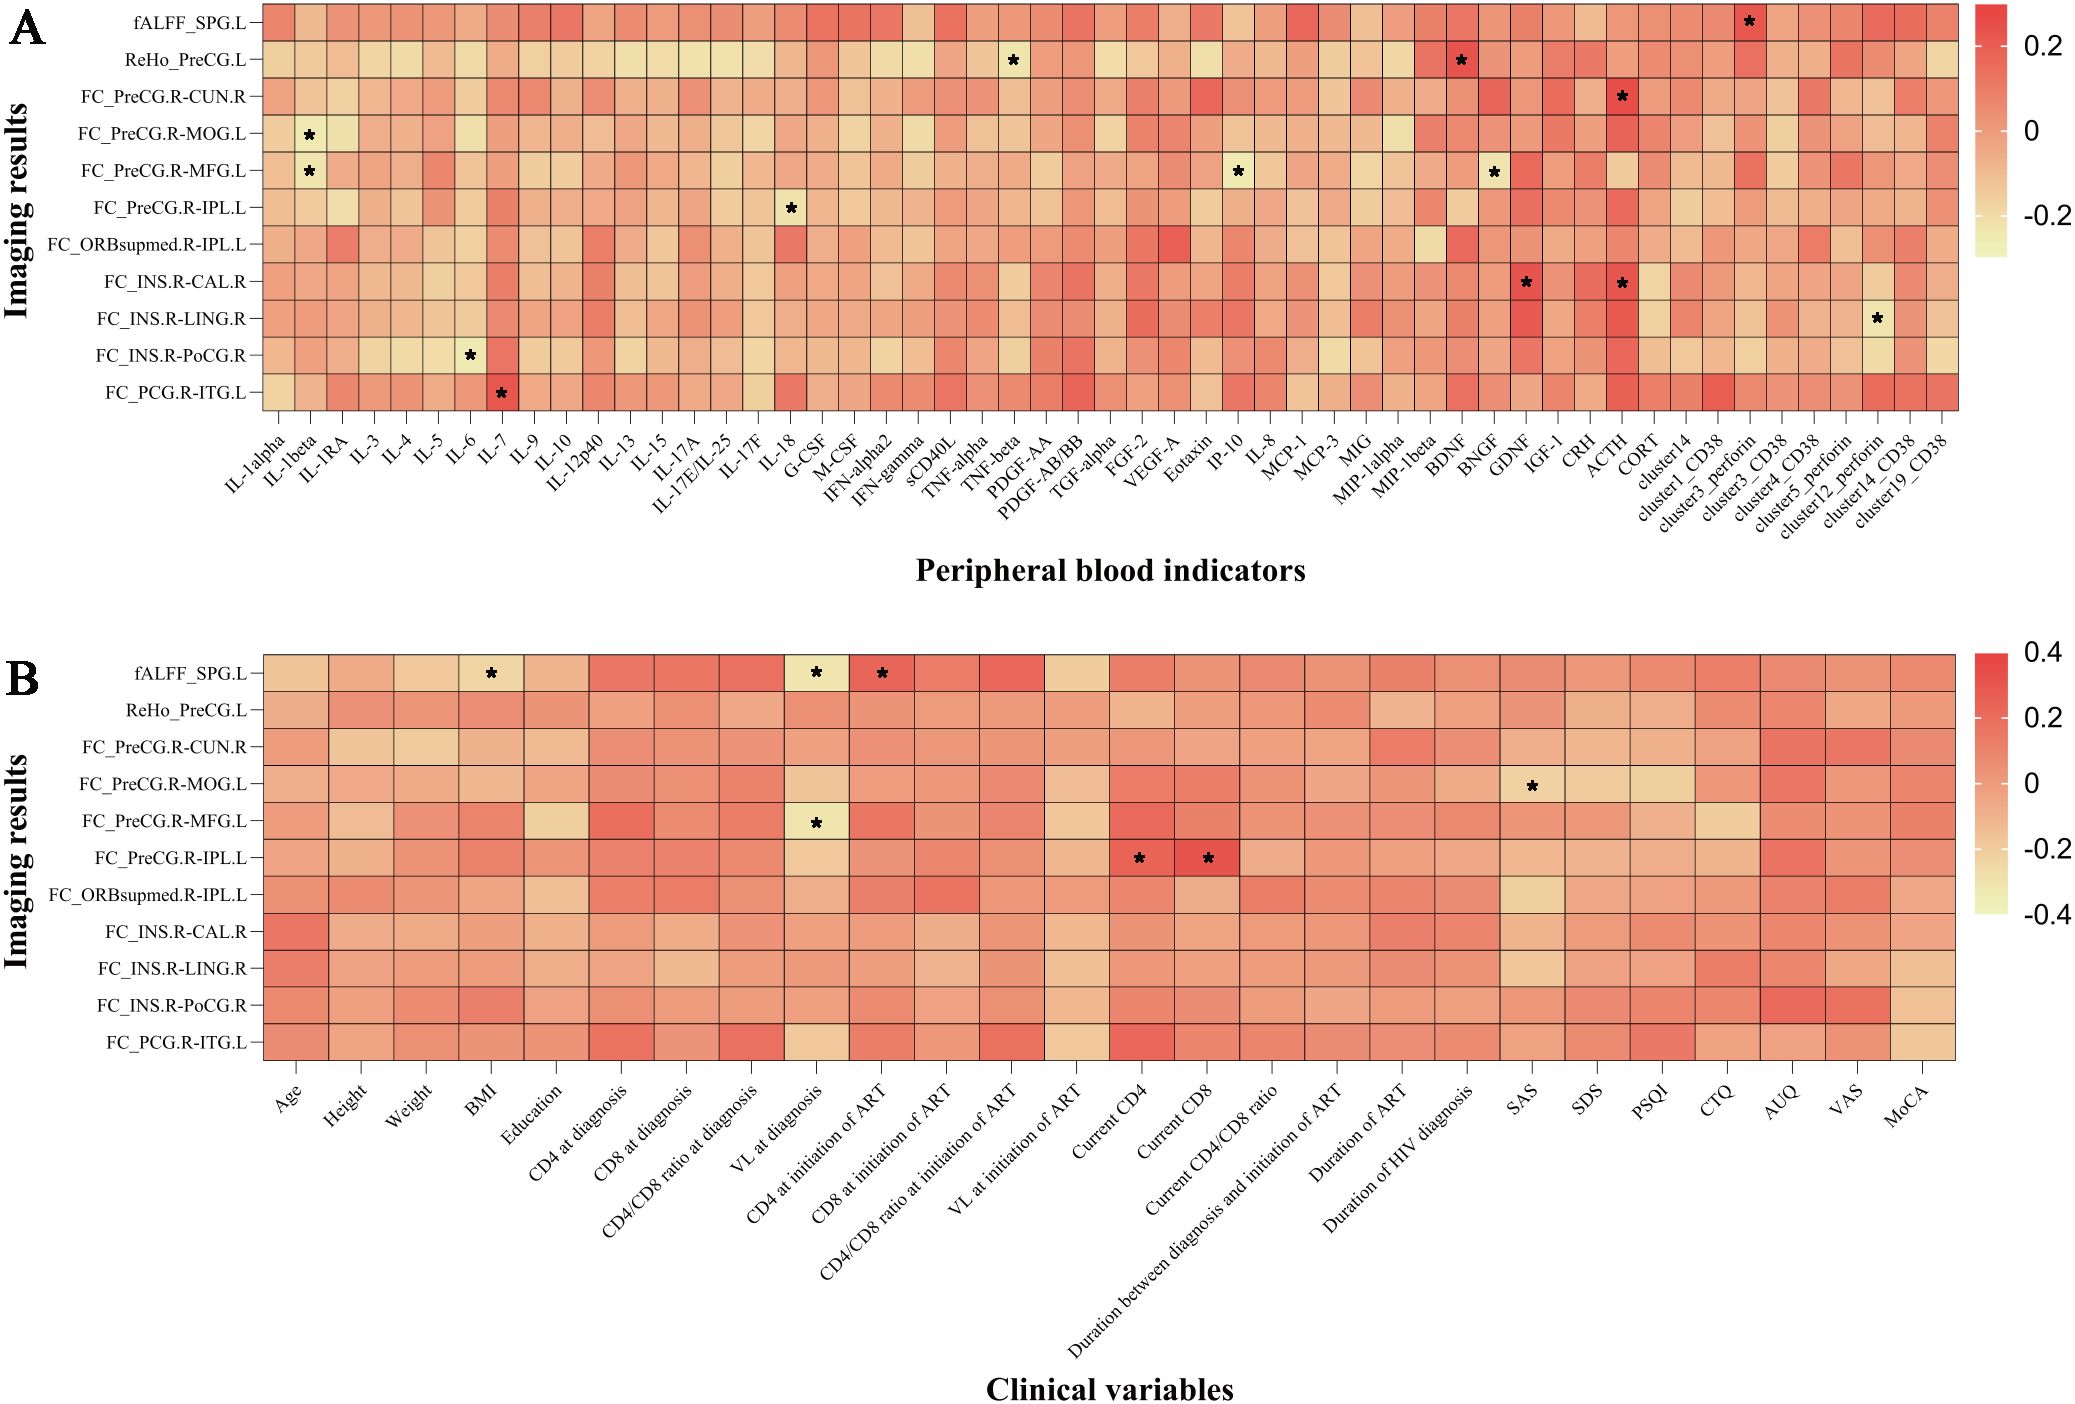
Figure 4. The imaging results were correlated with peripheral blood indicators and clinical variables. (A) Correlation between imaging results and peripheral blood indicators. (B) Correlation between imaging results and clinical variables. *P < 0.05. IL, interleukin; IL-1RA, interleukin-1 receptor antagonist; G/M-CSF, granulocyte/macrophage colony-stimulating factor; IFN, interferon; sCD40L, soluble CD40 ligand; TNF, tumor necrosis factor; PDGF, platelet-derived growth factor; TGF, transforming growth factor; FGF, fibroblast growth factor; VEGF, vascular endothelial growth factor; IP, interferon-inducible protein; MCP, monocyte chemotactic protein; MIG, monokine induced by gamma interferon; MIP, macrophage inflammatory protein; BDNF, brain-derived neurotrophic factor; BNGF, beta-nerve growth factor; GDNF, glial-derived neurotrophic factor; IGF-1, insulin-like growth factor-1; CRH, corticotropin-releasing hormone; ACTH, adrenocorticotropic hormone; CORT, cortisol; ALFF, fractional amplitude of low-frequency fluctuation; ReHo, regional homogeneity; FC, functional connectivity; SPG.L, left superior parietal gyrus; PreCG.L, left precentral gyrus; PreCG.R, right precentral gyrus; CUN.R, right cuneus; MOG.L, left middle occipital gyrus; MFG.L, left middle frontal gyrus; IPL.L, left inferior parietal, but supramarginal and angular gyri; ORBsupmed.R, right medial orbital part of the superior frontal gyrus; INS.R, right insula; CAL.R, right calcarine fissure and surrounding cortex; LING.R, right lingual gyrus; PoCG.R, right postcentral gyrus; PCG.R, right posterior cingulate gyrus; ITG.L, left inferior temporal gyrus; BMI, body mass index; CD4, CD4+ T cell count; CD8, CD8+ T cell count; VL, viral load; ART, antiretroviral therapy; INSTI, integrase strand transfer inhibitor; MRI, magnetic resonance imaging; SAS, self-rating anxiety scale; SDS, self-rating depression scale; PSQI, Pittsburgh sleep quality index; CTQ, childhood trauma questionnaire; AUQ, alcohol urge questionnaire; VAS, visual analogue scale for alcohol craving; MoCA, Montreal cognitive assessment. Cluster 14 represented nonclassical monocytes, cluster 1 represented nonclassical monocytes, cluster 3 represented CD8+ effector memory T cells, cluster 4 represented CD8+ naïve T cells, cluster 5 represented nonclassical monocytes, cluster 12 represented double negative T cells, and cluster 19 represented nonclassical monocytes.
In this study, we conducted comparisons between the HADD and HIV control groups in terms of clinical, neuroimaging, neurotrophic factors, endocrinological indicators, and immunological markers. Compared to the HIV control group, we found that the HADD group exhibited higher fALFF in the left superior parietal gyrus, lower ReHo in the left precentral gyrus, and decreased voxel-wise FC for the seed region in the right precentral gyrus with clusters in the right cuneus, etc. Additionally, we observed higher levels of inflammation-related immune markers in the HADD group. These imaging changes were correlated with clinical variables and peripheral blood indicators. These results may provide evidence that depressive disorders are associated with brain function abnormalities and inflammation in HIV-infected MSM.
In brain functional imaging comparisons, we observed higher fALFF in the left superior parietal gyrus and lower ReHo in the left precentral gyrus in the HADD group compared to the HIV control group. The parietal gyrus is involved in the processing of sensory, emotional, and cognitive functions in the human brain (39). Relevant literature in neurology and psychiatry has reported that people with schizophrenia exhibit higher fALFF in the left superior parietal lobule compared to healthy control groups (40). We also discovered that the HADD group exhibited higher fALFF in the left superior frontal gyrus, indicating abnormal activity in this region in people with HADD. The precentral gyrus, located in the dorsal portion of the frontal lobe, is responsible for processing sensory input and motor output as well as planning, controlling, and executing voluntary movements (41, 42). Interestingly, previous studies have reported similar changes between people with major depressive disorder and healthy controls (43, 44), suggesting that abnormal ReHo in the precentral gyrus may serve as a prospective neuroimaging biomarker for depressive disorder (44). Therefore, our results suggest that people with HADD may exhibit abnormal brain activity in multiple brain regions compared to HIV controls.
According to the definition of seed regions of interest, we observed decreased voxel-wise FC in the HADD group for the seed region in the right insula with clusters in the right calcarine fissure and surrounding cortex, right postcentral gyrus, and right lingual gyrus. Previous research has also indicated similar results in the general population (45). These findings provide further proof that depression is closely associated with functional coordination deficits of the insula with the calcarine, postcentral gyrus, and lingual gyrus. It is suggested that this may serve as a relatively stable biomarker for depressive disorders. Thus, these findings indicate that individuals with HADD exhibit related abnormalities in brain network connections.
Current research on the mechanism of depression in PWH is relatively common, and it is now believed that HIV infection leads to dysfunction of the hypothalamic-pituitary-adrenal axis, causing sustained immune activation, which in turn leads to the occurrence of depression (37, 46). We found that levels of IFN-γ and the frequency of NCM were higher in the HADD group compared to the HIV control group. IFN-γ is a pro-inflammatory cytokine that plays a pivotal role in regulating immune and inflammatory events (47). This aligns with literature describing how HIV infection increases the release of tumor necrosis factor-α, IFN-γ, interleukin (IL)-1, and IL-6, resulting in reduced 5-hydroxytryptamine transmission and ultimately leading to depression in PWH (37). There are three subpopulations of monocytes in whole blood: classical monocytes (phagocytosis), intermediate monocytes (pro-inflammatory, phagocytosis), and NCM (patrolling, antiviral, pro-inflammatory) (48, 49). In some inflammatory diseases, NCM have been shown to exhibit pro-inflammatory features (50–52). The frequency of NCM is higher in the HADD group, and the levels of perforin and CD38 expression in NCM are also elevated, indicating increased inflammation levels in HADD patients. DNT cells are a unique antigen-specific regulatory T cell (53, 54), and the increased expression of perforin in the HADD group indicates enhanced cytotoxic function in these cells. Since DNT cells also play a role in promoting neuroinflammation (55), their active function in the HADD group may have implications for the promotion of inflammation. Overall, the results of these peripheral blood assessments suggest a higher level of inflammation in individuals with HADD.
In the correlation investigation, we discovered a positive correlation between the ReHo values of the left precentral gyrus and BDNF levels. BDNF, as the most abundant member of the neurotrophic factor family of growth factors in the CNS, plays key roles in neuronal survival and growth as well as synaptic plasticity (56). Previous studies have shown an etiological link between depression and BDNF (57–59). One of the most significant biological findings in depression disorders is the decline in peripheral (plasma or serum) BDNF levels (59). ReHo measures the consistency of time signals between a voxel and its surrounding voxels (31). Our study found that lower ReHo in the left precentral gyrus among individuals with HADD, which was related to lower levels of BDNF. The correlation between BDNF levels and the ReHo values of the left precentral gyrus seems to indicate a consistent correlation between imaging changes and neurotrophic factors.
This study has certain strengths. First, the combined use of multiple technologies and interdisciplinary methods allows for further investigation into the associations between clinical, imaging, endocrine, and immune results. Second, the comprehensive psychiatric disorders were diagnosed by expert psychiatrists using standard diagnostic criteria to ensure the accuracy of this study, avoiding potential biases that have arisen from using psychiatric screening measures such as the general health questionnaire in other clinical studies.
However, there are also limitations and shortcomings in this research. First, the cross-sectional design limited our capacity to study temporal relationships and draw causal inferences. Second, the sample of this study, primarily composed of HIV-positive MSM, limits the generalizability of the findings to other demographics. To improve applicability, future research should include more diverse populations, encompassing varied genders, sexual orientations, and socioeconomic backgrounds. Expanding the target population to other high-risk groups and the general population is also recommended to validate the robustness and broader relevance of the findings. Third, the relatively small sample size in this study may reduce statistical power. Future research should recruit larger and more diverse sample populations through multi-center cohort studies to ensure the findings are representative of broader HIV-positive populations. Fourth, the 1.5 T MRI scanner utilized in this study has inherent limitations in imaging resolution and signal-to-noise ratio. Compared to higher-field scanners, it may be less effective in capturing fine structural details and subtle signal variations. Future studies employing higher-field scanners could enhance resolution and signal-to-noise ratio, yielding more precise imaging data to validate our findings and provide deeper mechanistic insights for clinical applications.
In summary, this study has revealed that individuals with HADD display abnormalities in brain function and higher levels of chronic inflammation compared to PWH without neuropsychiatric disorders. Moreover, there is a clear correlation between imaging results, clinical data, and inflammation markers. These findings suggest that integrating imaging and immunological data in future research may deepen our understanding of the neurofunctional changes associated with HADD.
The raw data supporting the conclusions of this article will be made available by the authors, without undue reservation.
The studies involving humans were approved by the Institutional Ethics Committee of Beijing Youan Hospital, Capital Medical University (2023/057). The studies were conducted in accordance with the local legislation and institutional requirements. Written informed consent for participation in this study was provided by the participants’ legal guardians/next of kin.
YZ: Data curation, Formal analysis, Funding acquisition, Investigation, Writing – original draft. YH: Data curation, Formal analysis, Writing – original draft. YF: Data curation, Formal analysis, Writing – original draft. MC: Data curation, Formal analysis, Writing – original draft. GS: Data curation, Formal analysis, Writing – original draft. RW: Data curation, Formal analysis, Writing – original draft. JZ: Data curation, Formal analysis, Writing – original draft. YLZ: Conceptualization, Funding acquisition, Supervision, Writing – review & editing. ZL: Conceptualization, Formal analysis, Funding acquisition, Supervision, Writing – review & editing. YM: Conceptualization, Formal analysis, Funding acquisition, Supervision, Writing – review & editing. TZ: Conceptualization, Formal analysis, Funding acquisition, Supervision, Validation, Writing – review & editing.
The author(s) declare financial support was received for the research, authorship, and/or publication of this article. This work was supported by the Beijing Research Ward Excellence Program (BRWEP2024W042180103 to YZ), Beijing Hospital Authority Clinical Medicine Development Special Funding (ZLRK202532 to TZ), National Key Research and Development Program of China (2021YFC0122601 to TZ), Beijing Research Center for Respiratory Infectious Diseases Project (BJRID2024-001 to YLZ), National Natural Science Foundation of China (82072271 to TZ, 82241072 to TZ, 82072294 to ZL), the Beijing Natural Science Foundation (7222095 to YLZ, 7222091 to YZ), the Peak Talent Program of Beijing Hospital Authority (DFL20191701 to TZ), the Capital’s Funds for Health Improvement and Research (2022-1-1151 to TZ), the Research and Translational Application of Clinical Characteristic Diagnostic and Treatment Techniques in Capital City (Z221100007422055 to TZ), the High-level Public Health Technical Personnel Construction Project (2022-1-007 to TZ), the Beijing Key Laboratory for HIV/AIDS Research (BZ0089 to TZ), the Beijing Hospitals Authority Innovation Studio of Young Staff Funding Support (2021037 to YZ), and the High-level Public Health Specialized Talents Project of Beijing Municipal Health commission (2022-02-20 to ZL).
We express our gratitude to the participants who volunteered for our study and to our team at Beijing Youan Hospital, Capital Medical University, for their contributions to recruiting and collecting these data.
The authors declare that the research was conducted in the absence of any commercial or financial relationships that could be construed as a potential conflict of interest.
All claims expressed in this article are solely those of the authors and do not necessarily represent those of their affiliated organizations, or those of the publisher, the editors and the reviewers. Any product that may be evaluated in this article, or claim that may be made by its manufacturer, is not guaranteed or endorsed by the publisher.
The Supplementary Material for this article can be found online at: https://www.frontiersin.org/articles/10.3389/fpsyt.2024.1438085/full#supplementary-material
1. Williams DW, Li Y, Dastgheyb R, Fitzgerald KC, Maki PM, Spence AB, et al. Associations between antiretroviral drugs on depressive symptomatology in homogenous subgroups of women with HIV. J neuroimmune Pharmacol. (2021) 16:181–94. doi: 10.1007/s11481-019-09899-2
2. Sokero TP, Melartin TK, Rytsälä HJ, Leskelä US, Lestelä-Mielonen PS, Isometsä ET. Prospective study of risk factors for attempted suicide among patients with dsm-iv major depressive disorder. Br J Psychiatry. (2005) 186:314–8. doi: 10.1192/bjp.186.4.314
3. Gaida R, Truter I, Grobler C, Kotze T, Godman B. A review of trials investigating efavirenz-induced neuropsychiatric side effects and the implications. Expert Rev anti-infective Ther. (2016) 14:377–88. doi: 10.1586/14787210.2016.1157469
4. Medeiros GC, Smith FA, Trivedi MH, Beach SR. Depressive disorders in HIV/AIDS: A clinically focused narrative review. Harvard Rev Psychiatry. (2020) 28:146–58. doi: 10.1097/hrp.0000000000000252
5. Treisman GJ, Soudry O. Neuropsychiatric effects of HIV antiviral medications. Drug Saf. (2016) 39:945–57. doi: 10.1007/s40264-016-0440-y
6. Carroll A, Brew B. Hiv-associated neurocognitive disorders: Recent advances in pathogenesis, biomarkers, and treatment. F1000Research. (2017) 6:312. doi: 10.12688/f1000research.10651.1
7. Heath JJ, Grant MD. The immune response against human cytomegalovirus links cellular to systemic senescence. Cells. (2020) 9(3):766. doi: 10.3390/cells9030766
8. Mudra Rakshasa-Loots A, Whalley HC, Vera JH, Cox SR. Neuroinflammation in HIV-associated depression: Evidence and future perspectives. Mol Psychiatry. (2022) 27:3619–32. doi: 10.1038/s41380-022-01619-2
9. Winter NR, Leenings R, Ernsting J, Sarink K, Fisch L, Emden D, et al. Quantifying deviations of brain structure and function in major depressive disorder across neuroimaging modalities. JAMA Psychiatry. (2022) 79:879–88. doi: 10.1001/jamapsychiatry.2022.1780
10. Sui J, Li X, Bell RP, Towe SL, Gadde S, Chen NK, et al. Structural and functional brain abnormalities in human immunodeficiency virus disease revealed by multimodal magnetic resonance imaging fusion: Association with cognitive function. Clin Infect Dis. (2021) 73:e2287–93. doi: 10.1093/cid/ciaa1415
11. O'Connor EE, Sullivan EV, Chang L, Hammoud DA, Wilson TW, Ragin AB, et al. Imaging of brain structural and functional effects in people with human immunodeficiency virus. J Infect Dis. (2023) 227:S16–s29. doi: 10.1093/infdis/jiac387
12. Belvederi Murri M, Pariante C, Mondelli V, Masotti M, Atti AR, Mellacqua Z, et al. Hpa axis and aging in depression: Systematic review and meta-analysis. Psychoneuroendocrinology. (2014) 41:46–62. doi: 10.1016/j.psyneuen.2013.12.004
13. Miller AH, Raison CL. The role of inflammation in depression: From evolutionary imperative to modern treatment target. Nat Rev Immunol. (2016) 16:22–34. doi: 10.1038/nri.2015.5
14. Wohleb ES, Franklin T, Iwata M, Duman RS. Integrating neuroimmune systems in the neurobiology of depression. Nat Rev Neurosci. (2016) 17:497–511. doi: 10.1038/nrn.2016.69
15. Woods SP, Babicz M, Shahani L, Colpo GD, Morgan EE, Teixeira AL. Brain-derived neurotrophic factor (bdnf) is associated with depressive symptoms in older adults with HIV disease. J neurovirology. (2021) 27:70–9. doi: 10.1007/s13365-020-00916-2
16. Association AP. Diagnostic and statistical manual of mental disorders fifth edition. Peking University Press (2015). Available online at: https://book.douban.com/subject/26603084/.
17. Nasreddine ZS, Phillips NA, Bédirian V, Charbonneau S, Whitehead V, Collin I, et al. The montreal cognitive assessment, moca: A brief screening tool for mild cognitive impairment. J Am Geriatrics Soc. (2005) 53:695–9. doi: 10.1111/j.1532-5415.2005.53221.x
18. Zung WW. A self-rating depression scale. Arch Gen Psychiatry. (1965) 12:63–70. doi: 10.1001/archpsyc.1965.01720310065008
19. Zung WW. A rating instrument for anxiety disorders. Psychosomatics. (1971) 12:371–9. doi: 10.1016/s0033-3182(71)71479-0
20. Wang Z. Symptom self-rating scale (scl-90). Shanghai Psychiatry. (1984) 2:524395. doi: 10.3389/fpsyt.2020.524395
21. Dang W, Xu Y, Ji J, Wang K, Zhao S, Yu B, et al. Study of the scl-90 scale and changes in the chinese norms. Front Psychiatry. (2020) 11:524395. doi: 10.3389/fpsyt.2020.524395
22. Buysse DJ, Reynolds CF 3rd, Monk TH, Berman SR, Kupfer DJ. The pittsburgh sleep quality index: A new instrument for psychiatric practice and research. Psychiatry Res. (1989) 28:193–213. doi: 10.1016/0165-1781(89)90047-4
23. Bernstein DP, Stein JA, Newcomb MD, Walker E, Pogge D, Ahluvalia T, et al. Development and validation of a brief screening version of the childhood trauma questionnaire. Child Abuse Negl. (2003) 27:169–90. doi: 10.1016/s0145-2134(02)00541-0
24. Bohn MJ, Krahn DD, Staehler BA. Development and initial validation of a measure of drinking urges in abstinent alcoholics. Alcoholism Clin Exp Res. (1995) 19:600–6. doi: 10.1111/j.1530-0277.1995.tb01554.x
26. Song XW, Dong ZY, Long XY, Li SF, Zuo XN, Zhu CZ, et al. Rest: A toolkit for resting-state functional magnetic resonance imaging data processing. PloS One. (2011) 6:e25031. doi: 10.1371/journal.pone.0025031
27. Brett M, Leff AP, Rorden C, Ashburner J. Spatial normalization of brain images with focal lesions using cost function masking. NeuroImage. (2001) 14:486–500. doi: 10.1006/nimg.2001.0845
28. Friston KJ, Williams S, Howard R, Frackowiak RS, Turner R. Movement-related effects in fmri time-series. Magnetic resonance Med. (1996) 35:346–55. doi: 10.1002/mrm.1910350312
29. Yan CG, Cheung B, Kelly C, Colcombe S, Craddock RC, Di Martino A, et al. A comprehensive assessment of regional variation in the impact of head micromovements on functional connectomics. NeuroImage. (2013) 76:183–201. doi: 10.1016/j.neuroimage.2013.03.004
30. Chao-Gan Y, Yu-Feng Z. Dparsf: A matlab toolbox for "pipeline" data analysis of resting-state fmri. Front Syst Neurosci. (2010) 4:13. doi: 10.3389/fnsys.2010.00013
31. Zang Y, Jiang T, Lu Y, He Y, Tian L. Regional homogeneity approach to fmri data analysis. NeuroImage. (2004) 22:394–400. doi: 10.1016/j.neuroimage.2003.12.030
32. Gong Q, He Y. Depression, neuroimaging and connectomics: A selective overview. Biol Psychiatry. (2015) 77:223–35. doi: 10.1016/j.biopsych.2014.08.009
33. Li XY, Chen X, Yan CG. Altered cerebral activities and functional connectivity in depression: A systematic review of fmri studies. Quantitative Biol. (2022) 10(4):366–80. doi: 10.15302/J-QB-021-0270
34. Tzourio-Mazoyer N, Landeau B, Papathanassiou D, Crivello F, Etard O, Delcroix N, et al. Automated anatomical labeling of activations in spm using a macroscopic anatomical parcellation of the mni mri single-subject brain. NeuroImage. (2002) 15:273–89. doi: 10.1006/nimg.2001.0978
35. Murray C, Griffin ÉW, O'Loughlin E, Lyons A, Sherwin E, Ahmed S, et al. Interdependent and independent roles of type i interferons and il-6 in innate immune, neuroinflammatory and sickness behaviour responses to systemic poly i:C. Brain behavior Immun. (2015) 48:274–86. doi: 10.1016/j.bbi.2015.04.009
36. Tangestani Fard M, Stough C. A review and hypothesized model of the mechanisms that underpin the relationship between inflammation and cognition in the elderly. Front Aging Neurosci. (2019) 11:56. doi: 10.3389/fnagi.2019.00056
37. Nanni MG, Caruso R, Mitchell AJ, Meggiolaro E, Grassi L. Depression in HIV infected patients: A review. Curr Psychiatry Rep. (2015) 17:530. doi: 10.1007/s11920-014-0530-4
38. Hallisey M, Dennis J, Gabriel EP, Masciarelli A, Chen J, Abrecht C, et al. Profiling of natural killer interactions with cancer cells using mass cytometry. Lab investigation; J Tech Methods Pathol. (2023) 103:100174. doi: 10.1016/j.labinv.2023.100174
39. Lai CH. Fear network model in panic disorder: The past and the future. Psychiatry Invest. (2019) 16:16–26. doi: 10.30773/pi.2018.05.04.2
40. Wu R, Ou Y, Liu F, Chen J, Li H, Zhao J, et al. Reduced brain activity in the right putamen as an early predictor for treatment response in drug-naive, first-episode schizophrenia. Front Psychiatry. (2019) 10:741. doi: 10.3389/fpsyt.2019.00741
41. Han D, Li M, Mei M, Sun X. Regional homogeneity of intrinsic brain activity related to the main alexithymia dimensions. Gen Psychiatry. (2018) 31:e000003. doi: 10.1136/gpsych-2018-000003
42. Huang BL, Wang JR, Yang XH, Ren YM, Guo HR. A study on diffusion tensor imaging in patients with untreated first-episode obsessive-compulsive disorder. Quantitative Imaging Med Surg. (2022) 12:1467–74. doi: 10.21037/qims-21-682
43. Zhang Z, Chen Y, Wei W, Yang X, Meng Y, Yu H, et al. Changes in regional homogeneity of medication-free major depressive disorder patients with different onset ages. Front Psychiatry. (2021) 12:713614. doi: 10.3389/fpsyt.2021.713614
44. Song Y, Huang C, Zhong Y, Wang X, Tao G. Abnormal reginal homogeneity in left anterior cingulum cortex and precentral gyrus as a potential neuroimaging biomarker for first-episode major depressive disorder. Front Psychiatry. (2022) 13:924431. doi: 10.3389/fpsyt.2022.924431
45. Hu L, Xiao M, Ai M, Wang W, Chen J, Tan Z, et al. Disruption of resting-state functional connectivity of right posterior insula in adolescents and young adults with major depressive disorder. J Affect Disord. (2019) 257:23–30. doi: 10.1016/j.jad.2019.06.057
46. Troubat R, Barone P, Leman S, Desmidt T, Cressant A, Atanasova B, et al. Neuroinflammation and depression: A review. Eur J Neurosci. (2021) 53:151–71. doi: 10.1111/ejn.14720
47. Srinivas L, Vellichirammal NN, Alex AM, Nair C, Nair IV, Banerjee M. Pro-inflammatory cytokines and their epistatic interactions in genetic susceptibility to schizophrenia. J Neuroinflamm. (2016) 13:105. doi: 10.1186/s12974-016-0569-8
48. Shi C, Pamer EG. Monocyte recruitment during infection and inflammation. Nat Rev Immunol. (2011) 11:762–74. doi: 10.1038/nri3070
49. Yang J, Zhang L, Yu C, Yang XF, Wang H. Monocyte and macrophage differentiation: Circulation inflammatory monocyte as biomarker for inflammatory diseases. biomark Res. (2014) 2:1. doi: 10.1186/2050-7771-2-1
50. Ramirez R, Carracedo J, Berdud I, Carretero D, Merino A, Rodríguez M, et al. Microinflammation in hemodialysis is related to a preactivated subset of monocytes. Hemodialysis Int Int Symposium Home Hemodialysis. (2006) 10 Suppl 1:S24–27. doi: 10.1111/j.1542-4758.2006.01186.x
51. Zimmermann HW, Seidler S, Nattermann J, Gassler N, Hellerbrand C, Zernecke A, et al. Functional contribution of elevated circulating and hepatic non-classical CD14CD16 monocytes to inflammation and human liver fibrosis. PloS One. (2010) 5:e11049. doi: 10.1371/journal.pone.0011049
52. Mukherjee R, Kanti Barman P, Kumar Thatoi P, Tripathy R, Kumar Das B, Ravindran B. Non-classical monocytes display inflammatory features: Validation in sepsis and systemic lupus erythematous. Sci Rep. (2015) 5:13886. doi: 10.1038/srep13886
53. Zhang ZX, Yang L, Young KJ, DuTemple B, Zhang L. Identification of a previously unknown antigen-specific regulatory t cell and its mechanism of suppression. Nat Med. (2000) 6:782–9. doi: 10.1038/77513
54. Fischer K, Voelkl S, Heymann J, Przybylski GK, Mondal K, Laumer M, et al. Isolation and characterization of human antigen-specific tcr alpha beta+ CD4(-)CD8- double-negative regulatory t cells. Blood. (2005) 105:2828–35. doi: 10.1182/blood-2004-07-2583
55. Meng H, Zhao H, Cao X, Hao J, Zhang H, Liu Y, et al. Double-negative t cells remarkably promote neuroinflammation after ischemic stroke. Proc Natl Acad Sci United States America. (2019) 116:5558–63. doi: 10.1073/pnas.1814394116
56. Levy MJF, Boulle F, Steinbusch HW, van den Hove DLA, Kenis G, Lanfumey L. Neurotrophic factors and neuroplasticity pathways in the pathophysiology and treatment of depression. Psychopharmacology. (2018) 235:2195–220. doi: 10.1007/s00213-018-4950-4
57. Karege F, Perret G, Bondolfi G, Schwald M, Bertschy G, Aubry JM. Decreased serum brain-derived neurotrophic factor levels in major depressed patients. Psychiatry Res. (2002) 109:143–8. doi: 10.1016/s0165-1781(02)00005-7
58. Shimizu E, Hashimoto K, Okamura N, Koike K, Komatsu N, Kumakiri C, et al. Alterations of serum levels of brain-derived neurotrophic factor (BDNF) in depressed patients with or without antidepressants. Biol Psychiatry. (2003) 54:70–5. doi: 10.1016/s0006-3223(03)00181-1
Keywords: human immunodeficiency virus, depressive disorders, resting-state functional magnetic resonance imaging, peripheral immunity, inflammation
Citation: Zhang Y, He Y, Fang Y, Cai M, Sun G, Wang R, Zhen J, Zhang Y, Li Z, Ma Y and Zhang T (2025) Brain function abnormalities and inflammation in HIV-positive men who have sex with men with depressive disorders. Front. Psychiatry 15:1438085. doi: 10.3389/fpsyt.2024.1438085
Received: 25 May 2024; Accepted: 27 December 2024;
Published: 20 January 2025.
Edited by:
Kenneth McCarson, University of Kansas Medical Center, United StatesReviewed by:
Mayur Doke, University of Miami Health System, United StatesCopyright © 2025 Zhang, He, Fang, Cai, Sun, Wang, Zhen, Zhang, Li, Ma and Zhang. This is an open-access article distributed under the terms of the Creative Commons Attribution License (CC BY). The use, distribution or reproduction in other forums is permitted, provided the original author(s) and the copyright owner(s) are credited and that the original publication in this journal is cited, in accordance with accepted academic practice. No use, distribution or reproduction is permitted which does not comply with these terms.
*Correspondence: Zhen Li, bGl6aGVuX3B1bWNAMTYzLmNvbQ==; Yundong Ma, bWFfeWRAcGt1LmVkdS5jbg==; Tong Zhang, enRfZG9jQGNjbXUuZWR1LmNu
†These authors have contributed equally to this work
Disclaimer: All claims expressed in this article are solely those of the authors and do not necessarily represent those of their affiliated organizations, or those of the publisher, the editors and the reviewers. Any product that may be evaluated in this article or claim that may be made by its manufacturer is not guaranteed or endorsed by the publisher.
Research integrity at Frontiers
Learn more about the work of our research integrity team to safeguard the quality of each article we publish.