 Mijeong Park1
 Deachul Seo1
 Ji Geun Kim2
 Gayeon Lee1
 Larkin S. McReynolds3,4Lawrence Amsel3
 Hyunjung Yang5
 Young-Hoon Kim1
 Sanghoon Han1
 Soo Hyun Park1
 Juyoen Hur1*
- 1Department of Psychology, Yonsei University, Seoul, Republic of Korea
- 2Department of Psychology, Kyungpook National University, Daegu, Republic of Korea
- 3Division of Child and Adolescent Psychiatry, Department of Psychiatry, Columbia University-New York State Psychiatric Institute, New York, NY, United States
- 4Department of Epidemiology, Mailman School of Public Health, Columbia University, New York, NY, United States
- 5University College, Yonsei University, Seoul, Republic of Korea
Background: The Coronavirus (COVID-19) pandemic resulted in a dramatic increase in the prevalence of anxiety and depression globally. Although the impact on the mental health of young adults was especially strong, its underlying mechanisms remain elusive.
Materials and methods: Using a network approach, the present study investigated the putative pathways between pandemic-related factors and anxiety and depressive symptoms among young adults in South Korea and the U.S. Network analyses were conducted on cross-country data collected during the COVID-19 lockdown period (n = 1,036). Our model included depression symptoms (PHQ-9), generalized anxiety symptoms (GAD-7), and COVID-19-related factors (e.g., COVID-19-related traumatic stress, pandemic concerns, access to medical/mental health services).
Results: The overall structure of pandemic-to-symptom networks of South Korea and the U.S. were found to be similar. In both countries, COVID-related stress and negative future anticipation (an anxiety symptom) were identified as bridging nodes between pandemic-related factors and psychological distress. In addition, worry-related symptoms (e.g., excessive worry, uncontrollable worry) were identified as key contributors in maintaining the overall pandemic-to-symptom network in both countries.
Conclusion: The similar network structures and patterns observed in both countries imply that there may exist a stable relationship between the pandemic and internalizing symptoms above and beyond the sociocultural differences. The current findings provide new insights into the common potential pathway between the pandemic and internalizing symptoms in South Korea and in the U.S. and inform policymakers and mental health professionals of potential intervention targets to alleviate internalizing symptoms.
1. Introduction
The Coronavirus (COVID-19) pandemic broke out in December 2019 and has spread to more than 200 countries, resulting in approximately 6.4 million casualties worldwide (1, 2). During the pandemic, there has been a sharp increase in the prevalence of anxiety and depression globally (3–5). A recent study reported that cases of moderate-to-severe depression increased by 25.4% and cases of anxiety disorder rose by 19.5% in 59 countries during the pandemic (6). According to a report by the Organization of Economic Co-operation and Development (7), the COVID-19 pandemic had a greater impact on the mental health of young adults compared to other age groups, with the prevalence of anxiety and depression symptoms almost doubling since before the pandemic for this age group. Young adulthood is the prime time for the emergence and recurrence of anxiety and depressive disorders (8, 9). Young adults, who generally have less secure jobs and are more sensitive to social restrictions, may be more vulnerable to psychological distress caused by vast changes in daily life during the pandemic (10–13). In order to mitigate mental health burden of the pandemic and prepare for future social upheavals, it is critical to understand the mechanisms underlying its impact in this population.
The impact of the pandemic on peoples’ mental health is not independent of their sociocultural contexts. While the COVID-19 pandemic has increased the risk of anxiety and depression worldwide, the way it affects mental health of people across different countries may not be the same. A case in point is South Korea and the United States. There are some contextual differences, including pandemic-related government policies, culture, and access to mental health services, which may have affected the way mental health problems have been manifested in the two countries during the pandemic. For instance, the South Korean government has taken a containment strategy focusing on disease prevention (14–17), whereas in the U.S., a mitigation strategy was implemented at the level of government, that focused on reducing severe cases, while the stringency of the strategy differed widely depending on individual states (14, 18). In addition, people of a collectivistic orientation like that of South Korea tend to show stronger risk perception and a higher sense of social responsibility toward their in-groups compared to a more individualistic culture (e.g., U.S.) (19–21), which may have impacted the psychological vulnerability during the early, adjustment stages of the pandemic. Lastly, differences in mental health care systems and accessibility to available mental healthcare in the two countries might also have contributed to different progress of anxiety/depression during the pandemic.
To our knowledge, there exists only one cross-country study that compared the impact of the pandemic on mental health between South Korea and the U.S. Dean et al. (22) investigated how various factors including demographics, public health strategies and psychological factors during the early stages of the pandemic influenced psychological distress in four countries (South Korea, Hong Kong, France, and the U.S.). Despite the differences in culture and public health strategies, they found overall similarities in the relationship between the pandemic-related factors and psychological distress across these countries. Specifically, younger age, greater concern for COVID-19 and loneliness were identified as the common factors that contributed to deteriorated psychological health during the pandemic (22). However, the dependent variable in their study was a single psychological distress score. The present research examined individual symptoms of anxiety and depression in an attempt to delineate specific pathways from pandemic-related factors to psychological distress.
Network analysis is a promising approach to examine the relationship between pandemic-related factors and anxiety/depression symptoms. The network perspective assumes that mental disorders are emergent phenomena that arise from mutual interactions among multiple symptoms, which is an alternative approach to latent variable models that conceptualize mental disorders as underlying variables that cause a range of psychiatric symptoms (23, 24). Firstly, because the network perspective regards mental disorders as a result of interactions between symptoms, it presumes the role of bridging symptoms that connect the two disorders, or symptoms clusters, to explain their comorbidity (24, 25). Moreover, the network approach can also give insights into the specific pathways between external factors and symptom clusters, by including environmental variables within the network (26). For example, studies have used network analysis to identify specific pandemic-related factors (e.g., fear of infection, isolation and loneliness due to the pandemic) that have direct relationship with anxiety and depressive symptoms within a particular culture or society (27–31). Finally, this approach is useful for detecting core symptoms in the overall network as it reveals the relative degree of connectivity between symptoms (23). As such, unveiling the structure of core and bridging internalizing symptoms and their link with COVID-19 factors using the network approach can provide critical insight into how the pandemic impacts the emotional distress of individuals, and could potentially reveal effective intervention targets.
The aim of the present study was to identify and compare the putative pathways between pandemic-related factors and anxiety and depressive symptoms among young adults in South Korea and the U.S. using a network approach.
2. Materials and methods
2.1. Study design and participants
A cross-sectional online survey was conducted in South Korea and the U.S. The study was implemented in August 2021 in Korea and September 2020 to May 2021 in the U.S. According to WHO reports, the pandemic in the US was at its peak whereas it had not yet reached its peak in South Korea at the time of data collection.1 Participants responded to the survey through an online survey platform, Qualtrics in Korea, and REDCap in the U.S. Given our focus on young adulthood, only the data from undergraduate students attending 4-year university (19–29 years old) were considered. The U.S. study was conducted in accordance with the Declaration of Helsinki and was approved by the Institutional Review Board of Columbia University and the New York State Psychiatric Institute. Informed consent was obtained from all participants involved in the study.
In South Korea, of the 676 participants who responded to the survey, 5 participants (average percentage of missing: 12.6%) were excluded due to their incomplete responses, yielding a final sample of 671 Korean subjects. Data inspection revealed that a large portion of the U.S. data was not usable for the purpose of the current study. In the U.S., of the 1,159 participants who participated in the survey, a total of 803 subjects (average percentage of missing: 69.1%) were excluded from analysis due to incomplete responses (n = 738) and unknown gender (n = 65). Thus, only a subset (33.3%) of the U.S. sample was used for the current study, yielding a final sample of 365 American subjects (66% White, 11% Asian, 2% Black/African American, 3% Native Hawaiian or Pacific Islander, 18% Native American/Other). The present study was approved by the Institutional Review Board of Yonsei University (South Korea) and Columbia University (U.S.) in their respective countries.
The mean age of South Korean participants was 22.3 years (SD = 2.1 years), and the proportion of female participants was 70.7% (n = 474). On the other hand, the mean age of the American participants was 21.2 years (SD = 2.2 years), and 80.8% (n = 295) were female. Statistical analysis showed significant differences in both age (t = 7.347, p < 0.01) and gender (χ2(1) = 12.283, p < 0.01) between the two countries. Follow-up analyses confirmed that the main results remained the same with or without adding these as covariates, suggesting that they did not have a significant impact on the overall network models of the two countries.
2.2. Measures
Anxiety symptoms were assessed with the Generalized Anxiety Disorder scale [GAD-7; (32)], a 7-item scale using a 4-point frequency scale ranging from 0 (not at all) to 3 (nearly every day). Depressive symptoms were measured with the Patient Health Questionnaire [PHQ-9; (33)], a 9-item scale ranging from 0 (not at all) to 3 (nearly every day). COVID-19-related variables formulated for the study included the following: COVID-19-related traumatic stress (e.g., hypervigilance, intrusions, avoidance, or nightmares due to issues of COVID-19, etc.), COVID-19 concern about safety and security, COVID-19-related xenophobia, access to mental health services, and access to medical services. Demographic variables included age and gender (male or female). More detailed information on our measures can be found in Supplementary Table S1.
2.3. Missing data and imputation
Multiple imputation was adopted which is commonly used in network analysis to address the issue of missing data in the present study. A conservative approach was employed, only including data with missing values of 10% or less. The imputation of missing data was conducted using the mice package in R (34).
2.4. Analytic strategy
Network analysis was used to examine and compare the pandemic to-anxiety/depression symptoms network in South Korea and the U.S. The overall network structure was estimated separately for each country to identify links within the networks independently. Then, centrality and predictability indices, which reflect the relative importance of each symptom in the network, were calculated to quantify the characteristics of each network. Finally, the network models of the two countries were statistically compared. The accuracy of edge estimation and stability of both centrality indices and network comparison test were additionally assessed to check the robustness of the results.
2.4.1. Network estimation
The R program (version 4.1.3) was used for all statistical analyses. All models were visualized as network graphs using the R-package qgraph (35), where ‘nodes’ represent variables, and ‘edges’ represent the pairwise conditional association between nodes (35, 36). The network structure was estimated with the Mixed Graphical Model (MGM) via regularized generalized regression using the R-package mgm (37). MGM was used due to its broad applicability in estimating networks because it allows for the inclusion of diverse variable types and relaxes strict assumptions, such as normality, that are required in traditional models like the Gaussian Graphical Model (36–38). To control spurious associations, the least absolute shrinkage and selection operator (LASSO) was used, which shrinks all edge weights and reduces small weights toward zero (39). Also, as suggested in Epskamp and Fried’s study (2018) (40), Extended Bayesian Information Criterion (EBIC) model with its tuning parameter (γ = 0.5) was applied to select the best fitting network (41).
2.4.2. Centrality and predictability indices
Centrality and predictability indices were computed to investigate the structural features of the network (36). Specifically, bridge centrality index indicates a node’s overall connectivity with nodes of the other clusters. It is used to identify nodes that connect different clusters within the network (42) such as bridging symptoms explaining the comorbidity pattern between symptom clusters. The bridge strength index was assessed by using the R-package networktools (42, 43). Since visual inspection can lead to misinterpretation of the connections between the different clusters when the network is complex (42, 44), this index was used to objectively quantify and detect nodes that are highly connected to other clusters. As per prior work (42), the top 20% score of bridge strength values were selected as predicted bridging nodes. The strength centrality index, one of the most commonly used indices in network analysis, represents the level of connectivity of a given node with the rest of the nodes in the network, indicating the relative importance of a given node within the network. It was calculated as the sum of all edge weight values connected to the specific node. The predictability was additionally computed by using the R-package mgm (37). It represents the extent to which nodes are predicted by other nodes in the network, similar to R2 in regression (45). A high predictability value indicates that the given node can be controlled by its neighboring nodes while a low value stands for the need of direct intervention to the target symptom (46).
2.4.3. Accuracy and stability analyses
In order to check the robustness of the results, accuracy and stability analyses were conducted using R-package bootnet (47). To assess the accuracy of network estimation, 1,000 non-parametric bootstraps for each node were performed by computing confidence intervals (CIs), and new datasets were created by resampling observations in the data based on 95% CIs. Narrower CIs corresponds with more accurate estimation of the edges (47). Then, to conduct stability analyses, a case-dropping bootstrap was performed to measure the correlation stability (CS)–coefficient, which indicates the maximum drop percentage of cases to retain a correlation with original centrality indices above 0.7 in at least 95% of the sample (47). Epskamp et al. (47) suggests that a CS-coefficient higher than 0.25 is acceptable but that values greater than 0.5 are preferred. Bootstrapped difference tests were additionally performed to evaluate the differences among edge weights (47).
2.4.4. Network comparison test
The Network Comparison Test (NCT) was conducted using the R-package NetworkComparisonTest (48). NCT assesses whether there is a statistically significant difference between networks in aspects of network structure (i.e., overall relations between variables), edge strength, and global strength (i.e., overall connectivity) (48). Since several edges were tested simultaneously, alpha values for multiple comparisons were adjusted using the Holm-Bonferroni correction.
3. Results
The descriptive statistics for the anxiety/depressive symptom measures as well as the pandemic-related variables are presented in Supplementary Table S2.
3.1. Network of South Korea
3.1.1. Network estimation
The MGM network for the Korean data is presented in Figure 1A. In this network, anxiety symptoms, depressive symptoms, and pandemic-related factors formed separate clusters with densely interconnected nodes. Within the pandemic-related cluster, the strongest associations were found between ‘Access to mental health service’ and ‘Access to medical service’ (r = 0.47). Within anxiety/depressive symptom clusters, two anxiety symptoms, ‘Uncontrollable worry (GAD-2)’ and ‘Excessive worry (GAD-3)’ (r = 0.42) showed the strongest association. Across clusters, there were direct edges between ‘COVID-19 stress’ and ‘Irritability (GAD-6)’ (r = 0.06) and ‘Negative future anticipation (GAD-7)’ (r = 0.08) as well as between ‘COVID-19 concerns’ and ‘Sleep (PHQ-3)’ (r = 0.08). Other pandemic factor such as healthcare accessibility did not show any direct relationship with anxiety and depressive symptoms.
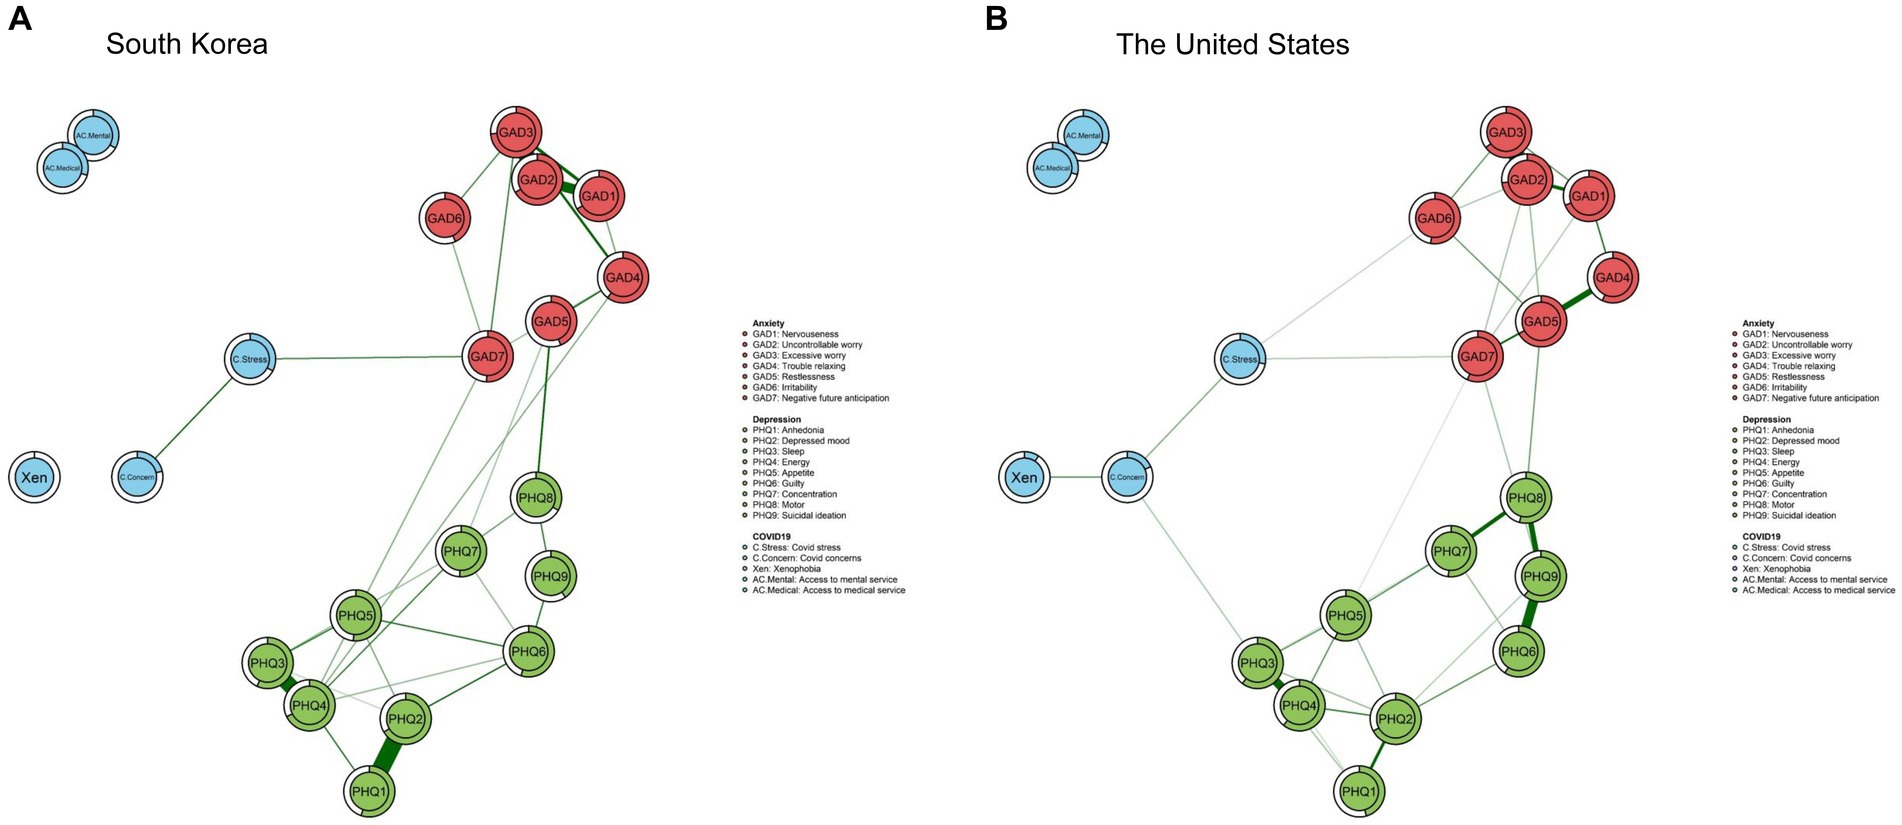
Figure 1. Estimated network of South Korea and the network of the United States. The predictability of each node by other nodes is represented by the rings surrounding each node.
3.1.2. Centrality and predictability
The result of bridge centrality index is shown in Figure 2A. The top bridging nodes which had high bridge centrality values in South Korea were ‘COVID-19 stress,’ ‘Negative future anticipation (GAD-7),’ ‘Restlessness (GAD-5),’ and ‘Motor (PHQ-8)’. As for strength centrality nodes, ‘Restlessness (GAD-5)’ and ‘Uncontrollable worry (GAD-2)’ in the anxiety clusters were identified as the most central nodes in the network of South Korea, followed by ‘Depressed mood (PHQ-2)’ (Figure 3). This indicates that these symptoms are the most influential in maintaining the whole network.
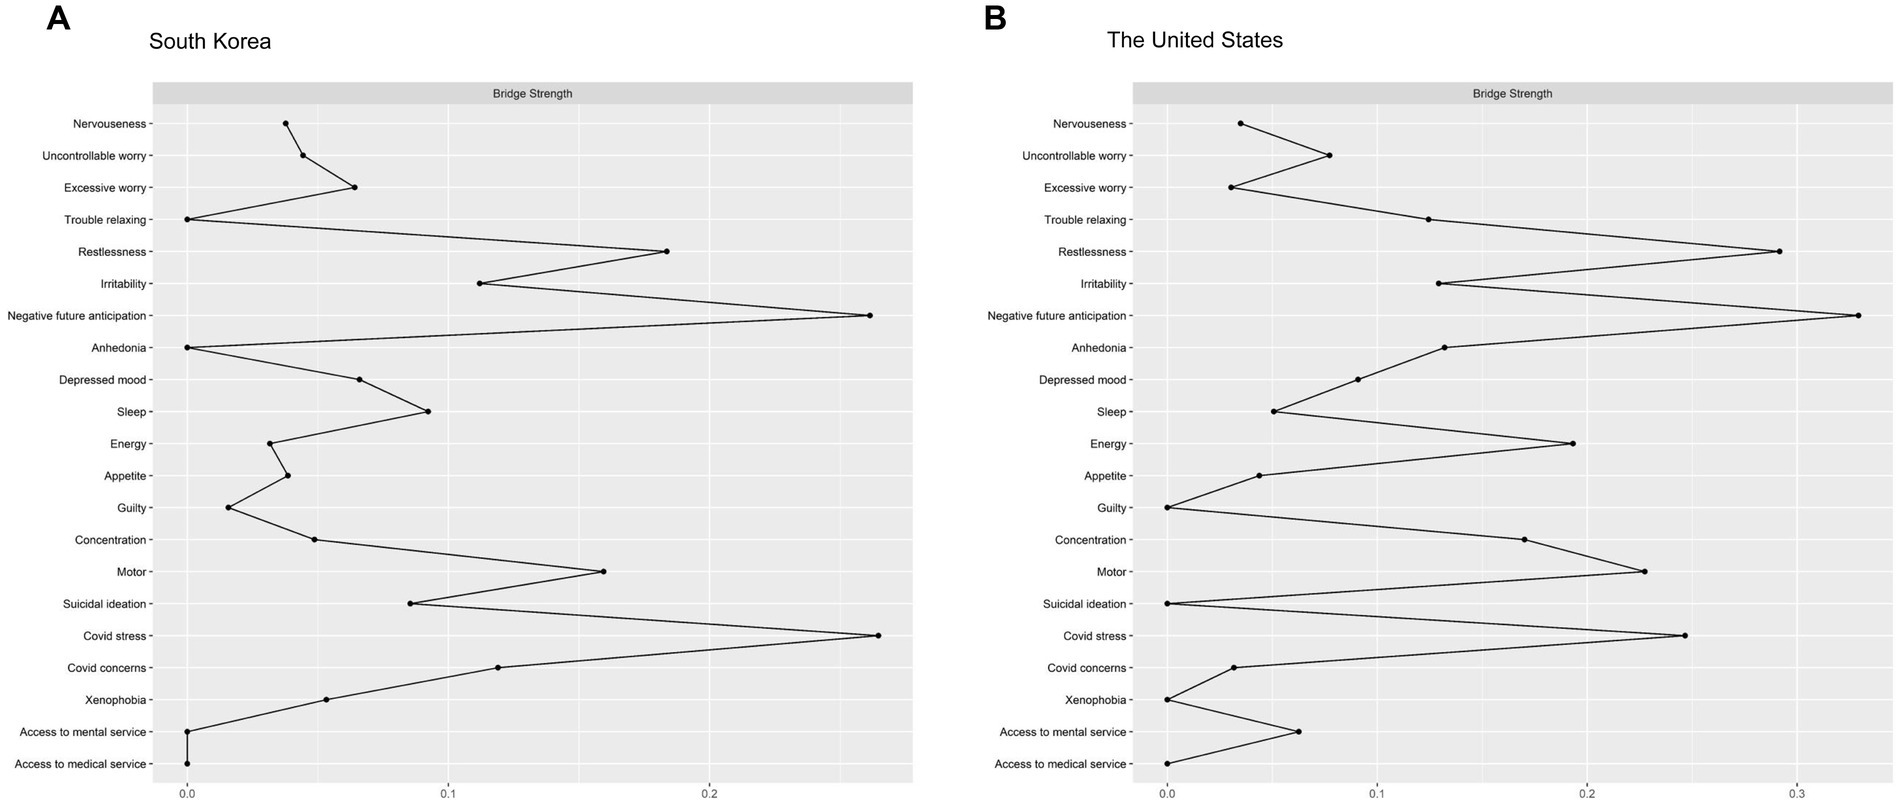
Figure 2. Bridge strength centrality estimates of both networks.
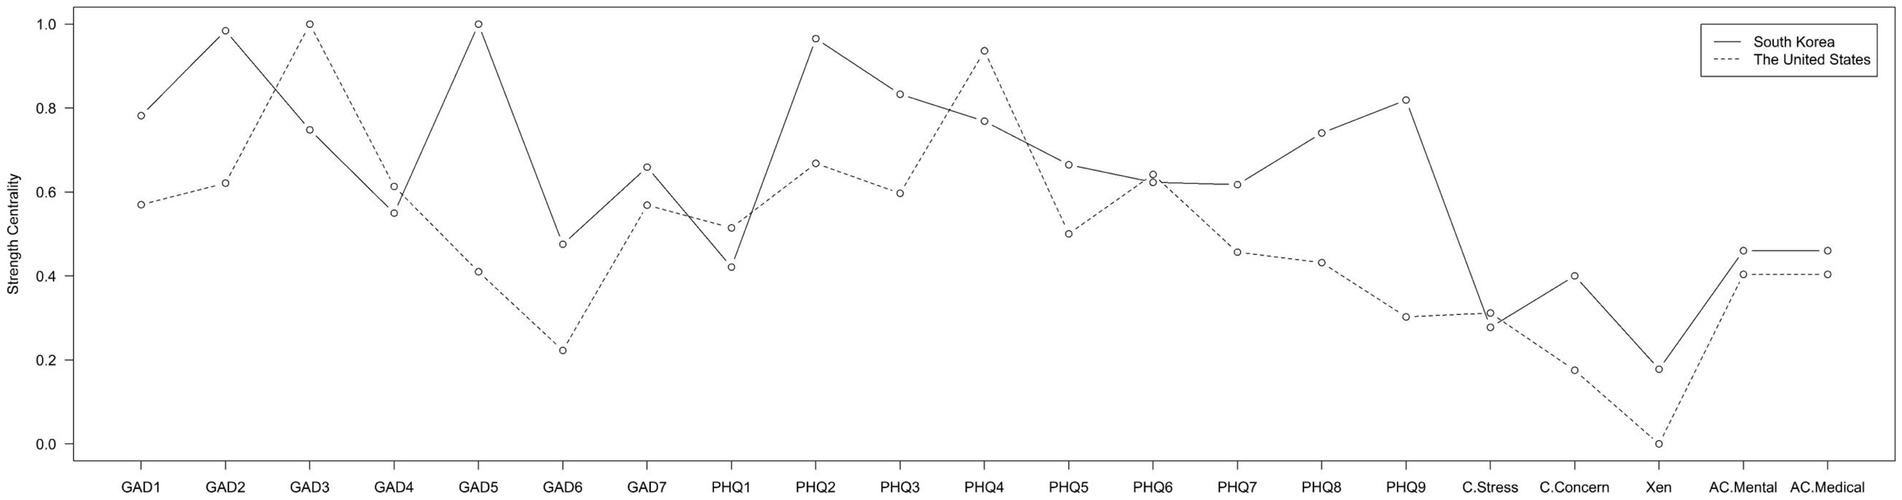
Figure 3. Strength centrality estimates of both networks.
Predictabilities are represented in the rings in the pie chart in Figure 1A. Predictability values ranged from 0.10 to 0.74 (Mean predictability = 0.51 ± 0.18), and the highest predictability value in the overall node was ‘Uncontrollable worry (GAD-2)’ (0.73), which is one of the anxiety symptoms. The lowest predictability index was ‘Xenophobia’ (0.09), which is a pandemic-related factor.
3.1.3. Network accuracy and stability
The results of the accuracy and stability analyses attest to the robustness of the network of South Korea (Supplementary Figures S1, S3, S5). Edge weights showed substantial overlap with the 95% CIs of edge weights, indicating that the edges were stable (Supplementary Figure S1). The bootstrapped difference tests also revealed that most of the comparisons among edge weights were statistically meaningful (Supplementary Figure S3). In addition, case-dropping bootstrap procedure showed that the strength and bridge strength coefficients were 0.75 and 0.36, respectively, which implies that results remained stable after dropping the different proportions of the sample (Supplementary Figure S5).
3.2. Network of the United States
3.2.1. Network estimation
The network structure for the U.S. data is presented in Figure 1B. Similar to South Korean data, there was a direct link between the ‘COVID-19 stress’ and ‘Negative future anticipation (GAD-7)’ (r = 0.15) but no direct association was found between the pandemic-related factors and depressive symptoms. The strongest association was exhibited in the edge between the two COVID-19-related factors, ‘Access to mental health service’ and ‘Access to medical service’ (r = 0.45),’ followed by the two anxiety symptoms ‘Uncontrollable worry (GAD-2)’ and ‘Excessive worry (GAD-3)’ (r = 0.39) and the two depressive symptoms ‘Anhedonia (PHQ-1)’ and ‘Depressed mood (PHQ-2)’ (r = 0.38).
3.2.2. Centrality and predictability
The bridge centrality result is shown in Figure 2B. Similar to South Korean data, symptoms showing the highest bridge centrality values included ‘Negative future anticipation (GAD-7),’ ‘Restlessness (GAD-5),’ ‘COVID-19 stress,’ and ‘Motor (PHQ-8)’, and indicated the high bridge strength value.
As shown in Figure 3, the highest strength centrality node was ‘Excessive worry (GAD-3)’ in the anxiety symptom cluster, followed by ‘Energy (PHQ-4)’ and ‘Depressed mood (PHQ-2)’ in the depressive symptom cluster. As for the predictability value, the node with the highest predictability score was ‘Excessive worry (GAD-3)’ (0.74), and the node with the lowest predictability was ‘Xenophobia’ (0) (Figure 1B).
3.2.3. Network accuracy and stability
In the network of the U.S., bootstrapped 95% CIs for edges validated the accuracy of the edge-weight estimates (Supplementary Figure S2). The bootstrapped difference test showed that a large proportion of the comparisons among edge weights were significant (Supplementary Figure S4). The CS-coefficient strength centrality and bridge strength was 0.67 and 0.36, respectively, demonstrating the stability of the network model (Supplementary Figure S6).
3.3. Estimating the effects of age and gender in network models
In the present study, significant differences were found between the South Korean and American samples in terms of age and gender. Prior to comparing the networks of the two countries, the impact of covariates on the pandemic-to-symptom networks were examined in both countries. Following previous studies (49–51), the pandemic-to-symptom networks of South Korea and the U.S. was re-estimated while controlling for age and gender. Significant correlations were found between the re-estimated network and the original one in both South Korea (r = 0.99, p < 0.001) (Supplementary Figure S7) and the U.S. (r = 0.98, p < 0.001) (Supplementary Figure S8). Both statistics and visual inspection of the models confirm that covariates did not have a significant impact on the overall network models in either country.
3.4. Network comparison
Finally, the NCT was applied to compare the networks identified in South Korea and the U.S. and revealed no significant differences in network structure (p = 0.15) or global strength (p = 0.36). This result shows that there is no meaningful difference in overall structure and connectivity between the networks of the two countries.
4. Discussion
Using a network approach, the present study investigated the putative pathways between pandemic-related factors and anxiety and depressive symptoms among young adults in South Korea and the U.S. In short, the overall structure of pandemic-to-symptom networks of South Korea and the U.S. were found to be similar. In both countries, anxiety symptoms, depressive symptoms, and pandemic-related factors formed separate clusters. Also, networks from both countries revealed similar common bridging nodes that linked different clusters, and central symptoms were found to be similar in both countries. The implications of the main findings are discussed below.
In both countries, ‘COVID-19 stress’ and ‘Negative future anticipation’ (an anxiety symptom) were identified as bridging nodes and had a direct edge between them, suggesting that this link is likely to function as a key mechanism through which the pandemic affects internalizing symptoms. The COVID-19 stress item measured traumatic stress reactions such as hypervigilance, intrusions, avoidance, or nightmares from issues related to the pandemic over the past month regardless of the presence of direct contact or exposure to the virus. Its strong connection with ‘Negative future anticipation’ suggests that stress induced by the fear of COVID-19 may extend its influence on mental health of young adults primarily by strengthening negative anticipation of the future. Studies have found that, compared to other age groups, young adults tend to experience high levels of pandemic-related stress due to the deprivation of educational/employment opportunities (52, 53). Similarly, with a sample of 18 to 35 years old, Dean et al. (22) found that younger age was a common contributing factor to psychological distress during the early stages of the pandemic across countries with different sociocultural backgrounds. Extending prior work, the present finding suggests that negative future anticipation function as a main trigger for psychological distress experienced by young adults during the pandemic.
It is also noteworthy that ‘Restlessness (GAD-5)’ and ‘Motor (PHQ-8)’ symptoms were identified as bridging symptoms between anxiety and depressive symptom clusters, suggesting that symptoms of physical agitation are strong contributors of the comorbidity between anxiety and depression. The current finding is consistent with prior work demonstrating that physical symptoms show strong bridge centrality indices among anxiety and depressive symptoms (54–56) and that ‘restlessness’ loads on the general distress factor shared in both anxiety and depression (57, 58). Recent studies suggest that physical symptoms observed in comorbid anxiety and depression are reflective of reduced parasympathetic activity for flexible adaptation to stress (59). Though more research is needed, it is possible that the physical symptoms reflect an underlying neurobiological mechanism associated with poor neurovisceral control and emotion regulation generally observed in anxiety and depression. This implicates that physical symptoms may be an important intervention target for comorbid cases of anxiety and depression (56).
Worry-related symptoms were identified as key contributors in maintaining the overall pandemic-to-symptom network in both countries. Specifically, the node ‘Uncontrollable worry (GAD-2)’ showed the highest strength centrality and predictability value in the network of South Korea while the node ‘Excessive worry (GAD-3)’ displayed the highest score in both indices in the network of the U.S. This replicates prior findings that worry-related symptoms were the core symptoms in anxiety-depression network of young adults during the pandemic (60, 61). Since COVID-19 has brought about unprecedented apprehension over future uncertainty, especially for young adults, it is possible that unregulated worrying cascades into a series of internalizing symptoms. Even if worry-related symptoms served as core symptoms in both countries, it is worth noting that the specific elements of worry-related symptoms that served as core symptoms differed between two countries – i.e., ‘excessive worry’ in the U.S. and ‘uncontrollable worry’ in South Korea. According to the initiation-termination (IT) model of worry, which suggests worry as a dynamic process that unfolds over time rather than a static entity (62), “excessive worry” may be more relevant to “proneness of worry initiation when threat is perceived” whereas “uncontrollable worry” is more related to “difficulty in terminating worry.” This suggests that each worry symptom may differ in underlying mechanisms. More research is warranted to investigate this possibility further.
To the best of our knowledge, this is the first comparative network analysis study of the relationship between symptoms of anxiety, depression and factors related to COVID-19 in South Korea and the U.S. The current findings suggest that potential political and societal differences in the two countries (e.g., access to mental/medical health services) was not critically involved in the relationship between the pandemic and internalizing symptoms. Instead, the similar network structures and patterns observed in both countries imply that there may exist a stable relationship between the pandemic and internalizing symptoms above and beyond the sociocultural differences. The current findings suggest that interventions mainly targeting key bridge symptoms (i.e., COVID-19 related stress, negative future anticipation) and worry-related symptoms would most effectively alleviate the impact of the broader internalizing symptom networks during the pandemic in both countries. For instance, treatment elements of cognitive behavioral therapy (CBT) such as exposure-based interventions targeting fear or traumatic symptoms, or cognitive restructuring targeting pathological worry would be helpful to reduce overall comorbidity (63).
The present findings need to be interpreted with the following caveats in mind. Firstly, although Van Borkulo et al. (48) validated NCT results with cases where the sample size of one group was twice as large than the other, the null NCT result should be interpreted cautiously due to the disparity in the number of participants between the two countries. Replication studies are warranted with similar sample sizes in both countries. Secondly, though the null NCT result revealed that there is no statistically meaningful difference in the pandemic-to-symptom networks of the two countries, the difference identified from visual inspection of the networks is worth noting. Under visual inspection, the relationship between COVID-19 concerns and depressive symptoms (i.e., ‘Sleep’) was observed only in South Korea’s network but not in the U.S. data. The disparity between the two results (visual inspection vs. statistical testing) might stem from the methodological difference in network estimation between the Network Comparison Test and Mixed Graphical Model (64). Further studies are needed to address this point since these edges may imply a potential difference between the two networks, even though they were not detected through the statistical comparison test in the current study. Thirdly, in our study, COVID-19 stress was represented as a single score averaging each item for individual pandemic-related trauma symptoms (i.e., proportion of positive symptoms) due to a high number of missing values in the individual items. However, as each item represents slightly different symptoms related to the trauma experience, it will be important for future studies to further investigate the impact of each item separately. Fourthly, the current study did not directly measure contextual factors (e.g., political/cultural factors) that may have influenced the pandemic-to-symptom networks in the two countries. Future studies are warranted to include various contextual factors to gauge their direct impact on the overall networks of the two countries. Lastly, although this study revealed the connection between pandemic-related factors and anxiety and depressive symptoms, it does not confirm any causal relationship since the study was based on a cross-sectional design. Although the results provide evidence of a potentially causal structure, longitudinal studies are called for to investigate whether a clear directionality of influence exists among the anxiety, depressive symptoms, and COVID-19-related factors.
Taken together, the current findings provide new insights into the common potential pathway between the pandemic and internalizing symptoms in South Korea and in the U.S. These observations provide a framework for understanding the impact of economic and/or social upheavals, including but not limited to COVID-19, on mental well-being of young adults and inform policymakers and mental health professionals of potential intervention targets to alleviate internalizing symptoms of this population.
Data availability statement
The datasets presented in this study can be found at https://osf.io/cs6zm/. Requests to access these datasets should be directed to the corresponding author.
Ethics statement
The studies involving human participants were reviewed and approved by Institutional Review Board of Yonsei University (South Korea) and Columbia University (U.S.). The patients/participants provided their written informed consent to participate in this study.
Author contributions
MP and JH designed the study and analytic strategy. JK, HY, GL, LM, LA, and SP collected data. JK cleaned and preprocessed the data. MP performed analyses and created figures and tables. MP and DS drafted the manuscript. JH provided supervision. JH, YK, SH, HY, SP, LM, and LA obtained funding that supported the work. All authors edited the manuscript and approved the final version.
Funding
This work was supported by the Yonsei Signature Research Cluster Program (Grant No. 2021-22-0005) and the National Research Foundation of Korea (Grants Nos. 2021R1F1A106338512 and 2021S1A5A2A0307022912) in South Korea. The U.S. research was funded by the National Institute on Drug Abuse (NIDA; North Bethesda, MD) grants R01DA038154 (PI: CW Hoven) and R01DA038154-05S2 (PIs: CW Hoven and LM).
Conflict of interest
The authors declare that the research was conducted in the absence of any commercial or financial relationships that could be construed as a potential conflict of interest.
Publisher’s note
All claims expressed in this article are solely those of the authors and do not necessarily represent those of their affiliated organizations, or those of the publisher, the editors and the reviewers. Any product that may be evaluated in this article, or claim that may be made by its manufacturer, is not guaranteed or endorsed by the publisher.
Supplementary material
The Supplementary material for this article can be found online at: https://www.frontiersin.org/articles/10.3389/fpsyt.2023.1161200/full#supplementary-material
Footnotes
1. ^During the data collection period, the pandemic in the US was at its peak with a maximum of 1,667,151 infected cases and 23,212 death cases per week. On the other hand, the trend in the number of confirmed cases and death in South Korea was still increasing (with a maximum of 13,034 infected cases and 64 death cases per week) at the time of data collection.
References
1. Chakraborty, I, and Maity, P. COVID-19 outbreak: migration, effects on society, global environment and prevention. Sci Total Environ. (2020) 728:138882. doi: 10.1016/j.scitotenv.2020.138882
2. WHO. (2021). World Health Organization coronavirus (COVID-19) dashboard. https://covid19whoint/ (Accessed June 24, 2021)
3. Brooks, SK, Webster, RK, Smith, LE, Woodland, L, Wessely, S, Greenberg, N, et al. The psychological impact of quarantine and how to reduce it: rapid review of the evidence. The lancet. (2020) 395:912–20.
4. Cao, W, Fang, Z, Hou, G, Han, M, Xu, X, Dong, J, et al. The psychological impact of the COVID-19 epidemic on college students in China. Psychiatry Res. (2020) 287:112934. doi: 10.1016/j.psychres.2020.112934
5. Wang, C, Pan, R, Wan, X, Tan, Y, Xu, L, Ho, CS, et al. Immediate psychological responses and associated factors during the initial stage of the 2019 coronavirus disease (COVID-19) epidemic among the general population in China. Int J Environ Res Public Health. (2020) 17:1729. doi: 10.3390/ijerph17051729
6. Alzueta, E, Perrin, P, Baker, FC, Caffarra, S, Ramos‐Usuga, D, Yuksel, D, et al. How the COVID‐19 pandemic has changed our lives: A study of psychological correlates across 59 countries. J Clin Psychol. (2021) 77:556–70.
7. OECD. Supporting young People's mental health through the COVID-19. Crisis: OECD Publishing (2021).
8. Beesdo, K, Pine, DS, Lieb, R, and Wittchen, HU. Incidence and risk patterns of anxiety and depressive disorders and categorization of generalized anxiety disorder. Archives Gen Psychiatry (2010) 67:47–57.
9. Kessler, RC, Berglund, P, Demler, O, Jin, R, Merikangas, KR, and Walters, EE. Lifetime prevalence and age-of-onset distributions of DSM-IV disorders in the National Comorbidity Survey Replication. Archives Gen Psychiatry (2005) 62:593–602.
10. Benke, C, Autenrieth, LK, Asselmann, E, and Pané-Farré, CA. Stay-at-home orders due to the COVID-19 pandemic are associated with elevated depression and anxiety in younger, but not older adults: results from a Nationwide Community sample of adults from Germany. Psychol Med. (2022) 52:3739–40. doi: 10.1017/S0033291720003438
11. Debowska, A, Horeczy, B, Boduszek, D, and Dolinski, D. A repeated cross-sectional survey assessing university Students' stress, depression, anxiety, and suicidality in the early stages of the COVID-19 pandemic in Poland. Psychol Med. (2022) 52:3744–7. doi: 10.1017/S003329172000392X
12. Golemis, A, Voitsidis, P, Parlapani, E, Nikopoulou, VA, Tsipropoulou, V, Karamouzi, P, et al. Young adults’ coping strategies against loneliness during the COVID-19-related quarantine in Greece. Health Promot Int. (2022) 37:daab053. doi: 10.1093/heapro/daab053
13. Zhu, K, Niu, Z, Freudenheim, JL, Zhang, Z-F, Lei, L, Homish, GG, et al. COVID-19 related symptoms of anxiety, depression, and PTSD among us adults. Psychiatry Res. (2021) 301:113959. doi: 10.1016/j.psychres.2021.113959
14. Chen, H, Shi, L, Zhang, Y, Wang, X, Jiao, J, Yang, M, et al. Response to the COVID-19 pandemic: comparison of strategies in six countries. Front Public Health. (2021) 9:708496. doi: 10.3389/fpubh.2021.708496
15. Dighe, A, Cattarino, L, Cuomo-Dannenburg, G, Skarp, J, Imai, N, Bhatia, S, et al. Response to COVID-19 in South Korea and implications for lifting stringent interventions. BMC Med. (2020) 18:1–12. doi: 10.1186/s12916-020-01791-8
16. Park, O, Park, Y, Park, S, Kim, Y, Kim, J, Lee, J, et al. Contact transmission of COVID-19 in South Korea: novel investigation techniques for tracing contacts. Osong Public Health Res Perspect. (2020) 11:60–3. doi: 10.24171/j.phrp.2020.11.1.09
17. Zhang, X, and Wang, Y. Comparison between two types of control strategies for the coronavirus disease 2019 pandemic. J Infect Dev Countries. (2020) 14:696–8. doi: 10.3855/jidc.12899
18. Dave, D, Friedson, AI, Matsuzawa, K, and Sabia, JJ. When do shelter-in-place orders fight COVID-19 best? Policy heterogeneity across states and adoption time. Econ Inq. (2021) 59:29–52. doi: 10.1111/ecin.12944
19. Germani, A, Buratta, L, Delvecchio, E, and Mazzeschi, C. Emerging adults and COVID-19: the role of individualism-collectivism on perceived risks and psychological maladjustment. Int J Environ Res Public Health. (2020) 17:3497. doi: 10.3390/ijerph17103497
20. Gu, J, Song, J, Wang, J, Liu, T, Zhan, J, Yan, W, et al. Stigmatization related COVID-19 and Ptsd among Chinese graduates. BMC Psychiatry. (2022) 22:439. doi: 10.1186/s12888-022-04073-0
21. Jung, G, Lee, H, Kim, A, and Lee, U. Too much information: assessing privacy risks of contact trace data disclosure on people with COVID-19 in South Korea. Front Public Health. (2020) 8:305. doi: 10.3389/fpubh.2020.00305
22. Dean, DJ, Tso, IF, Giersch, A, Lee, H-S, Baxter, T, Griffith, T, et al. Cross-cultural comparisons of psychosocial distress in the USA, South Korea, France, and Hong Kong during the initial phase of COVID-19. Psychiatry Res. (2021) 295:113593. doi: 10.1016/j.psychres.2020.113593
23. Borsboom, D, and Cramer, AO. Network analysis: an integrative approach to the structure of psychopathology. Annu Rev Clin Psychol. (2013) 9:91–121. doi: 10.1146/annurev-clinpsy-050212-185608
24. McNally, RJ. Network analysis of psychopathology: controversies and challenges. Annu Rev Clin Psychol. (2021) 17:31–53. doi: 10.1146/annurev-clinpsy-081219-092850
25. Cramer, AO, Waldorp, LJ, Van Der Maas, HL, and Borsboom, D. Comorbidity: a network perspective. Behav Brain Sci. (2010) 33:137–50. doi: 10.1017/S0140525X09991567
26. Gomez, R, Stavropoulos, V, Tullett-Prado, D, Schivinski, B, and Chen, W. Network analyses of internet gaming disorder symptoms and their links with different types of motivation. MC Psychiatry (2022) 22:76.
27. Gonçalves, AP, Zuanazzi, AC, Salvador, AP, Jaloto, A, Pianowski, G, and Carvalho, LDF. Preliminary findings on the associations between mental health indicators and social isolation during the COVID-19 pandemic. Arch Psychiatry Psychother. (2020) 22:10–9. doi: 10.12740/APP/122576
28. Hoffart, A, Johnson, SU, and Ebrahimi, OV. The network of stress-related states and depression and anxiety symptoms during the COVID-19 lockdown. J Affect Disord. (2021) 294:671–8. doi: 10.1016/j.jad.2021.07.019
29. Owczarek, M, Nolan, E, Shevlin, M, Butter, S, Karatzias, T, McBride, O, et al. How is loneliness related to anxiety and depression: a population-based network analysis in the early lockdown period. Int J Psychol. (2023) 57:585–96. doi: 10.1002/ijop.12851
30. Ventura-León, J, López-Jurado, R, Porturas, E, León-Mostacero, I, and Canchanya-Balbin, SE. Anxiety, depression, stress, worry about COVID-19 and fear of loneliness during COVID-19 lockdown in Peru: a network analysis approach. Front Public Health. (2022) 10:10. doi: 10.3389/fpubh.2022.946697
31. Zavlis, O, Butter, S, Bennett, K, Hartman, TK, and Hyland, P. Mason L how does the COVID-19 pandemic impact on population mental health? A network analysis of COVID influences on depression, anxiety and traumatic stress in the UK population. Psychol Med. (2022) 52:3825–33. doi: 10.1017/S0033291721000635
32. Spitzer, RL, Kroenke, K, Williams, JB, and Löwe, B. A brief measure for assessing generalized anxiety disorder: the gad-7. Arch Intern Med. (2006) 166:1092–7. doi: 10.1001/archinte.166.10.1092
33. Kroenke, K, Spitzer, RL, and Williams, JB. The Phq-9: validity of a brief depression severity measure. J Gen Intern Med. (2001) 16:606–13. doi: 10.1046/j.1525-1497.2001.016009606.x
34. Van Buuren, S, and Groothuis-Oudshoorn, K. Mice: multivariate imputation by chained equations in R. J Stat Softw. (2011) 45:1–67. doi: 10.18637/jss.v045.i03
35. Epskamp, S, Cramer, AO, Waldorp, LJ, Schmittmann, VD, and Borsboom, D. Qgraph: network visualizations of relationships in psychometric data. J Stat Softw. (2012) 48:1–18. doi: 10.18637/jss.v048.i04
36. Borsboom, D, Deserno, MK, Rhemtulla, M, Epskamp, S, Fried, EI, McNally, RJ, et al. Network analysis of multivariate data in psychological science. Nat Rev Methods Primers. (2021) 1:58. doi: 10.1038/s43586-021-00055-w
37. Haslbeck, J, and Waldorp, LJ. Mgm: estimating time-varying mixed graphical models in high-dimensional data. J Statistical Soft. (2020) 93:1–46. doi: 10.18637/jss.v093.i08
38. Sedgewick, AJ, Shi, I, Donovan, RM, and Benos, PV. Learning mixed graphical models with separate sparsity parameters and stability-based model selection. BMC Bioinformatics. (2016) 17:307–18. doi: 10.1186/s12859-016-1039-0
39. Tibshirani, R. Regression shrinkage and selection via the Lasso. J Royal Stat Soc Series B. (1996) 58:267–88. doi: 10.1111/j.2517-6161.1996.tb02080.x
40. Epskamp, S, and Fried, EI. A tutorial on regularized partial correlation networks. Psychol Methods. (2018) 23:617–34. doi: 10.1037/met0000167
41. Foygel, R, and Drton, M. Extended Bayesian information criteria for Gaussian graphical models. Advan Neural Informat Processing Sys. (2010):23.
42. Jones, PJ, Ma, R, and McNally, RJ. Bridge centrality: a network approach to understanding comorbidity. Multivar Behav Res. (2021) 56:353–67. doi: 10.1080/00273171.2019.1614898
43. Jones, P. Networktools: tools for identifying important nodes in networks. R package version. (2017) 1:10–1155.
44. Jones, PJ, Mair, P, and McNally, RJ. Visualizing psychological networks: a tutorial in R. Front Psychol. (2018) 9:1742. doi: 10.3389/fpsyg.2018.01742
45. Haslbeck, JM, and Fried, EI. How predictable are symptoms in psychopathological networks? A reanalysis of 18 published datasets. Psychol Med. (2017) 47:2767–76. doi: 10.1017/S0033291717001258
46. Liu, X, Wang, H, Zhu, Z, Zhang, L, Cao, J, Zhang, L, et al. Exploring bridge symptoms in HIV-positive people with comorbid depressive and anxiety disorders. BMC Psychiatry. (2022) 22:448. doi: 10.1186/s12888-022-04088-7
47. Epskamp, S, Borsboom, D, and Fried, EI. Estimating psychological networks and their accuracy: a tutorial paper. Behav Res Methods. (2018) 50:195–212. doi: 10.3758/s13428-017-0862-1
48. Van Borkulo, CD, van Bork, R, Boschloo, L, Kossakowski, JJ, Tio, P, Schoevers, RA, et al. Comparing network structures on three aspects: A permutation test. Psychol Methods. (2022), (Online ahead of print). doi: 10.1037/met0000476
49. Dalege, J, Borsboom, D, Van Harreveld, F, and Van Der Maas, HL. Network analysis on attitudes: a brief tutorial. Soc Psychol Personal Sci. (2017) 8:528–37. doi: 10.1177/1948550617709827
50. Jin, Y, Sha, S, Tian, T, Wang, Q, Liang, S, Wang, Z, et al. Network analysis of comorbid depression and anxiety and their associations with quality of life among clinicians in public hospitals during the late stage of the COVID-19 pandemic in China. J Affect Disord. (2022) 314:193–200. doi: 10.1016/j.jad.2022.06.051
51. Marchetti, I. Hopelessness: a network analysis. Cogn Ther Res. (2019) 43:611–9. doi: 10.1007/s10608-018-9981-y
52. Jardon, C, and Choi, KR. COVID-19 experiences and mental health among graduate and undergraduate nursing students in Los Angeles. J Am Psychiatric Nurses Assoc. (2022):10783903211072222.
53. Qiu, J, Shen, B, Zhao, M, Wang, Z, Xie, B, and Xu, Y. A Nationwide survey of psychological distress among Chinese people in the COVID-19 epidemic: implications and policy recommendations. General Psychiatry. (2020) 33:e100213. doi: 10.1136/gpsych-2020-100213
54. Bai, W, Zhao, Y-J, Cai, H, Sha, S, Zhang, Q, Lei, S-M, et al. Network analysis of depression, anxiety, insomnia and quality of life among Macau residents during the COVID-19 pandemic. J Affect Disord. (2022) 311:181–8. doi: 10.1016/j.jad.2022.05.061
55. Beard, C, Millner, AJ, Forgeard, MJ, Fried, EI, Hsu, KJ, Treadway, MT, et al. Network analysis of depression and anxiety symptom relationships in a psychiatric sample. Psychol Med. (2016) 46:3359–69. doi: 10.1017/S0033291716002300
56. Kaiser, T, Herzog, P, Voderholzer, U, and Brakemeier, EL. Unraveling the comorbidity of depression and anxiety in a large inpatient sample: network analysis to examine bridge symptoms. Depress Anxiety. (2021) 38:307–17. doi: 10.1002/da.23136
57. Garabiles, MR, Lao, CK, Xiong, Y, and Hall, BJ. Exploring comorbidity between anxiety and depression among migrant Filipino domestic workers: a network approach. J Affect Disord. (2019) 250:85–93. doi: 10.1016/j.jad.2019.02.062
58. Watson, D, Clark, LA, Weber, K, Assenheimer, JS, Strauss, ME, and McCormick, RA. Testing a tripartite model: ii. Exploring the symptom structure of anxiety and depression in student, adult, and patient samples. J Abnorm Psychol. (1995) 104:15–25. doi: 10.1037/0021-843X.104.1.15
59. Smith, R, Thayer, JF, Khalsa, SS, and Lane, RD. The hierarchical basis of Neurovisceral integration. Neurosci Biobehav Rev. (2017) 75:274–96. doi: 10.1016/j.neubiorev.2017.02.003
60. Cai, H, Bai, W, Liu, H, Chen, X, Qi, H, Liu, R, et al. Network analysis of depressive and anxiety symptoms in adolescents during the later stage of the COVID-19 pandemic. Transl Psychiatry. (2022) 12:98. doi: 10.1038/s41398-022-01838-9
61. Tao, Y, Hou, W, Niu, H, Ma, Z, Zhang, S, Zhang, L, et al. Centrality and bridge symptoms of anxiety, depression, and sleep disturbance among college students during the COVID-19 pandemic—a network analysis. Curr Psychol. (2022) 41:1–12. doi: 10.1007/s12144-022-03443-x
62. Berenbaum, H. An initiation–termination two-phase model of worrying. Clin Psychol Rev. (2010) 30:962–75. doi: 10.1016/j.cpr.2010.06.011
63. Kaczkurkin, AN, and Foa, EB. Cognitive-behavioral therapy for anxiety disorders: an update on the empirical evidence. Dialogues Clin Neurosci. (2022) 17:337–46. doi: 10.31887/DCNS.2015.17.3/akaczkurkin
Keywords: COVID-19 pandemic, anxiety, depression, network analysis, cross-country study
Citation: Park M, Seo D, Kim JG, Lee G, McReynolds LS, Amsel L, Yang H, Kim Y-H, Han S, Park SH and Hur J (2023) Identification and comparison of pandemic-to-symptom networks of South Korea and the United States. Front. Psychiatry 14:1161200. doi: 10.3389/fpsyt.2023.1161200
Edited by:
Renato de Filippis, Magna Græcia University, ItalyReviewed by:
AndréLuiz De Carvalho Braule Pinto, Federal University of Minas Gerais, BrazilJingchu Hu, Shenzhen KangNing Hospital, China
Copyright © 2023 Park, Seo, Kim, Lee, McReynolds, Amsel, Yang, Kim, Han, Park and Hur. This is an open-access article distributed under the terms of the Creative Commons Attribution License (CC BY). The use, distribution or reproduction in other forums is permitted, provided the original author(s) and the copyright owner(s) are credited and that the original publication in this journal is cited, in accordance with accepted academic practice. No use, distribution or reproduction is permitted which does not comply with these terms.
*Correspondence: Juyoen Hur, amh1cjFAeW9uc2VpLmFjLmty