 Wen-Qiong Wei1†
 Yi Li
Yi Li Xin-Wen Liu
94% of researchers rate our articles as excellent or good
Learn more about the work of our research integrity team to safeguard the quality of each article we publish.
Find out more
ORIGINAL RESEARCH article
Front. Psychiatry, 26 August 2022
Sec. ADHD
Volume 13 - 2022 | https://doi.org/10.3389/fpsyt.2022.999007
This article is part of the Research TopicUnderstanding of brain cellular dysfunction in psychiatric disorders-relevant phenotypes: from humans to modelsView all 5 articles
Background: Genome-wide association studies (GWASs) have identified numerous genetic variants associated with attention-deficit/hyperactivity disorder (ADHD), which is considered highly genetically heritable. However, because most of the variants located in the non-coding region of the human genome, the onset of ADHD requires further exploration.
Methods: The risk genes involved in ADHD were identified by integrating GWAS summary data and expression quantitative trait locus (eQTL) data using summary-data-based Mendelian randomization (SMR) method. We then used a stratified linkage disequilibrium score regression (LDSR) method to estimate the contribution of ADHD-relevant tissues to its heritability to screen out disease-relevant tissues. To determine the ADHD-relevant cell types, we used an R package for expression-weighted cell type enrichment (EWCE) analysis.
Results: By integrating the brain eQTL data and ADHD GWAS data using SMR, we identified 247 genes associated with ADHD. The LDSR applied to specifically expressed genes results showed that the ADHD risk genes were mainly enriched in brain tissue, especially in the mesencephalon, visual cortex, and frontal lobe regions. Further cell-type-specific analysis suggested that ADHD risk genes were highly expressed in excitatory neurons.
Conclusion: The study showed that the etiology of ADHD is associated with excitatory neurons in the midbrain, visual cortex, and frontal lobe regions.
Attention-deficit/hyperactivity disorder (ADHD) is a commonly diagnosed neurodevelopmental disorder which is usually characterized by inattention, impulsivity, and hyperactivity. It has been reported that approximately 5% of children and 2.5% of adults in worldwide population were affected by ADHD (1). Moreover, a large proportion of ADHD patients also have other comorbid psychiatric disorders, such as anxiety, emotional, and educational disorders. Research has shown that ADHD patients have a high risk of educational and occupational failure, accidents, criminality, social disability, divorce, suicide, and premature death (2).
Currently, ADHD is diagnosed in clinics using the DSM-5 or ICD10. Furthermore, clinical therapeutics for ADHD usually require long-term care, and the recurrence of symptoms is common (1). Therefore, determining the etiology of ADHD is crucial to improving clinical diagnoses and treatments for ADHD.
Accumulating epidemiological and clinical evidence has shown that ADHD is affected by both genetic and environmental factors. Genetic studies of identical twins have reported that the heritability of ADHD is approximately 0.76 (3–5), which indicates that genetic factors are primarily responsible for the onset of ADHD. However, ADHD has also been demonstrated to undergo polygenic transmission and be a complex neurodevelopmental disorder that can be affected by both common and rare variants (2). Numerous genome-wide association studies (GWAS) have identified multiple single nucleotide polymorphisms (SNPs) related to ADHD susceptibility (6, 7). Intriguingly, most of these genetic loci are positioned in the non-coding region of the human genome. Furthermore, because SNPs likely influence complex traits in a tissue- and cell-type-specific manner, further explorations of the relevant biological mechanisms of SNPs may become even more complicated (8).
Extensive research has shown that trait-associated SNPs in non-coding regions regulate the expression of genes to further their involvement in ADHD etiology (9–11). Based on these studies, we applied summary-data-based Mendelian randomization (SMR) to the analysis of integrating GWAS and expression quantitative trait locus (eQTL) data to identify the risk genes of ADHD. Additionally, we used the stratified linkage disequilibrium score regression (LDSR) method (12), also known as LDSC, to estimate the contribution of various tissues to the heritability of ADHD and identify ADHD-relevant tissues. Finally, an R package for expression-weighted cell type enrichment (EWCE) analysis (13) was used to perform cell-type enrichment analysis to identify ADHD-relevant cell types.
Attention-deficit/hyperactivity disorder genome-wide association study data were obtained from the meta-analysis by Demontis et al. (6), which included 20,183 ADHD cases and 35,191 controls from 12 cohorts. The samples were mainly from European populations. After quality control, 8,047,421 SNPs were remained for final meta-analyze. In total, 304 genetic variants in 12 genomic loci were shown to be significantly related to ADHD (P < 5 × 10⁻⁸). The GWAS summary statistics data are available for download from the Psychiatric Genomics Consortium website (https://www.med.unc.edu/pgc/results-and-downloads).
We applied SMR to integrate ADHD GWAS data and eQTL data to identify the ADHD risk genes. In the SMR analysis, ADHD-relevant SNPs were used as instrumental variables (IVs) to test the causal effect of the exposure (gene expression) on the outcome (ADHD) (14). Detailed information about the theoretical principle, model hypothesis, and algorithm implementation of SMR is available in the original publication (14). BrainMeta v2 cis-eQTL summary data were obtained from the SMR website (https://yanglab.westlake.edu.cn/software/smr/#DataResource), which contained cis-eQTL information using RNA-seq expression and genotype data of 2,865 brain cortex samples from 2,443 unrelated European individuals. Qi et al. (15) meta-analyzed the brain frontal cortex data from GTEx (16), CMC (17), and ROSMAP (18). This dataset only contained cis-eQTL summary statistics for 16,704 genes and about 11.6 million SNPs with minor allele frequency larger than 0.01. We also downloaded the eQTL data (16) from 13 GTEx (v7) brain tissues for different brain region SMR analysis. The GTEx project aims to characterize variation on gene expression levels across different human tissues. The v7 release of GTEx contains a total of 11,688 samples, mainly European ancestry, from 53 tissues of 714 donors within an age range from 20 to 79 years. For SMR analysis, we used the default parameters, and to decrease the false positive rate, PSMR < 0.01 was set as the significant level. To further test the heterogeneity of the IVs, we performed heterogeneity in dependent instruments (HEIDI) to filter out results with PHEIDI < 0.01.
All risk genes were uploaded to the Synapse Gene Ontology (SynGO) website (https://syngoportal.org/) (19) for further annotation. The SynGO cellular component terms are displayed in the sunburst plot.
The LDSC applied to specifically expressed genes (LDSC-SEG) method was used to identify disease-relevant tissues using gene expression data from different tissues and GWAS summary statistics (12). For each gene, the t-statistics was first calculated for the specific expression in the target tissue during the LDSC-SEG analysis. The genes were then arranged in descending order according to the t-statistics, and those within the top 10% were defined as the tissue-specific gene set. As an additional step, a 100 kb window was added to both sides of the transcription region of the genes in the tissue-specific gene set to construct tissue-specific genome annotations. The LDSC-SEG analysis was then applied to the different annotated groups to estimate the contribution of various tissues or cells to the target phenotypic heritability. Detailed information about the theoretical principle, model hypothesis, and algorithm implementation of the LDSC-SEG analysis is provided in the original publication (12). We downloaded the microarray-based gene expression data of various tissues and cell types from Franke's lab, which contained 152 tissues or cell types originating from 37,427 human samples for about 3,404 genes (https://alkesgroup.broadinstitute.org/LDSCORE/LDSC_SEG_ldscores) (20, 21). All datasets were processed using ldsc.py (version 1.0.1) with default parameters. For the outcomes, PLDSC−SEG < 0.05 was considered significant.
Single-cell transcriptome expression data are used to generate a probability distribution genes list containing the average expression in a cell of interest. The gene expression level is then estimated using the target gene set to check whether it is higher than that of randomly chosen genes in the cell of interest (13). We used data of single-cell gene expressions of human neocortical development during mid-gestation from Polioudakis et al. and Trevino et al. (22, 23). Polioudakis et al. obtained approximately 40,000 cortical single-cell expression data from four donors at mid-gestation week 17–18 using Drop-seq. Using dimension reduction analysis and cell-type mapping, they screened out 16 transcriptionally distinct cell types, including excitatory neurons, inhibitory neurons, interneurons, and microglia (22). Trevino et al. created a gene expression atlas using 10× genomics from four primary samples at post-conception weeks 16, 20, 21, and 24. Overall, they obtained 57,868 single-cell transcriptomes and divided these cells into 23 clusters (23). Using these two datasets, combined with the risk gene sets retrieved from the SMR analysis, we were able to identify ADHD associated tissues using risk genes from SMR analysis. Details about the EWCE principle are provided in the original publication (13). The data analysis procedure is also described at https://github.com/NathanSkene/EWCE/. PEWCE < 0.05 was considered as significant.
The SMR analysis identified 247 and 129 risk genes for ADHD using BrainMeta v2 eQTL data and 13 GTEx brain tissues data, respectively (Figure 1 and Supplementary Tables S1, S2). In total, 336 genes were identified to be associated with ADHD. Intriguingly, multiple risk genes were related to neurodevelopment. These genes included CAMK1D, a member of the calcium/calmodulin-dependent protein kinase 1 family that is responsible for the growth of hippocampal neurons dendrites; KCTD16, a subunit of the gamma-aminobutyric acid-B receptor, which is involved in the excitability of dendrites; and CTNNB1 alongside the transcription factor LEF1/TCF, which promote the expression of genes responsible for developmental processes, such as neurogenesis and synaptic plasticity (24). Moreover, the result of the SynGO annotations showed that 16 genes were involved in the formation of synapses (Figure 2).
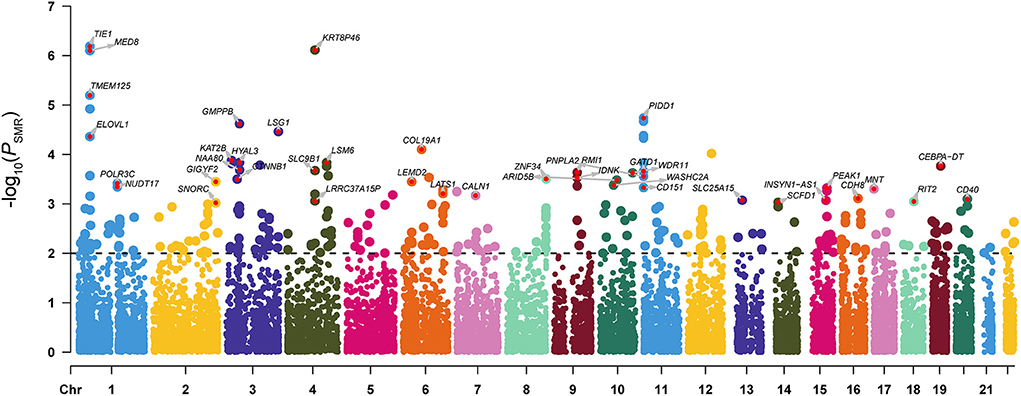
Figure 1. Manhattan plot of the SMR analysis integrating ADHD GWAS data with the BrainMeta eQTL data. P-value indicates the statistical significance of the SMR analysis results. The dotted line represented the SMR significant threshold (PSMR < 0.01). For genes with PSMR < 0.001 and PHEIDI > 0.01, we also marked the gene names in the figure.
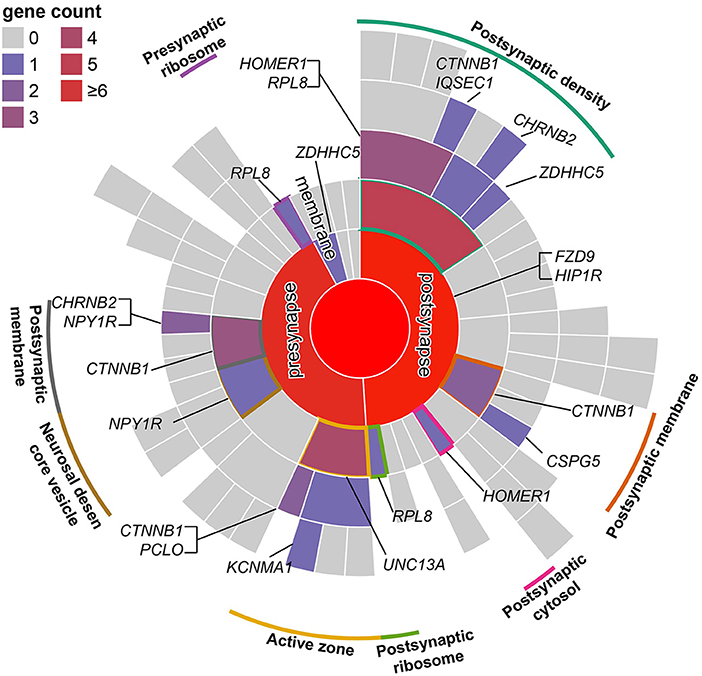
Figure 2. Mapping of SMR risk genes to synaptic locations using SynGO. According to the location of genes in the synapse, genes were divided into presynaptic, postsynaptic, synaptic cleft, synaptic membrane, and extrasynaptic genes. Similar to a directed acyclic graph of GO, terms in the outer ring are a subset of those in the adjacent inner ring.
The brain is a complex organ that comprises numerous brain regions which perform different functions. Therefore, it is important to analyze disease-associated brain regions. Results of the enrichment analysis using GWAS data in multiple tissues showed that the ADHD risk loci were significantly enriched in the mesencephalon (P = 0.01), visual cortex (P = 0.02), and frontal lobe (P = 0.02) (Figure 3 and Supplementary Table S3). This result suggested that risk genes are involved in the onset of ADHD via the regulation of gene expression in these brain regions. Moreover, our results further confirmed that ADHD is a brain-associated neurodevelopmental disorder.
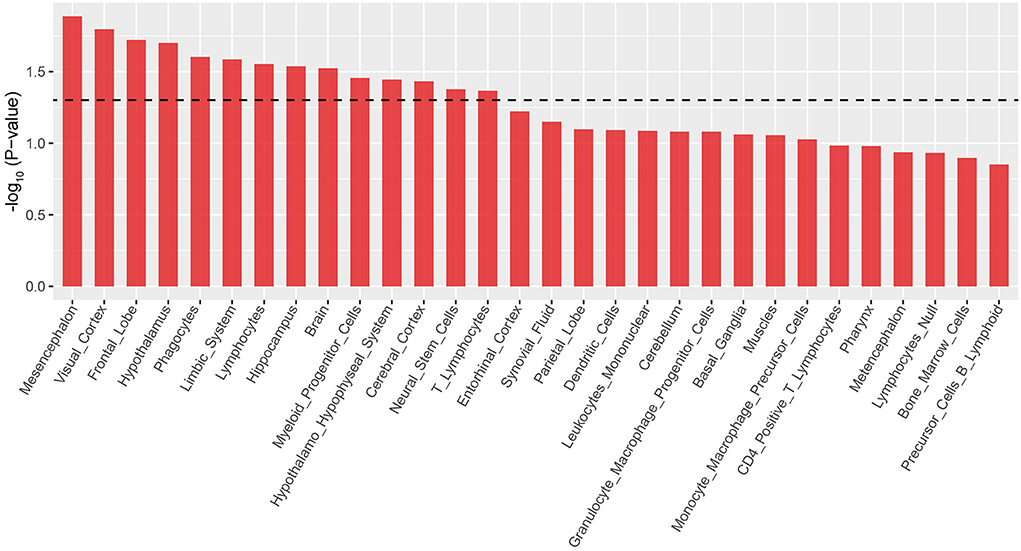
Figure 3. LDSC-SEG analysis results of ADHD-relevant tissues. Only the top 30 tissues are shown according to the descending order of log10 (p-value).
Although we found that the risk genes were highly expressed in brain-associated tissues, the brain contains thousands of different cell types with distinct gene expression patterns (25), and similar to the tissue specificity of gene expression, cell specificity should not be ignored. We considered that risk genes may only exert function in certain cell types (26, 27). Therefore, we applied EWCE using the R package to perform cell-type-specific analysis. As mentioned earlier, risk genes may be involved in neurodevelopment because ADHD is a neurodevelopmental disorder. Thus, we selected single-cell gene expression data from the neocortex at mid-gestation (i.e., gestation weeks 17–18). Expression-weighted cell type enrichment analysis performed on the risk gene set showed that the ADHD risk genes were highly expressed in mature excitatory neurons in the upper layer (ExM-U, PEWCE = 1.6 × 10⁻³) and excitatory neurons in deep layer 2 (ExDp2, PEWCE = 0.04) (Figure 4A and Supplementary Table S4) (22). The cell-type-specific analysis using another single-cell dataset also highlighted excitatory glutamatergic neurons in ADHD (Figure 4B and Supplementary Table S5) (23). Taken together, the results indicated that risk genes are involved in the onset of ADHD by affecting the relevant gene expressions of the excitatory cortical neurons.
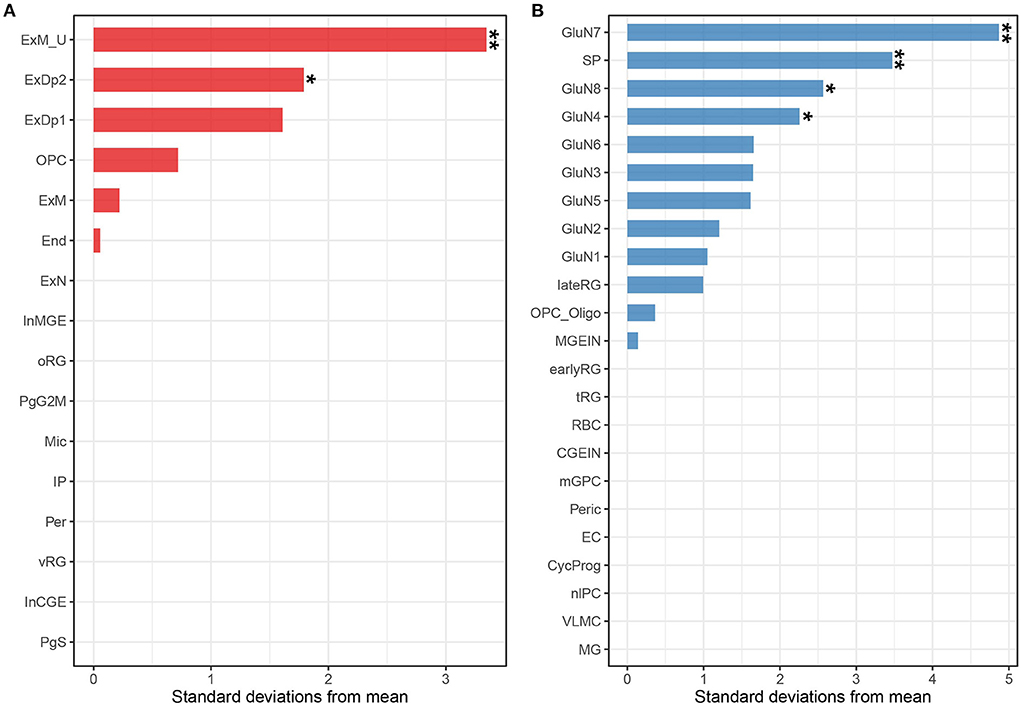
Figure 4. Associations between ADHD and cell types from the human fetal neocortex using scRNA-seq data from Polioudakis et al. (22) (A) and Trevino et al. (23) (B). Tissues labeled with two asterisks indicate Bonferroni adjusted significance (P < 0.05 for the Polioudakis et al. (22) data; P < 0.05 for the Trevino et al. (24) data). Tissues labeled with one asterisk indicate the nominal significance (P < 0.05). End, endothelial cell; ExDp1, excitatory deep layer 1; ExDp2, excitatory deep layer 2; ExM, maturing excitatory; ExM-U, maturing excitatory upper enriched; ExN, migrating excitatory; InCGE, interneuron; InMGE, interneuron MGE; IP, intermediate progenitor; Mic, microglia; OPC, oligodendrocyte precursors; oRG, outer radial glia; Per, pericyte; PgG2M, cycling progenitors (G2/M phase); PgS, cycling progenitors; vRG, ventricular radial glia; GluN, glutamatergic neuron; SP, subplate; nIPC, neuronal intermediate progenitor cell; lateRG, late radial glia; earlyRG, early radial glia; VLMC, leptomeningeal cells; tRG, truncated radial glia; RBC, red blood cells; Peric, pericytes; OPC_oligo, OPC and oligodendrocyte; mGPC, multipotent glial progenitor; CycProg, cycling progenitors.
Attention-deficit/hyperactivity disorder is a polygenic and complex heritable disorder, whose heritability is consisted of many common variants with small effects and relatively small number of rare variants with large effects. Most common variants identified by GWAS were located in non-coding regions (2, 6), with no influence on the protein sequence. We hypothesized that these common variants play a role in the onset of ADHD by regulating the expression of ADHD-relevant genes.
In this study, we collected ADHD GWAS data, brain eQTL data, tissue expression profile, and cortical single-cell sequencing data to identify the ADHD-associated risk genes, relevant tissues, and cell types. We screened out 336 ADHD-associated risk genes, including multiple neurodevelopment-related genes and some of these genes, like KIZ and CTNNB1, were also indicated to be related to ADHD in previous studies (28, 29). The tissue-specific analysis showed that the risk genes were highly expressed in brain tissues, especially in the mesencephalon, visual cortex, and frontal lobe regions. Moreover, the cell-specific analysis showed that ADHD risk genes are highly expressed in excitatory neurons.
The LDSC-SEG results for the integrated tissue expression profile and ADHD GWAS data revealed that multiple brain regions were involved in the onset ADHD. Although the results were not adjusted by multiple correction, the most significant tissues were located in the brain. Therefore, we consider our results reliable. However, because of the high similarity in expression profiles among various brain tissues, we were unable to identify specific ADHD-associated brain tissues using the current methods.
Although hundreds of risk genes for ADHD have been identified using SMR analysis, identifying the specific brain regions in which these risk genes exert its function requires further exploration because of cellular heterogeneity. Previous studies have shown that, in contrast to neurological disorders, GWAS data of psychiatric disorders map primarily onto neurons, rather than glial cells (26, 30). This is in line with our findings that ADHD risk genes are highly expressed in excitatory cortical neurons, which indicated that these genes affect the biological function of excitatory neurons and, further contribute to etiology of ADHD.
Furthermore, several researchers consider ADHD as an omnigenic disorder, whereby all genes contribute to the onset of ADHD (2, 31). The pathogenic genes can be divided into two categories: a small proportion of directly ADHD-related genes, referred to as “core genes” and a large proportion of “peripheral genes,” which function via the regulation of the “core genes.” According to this notion, the majority of genes identified in our study likely belong to the “core genes.” In addition, we screened out multiple ADHD-associated risk genes that were also involved in neurodevelopment, which demonstrated that ADHD is a neurodevelopmental disorder (1, 32, 33). Furthermore, the risk SNPs of ADHD may cause neurodevelopmental disorders by regulating the expression of genes related to neurodevelopment; thus, these SNPs are also likely involved in the etiology of ADHD.
We summarized several limitations. First, GWAS risk SNPs can exert its function not only through regulation of gene expression but also through other pathways (34), such as splicing (35), histone modification (36), and chromatin accessibility (37). Second, we did not perform multiple-test correction for the SMR analysis, which may have increased the potential of false positives. However, given that the current GWAS only explained about one-third of the heritability for ADHD, the number of risk loci identified by current GWAS were far from saturation (2). Therefore, instead of multiple-test correction, we filtered the false-positive results using a PSMR threshold of 0.01. Finally, the ADHD-associated cell types identified in this study require further validation in other brain regions. As additional single-cell expression maps of brain regions become available, we plan to continue to study ADHD-associated cell types in other brain regions.
The datasets presented in this study can be found in online repositories. The names of the repository/repositories and accession number(s) can be found in the article/Supplementary material.
W-QW and HS designed the study and drafted the manuscript. Y-JC, X-WL, and RZ analyzed the data. YL and X-WL revised the manuscript and provided expert consultation on the design of the study. All authors critically reviewed the manuscript and approved of it in its final form.
This research was supported by Wuhan Municipal Health Research Fund (WG17M01 to YL).
We thank all the individuals who participated in the study and also, we thank all the professors who provided ideas and advises.
The authors declare that the research was conducted in the absence of any commercial or financial relationships that could be construed as a potential conflict of interest.
All claims expressed in this article are solely those of the authors and do not necessarily represent those of their affiliated organizations, or those of the publisher, the editors and the reviewers. Any product that may be evaluated in this article, or claim that may be made by its manufacturer, is not guaranteed or endorsed by the publisher.
The Supplementary Material for this article can be found online at: https://www.frontiersin.org/articles/10.3389/fpsyt.2022.999007/full#supplementary-material
1. Faraone SV, Asherson P, Banaschewski T, Biederman J, Buitelaar JK, Ramos-Quiroga JA, et al. Attention-deficit/hyperactivity disorder. Nat Rev Dis Primers. (2015) 1:15020. doi: 10.1038/nrdp.2015.20
2. Faraone SV, Larsson H. Genetics of attention deficit hyperactivity disorder. Mol Psychiatry. (2019) 24:562–75. doi: 10.1038/s41380-018-0070-0
3. Brikell I, Kuja-Halkola R, Larsson H. Heritability of attention-deficit hyperactivity disorder in adults. Am J Med Genet B Neuropsychiatr Genet. (2015) 168:406–13. doi: 10.1002/ajmg.b.32335
4. Kan KJ, Dolan CV, Nivard MG, Middeldorp CM, van Beijsterveldt CE, Willemsen G, et al. Genetic and environmental stability in attention problems across the lifespan: evidence from the Netherlands twin register. J Am Acad Child Adolesc Psychiatry. (2013) 52:12–25. doi: 10.1016/j.jaac.2012.10.009
5. Kuntsi J, Rijsdijk F, Ronald A, Asherson P, Plomin R. Genetic influences on the stability of attention-deficit/hyperactivity disorder symptoms from early to middle childhood. Biol Psychiatry. (2005) 57:647–54. doi: 10.1016/j.biopsych.2004.12.032
6. Demontis D, Walters RK, Martin J, Mattheisen M, Als TD, Agerbo E, et al. Discovery of the first genome-wide significant risk loci for attention deficit/hyperactivity disorder. Nat Genet. (2019) 51:63–75. doi: 10.1038/s41588-018-0269-7
7. Rovira P, Demontis D, Sanchez-Mora C, Zayats T, Klein M, Mota NR, et al. Shared genetic background between children and adults with attention deficit/hyperactivity disorder. Neuropsychopharmacology. (2020) 45:1617–26. doi: 10.1038/s41386-020-0664-5
8. Zhu H, Shang L, Zhou X. A review of statistical methods for identifying trait-relevant tissues and cell types. Front Genet. (2020) 11:587887. doi: 10.3389/fgene.2020.587887
9. Maurano MT, Humbert R, Rynes E, Thurman RE, Haugen E, Wang H, et al. Systematic localization of common disease-associated variation in regulatory DNA. Science. (2012) 337:1190–5. doi: 10.1126/science.1222794
10. Nicolae DL, Gamazon E, Zhang W, Duan S, Dolan ME, Cox NJ. Trait-associated SNPs are more likely to be eQTLs: annotation to enhance discovery from GWAS. PLoS Genet. (2010) 6:e1000888. doi: 10.1371/journal.pgen.1000888
11. Ward LD, Kellis M. Interpreting noncoding genetic variation in complex traits and human disease. Nat Biotechnol. (2012) 30:1095–106. doi: 10.1038/nbt.2422
12. Finucane HK, Reshef YA, Anttila V, Slowikowski K, Gusev A, Byrnes A, et al. Heritability enrichment of specifically expressed genes identifies disease-relevant tissues and cell types. Nat Genet. (2018) 50:621–9. doi: 10.1038/s41588-018-0081-4
13. Skene NG, Grant SG. Identification of vulnerable cell types in major brain disorders using single cell transcriptomes and expression weighted cell type enrichment. Front Neurosci. (2016) 10:16. doi: 10.3389/fnins.2016.00016
14. Zhu Z, Zhang F, Hu H, Bakshi A, Robinson MR, Powell JE, et al. Integration of summary data from GWAS and eQTL studies predicts complex trait gene targets. Nat Genet. (2016) 48:481–7. doi: 10.1038/ng.3538
15. Qi T, Wu Y, Zeng J, Zhang F, Xue A, Jiang L, et al. Identifying gene targets for brain-related traits using transcriptomic and methylomic data from blood. Nat Commun. (2018) 9:2282. doi: 10.1038/s41467-018-04558-1
16. GTEx Consortium. Genetic effects on gene expression across human tissues. Nature. (2017) 550:204–13. doi: 10.1038/nature24277
17. Fromer M, Roussos P, Sieberts SK, Johnson JS, Kavanagh DH, Perumal TM, et al. Gene expression elucidates functional impact of polygenic risk for schizophrenia. Nat Neurosci. (2016) 19:1442–53. doi: 10.1038/nn.4399
18. Ng B, White CC, Klein HU, Sieberts SK, McCabe C, Patrick E, et al. An xQTL map integrates the genetic architecture of the human brain's transcriptome and epigenome. Nat Neurosci. (2017) 20:1418–26. doi: 10.1038/nn.4632
19. Koopmans F, van Nierop P, Andres-Alonso M, Byrnes A, Cijsouw T, Coba MP, et al. SynGO: an evidence-based, expert-curated knowledge base for the synapse. Neuron. (2019) 103 (2) 217.e4–34.e4. doi: 10.1016/j.neuron.2019.05.002
20. Pers TH, Karjalainen JM, Chan Y, Westra HJ, Wood AR, Yang J, et al. Biological interpretation of genome-wide association studies using predicted gene functions. Nat Commun. (2015) 6:5890. doi: 10.1038/ncomms6890
21. Fehrmann RS, Karjalainen JM, Krajewska M, Westra HJ, Maloney D, Simeonov A, et al. Gene expression analysis identifies global gene dosage sensitivity in cancer. Nat Genet. (2015) 47:115–25. doi: 10.1038/ng.3173
22. Polioudakis D, de la Torre-Ubieta L, Langerman J, Elkins AG, Shi X, Stein JL, et al. A single-cell transcriptomic atlas of human neocortical development during mid-gestation. Neuron. (2019) 103:785.e8–801.e8. doi: 10.1016/j.neuron.2019.06.011
23. Trevino AE, Muller F, Andersen J, Sundaram L, Kathiria A, Shcherbina A, et al. Chromatin and gene-regulatory dynamics of the developing human cerebral cortex at single-cell resolution. Cell. (2021) 184:5053.e23–69.e23. doi: 10.1016/j.cell.2021.07.039
24. Wisniewska MB. Physiological role of beta-catenin/TCF signaling in neurons of the adult brain. Neurochem Res. (2013) 38:1144–55. doi: 10.1007/s11064-013-0980-9
25. Silbereis JC, Pochareddy S, Zhu Y, Li M, Sestan N. The cellular and molecular landscapes of the developing human central nervous system. Neuron. (2016) 89:248–68. doi: 10.1016/j.neuron.2015.12.008
26. Skene NG, Bryois J, Bakken TE, Breen G, Crowley JJ, Gaspar HA, et al. Genetic identification of brain cell types underlying schizophrenia. Nat Genet. (2018) 50:825–33. doi: 10.1038/s41588-018-0129-5
27. Trubetskoy V, Pardinas AF, Qi T, Panagiotaropoulou G, Awasthi S, Bigdeli TB, et al. Mapping genomic loci implicates genes and synaptic biology in schizophrenia. Nature. (2022) 604:502–8. doi: 10.1038/s41586-022-04434-5
28. Baranova A, Wang J, Cao H, Chen JH, Chen J, Chen M, et al. Shared genetics between autism spectrum disorder and attention-deficit/hyperactivity disorder and their association with extraversion. Psychiatry Res. (2022) 314:114679. doi: 10.1016/j.psychres.2022.114679
29. Rao S, Baranova A, Yao Y, Wang J, Zhang F. Genetic relationships between attention-deficit/hyperactivity disorder, autism spectrum disorder, and intelligence. Neuropsychobiology. (2022) 2022:1–13. doi: 10.1159/000525411
30. Olislagers M, Rademaker K, Adan RAH, Lin BD, Luykx JJ. Comprehensive analyses of RNA-seq and genome-wide data point to enrichment of neuronal cell type subsets in neuropsychiatric disorders. Mol Psychiatry. (2022) 27:947–55. doi: 10.1038/s41380-021-01324-6
31. Boyle EA, Li YI, Pritchard JK. An expanded view of complex traits: from polygenic to omnigenic. Cell. (2017) 169:1177–86. doi: 10.1016/j.cell.2017.05.038
32. Doernberg E, Hollander E. Neurodevelopmental disorders (ASD and ADHD): DSM-5, ICD-10, and ICD-11. CNS Spectr. (2016) 21:295–9. doi: 10.1017/S1092852916000262
33. Thapar A, Cooper M. Attention deficit hyperactivity disorder. Lancet. (2016) 387:1240–50. doi: 10.1016/S0140-6736(15)00238-X
34. Yao DW, O'Connor LJ, Price AL, Gusev A. Quantifying genetic effects on disease mediated by assayed gene expression levels. Nat Genet. (2020) 52:626–33. doi: 10.1038/s41588-020-0625-2
35. Li YI, van de Geijn B, Raj A, Knowles DA, Petti AA, Golan D, et al. RNA splicing is a primary link between genetic variation and disease. Science. (2016) 352:600–4. doi: 10.1126/science.aad9417
36. Stunnenberg HG, International Human Epigenome C, Hirst M. The international human epigenome consortium: a blueprint for scientific collaboration and discovery. Cell. (2016) 167:1145–9. doi: 10.1016/j.cell.2016.12.002
Keywords: ADHD, GWAS, gene expression, tissues enrichment, cell type enrichment
Citation: Wei W-Q, Sun H, Chen Y-J, Liu X-W, Zhou R, Li Y and Liu X-W (2022) Genetic identification of tissues and cell types underlying attention-deficit/hyperactivity disorder. Front. Psychiatry 13:999007. doi: 10.3389/fpsyt.2022.999007
Received: 20 July 2022; Accepted: 12 August 2022;
Published: 26 August 2022.
Edited by:
Fuquan Zhang, Nanjing Medical University, ChinaReviewed by:
Pavel Kuksa, University of Pennsylvania, United StatesCopyright © 2022 Wei, Sun, Chen, Liu, Zhou, Li and Liu. This is an open-access article distributed under the terms of the Creative Commons Attribution License (CC BY). The use, distribution or reproduction in other forums is permitted, provided the original author(s) and the copyright owner(s) are credited and that the original publication in this journal is cited, in accordance with accepted academic practice. No use, distribution or reproduction is permitted which does not comply with these terms.
*Correspondence: Yi Li, cHN5bGVlQDE2My5jb20=; Xin-Wen Liu, MjYwNDU3Mjk0NkBxcS5jb20=
†These authors have contributed equally to this work and share first authorship
Disclaimer: All claims expressed in this article are solely those of the authors and do not necessarily represent those of their affiliated organizations, or those of the publisher, the editors and the reviewers. Any product that may be evaluated in this article or claim that may be made by its manufacturer is not guaranteed or endorsed by the publisher.
Research integrity at Frontiers
Learn more about the work of our research integrity team to safeguard the quality of each article we publish.