- 1College of Computer and Technology, Hangzhou Dianzi University, Hangzhou, China
- 2Key Laboratory of Brain Machine Collaborative Intelligence of Zhejiang Province, Hangzhou Dianzi University, Hangzhou, China
- 3School of Information Science and Technology, Hangzhou Normal University, Hangzhou, China
Electroencephalogram (EEG)-based tools for brain functional connectivity (FC) analysis and visualization play an important role in evaluating brain cognitive function. However, existing similar FC analysis tools are not only visualized in 2 dimensions (2D) but also are highly prone to cause visual clutter and unable to dynamically reflect brain connectivity changes over time. Therefore, we design and implement an EEG-based FC visualization framework in this study, named EEG-FCV, for brain cognitive state evaluation. EEG-FCV is composed of three parts: the Data Processing module, Connectivity Analysis module, and Visualization module. Specially, FC is visualized in 3 dimensions (3D) by introducing three existing metrics: Pearson Correlation Coefficient (PCC), Coherence, and PLV. Furthermore, a novel metric named Comprehensive is proposed to solve the problem of visual clutter. EEG-FCV can also visualize dynamically brain FC changes over time. Experimental results on two available datasets show that EEG-FCV has not only results consistent with existing related studies on brain FC but also can reflect dynamically brain FC changes over time. We believe EEG-FCV could prompt further progress in brain cognitive function evaluation.
1. Introduction
More and more studies prove a strong association between brain cognitive function and neural connectivity in different brain regions (1–3). An EEG-based brain connectivity analysis provides much useful and meaningful information to reflect the dynamic changes in brain neural activities, and an interpretation of the changes in cognitive functions as well (4–7). Therefore, it is of vital importance to design a friendly human-computer interaction visualization framework to better reflect the connectivity and its dynamical changes in the brain for evaluation of cognitive states, which can not only promote the understanding of EEG signals but also assist better performing the relevant analysis of brain cognitive function. In general, there are three kinds of connectivity: anatomical, effective, and functional (8). Since the definition of anatomical connectivity is not yet clear, and some fake connections may be involved in the effective connection, we mainly focus on functional connectivity (FC) in our designed framework.
Functional connectivity is defined as the temporal correlation between spatial remote neurophysiological events (9) and is essentially employed to measure the degree of dependence or correlation between signals collected by relevant techniques, such as functional magnetic resonance imaging (fMRI) (10–12), diffusion tensor imaging (DTI) (13) and EEG (14, 15), etc. Compared with fMRI and DTI, EEG has millisecond-level time resolution, which makes it more suitable for visualizing brain neural activities, and easier to reflect changes in brain activity in the temporal dimension (16) as well.
In the past decades, although many teams (17–21) have devoted themselves to the development of similar toolkits for analysis and visualization of brain FC, there are still some issues to be addressed. First, existing related toolkits are not platform-independent, most of which such as ELAN (21), and EEGNET (19), are embedded in some platform software like MATLAB (Math works, Inc.), making them incapable of running independently. Second, those toolkits lack effective algorithms to eliminate the problem of visual clutter. Finally, most of them can only perform a kind of static FC analysis, so they cannot reflect the dynamic changes of EEG cognitive state.
Therefore, in this article, we design an EEG-based FC visualization framework (EEG-FCV) to visualize brain connectivity between different channels, different brain regions, as well as left and right hemispheres, respectively, so as to better estimate the brain's cognitive functions and their dynamic changes. Besides, we propose a novel brain connectivity metric, named Comprehensive, to eliminate visual clutter.
The main contributions in this study are involved in the following three aspects:
• We design and implement a 3D software framework known as EEG-FCV which is completely independent of platforms, for the visualization of brain FC and evaluation of cognitive states.
• We propose Comprehensive as a novel metric of brain FC to efficiently solve the problem of visual clutter.
• We take advantage of the high time resolution of EEG to realize FC dynamic visualization, so as to provide some assistance with an analysis of the evolution of brain cognitive activities.
2. Related Study
2.1. EEG-Based FC Evaluation Methods
Among those methods for EEG-based evaluation of brain FC, the most representatives usually include Correlation, Coherence, and Phase Locking Value (PLV). For example, Risqiwati et al. (22) performed EEG-based FC analysis with Pearson Correlation metric in different mental states and found obvious FC effect in Beta (13–30 Hz) and Theta (4–7 Hz) frequency bands. In Duffy and Als (23). adopted Spectral Coherence to analyze brain FC of children with autism and confirmed the changes in connectivity with the coherence metric. La Rocca et al. (24) further fused spectral coherence-based connectivity between different brain regions as a possibly viable biometric feature, concluding that Coherence is a useful metric in the evaluation of brain FC. In addition, PLV-based metric is also used to perform FC analysis to study the difference between the Supplementary Motor Area (SMA) and Primary Motor Area (M1) when performing motor imagery tasks of left/right hand movement (25). The experimental results showed that PLV is one of the robust features to distinguish different motor imagery states. Sadaghiani et al. (26) also concluded that alpha band (8–13 Hz) phase synchrony was linked to neural structures underpinning phasic control of alertness and task requirements.
2.2. EEG-Based FC Visualization Applications
Nowadays, many research teams have developed various EEG FC visualization tools. Hassan et al. (19) developed an EEGNET plug-in application embedded in MATLAB for the analysis of functional brain networks. EEGNET could perform EEG preprocessing and carry out EEG-based analysis of brain FC among different surface electrodes. To study the synchronization patterns of different EEG acquisition channels, Alba et al. (17) designed a time-frequency-topography visualization system based on various techniques, such as time-frequency decomposition and Bayesian approach, to perform various synchrony measurements. In order to reduce the visual clutter of FC visualization produced by coherence measures from multichannel EEG, Ten Caat et al. (18) optimized the way of graphical layout through a maximal clique-based (MCB) method and a watershed-based (WB) method with a better visualization effect. ELAN is a freely available software package, developed by the Brain Dynamics and Cognition Laboratory in Lyon (21), for the analysis of scalp and intracranial EEG. ELAN could provide phase synchronization analysis of EEG and visualization of topographic mapping. Peyk et al. (20) provided a MATLAB-based EMEGS toolkit that can visualize data as 3D projections of multiple models, including simple sphere models, realistic head shapes, and realistic brain shapes.
Although many EEG-based FC analysis and visualization tools have been developed, most of them have to be embedded in some platform software such as MATLAB as the plug-in toolboxes, so they are difficult to avoid visual clutter and cannot reflect the dynamic changes in brain connectivity. All these factors have hindered the further promotion of these existing tools.
3. Framework of EEG-FCV
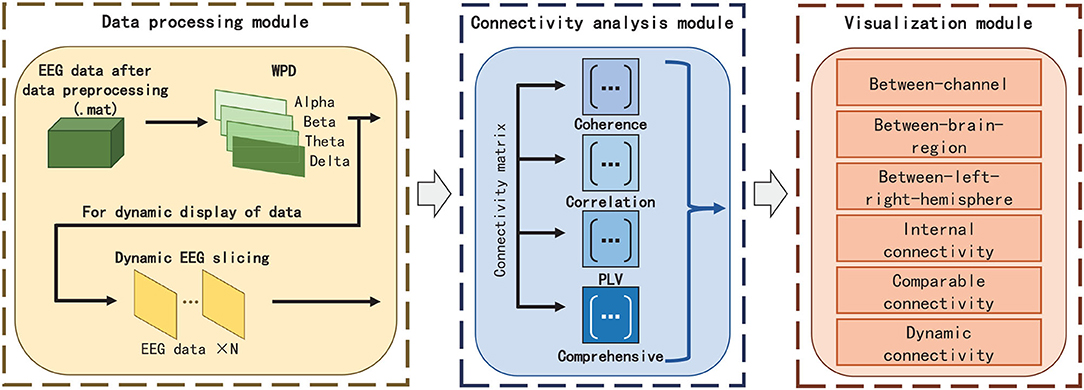
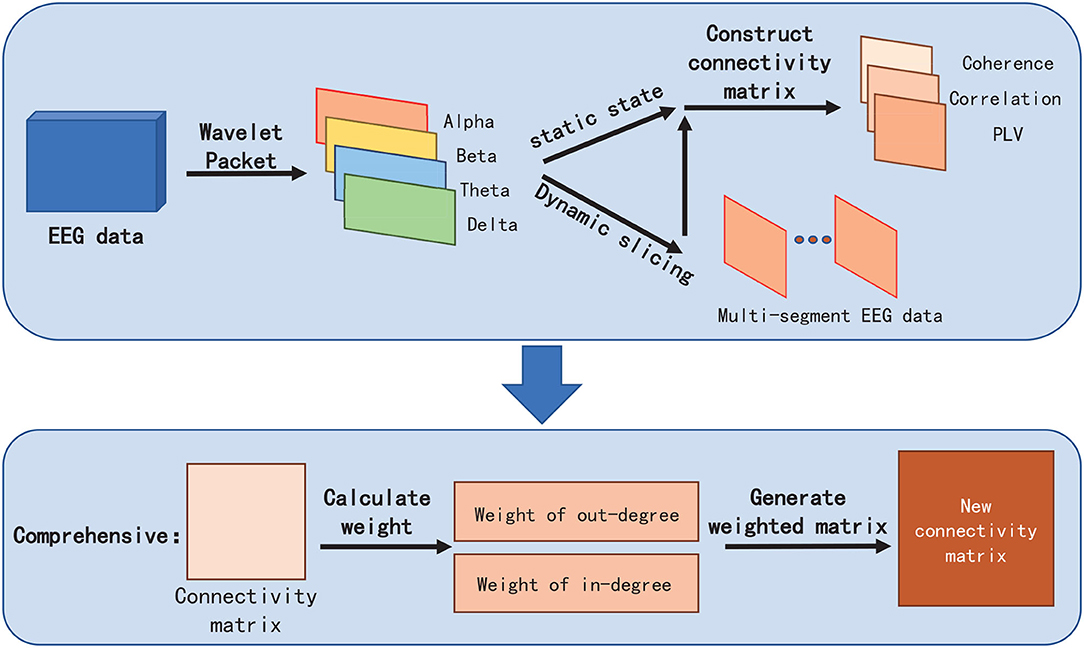
The framework and work flow of EEG-FCV are shown in Figures 1, 2, respectively. EEG-FCV is composed of three modules: Data Processing Module, Connectivity Analysis module, and Visualization module. The raw EEG data first undergoes preliminary preprocessing, including artifact removal and down-sampling. Then the new-generated data file in .mat format is sent into the Data Processing Module.
3.1. Data Processing Module
Usually, EEG signals of the Alpha frequency band (8–13 Hz) in the occipital lobe and parietal lobe appear and play a major role when someone is awake, quiet, and eye-closed. When a person is in a state of concentration, thinking, alertness or anxiety, EEG signals of the Beta frequency band in the frontal lobe are strongly correlated with brain cognitive activities. EEG signals in the Theta frequency band are more active near the Fz lobe when someone is in meditation, drowsiness, hypnosis, or sleep state. EEG signals in the Delta frequency band (1–4 Hz) are dominated during sleeping (27–29). Therefore, we can infer the cognitive function by observing the connectivity and its changes in different frequency bands.
Therefore, in Data Processing Module, we first extract EEG features by adopting Wavelet Packet Decomposition (WPD) in frequency bands of Alpha, Beta, Theta, and Delta, respectively. EEG feature vectors in these four frequency bands can be directly used as the input of the Connectivity Analysis module for static visualization. Regarding the dynamic display of FC visualization, we perform slicing with a fixed time interval according to different feature labels in EEG to obtain multiple EEG feature vectors with equal length and then send those features to the Connectivity Analysis module to calculate FC metrics for visualization.
3.2. Connectivity Analysis Module
In the Connectivity Analysis module, we not only embed three commonly used FC metrics(PCC, Coherence, and PLV) but also propose a novel FC metric named Comprehensive to extract the connection weight and highlight the strength of the connectivity between EEG channels, so as to facilitate the elimination of vision clutter brought by commonly used FC metrics algorithms.
3.2.1. Pearson Correlation Coefficient
Given two time series of signals x = {x1, x2, ⋯ , xi, ⋯ , xn} and y = {y1, y2, ⋯ , yi, ⋯ , yn} (xi and yi are the sample points with an index of i), PCC r is in statistics the measure of linear correlation between x and y. It is the ratio between the covariance of the two signals and the product of their SDs. Thus, PCC is essentially a normalized measurement of the covariance, and the result has a value between −1 and 1. Thus, for n paired data {xi, yi} in x and y, PCCr is defined as:
where and ȳ are the sample means which equals to and , respectively. The greater the absolute of r, the stronger the correlation.
3.2.2. Coherence
Coherence, also called spectral coherence in signal processing, is commonly used to estimate the power between input and output of a linear system. The coherence Cohxy between x and y can be calculated as Equation 2:
where pxy(f) is the cross-spectral density at a frequent band f between x and y, and pxx(f) and pyy(f) are the auto-spectral density of x and y, respectively. The magnitude of the spectral density is denoted as |p|.
Cohxy always satisfies 0 ≤ Cohxy ≤ 1. Similar to PCC r, if Cohxy is closer to 1 at frequent band f, there exists a stronger relationship between x and y.
3.2.3. Phase Locking Value
Phase Locking Value, also known as phase synchronization index, is a phase-based FC method, which actually measures the phase difference between two channels. PLV between x and y can be written as:
where ϕxt and ϕyt represent the phase angles of x and y, respectively at time t. The range of PLV is [0,1]. The larger the value PLV, the stronger the phase synchronization between x and y.
Phase Locking Value can be used to investigate task-induced changes in long range synchronization of neural activity from EEG data, and statistics can be argued to be a proxy for connectivity. Intuitively, if the EEG signal in two channels (electrodes) during an experimental condition rises and falls together more than a baseline value, then there is more synchronization, or loosely speaking, enhanced connectivity between these two electrodes. If it is less than the baseline value, there is de-synchronization, or loosely speaking, decreased connectivity between the two electrodes.
Although the above three metrics are commonly used for FC analysis, they do not consider the co-variation in the power of the EEG signal between two electrodes and are more sensitive to the volume conduction effect. However, it might not only lead to visual clutter due to the smaller difference between the three metrics in connectivity strength but also be difficult to highlight the connectivity to find an optimal connection between channels in the brain network.
3.2.4. Our Proposed Metric of Comprehensive
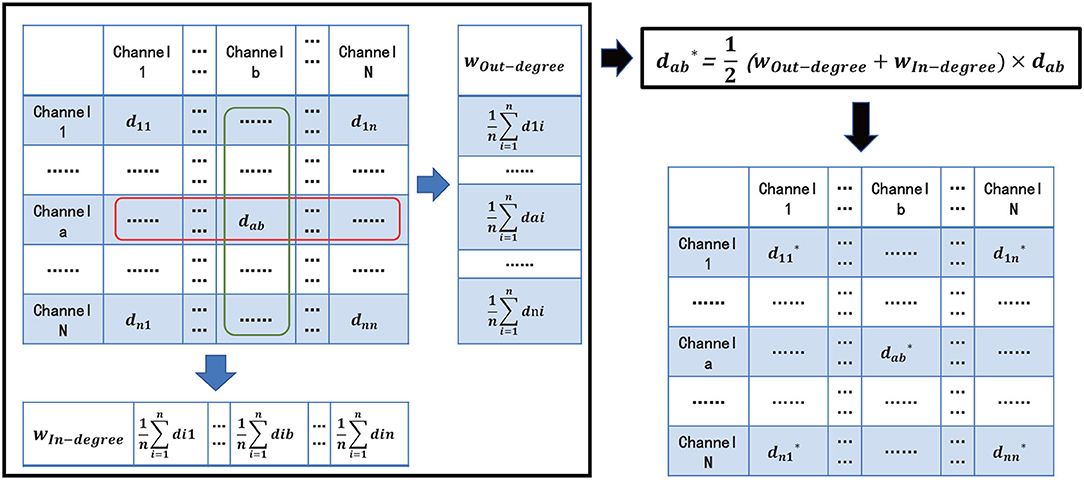
To better reflect the connectivity difference between channels, and eliminate the vision clutter, we propose a novel measure metric, named Comprehensive. The core idea of Comprehensive is to assign a weight for FC visualization to the edge between two channels (also termed as nodes in the brain network) in the brain network by respectively calculating the degrees of the two channels (Figure 3). Comprehensive can not only show the difference in the connectivity strength between channels and, thus, find the key connectivity among them but also can efficiently eliminate the visual clutter. In detail,
First, for the ath, bth channels Ca and Cb in channel set {C1, C2, ⋯ , Cn}, a, b ∈ {1, 2, ⋯ , n}, we define, respectively the in-degree weight wIn−degree and the out-degree weight wOut−degree of channel Ca in Equations 4 and 5 as the average connectivity of the number of head adjacent channel Ci, and tail end adjacent channel Cj to channel Ca, respectively :
where i, j ∈ {1, 2, ⋯ , n} are the subscripts of ith channel Ci and jth channel Cj. dia represents one metric of PCC r, Cohia, and PLV from channel Ci to Ca. daj is similar to dia.
Then, Comprehensive can be denoted as:
Similar to PCC, Coherence, and PLV, we need to normalize in line with different metrics chosen by dab. For example, if we choose PCC or PLV as dab, will be between 0 and 1, while Coherence as dab, will lie between −1 and 1.
3.3. Visualization Module
3.3.1. Basic Concepts
The static/dynamic visualization is realized in the Visualization module. In this module, six FC visualizations, including between-channel, between-brain-region(between-BR), between-left-right-hemisphere(between-L/RH), internal-connectivity, comparable connectivity, and dynamic connectivity are designed to show FC effects in different situations.
Herein, between-channel FC visualization means to visualize the connectivity between two different channels. Between-BR visualization is to show the connectivity between two different BRs distributed in line with the international 10–20 system, which are frontal lobe, parietal lobe, occipital lobe, temporal lobe, and central zone, respectively. Correspondingly, the connectivity between two different hemispheres is shown in between-L/RH visualization. Internal connectivity visualization is to reveal the connectivity results between channels either in the same BR or in the same L/RH. In addition, EEG-FCV also provides comparable FC visualization of different cognitive states, so as to facilitate analyzing FC differences for various psychological activities. Finally, as a special function of EEG-FCV, the FC changes of EEG over time are realized in Dynamic Visualization, which helps researchers to better observe the connectivity changes, thereby assisting in the study of relevant potential neuropsychological activities.
3.3.2. 3D Display in Different Visualization Levels
3ds Max software (Autodesk Company, USA) is employed as the development tool to construct our 3D visualization module. There are three different levels of visualization, which are between-channel (Figure 4A), between-BR (Figure 4B), and between-L/RH (Figure 4C).

Figure 4. Three ways of Visualization. (A) is the model of between-channel, (B) is the model of between-BR, and (C) is the model of between-L/RH.
Between-channel level of 3D visualization is designed and implemented in terms of the 81-channel's 3D coordinates of the standard 10–20 lead provided by EEGLab. For better visualization, we mark those channels in the central zone of the cerebral cortex (such as Nz-Iz) in red and those in other areas in blue, respectively, as shown in Figure 4A. In order to show 3D visualization of the between-BR level, we first connect the 3D coordinates of all the channels in the same BR to generate a polyhedron. According to this method, a total of 12 visualization levels of different BRs marked in white is generated. Similarly, the 3D visualization of between-L/RH levels can also be achieved, as shown in Figures 4B,C, respectively.
3.4. Connectivity Visualization
In EEG-FCV, the connectivity strength is represented by different colors, transparency, and thickness of connection lines. The golden-and-red lines indicate the connectivity values between channels are greater than zero. The greater the values, the stronger the connectivity between channels, and the thicker and more opaque the line. In contrast, black-and-white lines mean the connectivity values are less than zero. Similarly, the smaller the values, the weaker the connectivity between channels, and the thinner and more transparent the lines.
We calculate the connectivity of between-channel to evaluate the connectivity of between-BR or between-L/RH. For n BRs(or L/RHs) z = {z1, z2, ⋯ , zk, ⋯ , zn}, ∃za ∈ z and ∃zb ∈ z (a, b ∈ [1, n], a≠b). For N channels {x1, ⋯ , xi, ⋯ , xN} and M channels {y1, ⋯ , yj, ⋯ , yM}, ∀xi ∈ za and ∀yj ∈ zb (i ∈ [1, N], j ∈ [1, M]). C(xi, yj) represents the connectivity between channel xi and channel yj obtained from between-channel connectivity. Therefore, the connectivity C(za, zb) between BR(or L/RH) za and BR(or L/RH) zb can be denoted as:
4. Experiments
4.1. Datasets
We use two different datasets: SEED and Fatigue Driving to verify the performance of EEG-FCV.
4.1.1. SEED Dataset
SEED is a public dataset issued by SJTU for EEG emotion recognition (30, 31). Fifteen Chinese subjects (male:female = 7:8, MEAN: 23.27, STD: 2.37) are recruited to participate in the experiments. Each subject is asked to perform the experiment three times with an interval of approximately 1 week, and watch fifteen Chinese film clips with three emotion stimuli (positive, neutral, and negative emotions) in each experiment. The duration of each film clip is approximately 4 min. There is a total of 15 trials for each experiment. EEG is recorded by EEG cap with 62 channels in line with the international 10–20 system. Then EEG is downsampled to 200 Hz and filtered with a bandpass frequency from 0 to 75 Hz.
4.1.2. Fatigue Driving Dataset
The fatigue driving dataset includes 20 healthy subjects (9 women, 11 men) of EEG data collected in 2 h of driving for mental state prediction. Each subject is required to perform the driving tasks twice on 2 consecutive days. The experiment is conducted following the principles outlined in the Declaration of Helsinki of 1975, as revised in 2008.
EEG is recorded with a sampling frequency of 200 Hz by a 62-channel EEG cap (Brain Products GmbH, Munich, Germany), then EEG data between 1 and 30 Hz is remained by band-pass filtering, and eye blinking artifacts are removed by means of Independent Component Analysis (ICA) (32). Fatigue Driving dataset contains EEG of five mental states namely TAV1 to TAV5 evoked by two stimuli of video and audio, as well as the right and left button press. In addition, EEG of the other three mental states (WUP, PERFO, DROWS) is also recorded without any stimuli but at different driving speeds. Please refer to Zeng et al. (33, 34), and Zhao et al. (35) for more details.
4.2. Comprehensive vs. PCC, Coherence and PLV
First of all, we compared the results of using different FC metrics. Figure 5 shows the results by means of PCC, Coherence, PLV, and Comprehensive in the EEG alpha band of the SEED dataset.
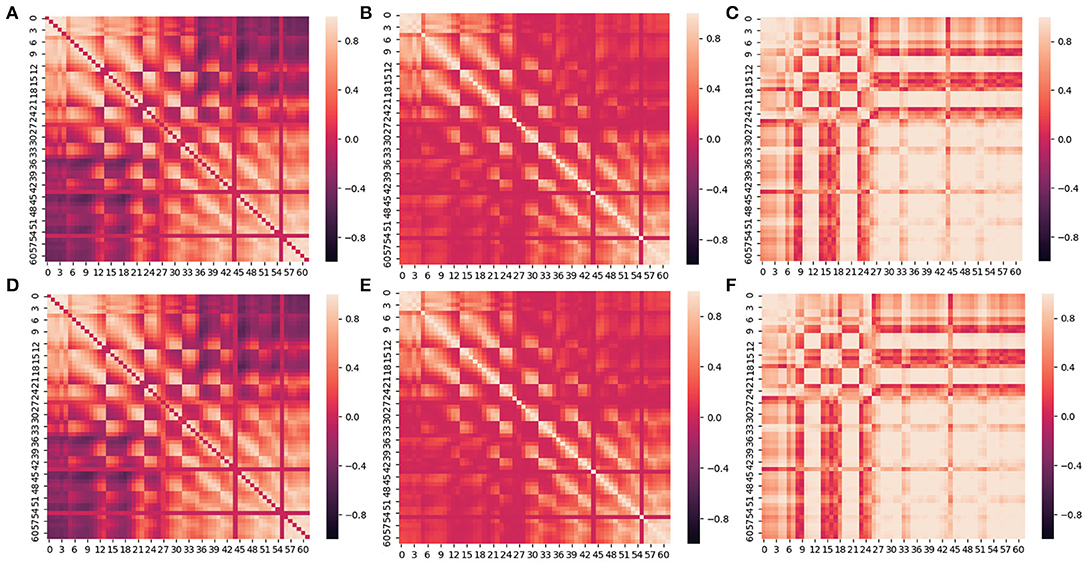
Figure 5. Between-channel FC visualization of PCC and Comprehensive. (A–C) is the heat map of PCC, Coherence and PLV. (D–F) is the heat map of Comprehensive based on (A–C).
We can see from Figures 5A–C that the closer the distance between two channels, the larger the value of Coherence, PCC, and PLV, and the stronger the connectivity. Conversely, the farther the distance between two channels, the smaller the value of Coherence, PCC, and PLV, and the weaker the connectivity. The values of PLV between two channels are usually larger than Correlation and PCC. In addition, the connectivity between channels in the frontal lobe(F region), the frontal cortex(FC region), and the frontal temporal lobe(FT region) is commonly stronger than in other regions.
When using Comprehensive to measure and visualize brain FC, as shown in Figures 5D–F, the connectivity between channels with larger Comprehensive is highlighted by assigning a greater positive weight (≥0) to the connection. Correspondingly, the connectivity with smaller Comprehensive between channels is weakened by assigning a smaller negative weight ( ≤ 0) to the connection. Visual clutter of brain FC can be effectively eliminated in this way.
4.3. FC Visualization
In this section, we take PCC and corresponding generated Comprehensive based on PCC as examples to show brain FC in 3D in our proposed visualization modules. Similar results can be obtained based on the other two metrics and corresponding Comprehensive metrics.
4.3.1. Between-Channel Visualization
Brain FC based on PCC in 3D is shown in Figure 6, from which the phenomenon of visual clutter can be easily observed so that it is very difficult to evaluate the connectivity between channels. After adopting Comprehensive, the important connections between brain channels (the corresponding Comprehensive value is larger) become more prominent, and those connections with negative Comprehensive values are faded or even disappeared so that the problem of visual clutter can be effectively alleviated, the visualization of brain FC by Comprehensive is shown in Figure 6B.
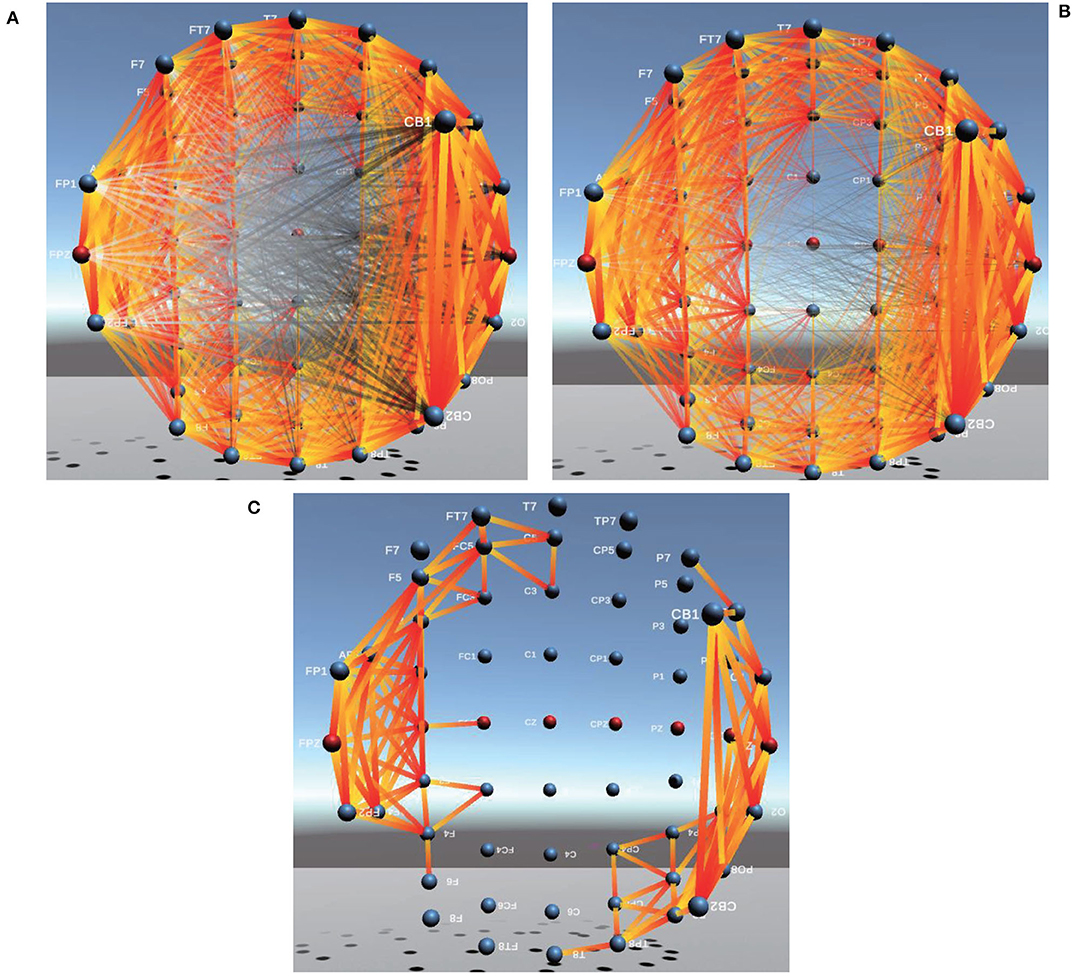
Figure 6. Between-channel FC visualization of PCC and Comprehensive. (A,B) are between-channel FC visualization of PCC and Comprehensive. (C) is Between-channel FC visualization of 1/8 of Comprehensive.
In addition, to further eliminate visual clutter, we define four kinds (1/2, 1/4, 1/8, and 1/16) of visualization modes.
To obtain 1/2 of Comprehensive, the mean value of Comprehensive between channels is firstly calculated, then compared with Comprehensive values of each pair of channels. If the mean value of Comprehensive is greater than 0, only those connections whose Comprehensive values are greater than the mean value of Comprehensive are displayed in the visualization of brain FC; If mean value of Comprehensive is less than 0, only those connections whose Comprehensive values are less than the mean value of Comprehensive are displayed in the visualization of brain FC. Similarly, 1/4, 1/8, and 1/16 of Comprehensive can also be obtained. In this way, important connections between channels are highlighted and those minor ones are faded or even ignored so that the problem of visual clutter in visualization can be effectively avoided. The connectivity of brain FC by PCC, Comprehensive, and 1/8 of Comprehensive in 3D is shown in Figures 6A–C, respectively. We can find that those important connections in an analysis of cognitive states are all displayed prominently, and the visualization of brain FC in 3D becomes more clearer than those of PCC in Figure 6A and of Comprehensive in Figure 6B.
In addition, we could also find from Figure 6 that the connectivity strength between two adjacent channels is the largest. The farther the distance between two channels, the lower the connectivity strength. Furthermore, we also find the connectivity strength between channels in the Frontal lobe(F region), Arcuate Fasciculus (AF region), Parieto Occipital (PO region), and Occipital lobe(O region) is usually greater than that in other brain regions.
4.3.2. Visualization Between Brain Regions
Because Comprehensive is commonly used to measure the connectivity between two channels in the same brain region, it is not applicable to measure the connectivity strength between different brain regions and between left and right brain hemispheres. Therefore, we employ PCC to assess the strength of connectivity between different brain regions and between left and right brain hemispheres and then visualize them in 3D.
In addition, we obtain the sum of PCC values of each pair of channels in the same brain region (Figure 7A), called PCC of the brain region, then adopt the same approach in Section 4.3.1 to calculate 1/2, 1/4, 1/8, and 1/16 of PCC of one brain region, for the avoidance of visual clutter in between-BR visualization.
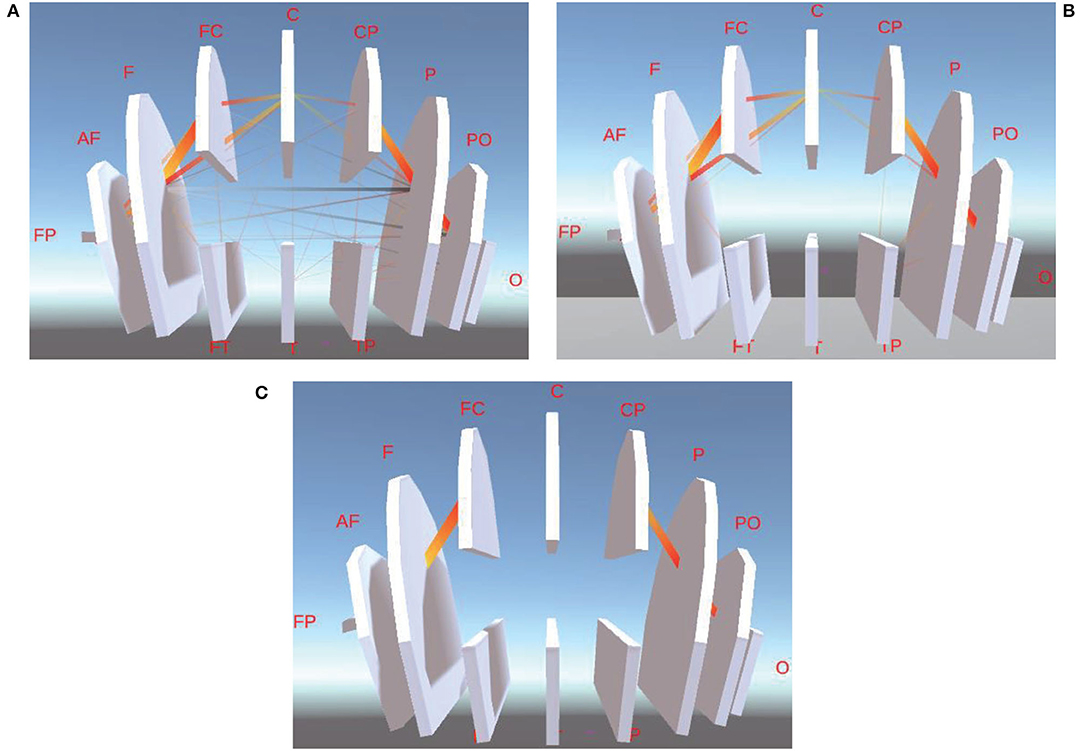
Figure 7. This is between-BR FC visualization of different ranges of PCC. (A) is between-BR FC visualization of the whole PCC. (B,C) are between-BR FC visualization of 1/2 and 1/8 of PCC.
Figures 7B,C are the between-BR connectivity of 1/2 and 1/8 of PCC, respectively. From them, we can learn that the Between-BR connectivity between the Frontal lobe and Frontal Cortex(F-FC), between Central Parietal and Parietal lobe(CP-P), and between the Parietal lobe and Parieto Occipital(P-PO) is much stronger.
4.3.3. Visualization Between Left/Right Hemisphere
Similar to Section 4.3.1, 1/2, 1/4, 1/8, and 1/16 of PCC between left and right brain hemispheres can also be obtained by summing PCC values of each pair of channels of the left and right brain hemisphere. Figure 8 shows between-L/RH FC connectivity. Figure 8A is the connectivity of PCC of the left and right brain hemispheres. Figures 8B,C show between-L/RH connectivity of 1/2 and 1/8 of PCC.
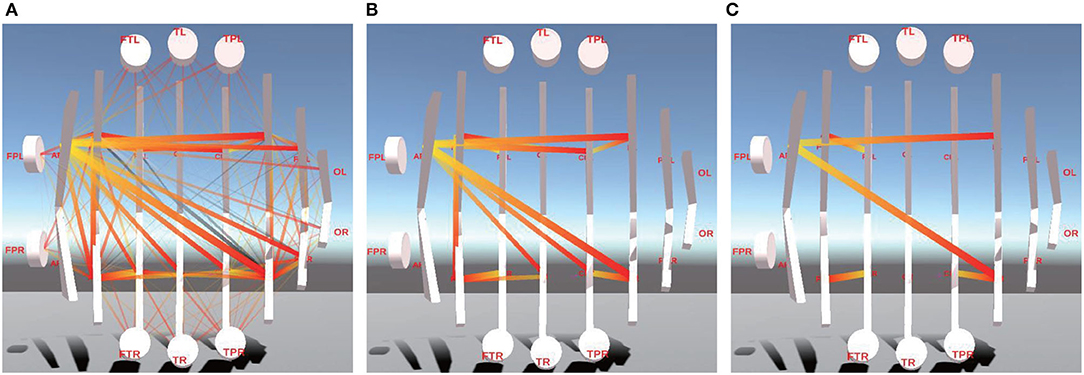
Figure 8. This is between-L/RH FC visualization of different ranges of PCC. (A) is between-L/RH FC visualization of the whole PCC. (B) is between-L/RH FC visualization of 1/2 of PCC. (C) is between-L/RH FC visualization of 1/8 of PCC.
It is obvious that the connectivity between left Arcuate Fasciculus (AFL region) and Central zone(C region), between Central Parietal (CP region) and Parietal lobe (P region), between left Frontal lobe and right Frontal lobe (FL-FR), and between left Frontal lobe and left Frontal Cortex (FL-FCL) is significantly stronger than connectivity of other L/RHs.
4.3.4. Visualization of Internal Connectivity
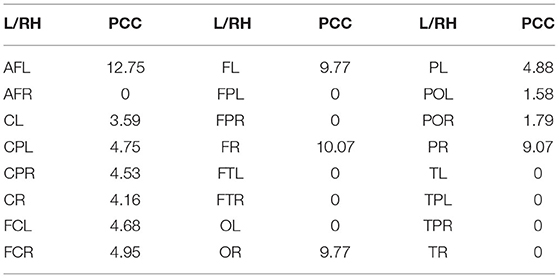
Tables 1–3 show the internal-connectivity results of the inter-hemispheres, inter-BR, and inter-L/RH, respectively. Connectivity between channels in the right hemisphere of the brain is slightly stronger than that in the left hemisphere, and the internal connectivity in the frontal lobe (F region) and parietal lobe (P region) is much stronger. In addition, the internal connectivity of the left arcuate fasciculus (AFL region) and right frontal lobe (FR region) is greatly stronger than that of other brain regions.
4.3.5. Visualization of Comparable Connectivity
Comparable Connectivity Visualization is to analyze brain FC and its differences under different cognitive states (i.e., different emotions). Similarly, the comparable FC of 1/2, 1/4, 1/8, and 1/16 of PCC can also be obtained by summing PCC between channels.
For example, we perform the connectivity comparison analysis of two emotional states: neutral and positive by using PCC and Comprehensive, as shown in Figure 9, gold-and-red lines indicate stronger connectivity than the contrast experiment. The greater the difference between the connectivity of the two recognitive states is, the thicker the line indicating connectivity is and the more opaque it is. Among them, Figure 9A shows comparable FC of PCC between channels. It can be clearly seen that the connectivity of neutral emotions is stronger than that of positive emotions near channel F7. In addition, the connectivity between other channels is weaker than that of positive emotions. Figure 9B shows comparable FC of Comprehensive between channels. The connectivity of neutral emotions becomes much more invisible for CB1 and CB2. Figures 9C,D show comparable FC of 1/2 of PCC and Comprehensive, indicating Comprehensive performs better than PCC in avoiding visual clutter.
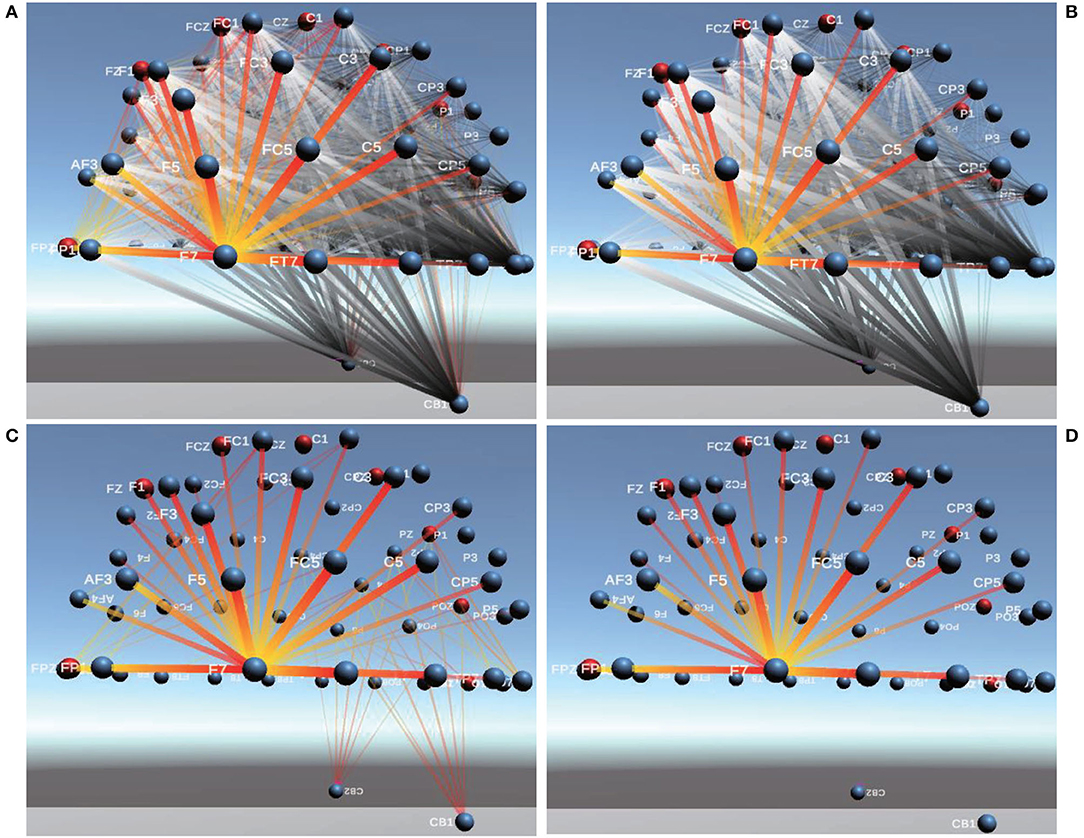
Figure 9. Comparable Connectivity Visualization of PCC and Comprehensive. (A,B) are Comparable Connectivity Visualization of PCC and Comprehensive. (C,D) are Comparable Connectivity Visualization of 1/2 of PCC and Comprehensive.
4.3.6. Visualization of Dynamic Connectivity
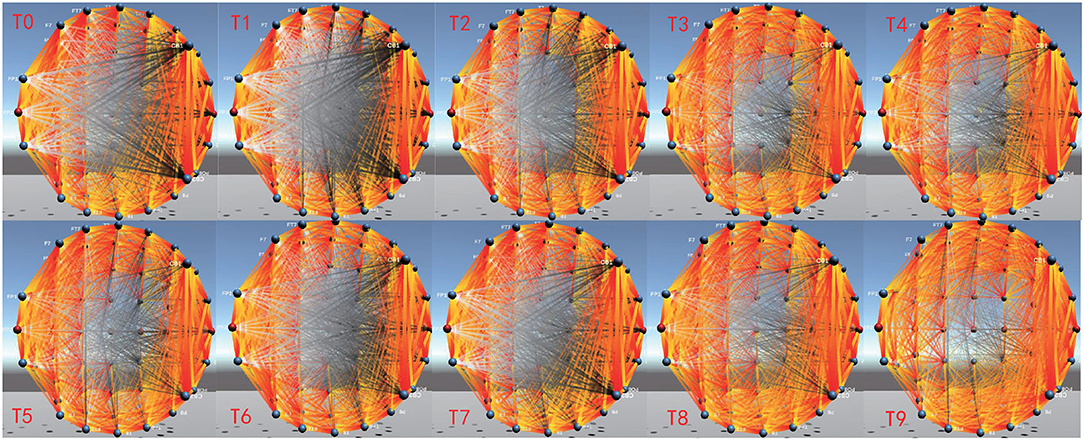
EEG-FCV can also display dynamic changes of brain FC over time through Dynamic Connectivity, which provides assistance for the dynamic evolution analysis of brain cognitive function. Figure 10 shows the FC dynamic visualization in the EEG alpha band from time T0 to T9, which is implemented by constructing a corresponding dynamic functional connectivity matrix based on PCC. Compared with the connectivity between two channels that is farther apart, the connectivity between two adjacent channels has more obvious changes over time.
5. Discussion
We design and implement EEG-FCV to analyze the connectivity of 15 participants in the SEED dataset. From the experimental results, we can further confirm the connectivity between adjacent channels is generally stronger than that between non-adjacent (also called distant) channels. Furthermore, we verify the findings of the connectivity in the frontal lobe (F region) and the arcuate fascicle (AF region) are stronger, especially in the left arcuate fascicle (AFL), as Kim found in 2007 (36). In addition, as Dasdemir found in 2017 (37), we also find that interhemispheric connectivity is weaker than intra-hemispheric connectivity.
We compare the connectivity changes of different metrics in different frequency bands. First, we find that when subjects are stimulated with negative emotion, the right hemisphere is more active than the left hemisphere, which is consistent with the results found by Alfano and Cimino (38). Therefore, positive emotions are activated relative to the left hemisphere (as measured by a reduction in the alpha band) and negative emotions are activated relative to the right hemisphere as Ahern pointed out in 1985 (39). It is known that alpha oscillatory activity plays an important role in cognitive processing (40). Our findings confirm the alpha band oscillations because the alpha bands are much more tightly connected than the electrodes in the beta band and delta band.
In the fatigue driving dataset, DROW is the most boring and monotonous task without any stimulation after nearly 2 h of driving, which can be prone to make the subject tired. While in TVA3, as a driving task with medium difficulty, the subject drives his car accompanied by video and audio stimuli, so that he is in an alert state. Therefore, we compare the connectivity differences in different frequency bands by different functional connectivity metrics between TVA3 and DROW states, respectively. We find, as we predict, that the connectivity of subjects is generally stronger during TVA3 than in the state of fatigue. Similar to the findings of Kakkos et al. (41), we also find that brain regions show much tight connection and more active interaction as workloads increase. In addition, the connectivity between the frontal lobe (F region) and the parietal lobe (P region) is generally stronger than that in other brain regions, which is also mentioned by Corbetta and Shulman (42). And the connectivity between the frontal lobe (F region) and the left arcuate fascicle (AFL region) is significantly stronger than that in other brain regions. This proves once again that the arcuate fascicle (AF region) is thought to provide connectivity for spatial attention, which is consistent with the findings of other researchers (43–46). At the same time, we find that there is a certain increase in the central regional (channel CZ) connectivity during the state of fatigue as charbonnier found in 2016 (47).
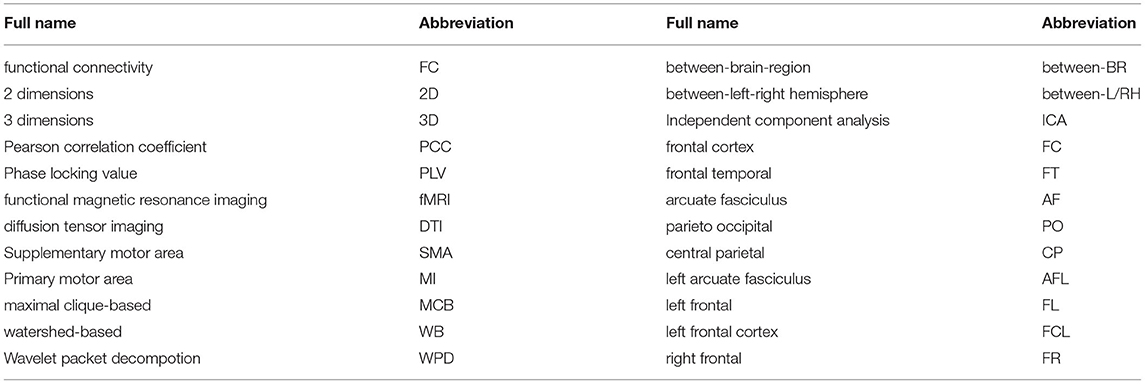
Compared with some current tools, such as EEGLab and EEGNet, EEG-FCV has realized the EEG-based analysis of brain FC and implemented the dynamic visualization in 3D with the avoidance of the visual clutter. However, EEG-FCV does not contain the subsequent statistical validation phase, which will be improved in the follow-up study to make it have better versatility in brain connectivity analysis. All full names and abbreviations are described in Table 4.
6. Conclusion
In this study, we design an EEG-based cognitive function visualization system, EEG-FCV, and validate it on the SEED emotion dataset and fatigue driving dataset. The results show that EEG-FCV can effectively display the visualization effect of functional connectivity of EEG data in different frequency bands using PCC, correlation, and PLV. In order to solve the problem of visual clutter, we also propose a novel metric of Comprehensive, which can effectively display the difference in connectivity results and visualize brain FC much more clearly. We believe EEG-FCV can be useful in promoting EEG-based brain FC analysis and visualization.
Data Availability Statement
Publicly available datasets were analyzed in this study. This data can be found here: https://bcmi.sjtu.edu.cn/home/seed/downloads.html; https://www.mdpi.com/1424-8220/21/7/2369/.
Author Contributions
HZ: writing-review, editing, supervision, and funding acquisition. YJ: conceptualization, methodology, software, and writing-original draft. QW: writing-original draft. DP and FX: validation. YZ: project administration. HH: supervision. WK: supervision and funding acquisition. All authors contributed to the article and approved the submitted version.
Funding
This study is partly supported by the National Key R&D Program of China with Grant No. 2017YFE0116800 and partly supported by NSFC with Grant No. 62076083. The authors also thank the National International Joint Research Center for Brain-Machine Collaborative Intelligence with Grant No. 2017B01020, Key Laboratory of Brain Machine Collaborative Intelligence of Zhejiang Province with Grant No. 2020E10010.
Conflict of Interest
The authors declare that the research was conducted in the absence of any commercial or financial relationships that could be construed as a potential conflict of interest.
The handling editor declared a past collaboration with one of the authors HZ.
Publisher's Note
All claims expressed in this article are solely those of the authors and do not necessarily represent those of their affiliated organizations, or those of the publisher, the editors and the reviewers. Any product that may be evaluated in this article, or claim that may be made by its manufacturer, is not guaranteed or endorsed by the publisher.
References
1. Han SD, Arfanakis K, Fleischman DA, Leurgans SE, Tuminello ER, Edmonds EC, et al. Functional connectivity variations in mild cognitive impairment: associations with cognitive function. J Int Neuropsychol Soc. (2012) 18:39–48. doi: 10.1017/S1355617711001299
2. Zheng G, Lei Y, Li Y, Zhang W, Su J, Qi X, et al. Changes in brain functional network connectivity in adult moyamoya diseases. Cogn Neurodyn. (2021) 15:861–72. doi: 10.1007/s11571-021-09666-1
3. Sivaranjini S, Sujatha C. Morphological analysis of subcortical structures for assessment of cognitive dysfunction in Parkinson's disease using multi-atlas based segmentation. Cogn Neurodyn. (2021) 15:835–45. doi: 10.1007/s11571-021-09671-4
4. Tona F, Petsas N, Sbardella E, Prosperini L, Carmellini M, Pozzilli C, et al. Multiple sclerosis: altered thalamic resting-state functional connectivity and its effect on cognitive function. Radiology. (2014) 271:814–21. doi: 10.1148/radiol.14131688
5. Imperatori C, Panno A, Giacchini M, Massullo C, Carbone GA, Clerici M, et al. Electroencephalographic correlates of body shape concerns: an eLORETA functional connectivity study. Cogn Neurodyn. (2020) 14:723–9. doi: 10.1007/s11571-020-09618-1
6. Hampson M, Driesen N, Roth JK, Gore JC, Constable RT. Functional connectivity between task-positive and task-negative brain areas and its relation to working memory performance. Magn Reson Imaging. (2010) 28:1051–7. doi: 10.1016/j.mri.2010.03.021
7. Waites AB, Stanislavsky A, Abbott DF, Jackson GD. Effect of prior cognitive state on resting state networks measured with functional connectivity. Hum Brain Mapp. (2005) 24:59–68. doi: 10.1002/hbm.20069
8. Lee L, Harrison LM, Mechelli A. A report of the functional connectivity workshop, Dusseldorf 2002. Neuroimage. (2003) 19:457–65. doi: 10.1016/S1053-8119(03)00062-4
9. Friston K, Frith C, Frackowiak R. Time-dependent changes in effective connectivity measured with PET. Hum Brain Mapp. (1993) 1:69–79. doi: 10.1002/hbm.460010108
10. Honey CJ, Sporns O, Cammoun L, Gigandet X, Thiran JP, Meuli R, et al. Predicting human resting-state functional connectivity from structural connectivity. Proc Natl Acad Sci USA. (2009) 106:2035–40. doi: 10.1073/pnas.0811168106
11. Yang T, Dong X, Lei X. Hard to initiate sleep: a new paradigm for resting-state fMRI. Cogn Neurodyn. (2021) 15:825–33. doi: 10.1007/s11571-020-09659-6
12. Van Den Heuvel MP, Pol HEH. Exploring the brain network: a review on resting-state fMRI functional connectivity. Eur Neuropsychopharmacol. (2010) 20:519–34. doi: 10.1016/j.euroneuro.2010.03.008
13. Koch MA, Norris DG, Hund-Georgiadis M. An investigation of functional and anatomical connectivity using magnetic resonance imaging. Neuroimage. (2002) 16:241–50. doi: 10.1006/nimg.2001.1052
14. Egner T, Jamieson G, Gruzelier J. Hypnosis decouples cognitive control from conflict monitoring processes of the frontal lobe. Neuroimage. (2005) 27:969–78. doi: 10.1016/j.neuroimage.2005.05.002
15. Di Lorenzo G, Daverio A, Ferrentino F, Santarnecchi E, Ciabattini F, Monaco L, et al. Altered resting-state EEG source functional connectivity in schizophrenia: the effect of illness duration. Front Hum Neurosci. (2015) 9:234. doi: 10.3389/fnhum.2015.00234
16. Valizadeh SA, Riener R, Elmer S, Jäncke L. Decrypting the electrophysiological individuality of the human brain: identification of individuals based on resting-state EEG activity. Neuroimage. (2019) 197:470–81. doi: 10.1016/j.neuroimage.2019.04.005
17. Alba A, Marroquin JL, Pe na J, Harmony T, Gonzalez-Frankenberger B. Exploration of event-induced EEG phase synchronization patterns in cognitive tasks using a time-frequency-topography visualization system. J Neurosci Methods. (2007) 161:166–82. doi: 10.1016/j.jneumeth.2006.10.018
18. Ten Caat M, Maurits NM, Roerdink JB. Data-driven visualization and group analysis of multichannel EEG coherence with functional units. IEEE Trans Vis Comput Graph. (2008) 14:756–71. doi: 10.1109/TVCG.2008.21
19. Hassan M, Shamas M, Khalil M, El Falou W, Wendling F. EEGNET: an open source tool for analyzing and visualizing M/EEG connectome. PLoS ONE. (2015) 10:e0138297. doi: 10.1371/journal.pone.0138297
20. Peyk P, De Cesarei A, Junghöfer M. ElectroMagnetoEncephalography software: overview and integration with other EEG/MEG toolboxes. Comput Intell Neurosci. (2011) 2011:861705. doi: 10.1155/2011/861705
21. Aguera PE, Jerbi K, Caclin A, Bertrand O. ELAN: a software package for analysis and visualization of MEG, EEG, and LFP signals. Comput Intell Neurosci. (2011) 2011:158970. doi: 10.1155/2011/158970
22. Risqiwati D, Wibawa AD, Pane ES, Islamiyah WR, Tyas AE, Purnomo MH. Feature selection for EEG-based fatigue analysis using pearson correlation. In: 2020 International Seminar on Intelligent Technology and Its Applications (ISITIA). Surabaya: IEEE (2020). p. 164–9.
23. Duffy FH, Als H. A stable pattern of EEG spectral coherence distinguishes children with autism from neuro-typical controls-a large case control study. BMC Med. (2012) 10:1–19. doi: 10.1186/1741-7015-10-64
24. La Rocca D, Campisi P, Vegso B, Cserti P, Kozmann G, Babiloni F, et al. Human brain distinctiveness based on EEG spectral coherence connectivity. IEEE Trans Biomed Eng. (2014) 61:2406–12. doi: 10.1109/TBME.2014.2317881
25. Wang Y, Hong B, Gao X, Gao S. Phase synchrony measurement in motor cortex for classifying single-trial EEG during motor imagery. Conf Proc IEEE Eng Med Biol Soc. (2006) 2006:75–8. doi: 10.1109/IEMBS.2006.259673
26. Sadaghiani S, Scheeringa R, Lehongre K, Morillon B, Giraud AL, d'Esposito M, et al. Alpha-band phase synchrony is related to activity in the fronto-parietal adaptive control network. J Neurosci. (2012) 32:14305–10. doi: 10.1523/JNEUROSCI.1358-12.2012
27. Balasubramanian G, Kanagasabai A, Mohan J, Seshadri NG. Music induced emotion using wavelet packet decomposition EEG study. Biomed Signal Process Control. (2018) 42:115–28. doi: 10.1016/j.bspc.2018.01.015
28. Kevric J, Subasi A. Comparison of signal decomposition methods in classification of EEG signals for motor-imagery BCI system. Biomed Signal Process Control. (2017) 31:398–406. doi: 10.1016/j.bspc.2016.09.007
29. Ting W, Guo-Zheng Y, Bang-Hua Y, Hong S. EEG feature extraction based on wavelet packet decomposition for brain computer interface. Measurement. (2008) 41:618–25. doi: 10.1016/j.measurement.2007.07.007
30. Zheng WL, Lu BL. Investigating critical frequency bands and channels for EEG-based emotion recognition with deep neural networks. IEEE Trans Auton Ment Dev. (2015) 7:162–75. doi: 10.1109/TAMD.2015.2431497
31. Duan RN, Zhu JY, Lu BL. Differential entropy feature for EEG-based emotion classification. In: 6th International IEEE/EMBS Conference on Neural Engineering (NER). San Diego, CA: IEEE (2013). p. 81–4.
32. Jung TP, Makeig S, Humphries C, Lee TW, Mckeown MJ, Iragui V, et al. Removing electroencephalographic artifacts by blind source separation. Psychophysiology. (2000) 37:163–78. doi: 10.1111/1469-8986.3720163
33. Zeng H, Yang C, Dai G, Qin F, Zhang J, Kong W. EEG classification of driver mental states by deep learning. Cogn Neurodyn. (2018) 12:597–606. doi: 10.1007/s11571-018-9496-y
34. Zeng H, Li X, Borghini G, Zhao Y, Aricò P, Di Flumeri G, et al. An EEG-based transfer learning method for cross-subject fatigue mental state prediction. Sensors. (2021) 21:2369. doi: 10.3390/s21072369
35. Zhao Y, Dai G, Borghini G, Zhang J, Li X, Zhang Z, et al. Label-based alignment multi-source domain adaptation for cross-subject EEG fatigue mental state evaluation. Front Hum Neurosci. (2021) 546:706270. doi: 10.3389/fnhum.2021.706270
36. Kim SH, Hamann S. Neural correlates of positive and negative emotion regulation. J Cogn Neurosci. (2007) 19:776–98. doi: 10.1162/jocn.2007.19.5.776
37. Dasdemir Y, Yildirim E, Yildirim S. Analysis of functional brain connections for positive-negative emotions using phase locking value. Cogn Neurodyn. (2017) 11:487–500. doi: 10.1007/s11571-017-9447-z
38. Alfano KM, Cimino CR. Alteration of expected hemispheric asymmetries: valence and arousal effects in neuropsychological models of emotion. Brain Cogn. (2008) 66:213–20. doi: 10.1016/j.bandc.2007.08.002
39. Ahern GL, Schwartz GE. Differential lateralization for positive and negative emotion in the human brain: EEG spectral analysis. Neuropsychologia. (1985) 23:745–55. doi: 10.1016/0028-3932(85)90081-8
40. Başar E, Güntekin B. A short review of alpha activity in cognitive processes and in cognitive impairment. Int J Psychophysiol. (2012) 86:25–38. doi: 10.1016/j.ijpsycho.2012.07.001
41. Kakkos I, Dimitrakopoulos GN, Gao L, Zhang Y, Qi P, Matsopoulos GK, et al. Mental workload drives different reorganizations of functional cortical connectivity between 2D and 3D simulated flight experiments. IEEE Trans Neural Syst Rehabil Eng. (2019) 27:1704–13. doi: 10.1109/TNSRE.2019.2930082
42. Corbetta M, Shulman GL. Control of goal-directed and stimulus-driven attention in the brain. Nat Rev Neurosci. (2002) 3:201–15. doi: 10.1038/nrn755
43. Bartolomeo P, Thiebaut de Schotten M, Doricchi F. Left unilateral neglect as a disconnection syndrome. Cereb Cortex. (2007) 17:2479–90. doi: 10.1093/cercor/bhl181
44. He BJ, Snyder AZ, Vincent JL, Epstein A, Shulman GL, Corbetta M. Breakdown of functional connectivity in frontoparietal networks underlies behavioral deficits in spatial neglect. Neuron. (2007) 53:905–18. doi: 10.1016/j.neuron.2007.02.013
45. Schmahmann JD, Pandya DN, Wang R, Dai G, D'Arceuil HE, de Crespigny AJ, et al. Association fibre pathways of the brain: parallel observations from diffusion spectrum imaging and autoradiography. Brain. (2007) 130:630–53. doi: 10.1093/brain/awl359
46. Doricchi F, de Schotten MT, Tomaiuolo F, Bartolomeo P. White matter (dis) connections and gray matter (dys) functions in visual neglect: gaining insights into the brain networks of spatial awareness. cortex. (2008) 44:983–95. doi: 10.1016/j.cortex.2008.03.006
Keywords: EEG, functional connectivity, Comprehensive, brain cognitive function, visualization
Citation: Zeng H, Jin Y, Wu Q, Pan D, Xu F, Zhao Y, Hu H and Kong W (2022) EEG-FCV: An EEG-Based Functional Connectivity Visualization Framework for Cognitive State Evaluation. Front. Psychiatry 13:928781. doi: 10.3389/fpsyt.2022.928781
Received: 26 April 2022; Accepted: 14 June 2022;
Published: 11 July 2022.
Edited by:
Gianluca Borghini, Sapienza University of Rome, ItalyCopyright © 2022 Zeng, Jin, Wu, Pan, Xu, Zhao, Hu and Kong. This is an open-access article distributed under the terms of the Creative Commons Attribution License (CC BY). The use, distribution or reproduction in other forums is permitted, provided the original author(s) and the copyright owner(s) are credited and that the original publication in this journal is cited, in accordance with accepted academic practice. No use, distribution or reproduction is permitted which does not comply with these terms.
*Correspondence: Wanzeng Kong, a29uZ3dhbnplbmdAaGR1LmVkdS5jbg==
 Hong Zeng
 Yanping Jin1
 Yue Zhao
 Wanzeng Kong