 Jingxuan Zhang
 Kuiliang Li
 Yitong Xue
 Zhengzhi Feng
95% of researchers rate our articles as excellent or good
Learn more about the work of our research integrity team to safeguard the quality of each article we publish.
Find out more
ORIGINAL RESEARCH article
Front. Psychiatry , 17 June 2022
Sec. Public Mental Health
Volume 13 - 2022 | https://doi.org/10.3389/fpsyt.2022.916332
This article is part of the Research Topic Psychological Distress in Healthy, Vulnerable, and Diseased Groups: Neurobiological and Psychosocial Bases, Detection Methods, and Creative Management Strategies View all 12 articles
Objective: Both impulsiveness and trait depression are the trait-level risk factors for depressive symptoms. However, the two traits overlap and do not affect depressive symptoms independently. This study takes impulsiveness and trait depression into a whole construct, aiming to find the complex associations among all facets and explore their relative importance in a trait network. It can help us find the key facets that need consideration in preventing depression.
Materials and Methods: We used the Barratt Impulsiveness Scale (BIS) and Trait Depression Scale (T-DEP) as measuring tools, conducted network analysis, and applied the Graphic Least Absolute Shrinkage and Selection Operator (GLASSO) algorithm to estimate the network structure and compute the linkage and centrality indexes. The accuracy and stability of the indexes were estimated through bootstrapping. All the computations were performed by R script and packages.
Results: We found that “trait anhedonia” was connected with “non-planning” and “cognitive” impulsiveness, while “trait dysthymia” was connected with “motor” impulsiveness. “Cognitive” impulsiveness had a statistically significant higher expected influence than “motor” impulsiveness and had the trend to be dominant in the network. “Trait dysthymia” had a statistically significant higher bridge expected influence than “cognitive” impulsiveness and had the trend to be the key facet linking impulsiveness with trait depression. “Non-only children” had higher network global strength than “only children.” All indexes were accurate and stable.
Conclusion: The present study confirms the complex associations among facets of trait depression and impulsiveness, finding that “cognitive” impulsiveness and “trait dysthymia” are the two key factors in the network. The results imply that different facets of impulsiveness should be considered respectively regarding anhedonia and dysthymia. “Cognitive” impulsiveness and “trait dysthymia” are critical to the prevention of depression.
Impulsiveness is an important risk factor for several mental disorders, including depression (1–3). The causal effect of impulsiveness on depression is confirmed by a longitudinal study (3). This indicates that impulsiveness is a vulnerability to depression. However, as assessed by the big-five personality inventory, trait depression predicts depressive symptoms, while impulsiveness does not (4). Trait depression and impulsiveness are two correlated facets of the domain “Neuroticism” (5), which is also verified when the two traits are measured by independent scales (6). Consequently, we infer that impulsiveness does not predict depressive symptoms independently but acts as an overlapped vulnerability with trait depression. Therefore, it is necessary to put the two traits together rather than to view them as independent factors of depression. However, both impulsiveness and trait depression are complex concepts, including distinct facets. It is not clear enough which facets are dominant or how the two traits are correlated with each other on the facet level. This is critical to understand the trait basis of depression and to take proper measures for prevention.
There are different models of impulsiveness. In the neurocognitive domain, Fineberg et al. (7, 8) divided impulsiveness into the motor, disadvantageous decision-making, choice, and reflection. Barratt’s model, in turn, regards impulsiveness as a trait and also includes neurocognitive-related components, which are widely used in studies. It divides impulsiveness into the following three facets: “non-planning,” “motor,” and “cognitive” (9) (refer to Supplementary Table 1 for facets and definitions). Both Eysenck’s personality model (10) and the big-five personality model (5) include a depressive trait component, but do not consider the core feature of depression, i.e., anhedonia. Spielberger’s model divides depression into anhedonia (lack of pleasure) and dysthymia (existence of despondent mood) (11), which can well cover the core features of depression (12). Meanwhile, Spielberger’s model includes both state and trait depression. Different from state depression which refers to depressive symptoms or emotions now, trait depression, which includes “trait anhedonia” and “trait dysthymia,” represents general depressive feelings throughout a long period of time (11, 13).
There is evidence that various facets of impulsiveness are associated with depression. The self-reported facets, such as “urgency” (14–16), “lack of perseverance” (16), “inattention,” “lack of planning,” and “inability in controlling temper or behavior” (17), are positively correlated with depression. In addition, the behavioral-measured impulsive decision-making and disinhibition of response are significantly different in depressive participants compared to the control groups (2). However, the above studies do not consider trait-level depression and its facets.
Although there are few studies discussing the relationships between trait anhedonia and impulsiveness or between trait dysthymia and impulsiveness, existing evidence shows that state (or diagnosed) anhedonia and dysthymia are related to different kinds of impulsiveness. Some studies reveal that state anhedonia and impulsiveness are positively correlated (18, 19), while others find negative associations (20, 21). It may be due to the use of different concepts of impulsiveness [e.g., dysfunctional impulsiveness (19), impulsive personality (18), and delay discounting rate (20)]. The relationship between state dysthymia and impulsiveness is unknown with few studies discussing it. Nevertheless, there is evidence that state dysthymia co-occurs with borderline personality disorder (22, 23), which shows impulsive features. Above all, whether different facets of impulsiveness and trait depression are correlated is not clear.
We do not find any study discussing the relative importance of different facets of impulsiveness and trait depression. Therefore, we cannot come up with a hypothesis about which facet is dominant in the construct. However, there is indirect information about the associations between the facets of depression and impulsiveness. Reward processing impairment is one of the core features of anhedonia in depression (24). Depressive patients with anhedonia show reduced positive emotions for the future reward, which is explained as a lack of anticipatory pleasure (25). This symptom presents a kind of non-planning-for-the-future character, which is also included in Barratt’s impulsiveness model (9). Mood distress, as one of the features of dysthymia, is related to cognitive control (26) that is associated with lacking cognitive or behavioral inhibition. This indicates that dysthymia may be correlated with another two factors of Barratt’s model, namely, “motor” and “cognitive” (9).
Therefore, in the present study, we take Spielberger’s state-trait depression model (11) and Barratt’s impulsiveness model (9, 27) to explore the relative importance and complex relationship between the facets of trait depression and impulsiveness. Simultaneously, we are aiming to find the key facets that link the two traits and to explore whether the demographic variables can influence the whole correlation pattern and the total correlation strength of all the facets. Network analysis is a suitable method to cover both the analyses of intercorrelations (represented by edge weight) and relative importance (represented by centrality indexes) (28). It can also consider the linkage of one variable among two or more communities (29), compare the whole correlation patterns and the total correlation strength between different populations (30), and give clear visualized results (28). These are not what the traditional correlation analysis possesses. Therefore, we apply network analysis (28), which includes all the trait facets in a network with all facets as nodes and associations as edges, covering both the analyses of intercorrelations (represented by edge weight) and relative importance (represented by centrality indexes). According to the association pattern on the state (or diagnostic) level mentioned above, we hypothesize that “trait anhedonia” is more closely connected with “non-planning” impulsiveness, while “trait dysthymia” is more closely connected with “motor” and “cognitive” impulsiveness. Regarding the relative importance of the facets and the other study objectives, we refer to the posterior results.
A total of 295 participants (female = 181, male = 113, not report gender = 1) who were under 40 years (mean = 20.71, SD = 2.97) were recruited initially. All the participants were youth studying in academies or working in Chongqing, China. They completed a paper version of the Trait Depression Scale (T-DEP) and Barratt Impulsiveness Scale (BIS) under the instruction of surveyors. We rejected 21 participants because they reported psychopathological family history or clinical history. The valid sample contained 274 participants (female = 167, male = 106, not report = 1), aging from 17 to 34 years (mean = 20.70, SD = 3.01) (refer to Table 1). There were 10 participants who had missing values in the two scales (seven participants with one missing value and three participants with two missing values each) [refer to Figure 1 for the PRISMA diagram (31) of the participants’ recruitment process]. We addressed these missing values with multiple imputation. This imputation method generates two or more values for each missing value through a certain algorithm and creates several imputation datasets. Researchers choose one or took the average of all datasets for the analysis (32). In this study, we used R “mice” package (33), applying a predictive mean matching algorithm to process multiple imputations. There were one and five participants who had missing values in gender and “only child” variables, respectively. These participants were rejected when gender or “only child” was considered in the network comparisons.
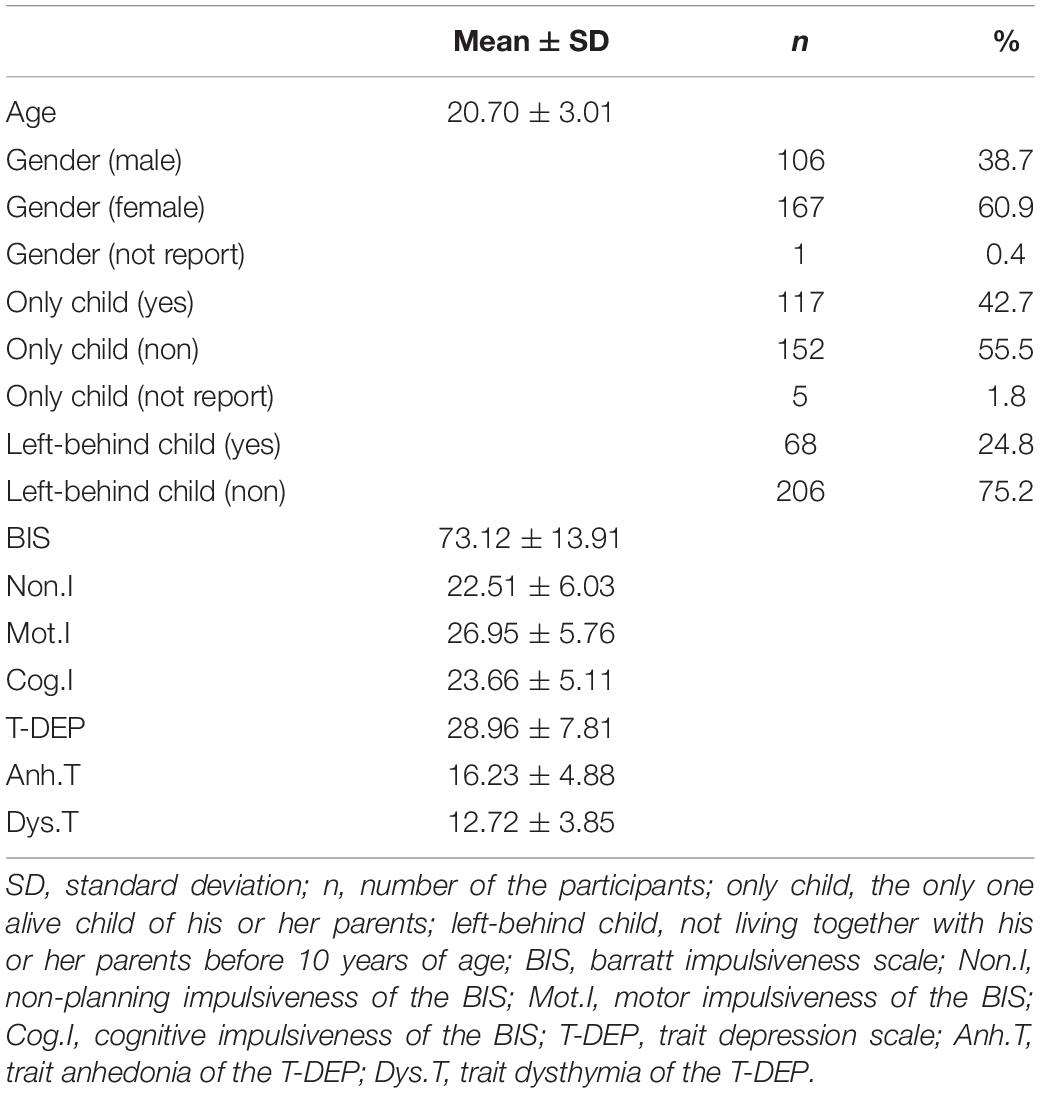
Table 1. Demographic information and descriptive statistics.
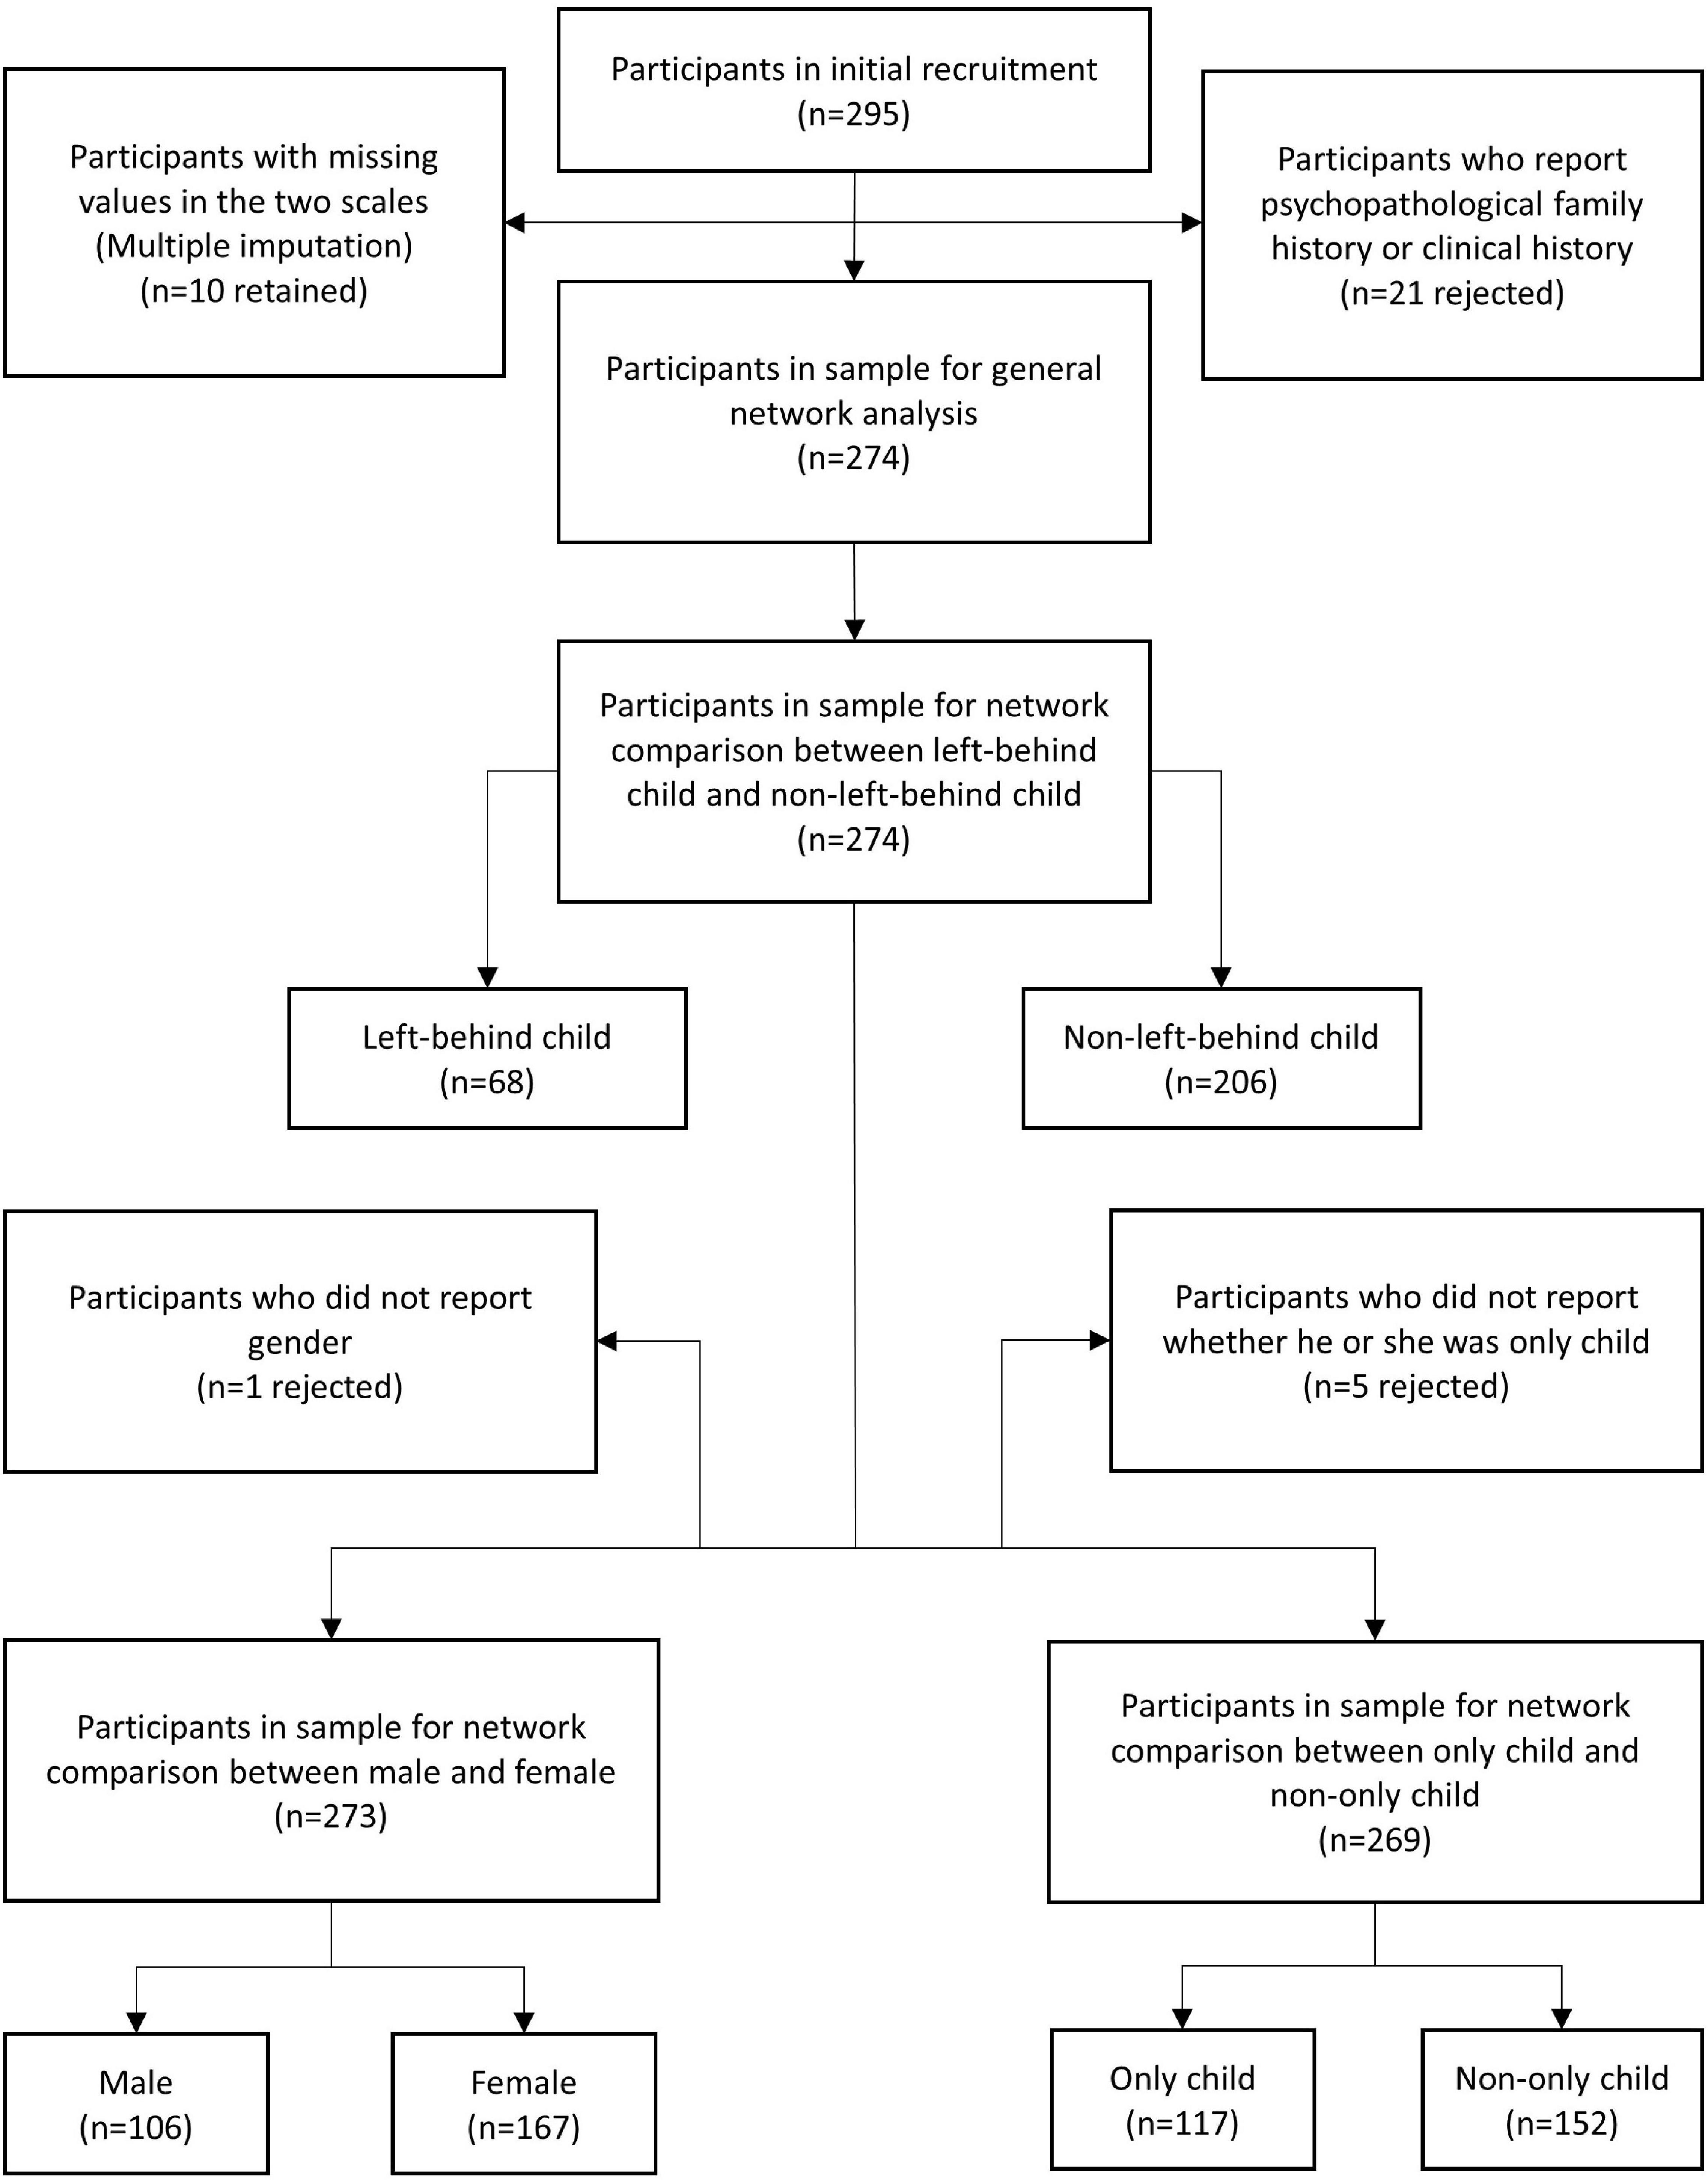
Figure 1. The PRISMA diagram of the participants’ recruitment process. “n” represented the sample size.
The Trait Depression Scale is a subscale of the State Trait Depression Scale (ST-DEP) developed by Charles D. Spielberger in 1995 (11). Unlike the Zung Self-Rating Depression Scale (SDS) (34) and Beck Depression Inventory (BDI) (35), it is used to measure one’s long-term depressive emotion (trait) rather than the state within 1 or 2 weeks. In addition, ST-DEP neglects the items relevant to somatization, retaining the items reflecting cognition and emotion, which are divided into two facets in both the S-DEP and T-DEP, namely, euthymia and dysthymia. Euthymia is the “existence of positive affect,” while dysthymia is the “existence of negative affect” (11). Given that the euthymia subscale is reversely scored, it represents “lack of positive affect,” namely, “anhedonia.” The scale consists of thirty-two items, with sixteen items each in the S-DEP and T-DEP. Of the sixteen items of the T-DEP, eight items represent anhedonia, and the other eight items represent dysthymia. The Chinese version was translated and revised by Lei et al. (36). The reliability and construct validity of both the S-DEP and T-DEP were demonstrated among samples from college students (36). In this study, the T-DEP was shown to be reliable, with McDonald’s omega values of 0.910 (95% CI = [0.892, 0.928]) and 0.861 (95% CI = [0.831, 0.892]) in anhedonia and dysthymia subscales, respectively.
The Barratt Impulsiveness Scale was originally developed by Barratt (37). It has been widely used to evaluate impulsive traits and behavioral patterns of healthy individuals or those who have impulse control disorder, borderline personality disorder, or other relevant mental disorders (9). There are thirty items in BIS, which are divided into three subscales, namely, “non-planning,” “motor,” and “cognitive” impulsiveness, representing “lack of forethought,” “acting without inhibition,” and “acting without thinking,” respectively. Li and Philips translated the 11th version of the BIS into Chinese (Barratt Impulsiveness Scale 11th Chinese version, BIS-11-CV) (38), and they retained six items, revised five items, and replaced nineteen items. The reliability and validity of the BIS-11-CV have been shown to be good among Chinese samples from communities and colleges (27). However, according to Li and Philips’ study (38), Item 13 (one item for “non-planning” impulsiveness) is more likely a feature of “cognitive” impulsiveness, while Item 24 (one item for “cognitive” impulsiveness) is more likely a feature of “motor” impulsiveness. We accepted the conclusion in this study; thus, the BIS-11-CV had good reliability with a coefficient of internal consistency in the present sample. The McDonald’s omega values of the three subscales were 0.872 (95% CI = [0.844, 0.900]), 0.836 (95% CI = [0.806, 0.867]), and 0.846 (95% CI = [0.812, 0.881]).
Demographic information and descriptive statistics were analyzed using IBM SPSS Statistics version 20.0 (39).
RStudio version 1.4 with R 4.0.4 was used to conduct the network analyses (40).
Gaussian graphical model (GGM) (41) is the basic method of cross-sectional network analysis. Based on GGM, the partial correlation model (PCM) (41) can eliminate spurious correlation. This study used the Graphic Least Absolute Shrinkage and Selection Operator (GLASSO) algorithm (42) to estimate the partial correlations of each observed variable, which could shrink the weak correlations to zero within the network to obtain a more stable network. The GLASSO algorithm was applied with the EBICglasso function of the R “qgraph” package (43). The network was visualized as nodes and edges of different colors and thicknesses. The red edges represent negative partial correlations, while the blue edges represent positive partial correlations. Thicker and darker edges represent stronger strength of correlations.
Centrality represents the numbers, strength, and closeness of the correlations of one node with others in a network. The basic indexes of centrality are degree, closeness, and betweenness (43). Closeness and betweenness include “short path length, SPL” (28), considering all the direct and indirect correlations of one node with others, which allows the importance of the node to be evaluated. In the weighted network, the sum of weights of all edges of one node represents the centrality index, which is named “strength.” Studies have shown the strength centrality to be more stable than closeness and betweenness (44, 45). However, for a network with both positive and negative edges, a previous study has shown that “expected influence,” which is the sum of the value of all edges connecting to one node, is more appropriate (46). In the present study, the expected influence was chosen to represent the centrality index.
These two indexes were calculated by the R “bootnet” package (47). Because centrality statistics can be unreliable, accuracy and stability analyses were necessary. Therefore, the post-hoc stability and accuracy analyses were conducted. The 95% confidence intervals (95% CIs) were calculated for the accuracy of edge weights with bootstrapping. The narrower the 95% CI was, the more accurate the edge weights were. The recommended value of edge weight accuracy is not less than 0.5 (47). The stability of centrality indexes was estimated by calculating the correlation stability (CS) coefficient with case-dropping bootstrapping. The CS coefficient should not be lower than 0.25 and better be more than 0.5 (47).
The Bridge indexes are usually used to describe overlapping nodes in studies on mental disorders (48). The bridge expected influence can indicate the risk of contagion among different disorders (29). In this study, the bridge expected influence was applied to illustrate the overlap of the two traits to prove that those who were vulnerable to depression had certain characteristics of impulsiveness. It was calculated by the R package “networktools” (49). The higher the bridge expected influence was, the greater the overlap was.
To examine the effects of gender (male and female), “only child” (only child and non-only child), and “left-behind child” (left-behind child and non-left-behind child) on the network, we conducted network comparisons by the R “NetworkComparisonTest” package, applying permutation test to compare the network invariance (the network structure pattern) and the global strength invariance (the sum of the weight of the edges within the network) (30). The network comparisons for the three factors were performed, respectively.
The demographic information and descriptive statistics are shown in Table 1.
The network of trait depression and impulsiveness is shown in Figure 2. Eight of ten possible connections were not zero. Within trait depression, “trait anhedonia” and “trait dysthymia” were closely connected, with an edge weight of 0.400. Within impulsiveness, “cognitive” impulsiveness was linked with “non-planning” and “motor” impulsiveness with the edge weights of 0.515 and 0.271, respectively, while “non-planning” and “motor” impulsiveness were connected, with an edge weight of 0.006. Between the two traits, “trait anhedonia” was related to “non-planning” impulsiveness (weight = 0.193) and “cognitive” impulsiveness (weight = 0.157), and “trait dysthymia” was connected with “motor” impulsiveness (weight = 0.309) and “non-planning” impulsiveness (weight = 0.089). Among these, the weights of the edges “Mot.I–Dys.T” and “Non.I–Dys.T” were neither significantly different (95% CIbootstrap = [–0.002, 0.459]) nor were the weights of the edges “Non.I–Anh.T” and “Cog.I–Anh.T” (95% CIbootstrap = [–0.301, 0.246]) (refer to Table 2). Meanwhile, the weight of the edge “Non.I–Cog.I” was significantly larger than those of “Mot.I–Cog.I” (95% CIbootstrap = [0.045, 0.454]) and “Non.I–Mot.I” (95% CIbootstrap = [0.258, 0.687]) (refer to Table 2). The weights of the edges “Cog.I–Dys.T” and “Mot.I–Anh.T” were shrunk to zero after applying the GLASSO algorithm, which indicated that these two linkages were of the least importance in this network.
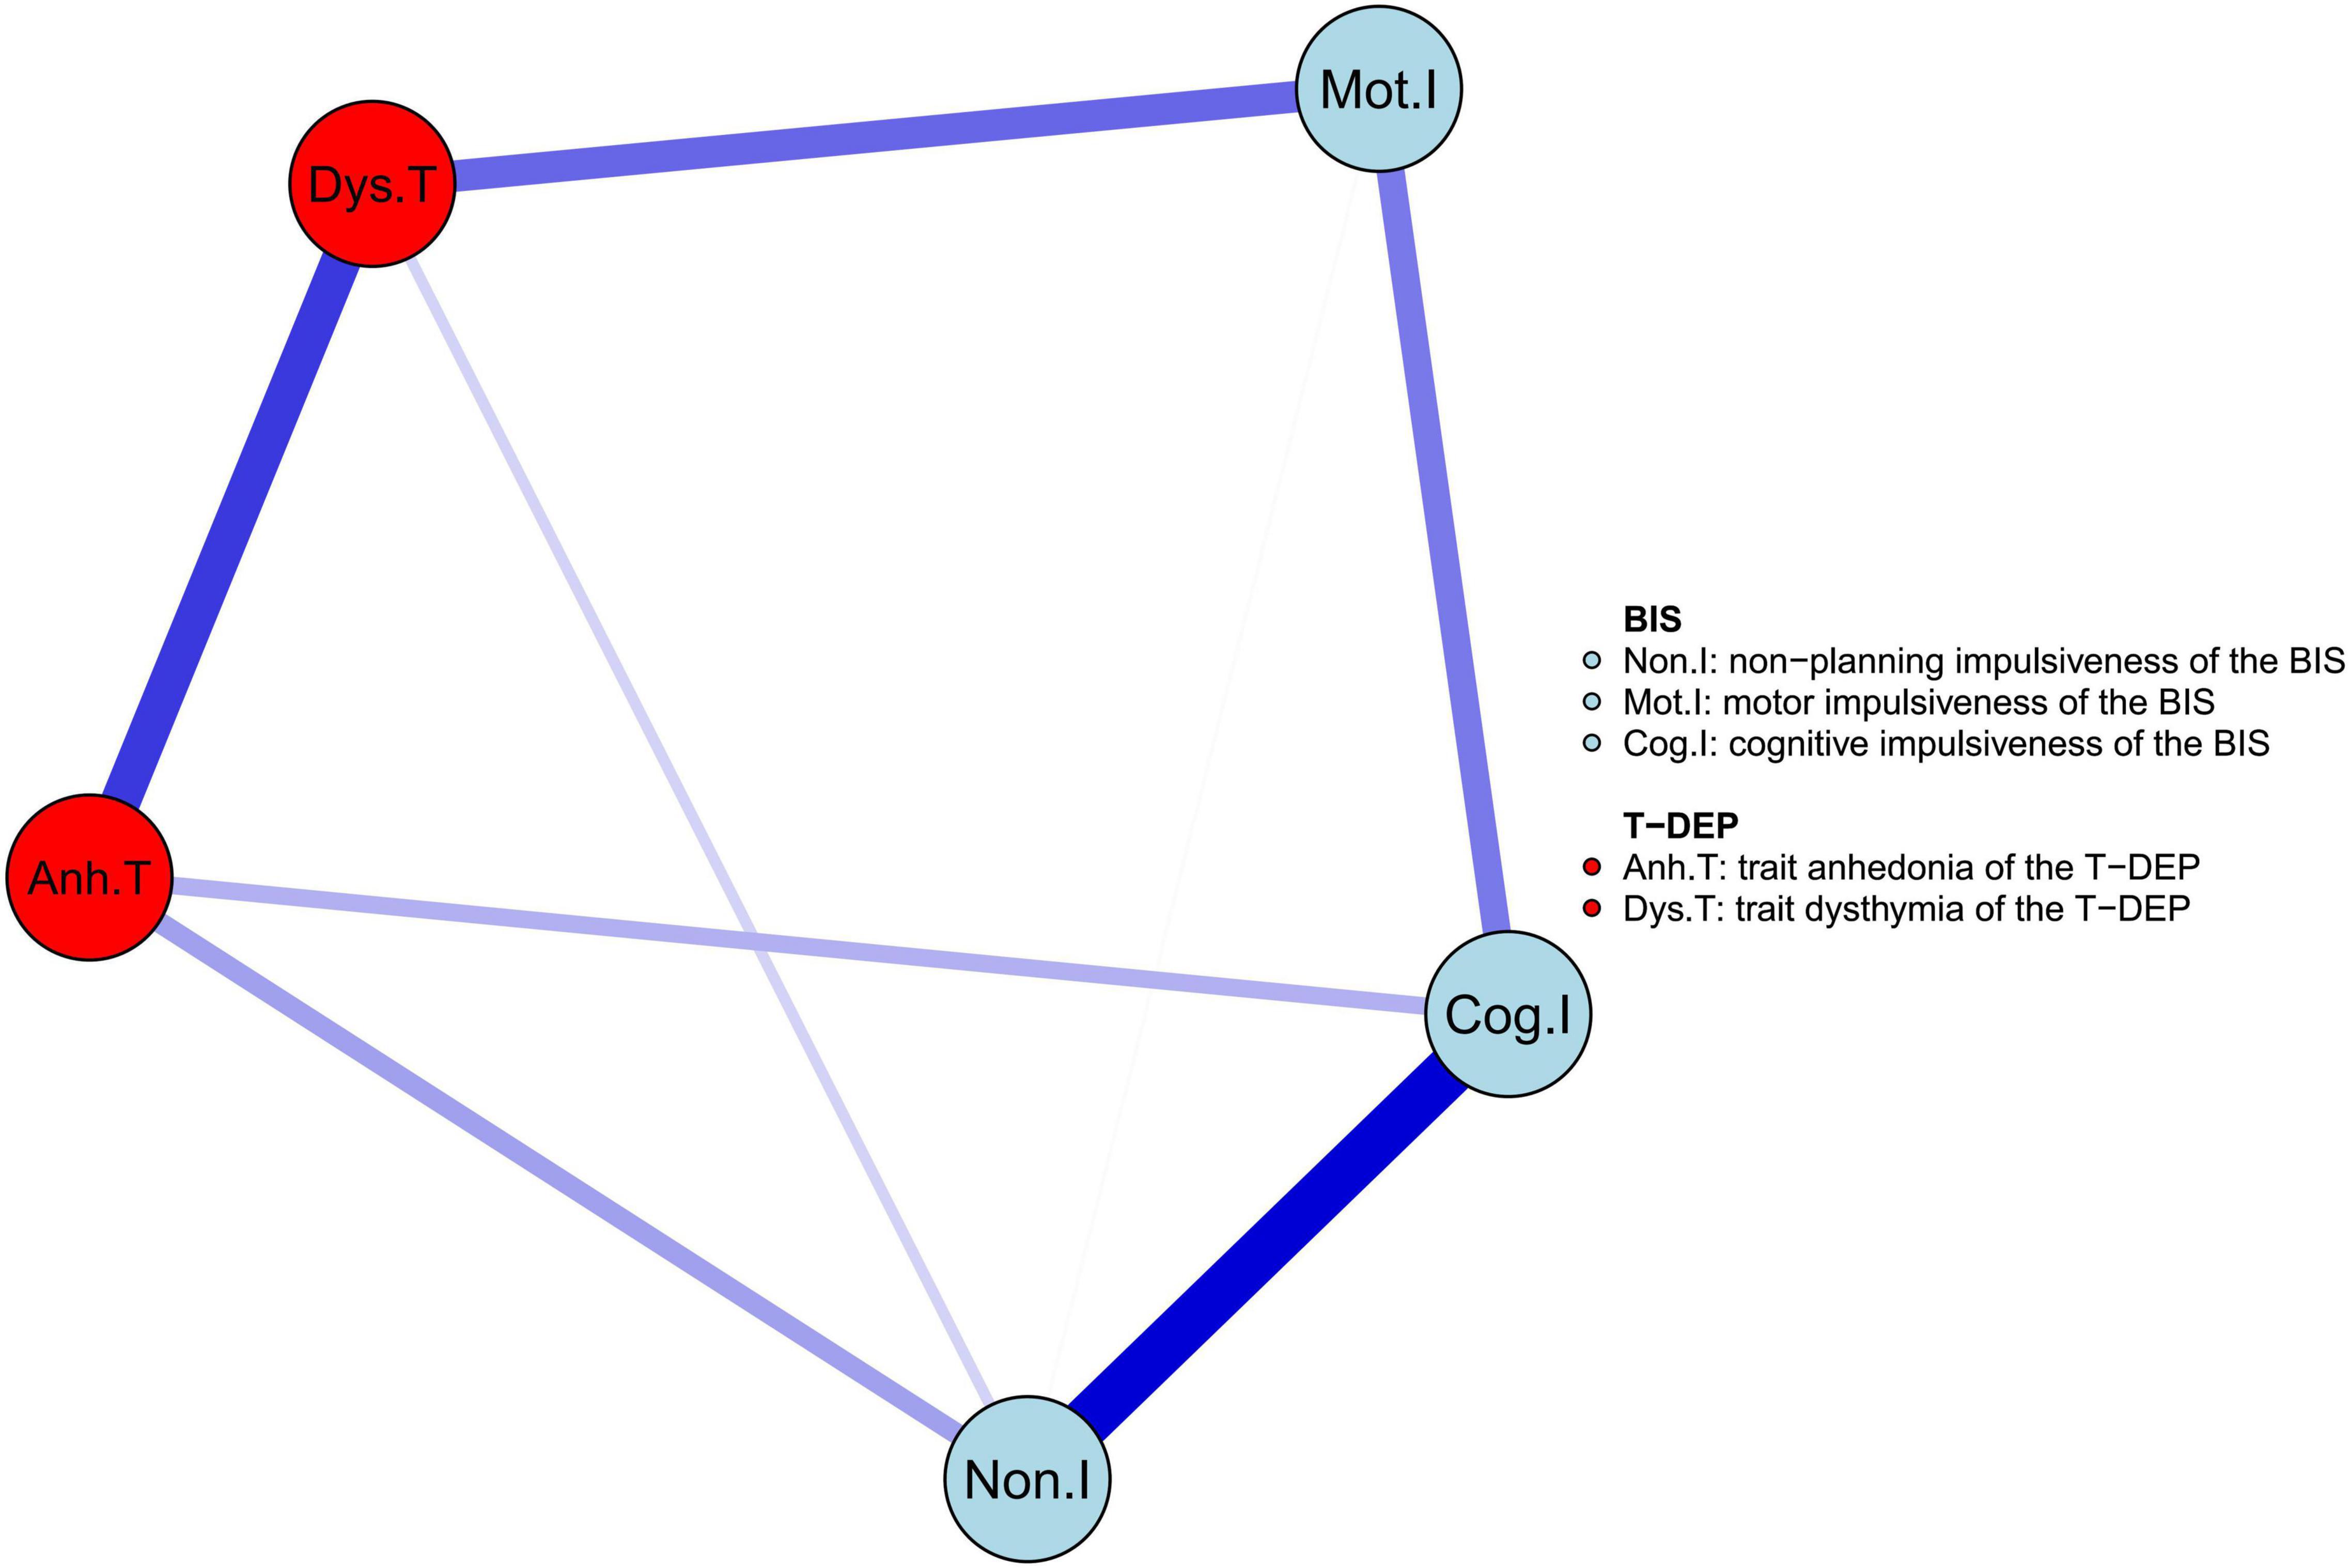
Figure 2. The network structure of trait depression and impulsiveness in the youth. The edge weight values are listed in Supplementary Table 2.
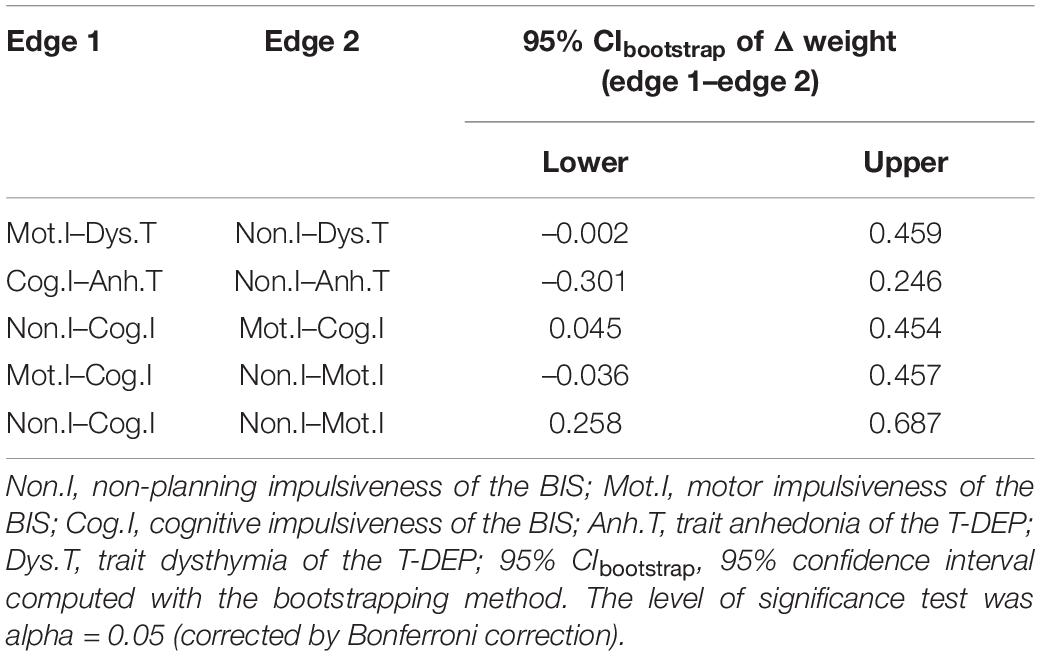
Table 2. Edge weight comparisons.
We used expected influence as the index of centrality. As shown in Figure 3, “Cog.I” had the highest expected influence values (the expected influence values are listed in Table 3), indicating that this node was the most important one in the network and had the strongest connections to other nodes. “Mot.I” had the lowest expected influence value, indicating that this node was the least important one in the network. However, the significance test showed that only the comparison between “Cog.I” and “Mot.I” was statistically significant (refer to Table 3).
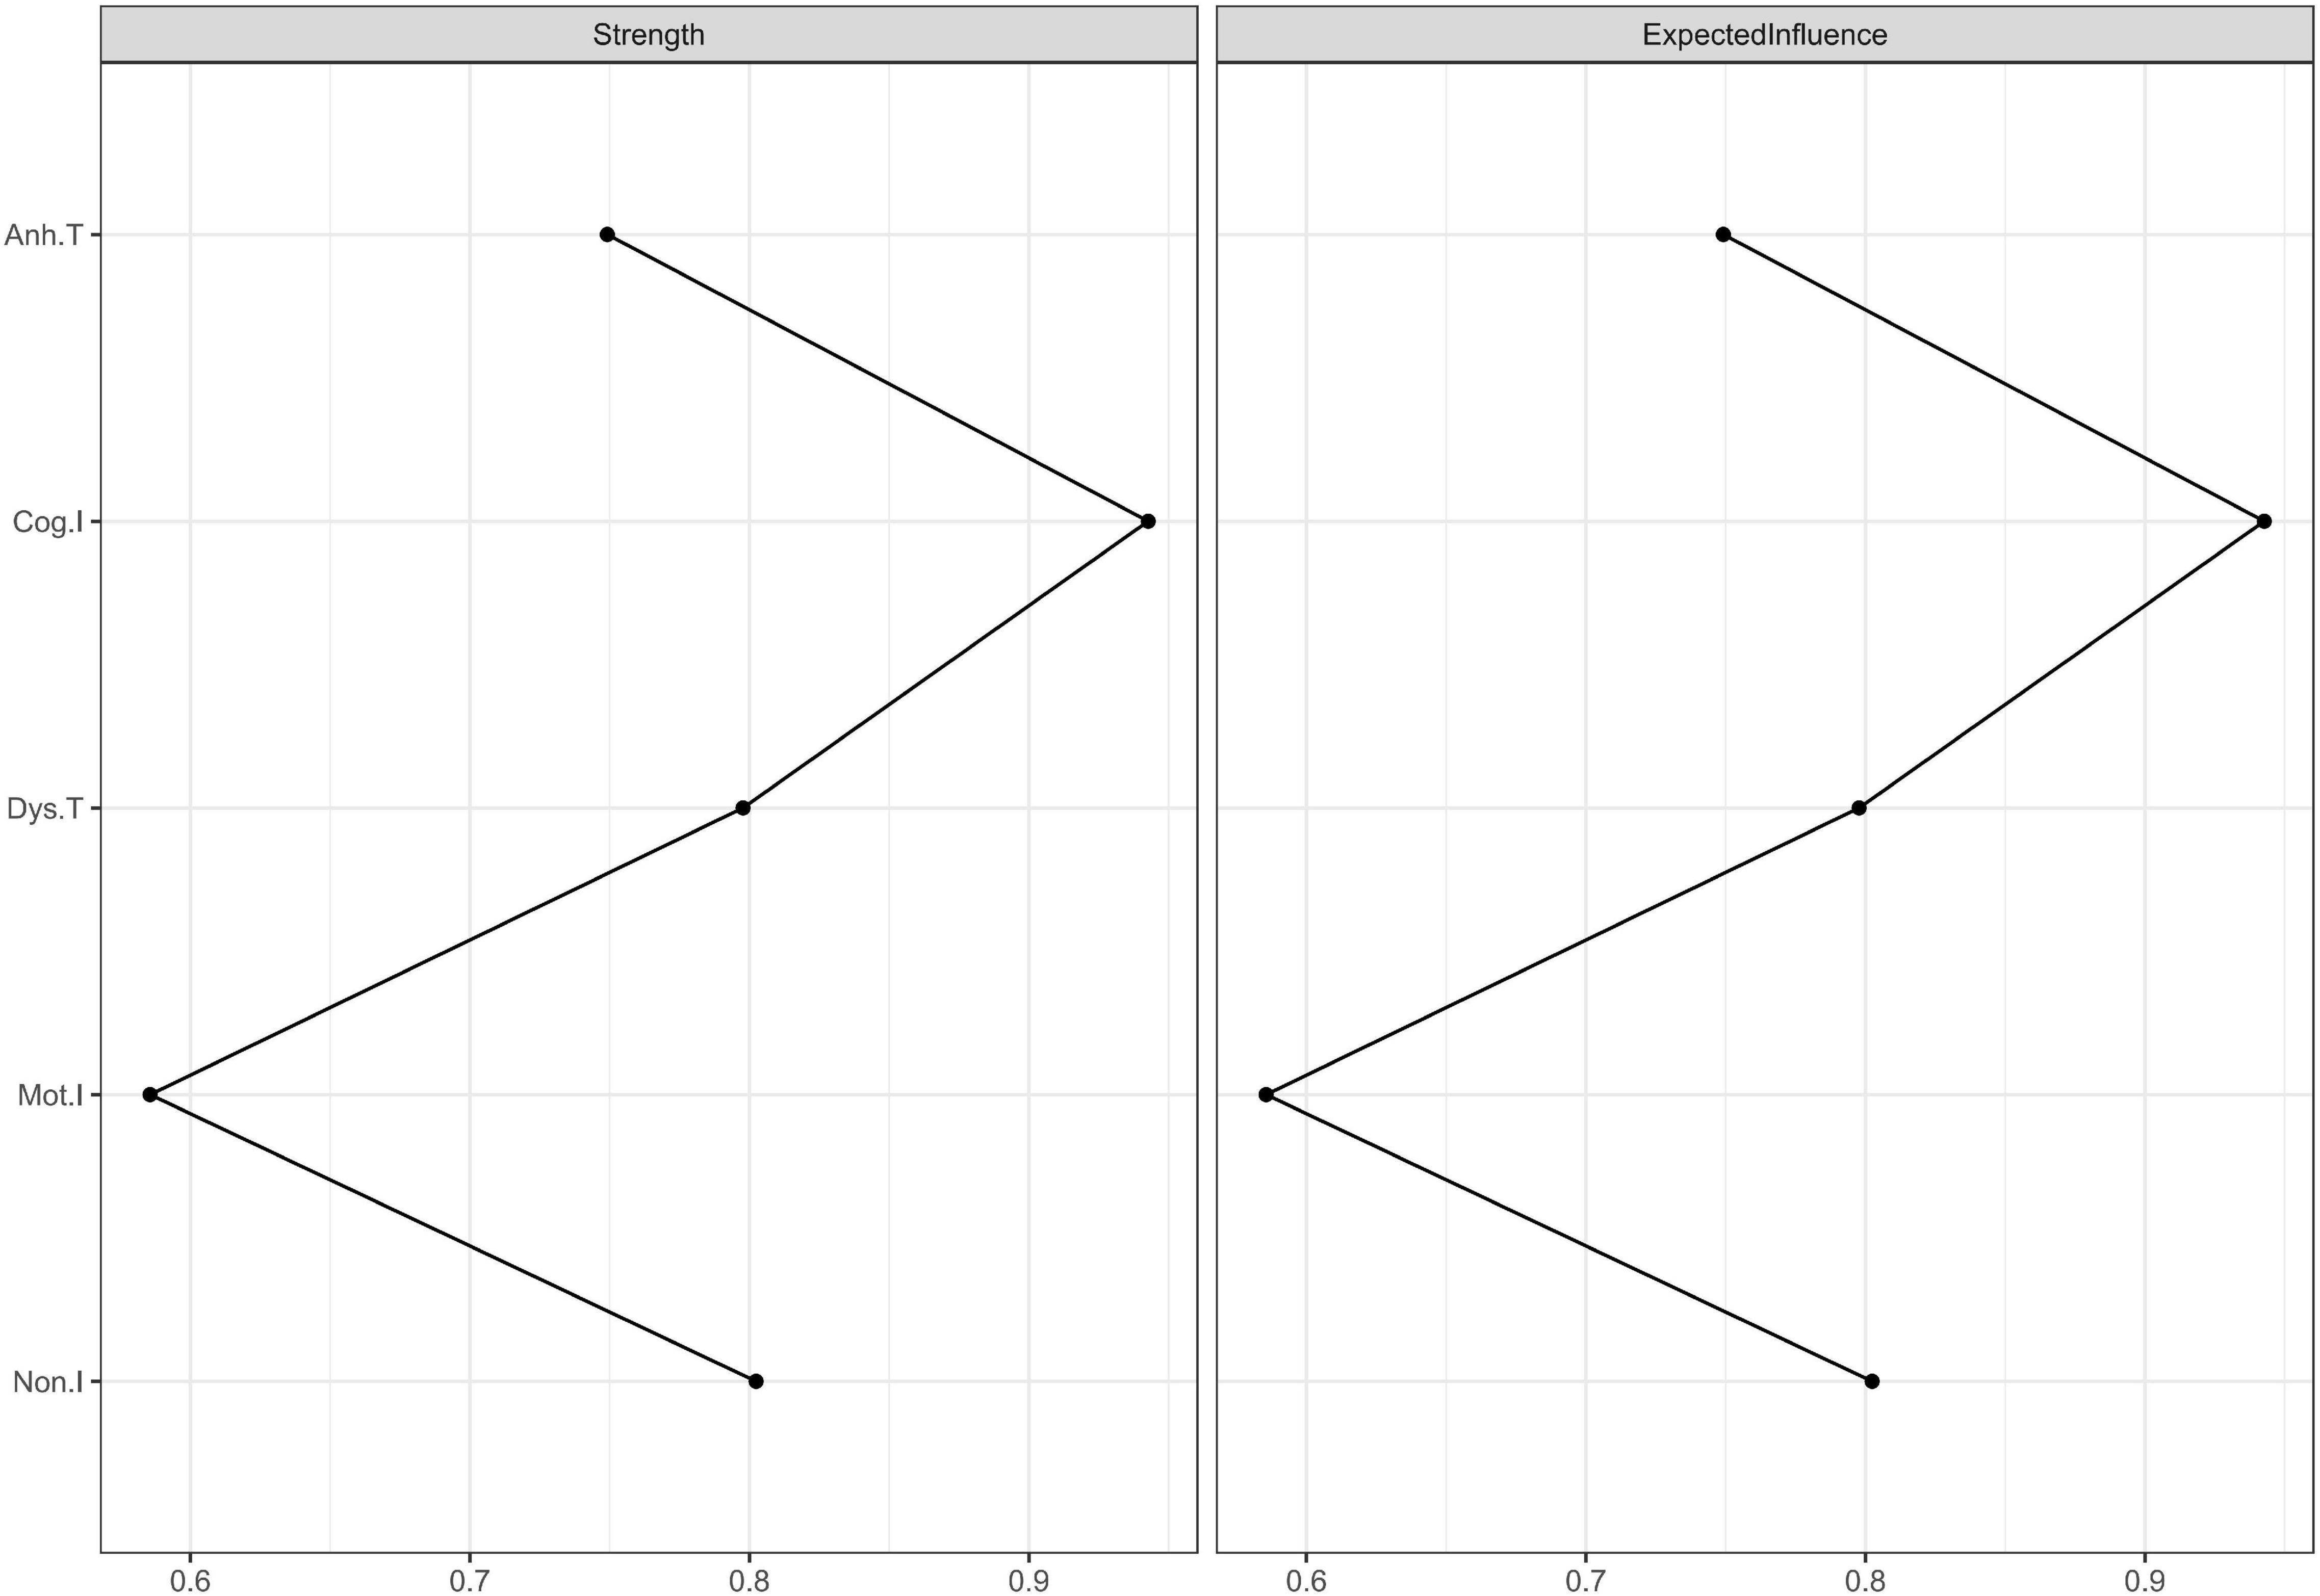
Figure 3. Centrality plots of strength and expected influence. Because there was no negative edge weight in this network, the values of strength and expected influence were the same. The strength and expected influence values are listed in Supplementary Table 3.
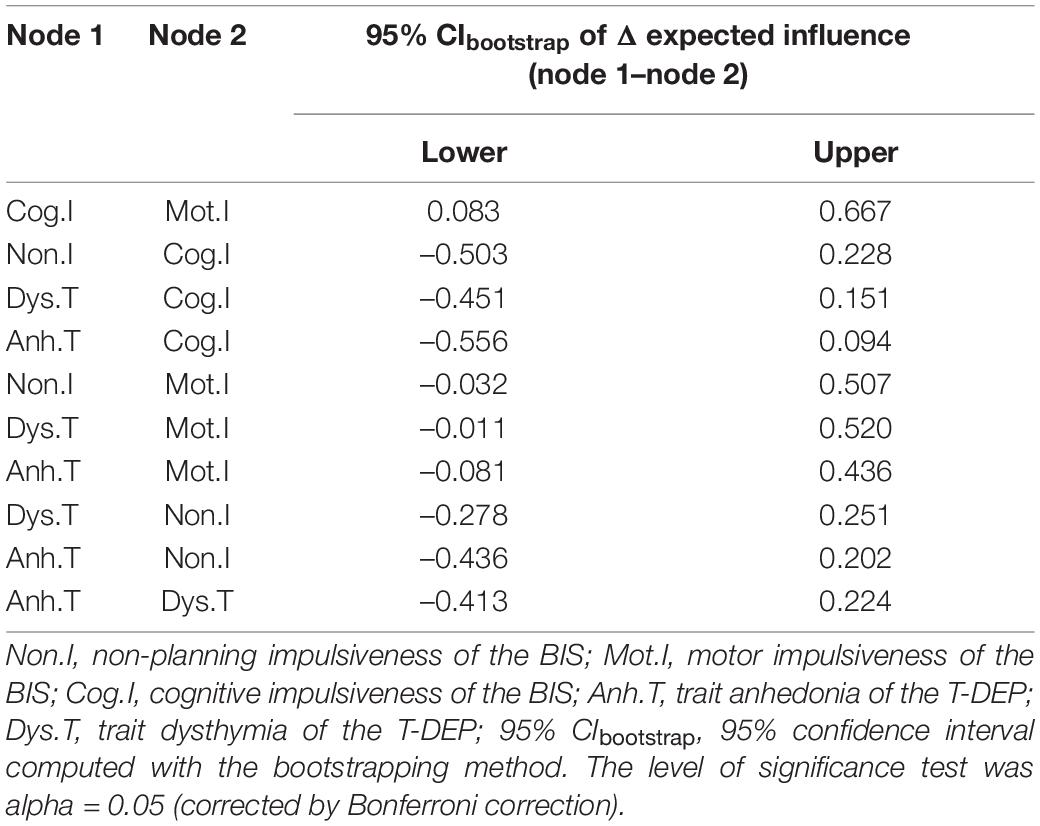
Table 3. Expected influence comparisons of each node.
The number of bootstrapping samples was 2,000 when calculating both the edge weight accuracy and the CS coefficient of expected influence. In this network, the edge weight accuracy was 0.75 (the bootstrap mean of the edge weight is plotted in Supplementary Figure 1), higher than the recommended 0.5 (47). The CS coefficient of expected influence was 0.44 (the average correlation with the original sample for expected influence is plotted in Supplementary Figure 2), higher than the recommended 0.25 (47). These results indicate that the centrality statistics were stable and accurate.
The bridge index is usually used in symptom networks to determine which symptoms have the greatest risk of contagion between two symptom groups. However, for personality networks, it can be applied to describe which trait components linked the different personalities closest. We regarded impulsiveness and trait depression as two communities when calculating the bridge expected influence values. The trait components were represented by facets (five facets in total). According to Figure 4, the most important bridge trait component was “trait dysthymia,” and the bridge expected influence value of which was 0.398. However, only the difference between “trait dysthymia” and “cognitive” impulsiveness was significant (95% CIbootstrap = [0.011, 0.461]) (refer to Table 4) (the bridge expected influence values are listed in Supplementary Table 4). The CS coefficient of bridge expected influence was calculated with bootstrapping (n = 2,000), resulting in a value of 0.29 (the average correlation with the original sample for bridge expected influence is plotted in Supplementary Figure 3), which was higher than the recommended 0.25 (47). This indicates that the bridge centrality statistics were stable.
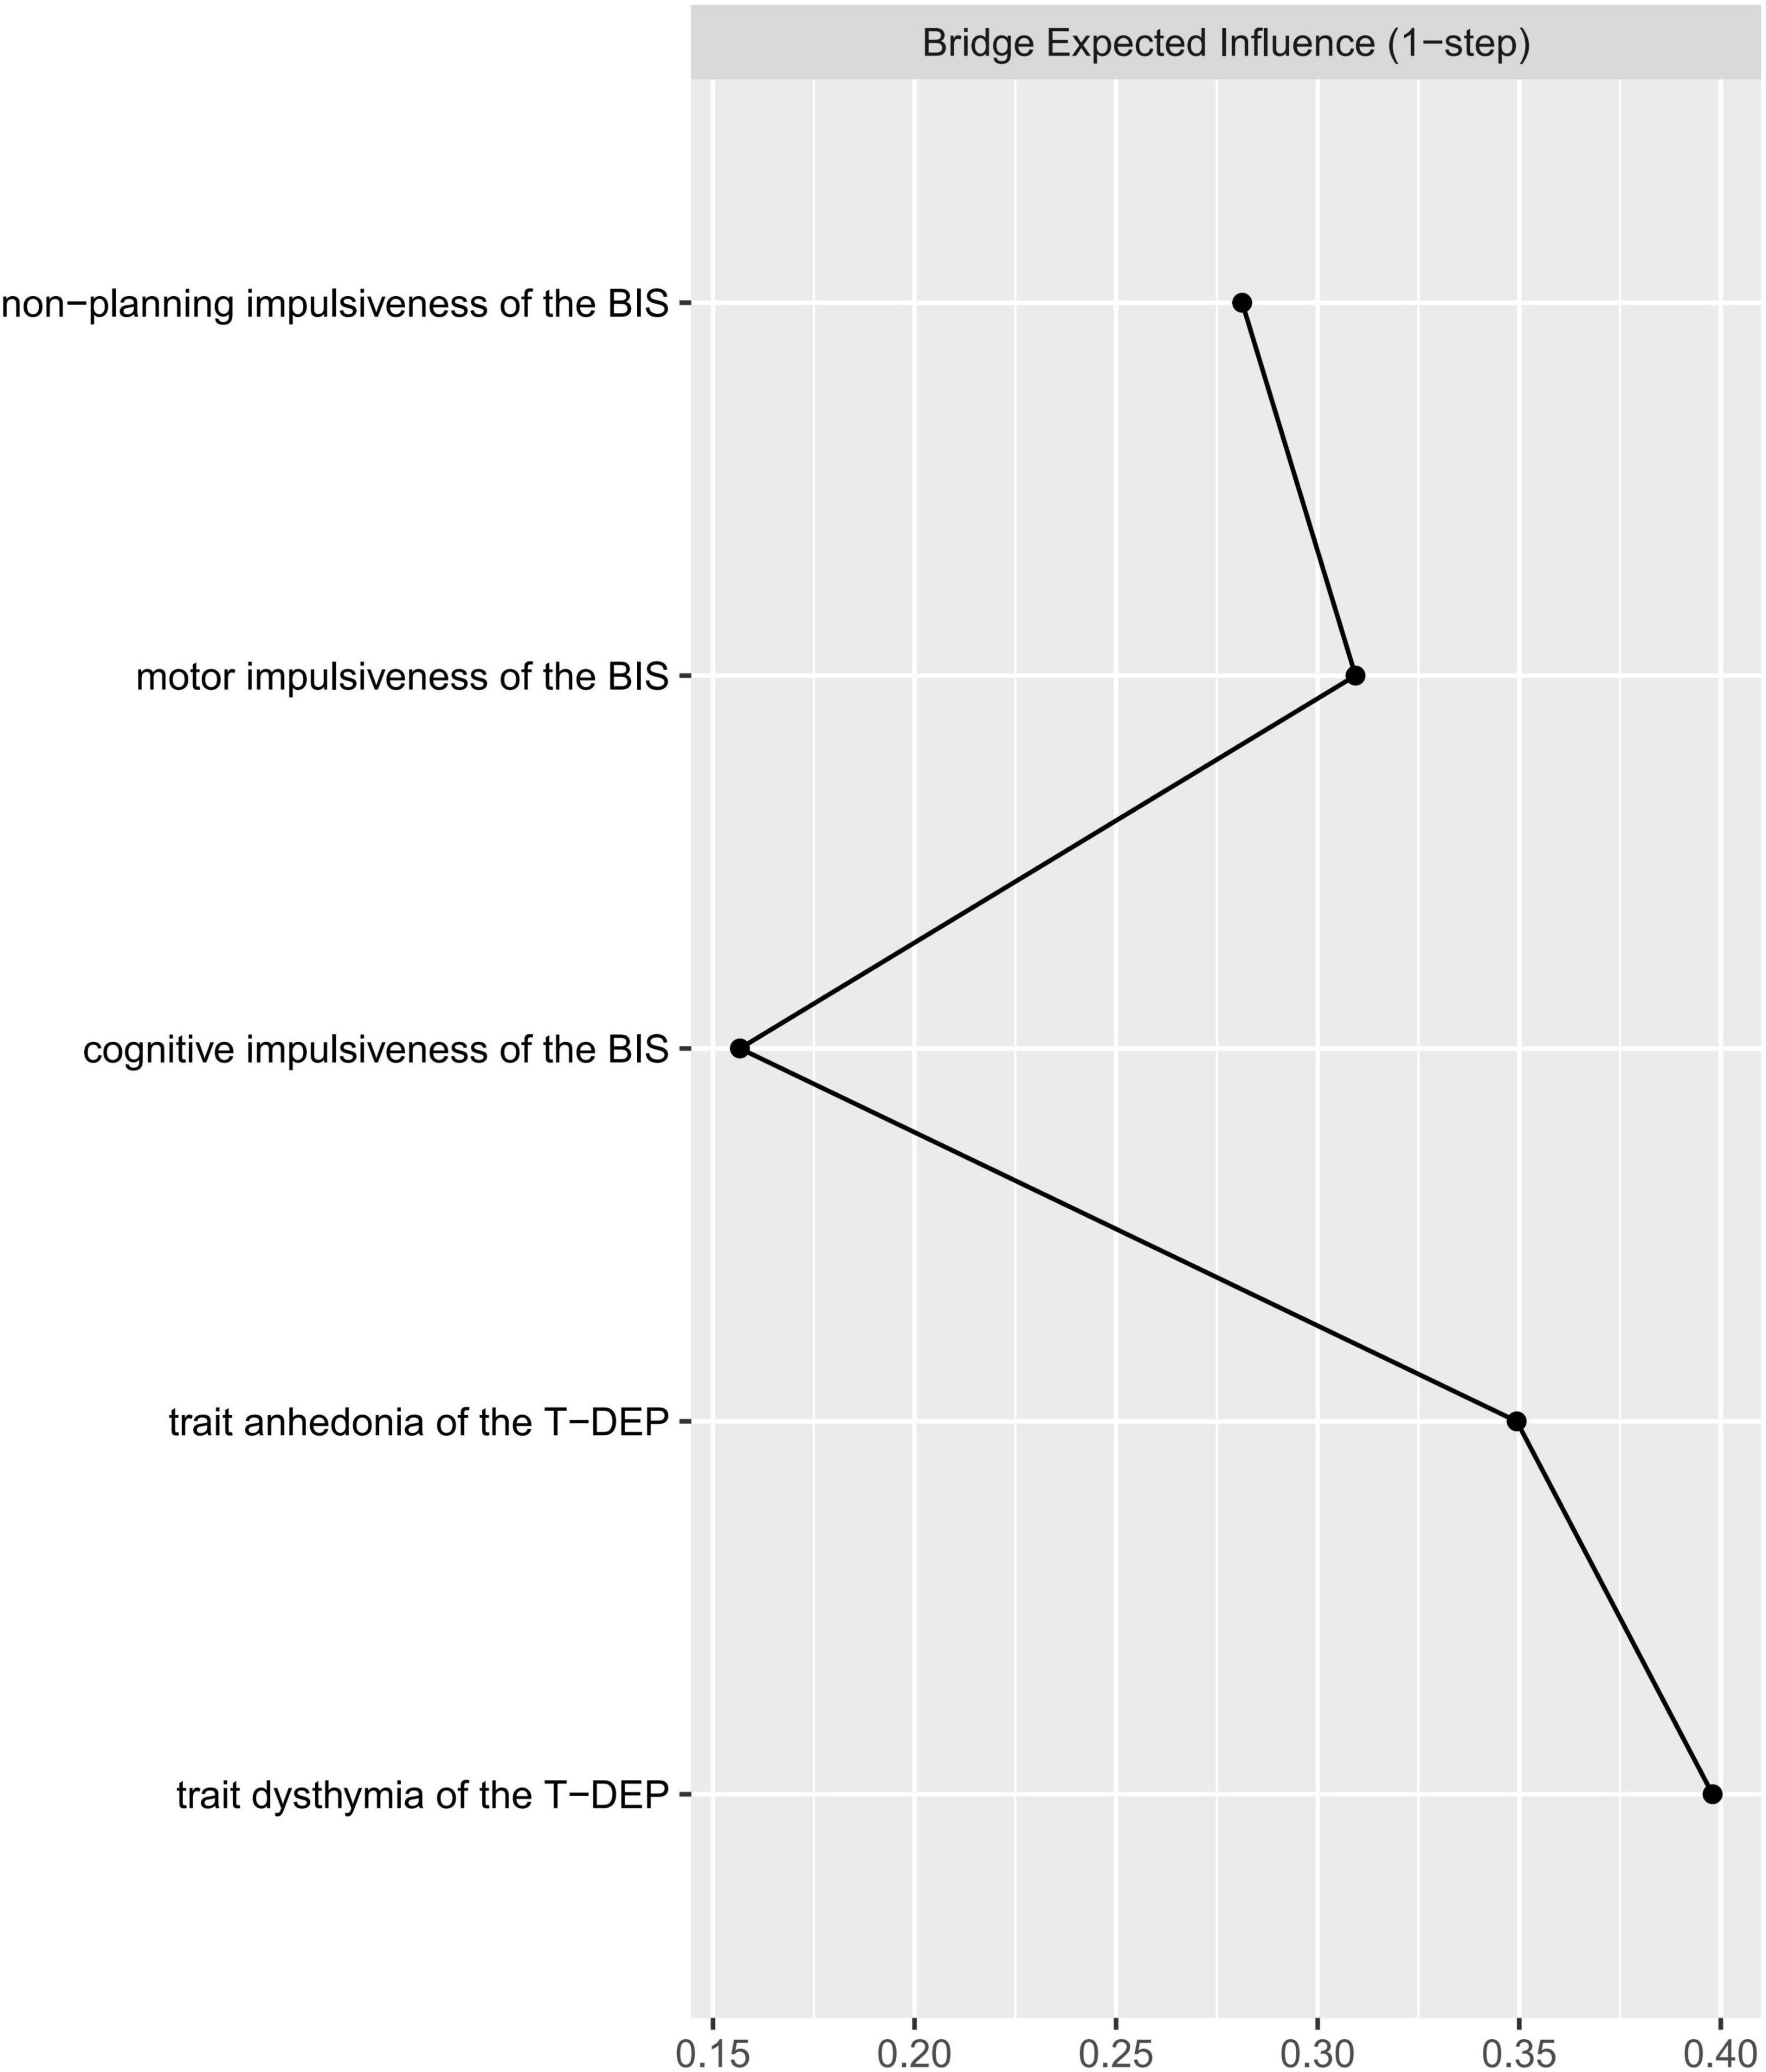
Figure 4. Centrality plot of the bridge expected influence between trait depression and impulsiveness.
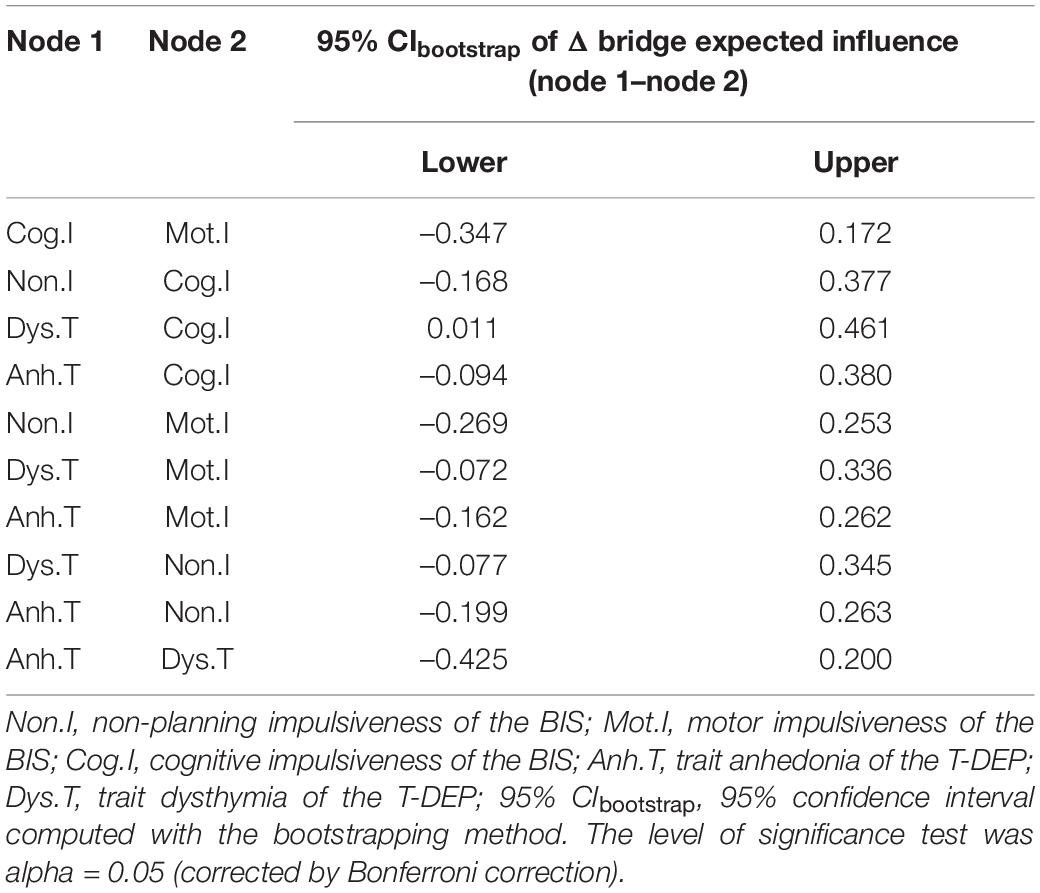
Table 4. Bridge expected influence comparisons of each node.
We did not find differences between male and female in network invariance (M = 0.163, p = 0.614) or global strength (S = 0.238, male = 1.972, female = 2.211, p = 0.199). This indicates that gender does not affect the network structure pattern or connection strength. There were also no significant differences between the “left-behind child” group and the “non-left-behind child” group in network invariance (M = 0.233, p = 0.312) or global strength (S = 0.156, “left-behind child” = 1.827, “non-left-behind child” = 1.982, p = 0.438). However, although there was no significant difference between “only child” group and “non-only child” group in network invariance (M = 0.179, p = 0.487), we found a difference in global strength invariance (S = 0.408, “only child” = 1.889, “non-only child” = 2.297, p = 0.038). This result indicates that the “non-only child” group has a stronger global connection than the “only child” group among impulsiveness and trait depression facets.
In the present study, we adopted the network analysis method to explore the associations between different facets of trait depression (e.g., “trait anhedonia” and “trait dysthymia”) and impulsiveness (e.g., “non-planning,” “motor,” and “cognitive” impulsiveness) and their relative importance. We demonstrate that “trait anhedonia” is connected with “non-planning” and “cognitive” impulsiveness but not with “motor” impulsiveness and that “trait dysthymia” is connected with “non-planning” and “motor” impulsiveness but not with “cognitive” impulsiveness. In addition, according to the expected influence, “cognitive” impulsiveness is the most important facet in the network, which can link other facets globally. Meanwhile, “trait dysthymia” is the most important facet linking trait depression with impulsiveness. Among the demographic variables, “only child” affects the network global strength, while “gender” and “left-behind child” do not, which indicates that the facets of trait depression and impulsiveness are more closely connected with each other in “non-only child” than in “only child.”
As demonstrated in our hypothesis, what we mainly care about are the associations of the three facets of impulsiveness with “trait anhedonia” and “trait dysthymia.” There are two disagreements between the results and the hypothesis. First, “cognitive” impulsiveness is connected with “trait anhedonia” rather than “trait dysthymia.” The cognitive component of impulsiveness mentioned earlier is measured by a behavioral task, which mainly refers to error-related brain activities. However, in this study, “cognitive” impulsiveness is measured by a self-report questionnaire, which represents a more general impulsive cognitive process (not thinking thoroughly before action). In addition, the correlation between anhedonia and the cognitive component of impulsiveness is confirmed in a study, in which “cognitive” is directly measured by brain functional imaging (50). Second, “non-planning” impulsiveness is connected not only with “trait anhedonia” but also with “trait dysthymia.” There may be two possible explanations for this result. One is that both “trait anhedonia” and “trait dysthymia” have unmotivating components, which can be observed from the item meanings of T-DEP (36). Another is that “non-planning” impulsiveness includes both unmotivating components that are related to “trait anhedonia” and other components that may be related to “trait dysthymia.” The result that “non-planning” impulsiveness is connected with “trait anhedonia” agrees with the result of a previous study, considering the non-planning reward process and anhedonia symptoms (50). However, the relationship between “trait dysthymia” and the “non-planning” impulsiveness needs further consideration in the future.
The connection between “trait dysthymia” and “motor” impulsiveness confirms the hypothesis. The positive linkage between “motor” impulsiveness and “trait dysthymia” agrees with the result of a previous study, showing that dysthymic symptoms are related to cognitive control evaluated by behavioral measurement and ERN (26) because behavioral measuring of cognitive control includes behavioral inhibition component that is the feature of “motor” impulsiveness. The connections between “trait dysthymia” and “non-planning” impulsiveness and between “trait dysthymia” and “motor” impulsiveness are not significantly different. However, the edge weight of “trait dysthymia—motor impulsiveness” has a trend to be larger (refer to Table 2). These findings indicate that “trait dysthymia” tends to be mainly linked with “motor” impulsiveness.
In conclusion, we tend to believe that “non-planning” and “cognitive” impulsiveness are the trait features of anhedonia and “motor” impulsiveness is the trait feature of dysthymia.
In addition, within trait depression, “trait anhedonia” and “trait dysthymia” are closely linked with each other. This indicates that trait depression seems to be an integral construct, which agrees with the description in DSM-5 (51) that anhedonia and dysthymia are the two cardinal symptoms of major depressive disorder. However, within impulsiveness, the association between “non-planning” and “cognitive” impulsiveness is stronger compared with the other two associations. This may be because “non-planning” and “cognitive” impulsiveness are mainly cognitive features, while “motor” impulsiveness is mainly a behavioral feature (9). Therefore, impulsiveness seems not to be a simple structure.
The expected influence reveals the importance of each trait facet (46). The five trait facets are included in a single structure, which may be regarded as the vulnerable personality for depressive disorder. “Cognitive” impulsiveness is a relatively more important facet in this study. This indicates that it is connected with other facets more widely or more closely. “Cognitive” impulsiveness represents quick thinking without inhibition (38), which is a stable feature of cognitive processing. The results infer that the cognitive feature of impulsiveness may be the core factor. It agrees with the cognitive hypothesis of depression (52). “Motor” impulsiveness is the least important facet in this structure. This indicates that “motor” impulsiveness only composes a small part of the vulnerability to depression. One possible reason is that “motor” impulsiveness includes fewer cognitive components than the other two impulsiveness facets (38). However, the cognitive component is an important factor in depression (52). Another possible reason is that “motor” impulsiveness, defined as impaired behavioral inhibition (9), is included in the behavioral inhibition system that has a weak correlation with anhedonia (53). The other three facets (e.g., “non-planning” impulsiveness, “trait anhedonia,” and “trait dysthymia”) have no significant difference in relative importance from neither “cognitive” impulsiveness nor “motor” impulsiveness. This result reveals that “cognitive” impulsiveness only has a significantly larger weight than “motor” impulsiveness, which indicates that none of the five facets is statistically dominant in this network. Nevertheless, “cognitive” impulsiveness has the trend to be dominant.
Regarding trait depression and impulsiveness as two different systems, we use the bridge index (48) to find the common components between them. “Trait dysthymia” is a common component that links trait depression with impulsiveness. A possible explanation is that “trait dysthymia,” as a habitual mood distress feature, could be affected by the inability of controlling temper and behavior (9). “Cognitive” impulsiveness has the lowest bridge expected influence, despite its highest expected influence. This indicates that it less directly links with “trait dysthymia” and “trait anhedonia” but through other trait facets. The bridge expected influence of the other three facets (e.g., “trait anhedonia,” “motor” impulsiveness, and “non-planning” impulsiveness) has no significant difference from neither “cognitive” impulsiveness nor “trait dysthymia,” which indicates that none of the five facets is statistically more important than others in linking impulsiveness with trait depression. However, “trait dysthymia” has the trend to be the most important facet bridging the two traits.
The results of the network comparisons show that gender, “only child,” and “left-behind child” does not affect the network structure. Previous studies have revealed that gender (54), “only child” (55), and “left-behind child” (56) are the factors that affect the prevalence of depressive symptoms. However, the present study mainly focuses on the inner correlation pattern. This may lead to the non-significant effects of demographic variables on network structure. Global strength represents the degree of associations among the facets of trait depression and impulsiveness. In previous studies, gender’s effects on the association between impulsiveness and depressive symptoms are inconsistent. Some of them report significant effects (57, 58) but others do not (59, 60). In the present study, gender does not affect global strength, which agrees with the non-significant results of the previous studies. Further studies are needed to figure out whether gender’s non-significant effect on the global strength of the associations among the facets of impulsiveness and depression is stable across symptom-level and trait-level. To the best of our knowledge, although there are studies exploring the effect of “only child” and “left-behind child” on depression (55, 56), few consider their influences on the association between impulsiveness and depression. Both “only child” and “left-behind child” include the factor of childhood experience, which is the basis of personality formation and development (61, 62). In our study, “only child” does influence the global strength of this personality network but “left-behind child” does not. This may be due to the psychosocial confounders (e.g., parenting pattern and family structure), which we have not taken into consideration.
Above all, the results indicate that “cognitive” impulsiveness is an underlying feature, while “trait dysthymia” is a key feature that links impulsiveness with trait depression. For the prevention of depression, it seems that “cognitive” impulsiveness needs more consideration because it widely influences the whole vulnerability network. “Trait dysthymia” needs more attention when considering the reciprocal effects of impulsiveness and trait depression. A better intervention of “trait dysthymia” may reduce the likelihood of the co-existence of trait depression and impulsiveness, which can decrease the risk of the aftermath led by depression and impulsiveness together (e.g., suicide). When considering the subtypes of depression, dysthymia needs more attention on both “trait dysthymia” and “motor” impulsiveness, while anhedonia needs more attention on “trait anhedonia,” “cognitive,” and “non-planning” impulsiveness. In addition, “non-only children” need more attention in the prevention of depression, because they are more possible to have both impulsiveness and trait depression than “only children.”
There are some limitations to this study. First, the sample comprised college students and residents in Chongqing, China. It is unknown whether the results can be expanded to a wider sample. Second, the data were collected in a cross-sectional manner before morbidity, which was not sufficient to determine whether the network is on trait level. Third, some psychosocial confounders were not taken into consideration, which might affect the network structure and strength. In the future, depressive populations in the premorbid, state, and remitted stages can all be recruited. The relations existing across the three stages would be stronger evidence for the trait hypothesis. More participants need to be recruited from different areas and ethnicities. More psychosocial factors that may influence personality can be included to reduce bias.
The present study confirms the correlation between trait depression and impulsiveness personality, finding that “trait anhedonia” is associated with “non-planning” and “cognitive” impulsiveness, while “trait dysthymia” is associated with “motor” impulsiveness. Therefore, in the prevention of depression, different aspects of impulsiveness should be considered respectively regarding anhedonia and dysthymia. In addition, “cognitive” impulsiveness is an underlying feature of the vulnerability to depression, and “trait dysthymia” is a key factor linking impulsiveness with trait depression. Therefore, “cognitive” impulsiveness and “trait dysthymia” are critical to the prevention of depression.
The raw data supporting the conclusions of this article will be made available by the authors, without undue reservation.
The studies involving human participants were reviewed and approved by Medical Ethics Committee of Army Medical University. Written informed consent to participate in this study was provided by the participants’ legal guardian/next of kin.
JZ contributed to the design of the research, conducting a questionnaire survey and statistical analyses, and drafting the manuscript. KL contributed to the questionnaire survey, writing the R script, and revising the manuscript. YX contributed to the questionnaire survey, arranging the raw data, and performing statistical analyses. ZF contributed to the design of the whole study and the critical revision of the manuscript. All authors have read and revised the final manuscript.
This research was supported by the National Natural Science Foundation of China (81971278).
The authors declare that the research was conducted in the absence of any commercial or financial relationships that could be construed as a potential conflict of interest.
All claims expressed in this article are solely those of the authors and do not necessarily represent those of their affiliated organizations, or those of the publisher, the editors and the reviewers. Any product that may be evaluated in this article, or claim that may be made by its manufacturer, is not guaranteed or endorsed by the publisher.
We specifically appreciate Professor Michael Phillips (Director, Suicide Research and Prevention Center, Shanghai Mental Health Center, Shanghai Jiao Tong University School of Medicine) who helped us in the application of the Barratt Impulsiveness Scale 11th Chinese version. The undergraduates and colleagues of the research group assisted in data input and management, for which we are very thankful.
The Supplementary Material for this article can be found online at: https://www.frontiersin.org/articles/10.3389/fpsyt.2022.916332/full#supplementary-material
BIS, Barratt impulsiveness scale; BIS-11-CV, Barratt impulsiveness scale 11th Chinese version; Non.I, non-planning impulsiveness of the BIS; Mot.I, motor impulsiveness of the BIS; Cog.I, cognitive impulsiveness of the BIS; ST-DEP, state trait depression scale; T-DEP, trait depression scale; Dys.T, trait dysthymia of the T-DEP; Anh.T, trait anhedonia of the T-DEP; SDS, self-rating depression scale; BDI, beck depression inventory; GGM, Gaussian graphical model; GLASSO, graphic least absolute shrinkage and selection operator; PCM, partial correlation model; SPL, short path length; CI, confidence interval; CS, correlation stability; SD, standard deviation; PRISMA, preferred reporting items for systematic reviews and meta-analyses.
1. Brooks SJ, Lochner C, Shoptaw S, Stein DJ. Using the research domain criteria (RDoC) to conceptualize impulsivity and compulsivity in relation to addiction. Prog Brain Res. (2017) 235:177–218. doi: 10.1016/bs.pbr.2017.08.002
2. Fields SA, Schueler J, Arthur KM, Harris B. The role of impulsivity in major depression: a systematic review. Curr Behav Neurosci Rep. (2021) 8:38–50.
3. Granö N, Keltikangas-Järvinen L, Kouvonen A, Virtanen M, Elovainio M, Vahtera J, et al. Impulsivity as a predictor of newly diagnosed depression. Scand J Psychol. (2007) 48:173–9. doi: 10.1111/j.1467-9450.2007.00566.x
4. Lyon KA, Juhasz G, Brown LJE, Elliott R. Big Five personality facets explaining variance in anxiety and depressive symptoms in a community sample. J Affect Disord. (2020) 274:515–21. doi: 10.1016/j.jad.2020.05.047
5. Makransky G, Mortensen EL, Glas CA. Improving personality facet scores with multidimensional computer adaptive testing: an illustration with the NEO PI-R. Assessment. (2013) 20:3–13. doi: 10.1177/1073191112437756
6. Velotti P, Garofalo C. Personality styles in a non-clinical sample: the role of emotion dysregulation and impulsivity. Pers Individ Differ. (2015) 79:44–9.
7. Fineberg NA, Chamberlain SR, Goudriaan AE, Stein DJ, Vanderschuren LJ, Gillan CM, et al. New developments in human neurocognition: clinical, genetic, and brain imaging correlates of impulsivity and compulsivity. CNS Spectr. (2014) 19:69–89. doi: 10.1017/S1092852913000801
8. Fineberg NA, Potenza MN, Chamberlain SR, Berlin HA, Menzies L, Bechara A, et al. Probing compulsive and impulsive behaviors, from animal models to endophenotypes: a narrative review. Neuropsychopharmacology. (2010) 35:591–604. doi: 10.1038/npp.2009.185
9. Stanford MS, Mathias CW, Dougherty DM, Lake SL, Anderson NE, Patton JH. Fifty years of the barratt impulsiveness scale: an update and review. Pers Individ Differ. (2009) 47:385–95.
11. Krohne HW, Schmukle SC, Spaderna H, Spielberger CD. The State-Trait Depression Scales: an International Comparison. Anxiety Stress Coping. (2002) 15:105–22.
12. Goldin RL, Matson JL. DSM-5. In: FR Volkmar editor. Encyclopedia of Autism Spectrum Disorders. New York, NY: Springer New York (2015). p. 1–2.
13. Chiappelli J, Kochunov P, DeRiso K, Thangavelu K, Sampath H, Muellerklein F, et al. Testing trait depression as a potential clinical domain in schizophrenia. Schizophr Res. (2014) 159:243–8. doi: 10.1016/j.schres.2014.08.003
14. Smith GT, Guller L, Zapolski TC. A comparison of two models of Urgency: urgency predicts both rash action and depression in youth. Clin Psychol Sci. (2013) 1:266–75. doi: 10.1177/2167702612470647
15. Dekker MR, Johnson S. Major depressive disorder and emotion-related impulsivity: are both related to cognitive inhibition? Cogn Ther Res. (2018) 42:398–407. doi: 10.1016/j.cpr.2017.11.006
16. d’Acremont M, Van der Linden M. How is impulsivity related to depression in adolescence? Evidence from a French validation of the cognitive emotion regulation questionnaire. J Adolesc. (2007) 30:271–82. doi: 10.1016/j.adolescence.2006.02.007
17. Khemakhem K, Boudabous J, Cherif L, Ayadi H, Walha A, Moalla Y, et al. Impulsivity in adolescents with major depressive disorder: a comparative tunisian study. Asian J Psychiatr. (2017) 28:183–5. doi: 10.1016/j.ajp.2017.06.002
18. Houeto JL, Magnard R, Dalley JW, Belin D, Carnicella S. Trait impulsivity and anhedonia: two gateways for the development of impulse control disorders in Parkinson’s disease? Front Psychiatry. (2016) 7:91. doi: 10.3389/fpsyt.2016.00091
19. Marissen MA, Arnold N, Franken IH. Anhedonia in borderline personality disorder and its relation to symptoms of impulsivity. Psychopathology. (2012) 45:179–84. doi: 10.1159/000330893
20. Lempert KM, Pizzagalli DA. Delay discounting and future-directed thinking in anhedonic individuals. J Behav Ther Exp Psychiatry. (2010) 41:258–64. doi: 10.1016/j.jbtep.2010.02.003
21. Amr M, Volpe FM. Relationship between anhedonia and impulsivity in schizophrenia, major depression and schizoaffective disorder. Asian J Psychiatr. (2013) 6:577–80. doi: 10.1016/j.ajp.2013.09.002
22. Riso LP, Klein DN, Ferro T, Kasch KL, Pepper CM, Schwartz JE, et al. Understanding the comorbidity between early-onset dysthymia and cluster B personality disorders: a family study. Am J Psychiatry. (1996) 153:900–6. doi: 10.1176/ajp.153.7.900
23. Schulz SC, Camlin KL, Berry SA, Jesberger JA. Olanzapine safety and efficacy in patients with borderline personality disorder and comorbid dysthymia. Biol Psychiatry. (1999) 46:1429–35. doi: 10.1016/s0006-3223(99)00128-6
24. McCabe C. Neural correlates of anhedonia as a trait marker for depression. In: MS Ritsner editor. Anhedonia: A Comprehensive Handbook Volume II: Neuropsychiatric And Physical Disorders. Dordrecht: Springer Netherlands (2014). p. 159–74.
25. Tanaka SC, Doya K, Okada G, Ueda K, Okamoto Y, Yamawaki S. Prediction of immediate and future rewards differentially recruits cortico-basal ganglia loops. Nat Neurosci. (2004) 7:887–93. doi: 10.1038/nn1279
26. Ladouceur CD, Slifka JS, Dahl RE, Birmaher B, Axelson DA, Ryan ND. Altered error-related brain activity in youth with major depression. Dev Cogn Neurosci. (2012) 2:351–62. doi: 10.1016/j.dcn.2012.01.005
27. Zhou L, Xiao S, He X, Li J, Liu H. Reliability and validity of Chinese version of Barratt Impulsiveness Scale-11. Chin J Clin Psychol. (2006) 14:343–4. doi: 10.2190/om.66.3.b
28. Bringmann L, Vissers N, Wichers M, Geschwind N, Kuppens P, Peeters F, et al. A network approach to psychopathology: new insights into clinical longitudinal data. PLoS One. (2013) 8:e60188. doi: 10.1371/journal.pone.0060188
29. Jones P, Ma R, McNally R. Bridge centrality: a network approach to understanding comorbidity. Multivariate Behav Res. (2019) 56:353–367. doi: 10.1080/00273171.2019.1614898
30. van Borkulo C, Boschloo L, Borsboom D, Penninx BW, Waldorp LJ, Schoevers RA. Association of symptom network structure with the course of [corrected] depression. JAMA Psychiatry. (2015) 72:1219–26. doi: 10.1001/jamapsychiatry.2015.2079
31. Moher D, Liberati A, Tetzlaff J, Altman DG. Preferred reporting items for systematic reviews and meta-analyses: the PRISMA statement. Int J Surg. (2010) 8:336–41.
32. Rubin DB. Multiple Imputation for Nonresponse in Surveys: Wiley Series in Probability and Statistics. New York, NY: John Wiley & Sons (1987).
33. van Buuren S, Groothuis-Oudshoorn K. mice: multivariate imputation by chained equations in R. J Stat Softw. (2011) 45:1–67. doi: 10.3978/j.issn.2305-5839.2015.12.63
35. Beck AT, Steer RA, Carbin MG. Psychometric properties of the beck depression inventory: twenty-five years of evaluation. Clin Psychol Rev. (1988) 8:77–100.
36. Lei ZH, Rui XU, Deng SB. Reliability and validity of the Chinese version of State-Trait Depression Scale in college students. Chin Ment Health J. (2011) 25:136–40. doi: 10.1037/pas0000207
37. Barratt ES. Anxiety and impulsiveness related to psychomotor efficiency. Percept Mot Skills. (1959) 9:191–8.
38. Li X, Phillips MR, Xu D, Zhang Y, Yang S, Tong Y, et al. Reliability and validity of an adapted Chinese version of Barratt Impulsiveness Scale. Chin Ment Health J. (2011) 25:610–5.
40. R Core Team.R: A Language and Environment for Statistical Computing. Vienna: R Foundation for Statistical Computing (2021).
41. Epskamp S, Waldorp L, Mõttus R, Borsboom D. Discovering psychological dynamics: the gaussian graphical model in cross-sectional and time-series data. Multivariate Behav Res. (2017) 53:453–80.
42. Friedman J, Hastie T, Tibshirani R. Sparse inverse covariance estimation with the graphical LASSO. Biostatistics. (2008) 9:432–41. doi: 10.1093/biostatistics/kxm045
43. Epskamp S, Cramer A, Waldorp L, Schmittmann V, Borsboom D. qgraph: network visualizations of relationships in psychometric data. J Stat Softw. (2012) 48:1–8.
44. Bringmann L, Elmer T, Epskamp S, Krause R, Schoch D, Wichers M, et al. What do centrality measures measure in psychological networks? J Abnorm Psychol. (2019) 128:892–903. doi: 10.1037/abn0000446
45. Epskamp S, Rhemtulla M, Borsboom D. Generalized network psychometrics: combining network and latent variable models. Psychometrika. (2016) 82:904–27. doi: 10.1007/s11336-017-9557-x
46. Robinaugh DJ, Millner AJ, McNally RJ. Identifying highly influential nodes in the complicated grief network. J Abnorm Psychol. (2016) 125:747–57. doi: 10.1037/abn0000181
47. Epskamp S, Borsboom D, Fried E. Estimating psychological networks and their accuracy: a tutorial paper. Behav Res Methods. (2016) 50:195–212. doi: 10.3758/s13428-017-0862-1
48. Cramer AOJ, Waldorp LJ, van der Maas HLJ, Borsboom D. Comorbidity: a network perspective. Behav Brain Sci. (2010) 33:137–50. doi: 10.1017/S0140525X09991567
49. Jones P. networktools: Assorted Tools for Identifying Important Nodes in Networks. R package version 100. (2017). Available online at: https://cran.r-project.org/package=networktools
50. Gong L, He C, Zhang H, Zhang H, Zhang Z, Xie C. Disrupted reward and cognitive control networks contribute to anhedonia in depression. J Psychiatr Res. (2018) 103:61–8. doi: 10.1016/j.jpsychires.2018.05.010
51. Francesmonneris A, Pincus H, First M. Diagnostic and Statistical Manual of Mental Disorders: DSM-V. Virginia: American Psychiatric Association (2013).
53. Xie J, Fang P, Zhang Z, Luo R, Dai B. Behavioral inhibition/activation systems and depression among females with substance use disorder: the mediating role of intolerance of uncertainty and anhedonia. Front Psychiatry. (2021) 12:644882. doi: 10.3389/fpsyt.2021.644882
54. Shi P, Yang A, Zhao Q, Chen Z, Ren X, Dai QA. Hypothesis of gender differences in self-reporting symptom of depression: implications to solve under-diagnosis and under-treatment of depression in males. Front Psychiatry. (2021) 12:589687. doi: 10.3389/fpsyt.2021.589687
55. Cao Y, Huang L, Si T, Wang NQ, Qu M, Zhang XY. The role of only-child status in the psychological impact of COVID-19 on mental health of Chinese adolescents. J Affect Disord. (2021) 282:316–21. doi: 10.1016/j.jad.2020.12.113
56. Cheng J, Sun YH. Depression and anxiety among left-behind children in China: a systematic review. Child Care Health Dev. (2015) 41:515–23. doi: 10.1111/cch.12221
57. Ekinci O, Albayrak Y, Caykoylu A. Impulsivity in euthymic patients with major depressive disorder: the relation to sociodemographic and clinical properties. J Nerv Ment Dis. (2011) 199:454–8. doi: 10.1097/NMD.0b013e3182214116
58. Novak KD, Foti D. Individual difference in reward processing: depression, impulsivity, and moderating effects of age and gender. Psychophysiology. (2018) 55:S29–30.
59. De Pasquale C, Sciacca F, Conti D, Pistorio ML, Hichy Z, Cardullo RL, et al. Relations between mood states and eating behavior during COVID-19 pandemic in a sample of italian college students. Front Psychol. (2021) 12:684195. doi: 10.3389/fpsyg.2021.684195
60. Regan T, Harris B, Fields SA. Are relationships between impulsivity and depressive symptoms in adolescents sex-dependent? Heliyon. (2019) 5:e02696. doi: 10.1016/j.heliyon.2019.e02696
61. Wang L, Wu W, Qu G, Tang X, Sun Y. The personality traits of left-behind children in China: a systematic review and meta-analysis. Psychol Health Med. (2019) 24:253–68. doi: 10.1080/13548506.2018.1540787
Keywords: trait depression, impulsiveness, network analysis, facet, dysthymia, anhedonia, youth
Citation: Zhang J, Li K, Xue Y and Feng Z (2022) Network Analysis of the Relationship Between Trait Depression and Impulsiveness Among Youth. Front. Psychiatry 13:916332. doi: 10.3389/fpsyt.2022.916332
Received: 09 April 2022; Accepted: 13 May 2022;
Published: 17 June 2022.
Edited by:
Maha Atout, Philadelphia University, JordanReviewed by:
William Sulis, McMaster University, CanadaCopyright © 2022 Zhang, Li, Xue and Feng. This is an open-access article distributed under the terms of the Creative Commons Attribution License (CC BY). The use, distribution or reproduction in other forums is permitted, provided the original author(s) and the copyright owner(s) are credited and that the original publication in this journal is cited, in accordance with accepted academic practice. No use, distribution or reproduction is permitted which does not comply with these terms.
*Correspondence: Zhengzhi Feng, Znp6QHRtbXUuZWR1LmNu
Disclaimer: All claims expressed in this article are solely those of the authors and do not necessarily represent those of their affiliated organizations, or those of the publisher, the editors and the reviewers. Any product that may be evaluated in this article or claim that may be made by its manufacturer is not guaranteed or endorsed by the publisher.
Research integrity at Frontiers
Learn more about the work of our research integrity team to safeguard the quality of each article we publish.