 Gaohong Lin1†
 Zhangying Wu1†
 Ben Chen1†
 Min Zhang1
 Qiang Wang1
 Meiling Liu1Si Zhang1Mingfeng Yang2
 Yuping Ning1,2,3*
 Xiaomei Zhong1*
- 1Center for Geriatric Neuroscience, The Affiliated Brain Hospital of Guangzhou Medical University, Guangzhou, China
- 2The First School of Clinical Medicine, Southern Medical University, Guangzhou, China
- 3Guangdong Engineering Technology Research Center for Translational Medicine of Mental Disorders, Guangzhou, China
Background: Resting-state EEG microstate and omega complexity analyses have been widely used to explore deviant brain function in various neuropsychiatric disorders. This study aimed to investigate the features of microstate dynamics and spatial complexity in patients with late-life schizophrenia (LLS).
Method: Microstate and omega complexity analyses were performed on resting-state EEG data from 39 in patients with LLS and compared with 40 elderly normal controls (NCs).
Result: The duration of microstate classes A and D were significantly higher in patients with LLS compared with NCs. The occurrence of microstate classes A, B, and C was significantly lower in patients with LLS compared with NCs. LLS patients have a lower time coverage of microstate class A and a higher time coverage of class D than NCs. Transition probabilities from microstate class A to B and from class A to C were significantly lower in patients with LLS compared with NCs. Transition probabilities between microstate class B and D were significantly higher in patients with LLS compared with NCs. Global omega complexity and anterior omega complexity were significantly higher in patients with LLS compared with NCs.
Conclusion: This study revealed an altered pattern of microstate dynamics and omega complexity in patients with LLS. This may reflect the disturbed neural basis underlying LLS and enhance the understanding of the pathophysiology of LLS.
Introduction
Late-life schizophrenia (LLS) is a severe mental disorder in older people, seriously impairing the daily functioning and quality of life of LLS patients. With the intensification of global population aging, schizophrenia in late life has become a major public health issue worldwide (1). LLS differs from schizophrenia in younger individuals in many respects. Older patients with schizophrenia have fewer severe positive symptoms and more severe negative symptoms than younger patients (2, 3). Moreover, patients with LLS have more serious cognitive impairment (4, 5), complicated medical comorbidity (6, 7), and changed brain structure and function due to aging (8, 9) compared with younger patients. Currently, most studies on schizophrenia are conducted on the young to middle-aged population. Research on older patients with schizophrenia is relatively scarce (10).
The pathophysiology of LLS remains elusive. Accumulating evidence suggests that disturbed brain networks may underlie the symptomatology of schizophrenia (11–13). The process of brain networks is highly dynamic, functioning in a millisecond timescale. EEG microstate analysis, with a high temporal resolution, can be used to investigate the dynamic properties of large-scale brain networks. EEG microstates represent the spatial topography of scalp electric potential that remains quasi-stable for a short period and then changes to a different topography (14). EEG microstates occur in a sub-second duration of 60–120 ms, compatible with the time range of information operations (15). Four canonical microstates labeled as classes A, B, C, and D have been consistently identified in previous studies. One hypothesis proposed that an EEG microstate represents certain neural assemblies, and transitions between microstate classes reflect sequential activation of different brain networks (16). Growing evidence has shown that resting-state EEG microstates are closely related to resting-state networks (17–20). Simultaneous EEG-fMRI found a correlation between resting-state networks and each class of the four microstates: class A (auditory network), class B (visual network), class C (saliency network), and class D (attention network). Altered patterns of EEG microstates may reflect disturbed brain networks and have been reported in several neuropsychiatric disorders, such as Lewy body dementia (21), Alzheimer's disease (22), and bipolar disorder (23).
A growing body of research has found altered properties of EEG microstates in patients with schizophrenia (24–26). Such findings were interpreted as reflecting the brain network malfunction underlying the symptomatology of schizophrenia. In addition, the same deviant microstate abnormalities as in schizophrenia patients were found in high-risk individuals and unaffected relatives, indicating that EEG microstates may serve as an endophenotype for schizophrenia (27, 28). Moreover, links have been found between abnormal microstate patterns and schizophrenic symptoms (29, 30). In terms of clinical translation, microstate-based neurofeedback training has proven to be a candidate treatment for schizophrenia (31). Microstate was found to be an effective indicator of symptom improvements in TMS therapy for schizophrenia (32). Furthermore, microstate-based machine learning was tested and shown to be capable of effectively distinguishing those with schizophrenia from healthy people (33, 34).
Like EEG microstates, omega complexity can be used to measure the functioning of large-scale brain networks. Omega complexity is a linear indicator for spatial complexity extracted from the covariance matrix based on multiple channel EEG data (35). It can apply to the whole brain or to a specific brain area. Omega complexity assesses the degree of synchronization or coordination between spatially distributed neural processes. Therefore, it can reflect the connectivity of the neural network. Several studies revealed altered omega complexity in different cognitive processes (36, 37) and showed abnormality in various neuropsychiatric diseases (38, 39). Increased omega complexity has been found in schizophrenic patients, reflecting loosened brain networks in schizophrenia (40–42).
EEG microstate and omega complexity analyses have revealed brain network disturbance in the temporal and spatial domains in schizophrenia and other disorders. However, as mentioned before, the underlying pathophysiology of LLS may differ from that found in schizophrenia in younger people. Therefore, it is necessary to conduct studies specifically for LLS. This study aims to investigate the disturbance of brain networks in LLS through resting-state EEG microstate analysis and omega complexity analysis. Based on the above evidence, it was hypothesized that microstate dynamics and omega complexity are altered in LLS compared to those in healthy older people. Our findings provide a deeper understanding of the pathophysiology of LLS and new insights into the treatment of LLS patients.
Materials and Methods
Participants
EEG data were collected from 39 inpatients with LLS and 40 older adult normal controls (NCs). Inpatients with LLS were from the Department of Geriatric Psychiatry in the Affiliated Brain Hospital of Guangzhou Medical University. All patients met the DSM-IV criteria for schizophrenia. The diagnosis was confirmed by two independent, experienced psychiatrists. All patients were over 60 years of age. The exclusion criteria included a history of neurological diseases such as brain tumors, Parkinson's disease, stroke, severe head injury, and alcohol or drug abuse. All patients were receiving neuroleptic medication. Gender and age-matched NCs were recruited from the local communities. All NCs were screened for psychiatric disorders using the Mini International Neuropsychiatric Interview, 4th Edition (MINI). All NCs reported an absence of a family history of psychosis.
EEG Recording and Preprocessing
Resting-state EEG data were recorded by a 21-channel Nicolet One System (Natus®, Germany) at a sampling rate of 125 Hz with a bilateral mastoids reference for inpatients with LLS and a 64-channel Neuroscan quick-cap (Neuroscan Labs, USA) at a sampling rate of 1000 Hz with a nasal reference for NCs. EEG recording electrodes were placed according to the international 10–20 system with auxiliary electrodes for artifact detection. All electrode impedance was maintained below 5 kΩ during EEG recording. Patients were asked to sit comfortably with their eyes closed in a dimly lit room during the recording.
Resting-state EEG data were imported to MATLAB (Mathworks, v2013a) for preprocessing using the EEGLAB toolbox (43). EEG data were transformed into a 19-channel montage (FP1, FP2, F3, F4, Fz, F7, F8, C3, C4, Cz, P3, P4, Pz, O1, O2, T3, T4, T5, and T6) and were resampled to 125 Hz. EEG data were band-pass filtered between 1 and 60 Hz, and a notch filter was used to remove power line interference. Afterward, continuous data were segmented into 2,000 ms epochs. Visual inspection was used to eliminate the epochs contaminated by severe noise. Bad channels were removed and interpolated using spherical spline interpolation. Independent component analysis was performed to remove electrooculography, electromyography, and any other non-physiological artifacts. Then EEG data were recomputed against an average reference. The first 20 artifact-free epochs were selected for further analysis. There was no significant difference in the number of bad epochs rejected between groups (t = 0.177, p = 0.860). See the Supplementary Material for a flowchart of the process of EEG preprocessing.
EEG Microstate Analysis
EEG microstate analysis was performed using the EEGLAB toolbox and custom scripts based on MATLAB. First, EEG data were band-pass filtered between 2 and 20 Hz. The global field power (GFP) for each time point was computed, representing the variance of potential across all electrodes at a certain instance. The scalp topographies at peaks of GFP were extracted since these topographies have the highest signal-to-noise ratio and stability. Topographies for each group were submitted to the Topographic Atomize and Agglomerate Hierarchical Clustering Algorithm (T-AAHC). The number of clusters was set as four for better comparability with early studies (24, 44). For each group, four prototype microstate maps were yielded and then back-fitted to EEG data based on the criterion of maximal spatial correlation. These four maps were labeled as classes A, B, C, and D according to previous research based on a well-established standard (44), whereby class A exhibits a right frontal to left occipital orientation, class B exhibits a left frontal to right occipital orientation, class C has a prefrontal to occipital orientation, and class D shows a frontocentral to occipital orientation. Three microstate parameters (duration, occurrence, and time coverage) and microstate syntax were computed to quantify the temporal features of EEG microstates. Duration refers to the mean time coverage of a given microstate class. The occurrence is the number of times a certain microstate class occurs per second. The time coverage is the percentage of total occupied time for a given microstate class. Microstate syntax refers to transition probabilities from one class to another. See Figure 1 for an overview of the microstate analysis pipeline.
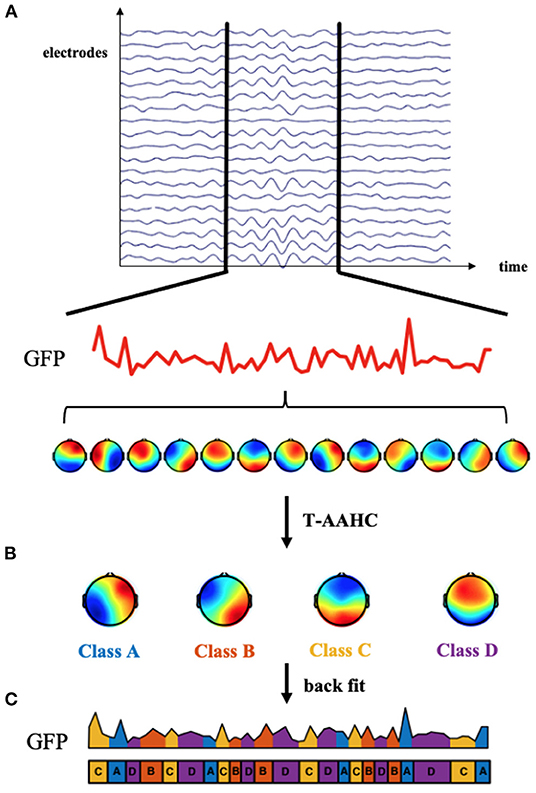
Figure 1. Microstate analysis methods. (A) The global field power (GFP) was computed at each time point. The topographies of electric potential at peaks of the GFP curve were extracted because GFP peaks have the highest signal-to-noise ratio. (B) These topographies were submitted to the Topographic Atomize and Agglomerate Hierarchical Clustering Algorithm (T-AAHC). Four canonical classes labeled (A–D) were assigned to each cluster. (C) Four microstate classes were back-fitted to continuous EEG data based on the criterion of maximal spatial correlation. Then, the microstate parameters and syntax could be calculated to quantify the microstate dynamics.
Spatial Complexity
Omega complexities were computed using MATLAB custom scripts in the following procedures: (1) For global omega complexity, all 19 EEG data electrodes were used to construct a 19×19 matrix. For anterior omega complexity, the data from electrodes FP1, FP2, F3, F4, Fz, F7, and F8 were selected to construct a 7×7 matrix. For posterior omega complexity, the data from electrodes O1, O2, P3, P4, Pz, T5, and T6 were selected to construct a 7×7 matrix. (2) Principal component analysis was used to compute the eigenvalues (λ) of each matrix. Eigenvalues represent the contribution of each component to the total variance. (3) To evaluate the relative contribution of each component, the eigenvalues were normalized to unit sum using the following equation:
Where, i refers to the number of the electrode, and λ' refers to the normalized eigenvalue. (4) The value of omega complexity (Ω) was calculated with the following equation:
The values of omega complexity vary from 1 to k (the total number of electrodes used), in which 1 represents the minimal spatial complexity and maximal synchronization, and vice versa. See Supplementary Material for a flowchart of omega complexity analysis.
Statistics
Statistical analyses were performed using SPSS 26 (IBM, USA). The significance level was set at 0.05. All statistical tests were two-tailed. For demographic characteristics, the independent student's t-test and chi-square test were used to compare continuous variable and categorical variables between groups, respectively. For each microstate parameter, a repeated-measures ANCOVA was performed with microstate classes (A–D) as a within-subject factor, group (LLS, NCs) as a between-subject factor, and age as a covariate. In cases where the interaction effect between microstate class and group was significant, a post hoc univariate ANCOVA was performed using the same covariate mentioned above. A univariate ANCOVA was performed with age as a covariate for each pair of transition probabilities. A Bonferroni correction was used for multiple comparisons. A univariate ANCOVA was performed with age as a covariate for global and regional omega complexity.
Results
Demographic and Clinical Characteristics
Table 1 shows the demographic and clinical characteristics. There was no significant difference between groups.
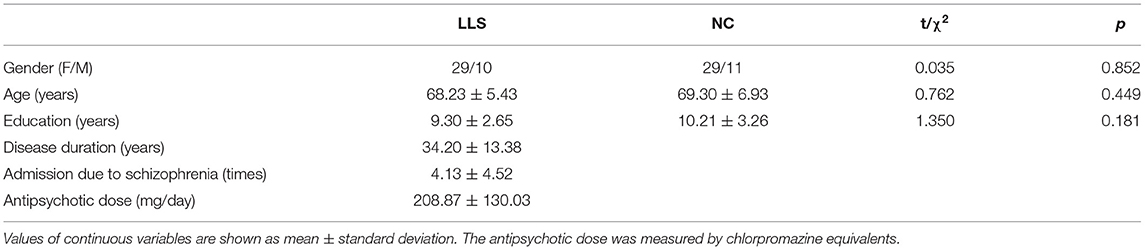
Table 1. Demographic and clinical characteristics of late-life schizophrenia patients (LLS) and normal controls (NCs).
Microstate Analysis
Figure 2 shows the topographical maps of the four microstate classes for patients with LLS and for NCs. Repeated-measures ANCOVAs yielded significant main effects for the groups in duration (F = 11.833, p < 0.001, η2 = 0.135) and occurrence (F = 21.332, p < 0.001, η2 = 0.219), revealing an increased mean duration and a decreased mean occurrence in patients with LLS compared with NCs. There is also a significant microstate class × Group interaction for duration (F = 3.040, p = 0.034, η2 = 0.110), occurrence (F = 6.321, p < 0.001, η2 = 0.204) and time coverage (F = 3.794, p = 0.014, η2 = 0.133). Post hoc one-way ANCOVAs showed that patients with LLS had significantly increased duration (F = 6.656, p = 0.012, η2 = 0.081), decreased occurrence (F = 30.884, p < 0.001, η2 = 0.289), and decreased time coverage (F = 5.031, p = 0.028, η2 = 0.062) of microstate class A compared with NCs. There was also a significant increase in duration (F = 22.589, p < 0.001, η2 = 0.229) and time coverage (F = 8.489, p = 0.005, η2 = 0.100) of microstate class D for patients with LLS compared with NCs. For class B (F = 9.873, p = 0.002, η2 = 0.115) and class C (F = 4.217, p = 0.043, η2 = 0.053), patients with LLS had significantly decreased occurrence compared with NCs.
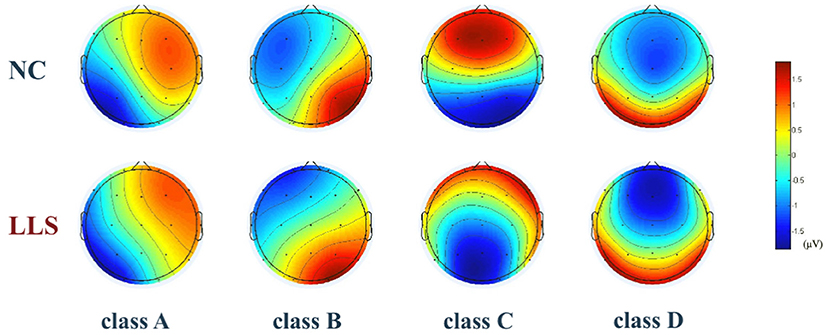
Figure 2. The topographical maps of the four microstate classes (A–D) in the late-life schizophrenia group (LLS) and normal controls group (NCs). Classes A to D were labeled according to previous literature based on a well-established descriptive standard, whereby class A exhibits a right frontal to left occipital orientation, class B exhibits a left frontal to right occipital orientation, class C has a prefrontal to occipital orientation, and class D shows a frontocentral to occipital orientation. Color is used to represent electric potential. Red represents positive values, and blue represents negative values (the polarity in microstate can be inverted).
For microstate syntax analysis, we found significantly decreased transition probabilities from classes A to B (F = 9.641, p = 0.032, η2 = 0.113) and from classes A to C (F = 9.696, p = 0.031, η2 =0.113) in patients with LLS compared with NCs. Transition probabilities were also found to significantly increase from classes B to D (F = 10.111, p = 0.026, η2 = 0.117) and from classes D to B (F = 10.675, p = 0.020, η2 = 0.123) in patients with LLC compared with NCs. Figure 3 shows the details.
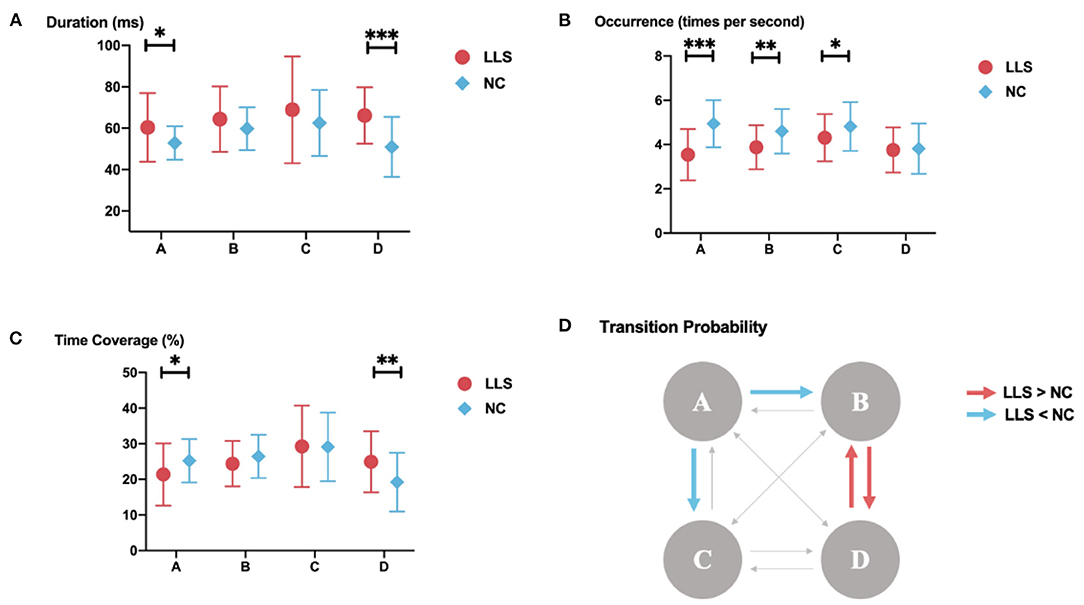
Figure 3. Results of the microstate analysis for late-life schizophrenia (LLS) and normal controls (NCs). (A–C) microstate parameters for late-life schizophrenia and normal controls. (A) duration; (B) occurrence; (C) time coverage for late-life schizophrenia and normal controls. The parameters of each class are displayed from left to right. Red icons indicate parameters of late-life schizophrenia, blue icons indicate parameters of normal controls, and lines through icons indicate standard deviation. *indicates p-value ≤ 0.05, **indicates p-value ≤ 0.01, ***indicates p-value ≤ 0.001. (D) results of syntax analysis. Red arrows indicate significantly higher transition probabilities for patients with late-life schizophrenia compared with to controls. Blue arrows indicate significantly lower transition probabilities for patients with late-life schizophrenia compared with to controls.
Omega Complexity
Univariate ANCOVAs revealed that global omega complexity is significantly higher in patients with LLS compared with NCs (F = 7.274, p = 0.009, η2 = 0.087). For regional omega complexity, we found that anterior omega complexity is significantly higher for patients with LLS compared with NCs (F = 22.819, p < 0.001, η2 = 0.231). However, there is no significant difference in posterior omega complexity between groups. Figure 4 shows the details.
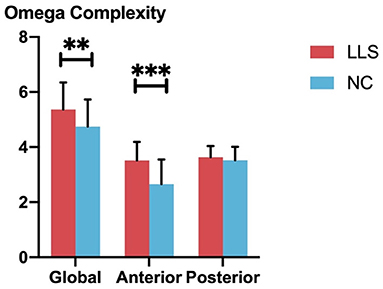
Figure 4. Comparison of global and regional omega complexity between patients with late-life schizophrenia (LLS) and normal controls (NCs). Red bars indicate the omega complexities of patients with LLS, and blue bars indicate the omega complexity of NCs. From left to right, three pairs of bars indicate global omega complexity, anterior complexity, and posterior complexity for each group, respectively. Standard deviations are indicated using the error bar. **indicates p-value ≤ 0.01, ***indicates p-value ≤ 0.001.
Discussion
In the current study, EEG microstate and omega complexity analyses were used to investigate the pathophysiology of patients with LLS. Microstate analysis revealed altered parameters for certain microstate classes in patients with LLS. An altered pattern of microstate syntax was also found. Omega analysis revealed that patients with LLS have higher global complexity and higher anterior complexity.
A large body of prior literature found increased parameters of class C and decreased parameters of class D in patients with schizophrenia compared with healthy controls (15, 27, 28). These findings show a certain consistency. A meta-analysis including seven studies reported that microstate class C was more frequent and microstate class D was shorter in schizophrenia than in controls with a medium effect size (24). Simultaneous EEG-fMRI recording found that microstate class C was associated with the salience network (17), which functions to identify the most relevant stimulus from enormous internal and external inputs to guide appropriate actions (45). Therefore, altered parameters of class C in schizophrenia may reflect a disturbance in the salience network, in line with the hypothesis that a disarranged salience network underlies the difficulty of schizophrenic patients in differentiating between the inner world and the outside world (46). Similarly, microstate class D is related to the frontoparietal attention network (17). Deviant dynamics of class D in schizophrenia may reflect impaired cognitive functions involving attentional processes, such as have been widely found in patients with schizophrenia (47). However, this consistent pattern of schizophrenia is contrary to our findings.
We found increased duration and time coverage of class D and decreased occurrence of class C in patients with LLS compared with NCs. The reasons that may account for the discrepancy are as follows. Firstly, despite the opposite direction, our findings of deviant parameters of classes C and D also suggest disorganized salience networks and attention networks in patients with LLS. The opposite direction of our findings compared to those reported by previous studies may be explained by the differences between older and younger patients with schizophrenia in terms of pathophysiology and symptomology. A possible explanation is that patients with LLS have less prominent positive symptoms, which correlate negatively with the duration of class D (31, 48). Aging-related changes in brain function may also partially account for this difference. However, the small number of studies on LLS makes further interpretation challenging. In addition, the heterogeneity of patient characteristics between studies may contribute to inconsistencies between findings. For example, some studies included first-episode unmedicated patients (48, 49), while others included chronic medicated patients (28, 30). However, the confounding effect of antipsychotics and disease chronicity remains controversial. One study found no significant difference in microstate parameters between chronic patients and first-episode patients with schizophrenia (27), while another study found different results (50). Furthermore, this difference may derive from the heterogeneity between samples. Because LLS is a highly heterogeneous disease, our sample size may not be large enough to cover the whole spectrum of LLS.
Microstate analysis showed an increased mean duration and decreased mean occurrence in patients with LLS compared with NCs. The duration of all classes also has a significant increase or a tendency to increase in patients with LLS. Similarly, significant decreases or a tendency to decrease of occurrence can be found in all classes of patients with LLS. This pattern of microstates is rather general and not specific to a certain class. Microstate patterns can reflect brain dynamics, capturing neural activity at the millisecond timescale (51). A less frequent and more prolonged microstate pattern suggested a slowing and inflexible brain dynamic in patients with LLS. Reduced brain dynamic was found to be related to poor cognitive functions (52, 53). Aging is also accompanied by a decline in brain dynamics (54, 55). Similar slowing microstate dynamics have been found in Lewy body dementia, which is viewed as underlying cognitive fluctuation and slowing information processing in Lewy body dementia (21). Therefore, the slowing microstate dynamics we found may reflect the widely reported marked cognitive impairments in LLS (4, 5).
In recent times, the link between EEG microstates and intrinsic neural oscillation has been elucidated. The formation and temporal dynamics of the microstates were proved to be dominated by the alpha-band rhythm (56–58). Among the four canonical microstate classes, class C has the strongest alpha oscillations over a wide cortex range (56). Alpha-band oscillations are considered to have an inhibitory function and play a crucial role in cognitive processes such as attention (59). Class C was also found to be more prominent in the resting state than in the task performance state (60). Therefore, it can be inferred that activation of class C may reflect inhibition of specific cortical areas and be involved in complex cognitive activities. Regular microstate class C characteristics represent organized inhibitory activity, essential for various cognitive functions. Furthermore, deviant class C parameters may represent a disruption of this order and, therefore, may lead to cognitive impairment. The current study found a significant decrease in the occurrence of class C in LLS, and the less frequent class C may contribute to disorganized brain function, thereby leading to the cognitive and psychotic symptoms of LLS.
Microstate syntax analysis found altered microstate transition probabilities in LLS. Several studies have reported the presence of abnormal microstate syntax in patients with schizophrenia; however, the results are somewhat inconsistent (23, 33, 49). It has been suggested that microstate syntax may represent the sequential activation of distinct brain networks. Therefore, the abnormal microstate syntax in LLS may represent a disorganized operation of brain network switching, giving rise to the aberrant behaviors in LLS. Based on the resting-state networks correlated to the four microstates (17), increased transition probabilities between classes B and D in LLS can be inferred as an enhanced interaction between those key nodes located in visual and attention networks. Conversely, decreased transition probabilities from classes A to B and from classes A to C may reflect decreased interaction between key nodes in the corresponding networks.
We found increased global omega complexity and anterior omega complexity in LLS compared with NCs, whereas no significant difference was found for omega complexity in the posterior region between groups. Omega complexity is considered a measure of synchronization of the distributed electrical activities or the number of independent neural processes (35). Increased complexity reflects reduced cooperation and enhanced independence of spatially distributed brain activity, and vice versa. Higher complexity can be found in relatively active states, thereby suggesting an increase in the independent information processing process. For example, omega complexity increases in eyes-open conditions and decreases during sleep (61, 62). To our knowledge, three studies investigated omega complexity in patients with schizophrenia. Irisawa et al. found increased global omega complexity in patients with schizophrenia (42). Saito et al. found that anterior omega complexity is significantly increased in schizophrenia (40). Kikuchi et al. revealed that schizophrenic patients have higher omega complexity in gamma and below-gamma bands, and the frontal area contributes significantly to the higher omega complexity (41). This accumulated evidence indicates decreased cooperativity and loosened connectivity of the active neural processes of schizophrenia, particularly in the anterior area, in line with the hypothesis that symptoms of schizophrenia are caused by disconnected brain networks, including those located in the anterior area (46, 63, 64). In line with previous studies on schizophrenia in younger people, we found significantly higher omega complexity of the whole brain and anterior region in LLS compared with NCs, suggesting that LLS has loosened connectivity of brain networks, especially those located in the anterior area.
This study has several limitations that should be considered when interpreting the findings. First, assessments of clinical symptoms and cognitive function were not performed. Further studies with detailed clinical and neuropsychological assessments are needed to investigate the relationship between schizophrenic symptoms, cognitive function, and electrophysiological indicators in LLS patients. Second, the confounding factors of drugs and comorbidities were not controlled. All participants in this study were older people. Some of them may have complex health problems (such as hypertension, diabetes, and coronary heart disease) and take various medications, potentially exhibiting confounding effects on brain function. Future studies could focus specifically on this potential effect. Third, considering the highly heterogeneous nature of schizophrenia spectrum disorders, the sample size of this study was small. Future studies with larger sample sizes are needed to confirm the findings.
In conclusion, this study revealed altered EEG microstate parameters, microstate syntax, and omega complexity in patients with LLS, reflecting disturbed brain networks underlying the symptoms of LLS. Our findings provide a better understanding of the pathophysiology of LLS and may facilitate the clinical application of EEG microstate and omega complexity. Because microstate was found to be an indicator for TMS efficacy (32), and microstate-based neurofeedback may serve as a therapy for schizophrenia patients (31), clarifying the microstate pattern of LLS may facilitate treatment strategies and the identification of intervention targets for LLS.
Data Availability Statement
The raw data supporting the conclusions of this article will be made available by the authors, without undue reservation.
Ethics Statement
The studies involving human participants were reviewed and approved by the Ethics Committees of the Affiliated Brain Hospital of Guangzhou Medical University. The patients/participants provided their written informed consent to participate in this study.
Author Contributions
All authors contributed to the writing and revision of the manuscript, read, and approved the final manuscript.
Funding
This study was supported by the National Natural Science Foundation of China (No. 82171533), Foundation of Guangdong Province, China (2022A1515011623), Medical Scientific Technology Research Foundation of Guangdong Province, China, (No. A2020446), Key Medical Specialty Construction Project of Traditional Chinese Medical Science in the 13th Five-Year Plan of Guangdong Province, and Key Medical Specialty Construction Project of Traditional Chinese Medical Science of Guangzhou (2020–2022). The funders had no role in the study design, data collection and analysis, decision to publish or preparation of the manuscript.
Conflict of Interest
The authors declare that the research was conducted in the absence of any commercial or financial relationships that could be construed as a potential conflict of interest.
Publisher's Note
All claims expressed in this article are solely those of the authors and do not necessarily represent those of their affiliated organizations, or those of the publisher, the editors and the reviewers. Any product that may be evaluated in this article, or claim that may be made by its manufacturer, is not guaranteed or endorsed by the publisher.
Acknowledgments
The authors would like to acknowledge the participants in this study for their significant contribution.
Supplementary Material
The Supplementary Material for this article can be found online at: https://www.frontiersin.org/articles/10.3389/fpsyt.2022.907802/full#supplementary-material
References
1. Cohen CI, Meesters PD, Zhao J. New perspectives on schizophrenia in later life: implications for treatment, policy, and research. Lancet Psychiatry. (2015) 2:340–50. doi: 10.1016/S2215-0366(15)00003-6
2. Ciompi L. Catamnestic long-term study on the course of life and aging of schizophrenics. Schizophr Bull. (1980) 6:606–18. doi: 10.1093/schbul/6.4.606
3. Sable JA, Jeste DV. Antipsychotic treatment for late-life schizophrenia. Curr Psychiatry Rep. (2002) 4:299–306. doi: 10.1007/s11920-996-0050-y
4. Harvey PD, Bertisch H, Friedman JI, Marcus S, Parrella M, White L, et al. The course of functional decline in geriatric patients with schizophrenia: cognitive-functional and clinical symptoms as determinants of change. Am J Geriatr Psychiatry. (2003) 11:610–9. doi: 10.1097/00019442-200311000-00005
5. Harvey PD, Silverman JM, Mohs RC, Parrella M, White L, Powchik P, et al. Cognitive decline in late-life schizophrenia: a longitudinal study of geriatric chronically hospitalized patients. Biol Psychiatry. (1999) 45:32–40. doi: 10.1016/S0006-3223(98)00273-X
6. Huo L, Lu X, Wu F, Huang X, Ning Y, Zhang XY. Diabetes in late-life schizophrenia: prevalence, factors, and association with clinical symptoms. J Psychiatr Res. (2021) 132:44–9. doi: 10.1016/j.jpsychires.2020.09.026
7. Druss BG, Bradford DW, Rosenheck RA, Radford MJ, Krumholz HM. Mental disorders and use of cardiovascular procedures after myocardial infarction. Jama. (2000) 283:506–11. doi: 10.1001/jama.283.4.506
8. Jockwitz C, Caspers S, Lux S, Eickhoff SB, Jütten K, Lenzen S, et al. Influence of age and cognitive performance on resting-state brain networks of older adults in a population-based cohort. Cortex. (2017) 89:28–44. doi: 10.1016/j.cortex.2017.01.008
9. Keshavan MS, Mulsant BH, Sweet RA, Pasternak R, Zubenko GS, Krishnan RR, et al. changes in schizophrenia in late life: a preliminary controlled study. Psychiatry Res. (1996) 60:117–23. doi: 10.1016/0165-1781(96)02867-3
10. Cohen CI, Cohen GD, Blank K, Gaitz C, Katz IR, Leuchter A, et al. Schizophrenia and older adults. An overview: directions for research and policy. Am J Geriatr Psychiatry. (2000) 8:19–28. doi: 10.1097/00019442-200002000-00003
11. Palaniyappan L, White TP, Liddle PF. The concept of salience network dysfunction in schizophrenia: from neuroimaging observations to therapeutic opportunities. Curr Top Med Chem. (2012) 12:2324–38. doi: 10.2174/156802612805289881
12. Friston K, Brown HR, Siemerkus J, Stephan KE. The dysconnection hypothesis (2016). Schizophr Res. (2016) 176:83–94. doi: 10.1016/j.schres.2016.07.014
13. Stephan KE, Friston KJ, Frith CD. Dysconnection in schizophrenia: from abnormal synaptic plasticity to failures of self-monitoring. Schizophr Bull. (2009) 35:509–27. doi: 10.1093/schbul/sbn176
14. Lehmann D, Ozaki H, Pal I. EEG. alpha map series: brain micro-states by space-oriented adaptive segmentation. Electroencephalogr Clin Neurophysiol. (1987) 67:271–88. doi: 10.1016/0013-4694(87)90025-3
15. Lehmann D, Faber PL, Galderisi S, Herrmann WM, Kinoshita T, Koukkou M, et al. EEG microstate duration and syntax in acute, medication-naive, first-episode schizophrenia: a multi-center study. Psychiatry Res. (2005) 138:141–56. doi: 10.1016/j.pscychresns.2004.05.007
16. Khanna A, Pascual-Leone A, Michel CM, Farzan F. Microstates in resting-state EEG: current status and future directions. Neurosci Biobehav Rev. (2015) 49:105–13. doi: 10.1016/j.neubiorev.2014.12.010
17. Britz J, Van De Ville D, Michel CM. BOLD. correlates of EEG topography reveal rapid resting-state network dynamics. Neuroimage. (2010) 52:1162–70. doi: 10.1016/j.neuroimage.2010.02.052
18. Custo A, Van De Ville D, Wells WM, Tomescu MI, Brunet D, Michel CM. Electroencephalographic Resting-State Networks: Source Localization of Microstates. Brain Connect. (2017) 7:671–82. doi: 10.1089/brain.2016.0476
19. Musso F, Brinkmeyer J, Mobascher A, Warbrick T, Winterer G. Spontaneous brain activity and EEG microstates. A novel EEG/fMRI analysis approach to explore resting-state networks. Neuroimage. (2010) 52:1149–61. doi: 10.1016/j.neuroimage.2010.01.093
20. Yuan H, Zotev V, Phillips R, Drevets WC, Bodurka J. Spatiotemporal dynamics of the brain at rest–exploring EEG microstates as electrophysiological signatures of BOLD resting state networks. Neuroimage. (2012) 60:2062–72. doi: 10.1016/j.neuroimage.2012.02.031
21. Schumacher J, Peraza LR, Firbank M, Thomas AJ, Kaiser M, Gallagher P, et al. Dysfunctional brain dynamics and their origin in Lewy body dementia. Brain. (2019) 142:1767–82. doi: 10.1093/brain/awz069
22. Musaeus CS, Engedal K, Høgh P, Jelic V, Khanna AR, Kjaer TW, et al. Changes in the left temporal microstate are a sign of cognitive decline in patients with Alzheimer's disease. Brain Behav. (2020) 10:e01630. doi: 10.1002/brb3.1630
23. Wang F, Hujjaree K, Wang X. Electroencephalographic Microstates in Schizophrenia and Bipolar Disorder. Front Psychiatry. (2021) 12:638722. doi: 10.3389/fpsyt.2021.638722
24. Rieger K, Diaz Hernandez L, Baenninger A, Koenig T. 15 years of microstate research in Schizophrenia - where are we? A meta-analysis. Front Psychiatry. (2016) 7:22. doi: 10.3389/fpsyt.2016.00022
25. Sun Q, Zhao L, Tan L. Abnormalities of electroencephalography microstates in drug-naïve, first-episode schizophrenia. Front Psychiatry. (2022) 13:853602. doi: 10.3389/fpsyt.2022.853602
26. Chen PH, Ku HL, Wang JK, Kang JH, Hsu TY. Electroencephalographic microstates are correlated with global functioning in schizophrenia but not in bipolar disorder. Clin EEG Neurosci. (2022) 15500594221098286. doi: 10.1177/15500594221098286
27. da Cruz JR, Favrod O, Roinishvili M, Chkonia E, Brand A, Mohr C, et al. EEG microstates are a candidate endophenotype for schizophrenia. Nat Commun. (2020) 11:3089. doi: 10.1038/s41467-020-16914-1
28. Tomescu MI, Rihs TA, Roinishvili M, Karahanoglu FI, Schneider M, Menghetti S, et al. Schizophrenia patients and 22q11.2 deletion syndrome adolescents at risk express the same deviant patterns of resting state EEG microstates: A candidate endophenotype of schizophrenia. Schizophr Res Cogn. (2015) 2:159–65. doi: 10.1016/j.scog.2015.04.005
29. Kindler J, Hubl D, Strik WK, Dierks T, Koenig T. Resting-state EEG in schizophrenia: auditory verbal hallucinations are related to shortening of specific microstates. Clin Neurophysiol. (2011) 122:1179–82. doi: 10.1016/j.clinph.2010.10.042
30. Giordano GM, Koenig T, Mucci A, Vignapiano A, Amodio A, Di Lorenzo G, et al. Neurophysiological correlates of Avolition-apathy in schizophrenia: A resting-EEG microstates study. Neuroimage Clin. (2018) 20:627–36. doi: 10.1016/j.nicl.2018.08.031
31. Diaz Hernandez L, Rieger K, Baenninger A, Brandeis D, Koenig T. Towards using microstate-neurofeedback for the treatment of psychotic symptoms in schizophrenia. A feasibility study in healthy participants. Brain Topogr. (2016) 29:308–21. doi: 10.1007/s10548-015-0460-4
32. Pan Z, Xiong D, Xiao H, Li J, Huang Y, Zhou J, et al. The effects of repetitive transcranial magnetic stimulation in patients with chronic schizophrenia: insights from EEG microstates. Psychiatry Res. (2021) 299:113866. doi: 10.1016/j.psychres.2021.113866
33. Baradits M, Bitter I, Czobor P. Multivariate patterns of EEG microstate parameters and their role in the discrimination of patients with schizophrenia from healthy controls. Psychiatry Res. (2020) 288:112938. doi: 10.1016/j.psychres.2020.112938
34. Kim K, Duc NT, Choi M, Lee B. EEG microstate features for schizophrenia classification. PLoS ONE. (2021) 16:e0251842. doi: 10.1371/journal.pone.0251842
35. Wackermann J. Beyond mapping: estimating complexity of multichannel EEG recordings. Acta Neurobiol Exp. (1996) 56:197–208.
36. Kondakor I, Brandeis D, Wackermann J, Kochi K, Koenig T, Frei E, et al. Multichannel EEG fields during and without visual input: frequency domain model source locations and dimensional complexities. Neurosci Lett. (1997) 226:49–52. doi: 10.1016/S0304-3940(97)00224-3
37. Molnár M, Csuhaj R, Csikós D, Hamvai C, Czigler B, Bálint A, et al. [Psychophysiologic and clinical aspects of EEG synchronization related to cognitive processes]. Ideggyogy Sz. (2005) 58:393–401.
38. Yoshimura M, Isotani T, Yagyu T, Irisawa S, Yoshida T, Sugiyama M, et al. Global approach to multichannel electroencephalogram analysis for diagnosis and clinical evaluation in mild Alzheimer's disease. Neuropsychobiology. (2004) 49:163–6. doi: 10.1159/000076724
39. Gao F, Jia H, Wu X, Yu D, Feng Y. Altered resting-state EEG microstate parameters and enhanced spatial complexity in male adolescent patients with mild spastic diplegia. Brain Topogr. (2017) 30:233–44. doi: 10.1007/s10548-016-0520-4
40. Saito N, Kuginuki T, Yagyu T, Kinoshita T, Koenig T, Pascual-Marqui RD, et al. Global, regional, and local measures of complexity of multichannel electroencephalography in acute, neuroleptic-naive, first-break schizophrenics. Biol Psychiatry. (1998) 43:794–802. doi: 10.1016/S0006-3223(97)00547-7
41. Kikuchi M, Hashimoto T, Nagasawa T, Hirosawa T, Minabe Y, Yoshimura M, et al. Frontal areas contribute to reduced global coordination of resting-state gamma activities in drug-naïve patients with schizophrenia. Schizophr Res. (2011) 130:187–94. doi: 10.1016/j.schres.2011.06.003
42. Irisawa S, Isotani T, Yagyu T, Morita S, Nishida K, Yamada K, et al. Increased omega complexity and decreased microstate duration in nonmedicated schizophrenic patients. Neuropsychobiology. (2006) 54:134–9. doi: 10.1159/000098264
43. Delorme A, Makeig S. EEGLAB an open source toolbox for analysis of single-trial EEG dynamics including independent component analysis. J Neurosci Methods. (2004) 134:9–21. doi: 10.1016/j.jneumeth.2003.10.009
44. Koenig T, Prichep L, Lehmann D, Sosa PV, Braeker E, Kleinlogel H, et al. Millisecond by millisecond, year by year: normative EEG microstates and developmental stages. Neuroimage. (2002) 16:41–8. doi: 10.1006/nimg.2002.1070
45. Menon V, Uddin LQ. Saliency, switching, attention and control: a network model of insula function. Brain Struct Funct. (2010) 214:655–67. doi: 10.1007/s00429-010-0262-0
46. Dong D, Wang Y, Chang X, Luo C, Yao D. Dysfunction of Large-Scale Brain Networks in Schizophrenia: A Meta-analysis of Resting-State Functional Connectivity. Schizophr Bull. (2018) 44:168–81. doi: 10.1093/schbul/sbx034
47. Fioravanti M, Bianchi V, Cinti ME. Cognitive deficits in schizophrenia: an updated metanalysis of the scientific evidence. BMC Psychiatry. (2012) 12:64. doi: 10.1186/1471-244X-12-64
48. Koenig T, Lehmann D, Merlo MC, Kochi K, Hell D, Koukkou M, et al. deviant EEG brain microstate in acute, neuroleptic-naive schizophrenics at rest. Eur Arch Psychiatry Clin Neurosci. (1999) 249:205–11. doi: 10.1007/s004060050088
49. Nishida K, Morishima Y, Yoshimura M, Isotani T, Irisawa S, Jann K, et al. EEG microstates associated with salience and frontoparietal networks in frontotemporal dementia, schizophrenia and Alzheimer's disease. Clin Neurophysiol. (2013) 124:1106–14. doi: 10.1016/j.clinph.2013.01.005
50. Mackintosh AJ, Borgwardt S, Studerus E, Riecher-Rössler A, de Bock R, Andreou C, et al. Microstate differences in medicated vs. medication-naïve first-episode psychosis patients. Front Psychiatry. (2020) 11:600606. doi: 10.3389/fpsyt.2020.600606
51. Van de Ville D, Britz J, Michel CM. EEG. microstate sequences in healthy humans at rest reveal scale-free dynamics. Proc Natl Acad Sci U S A. (2010) 107:18179–84. doi: 10.1073/pnas.1007841107
52. Jia H, Hu X, Deshpande G. Behavioral relevance of the dynamics of the functional brain connectome. Brain Connect. (2014) 4:741–59. doi: 10.1089/brain.2014.0300
53. McIntosh AR, Kovacevic N, Itier RJ. Increased brain signal variability accompanies lower behavioral variability in development. PLoS Comput Biol. (2008) 4:e1000106. doi: 10.1371/journal.pcbi.1000106
54. Grady CL, Garrett DD. Brain signal variability is modulated as a function of internal and external demand in younger and older adults. Neuroimage. (2018) 169:510–23. doi: 10.1016/j.neuroimage.2017.12.031
55. Guitart-Masip M, Salami A, Garrett D, Rieckmann A, Lindenberger U, Bäckman L, et al. Variability is Related to Dopaminergic Neurotransmission and Cognitive Aging. Cereb Cortex. (2016) 26:2074–83. doi: 10.1093/cercor/bhv029
56. Milz P, Pascual-Marqui RD, Achermann P, Kochi K, Faber PL. The EEG microstate topography is predominantly determined by intracortical sources in the alpha band. Neuroimage. (2017) 162:353–61. doi: 10.1016/j.neuroimage.2017.08.058
57. von Wegner F, Bauer S, Rosenow F, Triesch J, Laufs H. EEG. microstate periodicity explained by rotating phase patterns of resting-state alpha oscillations. Neuroimage. (2021) 224:117372. doi: 10.1016/j.neuroimage.2020.117372
58. Javed E, Croce P, Zappasodi F, Gratta CD. Hilbert spectral analysis of EEG data reveals spectral dynamics associated with microstates. J Neurosci Methods. (2019) 325:108317. doi: 10.1016/j.jneumeth.2019.108317
59. Andreou C, Faber PL, Leicht G, Schoettle D, Polomac N, Hanganu-Opatz IL, et al. Resting-state connectivity in the prodromal phase of schizophrenia: insights from EEG microstates. Schizophr Res. (2014) 152:513–20. doi: 10.1016/j.schres.2013.12.008
60. Milz P, Faber PL, Lehmann D, Koenig T, Kochi K, Pascual-Marqui RD. The functional significance of EEG microstates–associations with modalities of thinking. Neuroimage. (2016) 125:643–56. doi: 10.1016/j.neuroimage.2015.08.023
61. Szelenberger W, Wackermann J, Skalski M, Niemcewicz S, Drojewski J. Analysis of complexity of EEG during sleep. Acta Neurobiol Exp. (1996) 56:165–9.
62. Wackermann J. Towards a quantitative characterisation of functional states of the brain: from the non-linear methodology to the global linear description. Int J Psychophysiol. (1999) 34:65–80. doi: 10.1016/S0167-8760(99)00038-0
63. Koenig T, Lehmann D, Saito N, Kuginuki T, Kinoshita T, Koukkou M. Decreased functional connectivity of EEG theta-frequency activity in first-episode, neuroleptic-naïve patients with schizophrenia: preliminary results. Schizophr Res. (2001) 50:55–60. doi: 10.1016/S0920-9964(00)00154-7
Keywords: late-life schizophrenia, microstate, omega complexity, spatial complexity, electroencephalogram
Citation: Lin G, Wu Z, Chen B, Zhang M, Wang Q, Liu M, Zhang S, Yang M, Ning Y and Zhong X (2022) Altered Microstate Dynamics and Spatial Complexity in Late-Life Schizophrenia. Front. Psychiatry 13:907802. doi: 10.3389/fpsyt.2022.907802
Received: 30 March 2022; Accepted: 03 June 2022;
Published: 27 June 2022.
Edited by:
Gaelle Eve Doucet, Boys Town National Research Hospital, United StatesReviewed by:
Sunaina Soni, All India Institute of Medical Sciences, IndiaNathan Petro, Boys Town National Research Hospital, United States
Copyright © 2022 Lin, Wu, Chen, Zhang, Wang, Liu, Zhang, Yang, Ning and Zhong. This is an open-access article distributed under the terms of the Creative Commons Attribution License (CC BY). The use, distribution or reproduction in other forums is permitted, provided the original author(s) and the copyright owner(s) are credited and that the original publication in this journal is cited, in accordance with accepted academic practice. No use, distribution or reproduction is permitted which does not comply with these terms.
*Correspondence: Yuping Ning, bmluZ2plbnlAMTI2LmNvbQ==; Xiaomei Zhong, bG92bGF1Z2hAMTYzLmNvbQ==
†These authors have contributed equally to this work and share first authorship