 Wenjie Liu
 Luolong Cao
 Haoran Luo
 Ying Wang
- 1School of Computer Information and Engineering, Changzhou Institute of Technology, Changzhou, China
- 2College of Intelligent Systems Science and Engineering, Harbin Engineering University, Harbin, China
- 3School of Computer Science and Engineering, Changshu Institute of Technology, Suzhou, China
Alzheimer's disease (AD) is an age-related neurological disease, which is closely associated with hippocampus, and subdividing the hippocampus into voxels can capture subtle signals that are easily missed by region of interest (ROI) methods. Therefore, studying interpretable associations between voxels can better understand the effect of voxel set on the hippocampus and AD. In this study, by analyzing the hippocampal voxel data, we propose a novel method based on clustering genetic random forest to identify the important voxels. Specifically, we divide the left and right hippocampus into voxels to constitute the initial feature set. Moreover, the random forest is constructed using the randomly selected samples and features. The genetic evolution is used to amplify the difference in decision trees and the clustering evolution is applied to generate offspring in genetic evolution. The important voxels are the features that reach the peak classification. The results demonstrate that our method has good classification and stability. Particularly, through biological analysis of the obtained voxel set, we find that they play an important role in AD by affecting the function of the hippocampus. These discoveries demonstrate the contribution of the voxel set to AD.
Introduction
Alzheimer's disease (AD) can severely affect a variety of cognitive functions, including memory. Since the hippocampus played an important role in memory, there was interest in the possibility that hippocampal degeneration led to an age-related reduction (1). Research on the hippocampus had mainly focused on changes in hippocampal morphology and function, such as the impact of changes in volume on AD (2, 3), and which functions of the hippocampus can be caused by changes in shape (4, 5). These studies lacked the exploration of more subtle changes in the hippocampus. Based on this problem, scientists divided the hippocampus into different hippocampal subregions (6). From the perspective of subregions, they studied which specific changes in the hippocampus led to changes in hippocampal function that eventually was related to AD (7).
In recent years, research on AD using machine learning became an important field. Jiao et al. applied the graph regularization non-negative matrix factorization to factorize the vectorized dynamic functional networks matrix and evaluated the similarity between early mild cognitive impairment (EMCI) and healthy control (HC) (8, 9). The MCI participants were divided into two groups (early MCI and late MCI) according to the severity of amnestic impairment in ANDI. Among these participants, the early MCI (EMCI) group meets the following condition: 1 Standard Deviation ≤ memory test performance—standardized norms ≤ 1.5 Standard Deviation. The late MCI (LMCI) group meets the following condition: memory test performance—standardized norms ≥ 1.5 Standard Deviation. Li et al. constructed a neural network model using magnetic resonance imaging (MRI) images and used transfer learning to train the constructed model, demonstrating for the first time that non-invasive MRI is related to the development of AD (10). Fidel et al. used genetic algorithm and support vector machine (SVM) to screen 370,750 SNPs and obtained the pathways related to colorectal cancer (11). Sun et al. proposed a multi-layer deep neural network survival model and compared the survival model based on classical machine learning. The proposed model was not only superior in accuracy to existing survival models but also could screen out effective risk groups by learning the complex structure between SNPs (12). Furthermore, there were studies based on brain functional networks and variational auto-encoder for mild cognitive impairment research (13, 14).
Due to the important association between the hippocampus and AD, the study of the hippocampus combined with machine learning was an important research field. Yi et al. outlined an application of machine learning methods to brain MRI images, and introduced commonly hippocampal segmentation methods (15). Li et al. applied the feature detection method based on SVM and leave-1-out cross-validation to classify AD and HC (16). Tsao et al. used a convex fused sparse group lasso method and multivariate tensor-based morphometry method to predict the AD features (17). Liu et al. introduced a fusion method using the deep belief network method and the lattice Boltzmann method to segment the MRI image, and the correlation and consistency were compared with manual segmentation methods (18). Using the SVM, random forest, logistic regression, and K-Nearest Neighbors, Uysal et al. analyzed the MRI images to distinguish stages of AD (19). However, these studies were focused on the whole hippocampus, and studies on subtle hippocampal voxels were lacking.
To bridge this gap, we proposed a novel method based on clustering genetic random forest to identify the important hippocampal voxels. Firstly, we processed the MRI images to obtain the voxel-based images. Then, we constructed the initial feature set using the resulting images. Subsequently, we applied the random forest, genetic evolution, and clustering evolution to calculate the classification accuracy and mine the features. The experiment results demonstrate that the identified voxels were associated with AD by affecting the function of the hippocampus.
Materials and Methods
Imaging Data
In this study, a total of 1,515 non-Hispanic white participants had high-quality genotype data and MRI image data in ANDI database at the same time, so they were included in the study after quality control. We downloaded 1,515 participants with MRI scans from the Alzheimer's Disease Neuroimaging Initiative (ADNI) database (adni.loni.usc.edu). Table 1 shows the characteristics of the 1,515 participants.
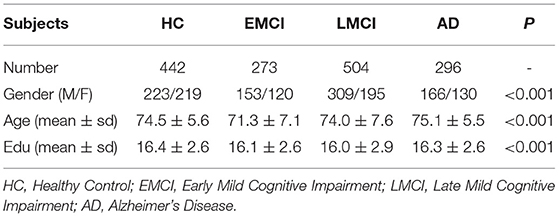
Table 1. Participant characteristics.
Using the T1-weighted template, we aligned the MRI scans collected by voxel-based morphometry. Then, we normalized the aligned images to the Montreal Neurological Institute space. The resulting images were segmented, extracted, and smoothed with an 8-mm FWHM kernel. The hippocampus was extracted using the Automatic Anatomical Labeling atlas (20), freesurfer 6.0 (6), and FMRIB Software Library v6.0 (21). To reduce the time for subsequent analysis, we down-sampled the original images (182 × 218 × 182) in three dimensions and obtained the images of size 61 × 73 × 61.
Construction of Clustering Genetic Random Forest
As description in Imaging Data, we obtained the coordinate information of the left and right hippocampus, including 281 voxels in left hippocampus and 302 voxels in right hippocampus, and saved them as matrices M and N (M for left hippocampus and N for right hippocampus). Let vmi and vnj represent the elements of M and N. Then we combined the two matrices to get the initial feature site set V (V = [vm1, vm2, …, vmi, vn1, vn2, …, vnj], i = 281, j = 302).
As the representative classifier of machine learning, the random forest was used to identify important features from a large number of features. Therefore, we applied the clustering genetic random forest to mine the important voxel set and the random forest to obtain the initial decision trees and genetic evolution was introduced to evolve decision trees. The clustering evolution was introduced during genetic evolution to obtain new offspring. Through these steps, the features with high classification accuracy were selected from V. The schematic diagram is shown in Figure 1.
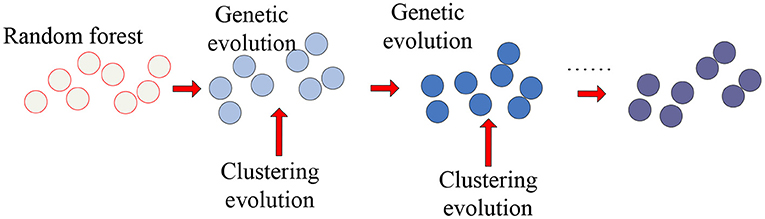
Figure 1. The schematic diagram of clustering genetic random forest.
We used the AD and HC groups to constitute the initial dataset S. The S was defined as Equation 1.
where xk is the voxels of S, and yk is the corresponding label of xk (AD is represented by −1 and HC is represented by 1).
The S was randomly divided into training set, validation set and test set by 6:2:2. Using the training set, we randomly selected features and labels and constructed a single decision tree. Since a random forest was consisted of many decision trees, we repeated the steps above for 300 times. A random forest with 300 decision trees was formed.
The initial decision trees were regarded as the population of genetic evolution. Then, we randomly selected two groups of five trees. The Euclidean distance was introduced to calculate the similarity between trees. The Euclidean distance was defined as Equation 2.
Subsequently, we applied the clustering evolution to identify the parents. For each group, we calculated the similarities of trees and obtained the upper triangular similarity matrix Mu(Equation 3).
where the M1, 2 is the similarity of tree 1 and tree 2. Then, we performed clustering evolution on the decision trees and selected the tree with the best classification accuracy as parent 1. Another parent 2 was the tree with the largest distance from parent 1, i.e., the parent 1 and 2 were the resulting clusters obtained by clustering evolution. We obtained four parents from the two groups and four new offspring were generated by permutation and combination of these four parents. By calculating the classification performance of these four resulting trees, we selected the best two as the final offspring. The schematic diagram of genetic evolution and clustering evolution are shown in Figure 2. A new random forest with 300 decision trees was formed by repeating the methods above for 150 times.
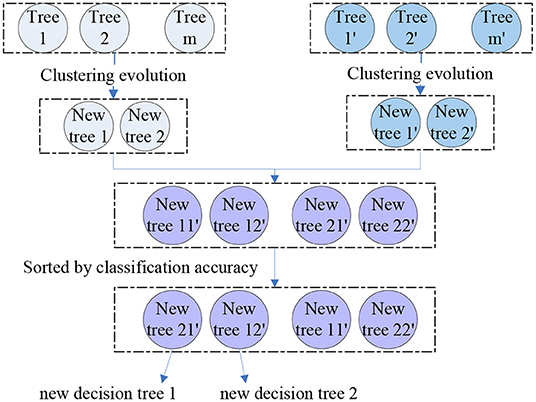
Figure 2. The schematic diagram of the application of clustering evolution in genetic evolution.
Assuming that the genetic evolution reached the nth generation to achieve the optimal classification performance, the accuracy of the resulting decision trees at this time was defined as
where Accx is the final accuracy of tree x, Nvx is the number of correct predictions by tree x in validation set, x is the serial number of the decision trees, and Nv is the size of the validation set. Through the steps above, the clustering genetic random forest model was constructed.
Parameter Optimization Adjustment
For the constructed model, the best parameter combination of the decision tree number and genetic evolution times was selected. Firstly, the decision tree number and genetic evolution times were defined in (300, 500) and (1, 500). Then, the combination of two parameters was iterated over, and the best one was the optimized parameter. To avoid the difference caused by the decision tree composed of randomly selected features, we repeated the steps above for 10 times. Finally, among the 10 results, we selected the best one as the optimized parameter.
Important Voxel Set Determination
The accuracy of the resulting random forest was tested using the test set. The voxels sites in resulting random forest classified AD and HC, suggesting that these voxels were quite different in AD and HC. Therefore, we defined these voxels as important voxels. AD abnormal hippocampal voxels were further extracted from the important voxels. The abnormal hippocampal voxels were extracted by the following steps.
Firstly, we counted the frequency of voxels in the resulting random forest and sorted them in descending order of frequency. Then, we divided the voxels into subsets and evaluated these subsets using a traditional random forest. Subsequently, we defined the subset with peak classification accuracy as the important voxels set. Finally, we counted the frequency of voxels in the important voxels set and considered the top Nf voxels as the abnormal hippocampal voxels based on the frequency.
Biological Analysis
To analyze the biological significance of the abnormal voxels, by jointly analyzing the genetic data and image data, we performed quality control (QC) and genome-wide association studies (GWAS) based on linear regression in PLINK v1.9 (22). After QC, we obtained 5,574,300 SNPs and applied the age, gender, education and the top four principal components from population stratification analysis as covariates. With the GWAS results, we applied ECS method (23) and Genome Reference Consortium Human build 37 to calculated the genes' p-values and obtained 10,435 genes. By applying Bonferroni correction to the resulting genes, we selected 334 genes with corrected p-values < 0.05 for enrichment analysis and pathway analysis (24).
Results
Parameter Optimization Results
We used the strategy described in section Parameter Optimization Adjustment to identify the parameters optimization results. As mentioned previously, we set the number of decision trees in the interval of (300, 500) and the times of genetic evolution in the interval of (1, 500). Then, we compared the accuracies of all parameter combinations. Specifically, we constructed 11 random forests in the interval (300, 500). The numbers of decision trees were 300, 320, …, 500. For each initial random forest, we performed genetic clustering among 500 parameter combinations to evaluated the accuracy and identify the optimal combination. To avoid the differences caused by different features in random forests, we conducted 10 independent repeated experiments and selected the best one as the optimal combination. The accuracy and parameter combination are shown in Figure 3. From Figure 3, we find that the peak value is at 300 initial decision trees, and the corresponding genetic evolution times are 306. The optimal parameters are 300 and 306.
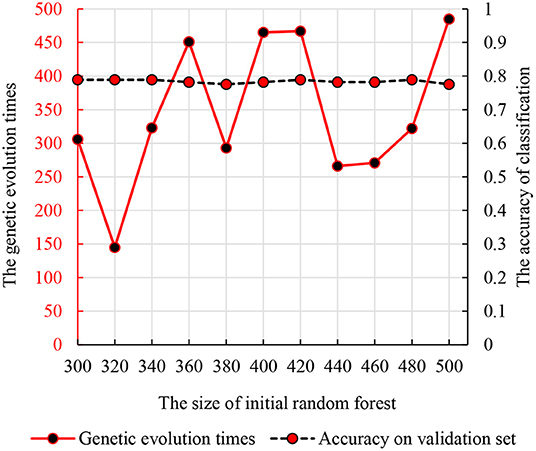
Figure 3. The relationship between the times of genetic evolution with clustering evolution applied and initial random forest number.
Comparison With Other Methods
Besides the proposed model, we tested other three models to compare their accuracy and the three models were the traditional random forest, the clustering evolution random forest (25), and the genetic evolution random forest (26).
Traditional Random Forest
The size of traditional random forest was also in the interval (300, 500). To ensure the results' comparability between different methods, we used the same dataset for training and parameter optimization. The accuracy and parameters are shown in Figure 4 and the best initial decision trees are 300.
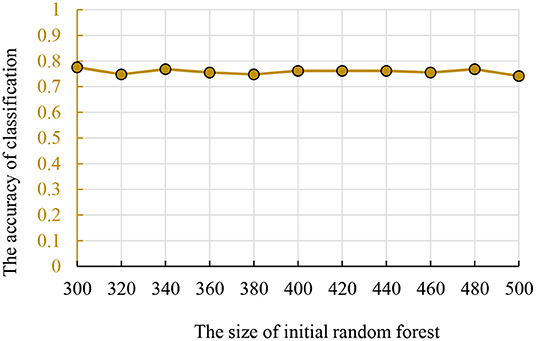
Figure 4. The relationship between the accuracy and initial random forest number.
Clustering Evolutionary Random Forest
Compared with the traditional random forest, the clustering evolution random forest introduced the process of clustering. Therefore, the number of initial decision trees and clustering evolution times was in the interval (300, 500) and (1, 20). The accuracy and parameters are shown in Figure 5 and the best initial decision trees and clustering evolution times are 360 and 18.
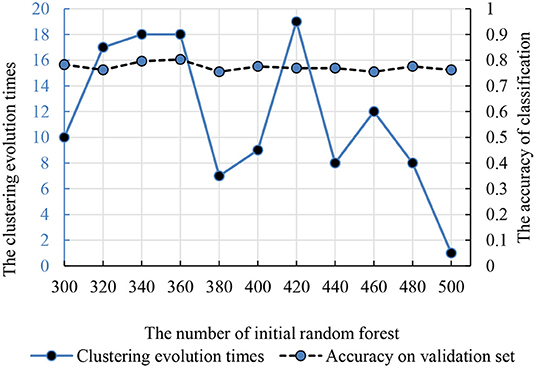
Figure 5. The relationship between the clustering evolution times and initial random forest number. The dotted line is the classification accuracy. The solid line is the times of clustering evolution times based on the decision trees.
Genetic Evolutionary Random Forest
To find the optimal parameters, the genetic evolution random forest introduced the genetic process and the genetic evolution times were in the interval (1, 500). Figure 6 shows the accuracy and parameter combination and the best parameter combination is 340 and 341.
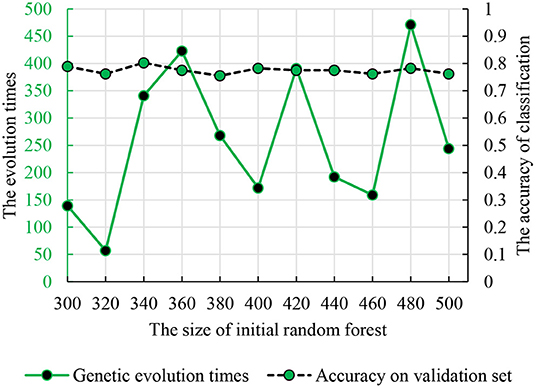
Figure 6. The relationship between the genetic evolution times and initial random forest number. The dotted line is the classification accuracy. The solid line is the times of genetic evolution times based on the decision trees.
Comparison of the Four Methods
The test set was used to identify the classification performance of the four models. To ensure the reliability of the results, we performed 10 independent repeated experiments in each model using the optimal parameter combinations obtained above. The accuracies of the four models are shown in Figure 7. From Figure 7, we observe that the clustering genetic random forest has the best classification accuracy, and the peak is 85.91%, while other three models are all below 85%. The peak of genetic evolution random forest is 84.56% and is superior to the other two. Moreover, the stability of clustering genetic random forest is also the best among the four models and its classification accuracy differs within 1.34%. This indicates that although the features in the initial decision tree are different, the final classification accuracy difference is small after clustering genetic evolution. The results prove that the accuracy and stability are improved in our model.
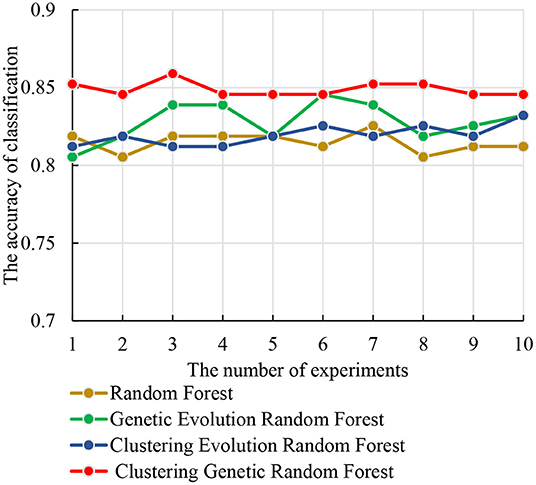
Figure 7. The relationship curves of accuracy and the four models in 10 independent experiments.
The Extraction of Abnormal Hippocampal Voxels
Figure 7 shows that the clustering genetic random forest is a more effective model in classification. The essence of the identified features was hippocampal voxels. Therefore, the abnormal hippocampal voxels could be detected by analyzing the features in the resulting random forest. The voxels in resulting decision trees were candidate abnormal voxels. Table 2 lists the top 14 voxels with frequency >25. However, these voxels were not all abnormal voxels, and we needed to extract the voxels with the best classification performance from them. We firstly set the number of candidate abnormal voxels subsets to be in the interval (70, 580) with a stride of 5. The classification performance was tested using a random forest that consisted of 340 decision trees. Figure 8 shows the accuracies of the subsets and the peak accuracy is 82.34%. The subset with accuracy 82.34% was the abnormal hippocampal voxels. The top 260 voxels are in Supplementary Table 1.
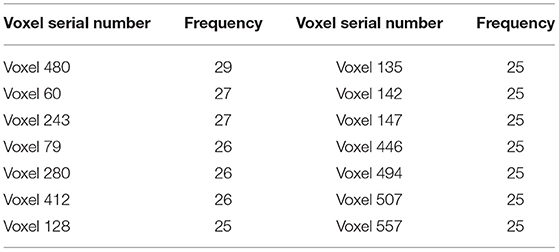
Table 2. The important abnormal hippocampal voxels with frequency greater than 24.

Figure 8. The accuracy of the random forest on different subsets.
We defined the abnormal hippocampal voxels according to the experiment using random forest. The subset with a high frequency was the abnormal hippocampal voxels in AD.
Table 3 shows the important abnormal hippocampal voxels discovered by four models. The fewest important voxels were identified by the genetic evolution random forest, followed by clustering genetic random forest. Interestingly, the random inheritance was applied in these two models, the obtained voxels were the least, and their ratio was the highest. Combined with Figure 7, a higher classification performance was found in the model with high ratio to our model than other two models. This indicated that the genetic process improved the classification performance.
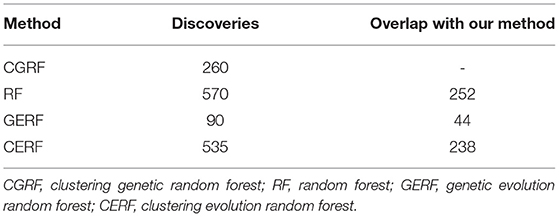
Table 3. The important abnormal hippocampal voxels identified by the traditional random forest.
Assessment of Biological Significance
We performed GWAS using the obtained 260 important voxels and gene-based association analysis using the resulting p-value of SNPs to identify the pathogenic genes of AD. One hundred and Fifty one genes passed the Bonferroni correction (corrected p-value < 0.001) and were considered as the pathogenic genes. The top 10 genes are listed in Table 4. We applied the selected genes to detect the gene ontology (GO) terms and pathways that provided information on AD pathological relationships. We identified 37 GO terms and 72 pathways and showed them in Figure 9 (https://hiplot.com.cn/basic/circular-barplot).
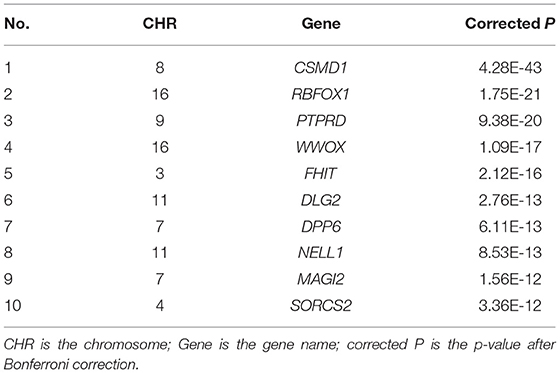
Table 4. The top 10 significant genes identified in our study.
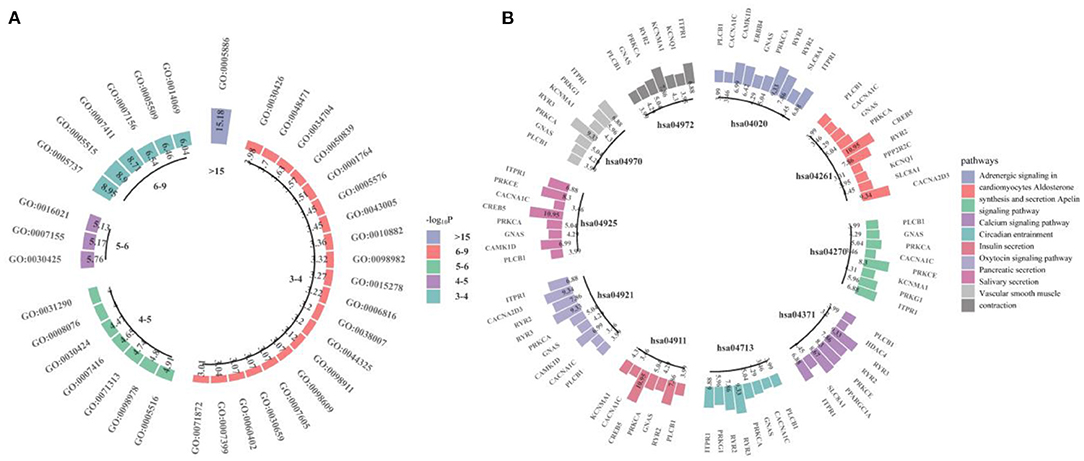
Figure 9. The GO terms and top 10 pathways identify by our model. (A) is for GO terms and (B) is for pathways.
Discussion
In this study, we proposed a model based on machine learning to identify the abnormal hippocampal voxels. Previous research on machine learning was used to detect features classified AD and HC (27–29). Bron et al. applied the SVM and convolutional neural network to predict the MCI patient's conversion to AD (30). Huang et al. proposed Epigenome-Wide Association Studies plus using a supervised machine learning strategy to predict the significant brain CpGs associated with AD (31). However, our model started with voxel images and discovered a voxel set distinguished AD and HC well. An interesting finding was that we introduced the clustering evolution to select the parents with low similarity. The advantages were that not only the good decision trees were preserved, but also the diversity of decision trees was guaranteed. As shown in Figure 7, we come to a conclusion that the genetic evolution was quite suitable for detecting the voxel. The combination of genetic evolution and clustering evolution could improve the classification performance and stability of the model. As shown in Table 3, the voxels identified by random forest model and clustering evolution random forest model are above 500. The voxels of our model are 260, and the voxels' overlaps with the two models are 252 and 238. They are very close to the resulting voxels of our model. This indicates that our model extracts the important voxels that contribute to classification and discards poorly classified voxels.
For the identified genes, in the CSMD gene family associated with AD (32, 33), CSMD1 was expressed in developing nerve cells (34) and the expression of CSMD1 (Corrected P: 4.28E-43) was associated with cognitive function (35) and mental illness (36). Its homologous gene CSMD2 could lead to the decline of cognitive ability (37), and CSMD3 existed in the hippocampus and was related to AD by affecting the transmission of information between cells (38). RBFOX1 (Corrected P: 1.75E-21) associated with AD by affecting amyloid levels (39). The lack of PTPRD (Corrected P: 9.38E-20) led to cognitive impairment and intellectual disability (40), and PTPRD was associated with LMCI (41). WWOX (Corrected P: 1.09E-17) deficiency led to problems with neurodevelopment (42) and aggregation of amyloid β (43).
Detection of GO terms and pathways can provide important information of the function of the pathogenic voxels. The GO terms GO:0021675 and GO:0007417 (central nervous system development, Corrected P: 1.90E-02) were the sub-terms of neural system development (GO:0007399, Corrected P: 9.09E-04), and the GO:0007399 was associated with the neurological disorders. For example, through gene-level analysis, neural function genes were enriched in GO:0007399 (44) and in neurological disease, the significant genes were also enriched in GO:0007399 (45–47). The PI3K-Akt signaling pathway (hsa04151, Corrected P: 1.70E-03) and AGE-RAGE signaling pathway in diabetic complications (hsa04933, Corrected P: 2.30E-03) involved in the process of cell apoptosis (48, 49). Together with Calcium signaling pathway (hsa04020, Corrected P: 2.41E-07), they were associated with Alzheimer's disease pathway (hsa05010, Corrected P: 1.13E-02) and contributed to AD by disrupting intracellular calcium ions (50–52). Oxytocin signaling pathway (hsa04921, Corrected P: 3.19E-07) played a role in AD by protecting the nerves (53). Vascular smooth muscle contraction (hsa04270, Corrected P: 1.26E-06) was related with AD by affecting the neurodegeneration (54).
In this study, we proposed a novel model to mine the abnormal hippocampal voxels. This model used the decision trees as the initial feature set, and applied the genetic evolution to evolve the features. In the process of genetic evolution, the clustering evolution was introduced to identify the parents. Finally, we extracted the important voxels set from the initial features. Additionally, the results demonstrated that our model was superior to other models in terms of the accuracy and stability. The voxels set identified could be regarded as the abnormal hippocampal region. Naturally, our study had several limitations. We have conducted the research of voxel detection here. However, due to limited conditions, better results may be obtained if the mouse experiments are used to verify the results. Since genetic data and imaging data are equally important; we will continue to look for other data such as SNP, protein, and RNA to construct the fusion features for detection.
Data Availability Statement
Publicly available datasets were analyzed in this study. This data can be found at: http://adni.loni.usc.edu/.
Ethics Statement
Ethical approval was not provided for this study on human participants because the ethical review was applied by ADNI. We applied and obtained the access from ADNI. The patients/participants provided their written informed consent to participate in this study. Written informed consent was obtained from the individual(s) for the publication of any potentially identifiable images or data included in this article.
Author Contributions
WL and YW led, supervised, and designed the research and wrote the article. WL, LC, HL, and YW performed features extraction and selection. WL, LC, and HL performed data pre-processing and quality control. WL did biological significance analysis. All authors reviewed, commented on, edited, and approved the manuscript.
Funding
This research was funded by MOE (Ministry of Education in China) Project of Humanities and Social Sciences (21YJAZH091) and by National Statistical Science Research Project (2020LY074). Data collection and sharing for this project was funded by the Alzheimer's Disease Neuroimaging Initiative (ADNI) (National Institutes of Health Grant U01 AG024904) and DOD ADNI (Department of Defense award number W81XWH-12-2-0012). ADNI was funded by the National Institute on Aging, the National Institute of Biomedical Imaging and Bioengineering, and through generous contributions from the following: AbbVie, Alzheimer's Association; Alzheimer's Drug Discovery Foundation; Araclon Biotech; BioClinica, Inc.; Biogen; Bristol-Myers Squibb Company; CereSpir, Inc.; Cogstate; Eisai Inc.; Elan Pharmaceuticals, Inc.; Eli Lilly and Company; EuroImmun; F. Hoffmann-La Roche Ltd and its affiliated company Genentech, Inc.; Fujirebio; GE Healthcare; IXICO Ltd.; Janssen Alzheimer Immunotherapy Research & Development, LLC.; Johnson & Johnson Pharmaceutical Research & Development LLC.; Lumosity; Lundbeck; Merck & Co., Inc.; Meso Scale Diagnostics, LLC.; NeuroRx Research; Neurotrack Technologies; Novartis Pharmaceuticals Corporation; Pfizer Inc.; Piramal Imaging; Servier; Takeda Pharmaceutical Company; and Transition Therapeutics. The Canadian Institutes of Health Research is providing funds to support ADNI clinical sites in Canada. Private sector contributions are facilitated by the Foundation for the National Institutes of Health (www.fnih.org). The grantee organization is the Northern California Institute for Research and Education, and the study is coordinated by the Alzheimer's Therapeutic Research Institute at the University of Southern California. ADNI data are disseminated by the Laboratory for Neuro Imaging at the University of Southern California. The commercial funders were not involved in the study design, collection, analysis, interpretation of data, the writing of this article or the decision to submit it for publication.
Conflict of Interest
The authors declare that the research was conducted in the absence of any commercial or financial relationships that could be construed as a potential conflict of interest.
Publisher's Note
All claims expressed in this article are solely those of the authors and do not necessarily represent those of their affiliated organizations, or those of the publisher, the editors and the reviewers. Any product that may be evaluated in this article, or claim that may be made by its manufacturer, is not guaranteed or endorsed by the publisher.
Supplementary Material
The Supplementary Material for this article can be found online at: https://www.frontiersin.org/articles/10.3389/fpsyt.2022.861258/full#supplementary-material
References
1. Prull MW, Gabrieli JDE, Bunge SA. Age-related changes in memory: a cognitive neuroscience perspective. The Handbook of Aging and Cognition. 2nd ed. Mahwah, NJ: Lawrence Erlbaum Associates Publishers (2000). p. 91–153.
2. Jack CR, Petersen RC, O'brien PC, Tangalos EGJN. MR-based hippocampal volumetry in the diagnosis of Alzheimer's disease. Neurology. (1992) 42:183–8. doi: 10.1212/WNL.42.1.183
3. Fox N, Warrington E, Freeborough P, Hartikainen P, Kennedy A, Stevens J, et al. Presymptomatic hippocampal atrophy in Alzheimer's disease: a longitudinal MRI study. Brain. (1996) 119:2001-7. doi: 10.1093/brain/119.6.2001
4. Ferrer I, Marti E. Distribution of fibroblast growth factor receptor-1 (FGFR-1) and FGFR-3 in the hippocampus of patients with Alzheimer's disease. Neurosci Lett. (1998) 240:139–42. doi: 10.1016/S0304-3940(97)00948-8
5. Yokota O, Terada S, Ishizu H, Ishihara T, Ujike H, Nakashima H, et al. Cyclooxygenase-2 in the hippocampus is up-regulated in Alzheimer's disease but not in variant Alzheimer's disease with cotton wool plaques in humans. Neurosci Lett. (2003) 343:175–9. doi: 10.1016/S0304-3940(03)00339-2
6. Iglesias JE, Augustinack JC, Nguyen K, Player CM, Player A, Wright M, et al. A computational atlas of the hippocampal formation using ex vivo, ultra-high resolution MRI: application to adaptive segmentation of in vivo MRI. Neuroimage. (2015) 115:117–37. doi: 10.1016/j.neuroimage.2015.04.042
7. van der Meer D, Rokicki J, Kaufmann T, Córdova-Palomera A, Moberget T, Alnæs D, et al. Brain scans from 21,297 individuals reveal the genetic architecture of hippocampal subfield volumes. Mol Psychiatry. (2020) 25:3053–65. doi: 10.1038/s41380-018-0262-7
8. Jiao Z, Ji Y, Jiao T, Wang S. Extracting sub-networks from brain functional network using graph regularized nonnegative matrix factorization. Comput Model Eng Sci. (2020) 123:845–71. doi: 10.32604/cmes.2020.08999
9. Jiao Z, Ji Y, Gao P, Wang S-HJJoAI, Computing H. Extraction and analysis of brain functional statuses for early mild cognitive impairment using variational auto-encoder. J Ambient Intell Hum Comput. (2020) 2020:1–12. doi: 10.1007/s12652-020-02031-w
10. Li Y, Haber A, Preuss C, John C, Uyar A, Yang HS, et al. Transfer learning-trained convolutional neural networks identify novel MRI biomarkers of Alzheimer's disease progression. Alzheimers Dement Diagn Assess Dis Monitor. (2021) 13:e12140. doi: 10.1002/dad2.12140
11. Díez Díaz F, Sánchez Lasheras F, Moreno V, Moratalla-Navarro F, Molina De La Torre AJ, Martín Sánchez V. GASVeM: a new machine learning methodology for multi-SNP analysis of GWAS data based on genetic algorithms and support vector machines. Mathematics. (2021) 9:654. doi: 10.3390/math9060654
12. Sun T, Wei Y, Chen W, Ding Y. Genome-wide association study-based deep learning for survival prediction. Stat Med. (2020) 39:4605–20. doi: 10.1002/sim.8743
13. Ji Y, Zhang Y, Shi H, Jiao Z, Wang S-H, Wang C. Constructing dynamic brain functional networks via hyper-graph manifold regularization for mild cognitive impairment classification. Front Neurosci. (2021) 15:669345. doi: 10.3389/fnins.2021.669345
14. Jiao Z, Jiao T, Zhang J, Shi H, Wu B, Zhang YJIJoIS, et al. Sparse structure deep network embedding for transforming brain functional network in early mild cognitive impairment classification. Int J Imaging Syst Technol. (2021) 31:1197–210. doi: 10.1002/ima.22531
15. Yi PAN, Jin LIU, Xu T, Wei LAN, Rui GUO. Hippocampal segmentation in brain MRI images using machine learning methods: a survey. Chin J Electr. (2021) 30:793–814. doi: 10.1049/cje.2021.06.002
16. Li S, Shi F, Pu F, Li X, Jiang T, Xie S, et al. Hippocampal shape analysis of Alzheimer's disease based on machine learning methods. Am J Neuroradiol. (2007) 28:1339. doi: 10.3174/ajnr.A0620
17. Tsao S, Gajawelli N, Zhou J, Shi J, Ye J, Wang Y, et al. Feature selective temporal prediction of Alzheimer's disease progression using hippocampus surface morphometry. Brain Behav. (2017) 7:e00733. doi: 10.1002/brb3.733
18. Liu Y, Yan Z. A combined deep-learning and lattice Boltzmann model for segmentation of the hippocampus in MRI. Sensors. (2020) 20:3628. doi: 10.3390/s20133628
19. Uysal G, Ozturk M. Hippocampal atrophy based Alzheimer's disease diagnosis via machine learning methods. J Neurosci Meth. (2020) 337:108669. doi: 10.1016/j.jneumeth.2020.108669
20. Tzourio-Mazoyer N, Landeau B, Papathanassiou D, Crivello F, Etard O, Delcroix N, et al. Automated anatomical labeling of activations in SPM using a macroscopic anatomical parcellation of the MNI MRI single-subject brain. NeuroImage. (2002) 15:273–89. doi: 10.1006/nimg.2001.0978
21. Jenkinson M, Beckmann CF, Behrens TEJ, Woolrich MW, Smith SM. FSL. Neuroimage. (2012) 62:782–90. doi: 10.1016/j.neuroimage.2011.09.015
22. Purcell S, Neale B, Todd-Brown K, Thomas L, Ferreira MAR, Bender D, et al. PLINK: a tool set for whole-genome association and population-based linkage analyses. Am J Hum Genet. (2007) 81:559–75. doi: 10.1086/519795
23. Li M, Jiang L, Mak TSH, Kwan JSH, Xue C, Chen P, et al. A powerful conditional gene-based association approach implicated functionally important genes for schizophrenia. Bioinformatics. (2019) 35:628–35. doi: 10.1093/bioinformatics/bty682
24. Bu D, Luo H, Huo P, Wang Z, Zhang S, He Z, et al. KOBAS-i: intelligent prioritization and exploratory visualization of biological functions for gene enrichment analysis. Nucl Acids Res. (2021) 49:W317–25. doi: 10.1093/nar/gkab447
25. Bi X-a, Hu X, Wu H, Wang YJIjob, Informatics h. Multimodal data analysis of Alzheimer's disease based on clustering evolutionary random forest. IEEE J Biomed Health Inform. (2020) 24:2973–83. doi: 10.1109/JBHI.2020.2973324
26. Bi Xa, Zhou W, Li L, Xing Z. Detecting risk gene and pathogenic brain region in EMCI using a novel GERF algorithm based on brain imaging and genetic data. IEEE J Biomed Health Inform. (2021) 25:3019-28. doi: 10.1109/JBHI.2021.3067798
27. Jiao Z, Chen S, Shi H, Xu J. Multi-modal feature selection with feature correlation and feature structure fusion for MCI and AD classification. Brain Sci. (2022) 12:80. doi: 10.3390/brainsci12010080
28. Jiao Z, Gao P, Ji Y, Shi H. Integration and segregation of dynamic functional connectivity states for mild cognitive impairment revealed by graph theory indicators. Contrast Media Mol Imaging. (2021) 2021:6890024. doi: 10.1155/2021/6890024
29. Tzimourta KD, Christou V, Tzallas AT, Giannakeas N, Astrakas LG, Angelidis P, et al. Machine learning algorithms and statistical approaches for Alzheimer's disease analysis based on resting-state EEG recordings: a systematic review. Int J Neural Syst. (2020) 31:2130002. doi: 10.1142/S0129065721300023
30. Bron EE, Klein S, Papma JM, Jiskoot LC, Venkatraghavan V, Linders J, et al. Cross-cohort generalizability of deep and conventional machine learning for MRI-based diagnosis and prediction of Alzheimer's disease. NeuroImage. (2021) 31:102712. doi: 10.1016/j.nicl.2021.102712
31. Huang Y, Sun X, Jiang H, Yu S, Robins C, Armstrong MJ, et al. A machine learning approach to brain epigenetic analysis reveals kinases associated with Alzheimer's disease. Nat Commun. (2021) 12:4472. doi: 10.1038/s41467-021-24710-8
32. Zhang Y, Li M, Wang Q, Hsu JS, Deng W, Ma X, et al. A joint study of whole exome sequencing and structural MRI analysis in major depressive disorder. Psychol Med. (2020) 50:384-95. doi: 10.1017/S0033291719000072
33. Stepanov VA, Bocharova AV, Marusin AV, Zhukova NG, Alifirova VM, Zhukova IA. Replicative association analysis of genetic markers of cognitive traits with Alzheimer's disease in the Russian population. Mol Biol. (2014) 48:835–44. doi: 10.1134/S0026893314060168
34. Gonda X, Eszlari N, Torok D, Gal Z, Bokor J, Millinghoffer A, et al. Genetic underpinnings of affective temperaments: a pilot GWAS investigation identifies a new genome-wide significant SNP for anxious temperament in ADGRB3 gene. Transl Psychiatry. (2021) 11:337. doi: 10.1038/s41398-021-01436-1
35. Athanasiu L, Giddaluru S, Fernandes C, Christoforou A, Reinvang I, Lundervold AJ, et al. A genetic association study of CSMD1 and CSMD2 with cognitive function. Brain Behav Immun. (2017) 61:209–16. doi: 10.1016/j.bbi.2016.11.026
36. Liu Y, Fu X, Tang Z, Li C, Xu Y, Zhang F, et al. Altered expression of the CSMD1 gene in the peripheral blood of schizophrenia patients. BMC Psychiatry. (2019) 19:113. doi: 10.1186/s12888-019-2089-4
37. Gutierrez MA, Dwyer BE, Franco SJJE. Csmd2 is a synaptic transmembrane protein that interacts with PSD-95 and is required for neuronal maturation. eNeuro. (2019) 6:ENEURO.0434-18.2019. doi: 10.1523/ENEURO.0434-18.2019
38. Mizukami T, Kohno T, Hattori MJNr. CUB and Sushi multiple domains 3 regulates dendrite development. Neurosci Res. (2016) 110:11–7. doi: 10.1016/j.neures.2016.03.003
39. Raghavan NS, Dumitrescu L, Mormino E, Mahoney ER, Lee AJ, Gao Y, et al. Association between common variants in RBFOX1, an RNA-binding protein, and brain amyloidosis in early and preclinical Alzheimer's disease. JAMA Neurol. (2020) 77:1288–98. doi: 10.1001/jamaneurol.2020.1760
40. Uhl GR, Henderson IM, Martinez M, Stokes MP. Reduced PTPRD expression differentially alters brain phosphotyrosine phosphoproteomic profiles of 2 and 12 month-old mice. bioRxiv [Preprint]. (2021). doi: 10.1101/2021.03.02.433536
41. Bi X-a, Li L, Xu R, Xing Z. Pathogenic factors identification of brain imaging and gene in late mild cognitive impairment. Interdisciplin Sci Comput Life Sci. (2021) 13:511–20. doi: 10.1007/s12539-021-00449-0
42. Ehaideb SN, Ali MJA-B, Al-Obaid JJ, Aljassim KM, Alfadhel MJTn. Novel homozygous mutation in the WWOX gene causes seizures and global developmental delay. Rep Rev. (2018) 9:203–8. doi: 10.1515/tnsci-2018-0029
43. Cheng Y-Y, Chou Y-T, Lai F-J, Jan M-S, Chang T-H, Jou I-M, et al. Wwox deficiency leads to neurodevelopmental and degenerative neuropathies and glycogen synthase kinase 3β-mediated epileptic seizure activity in mice. Acta Neuropathol Commun. (2020) 8:1–16. doi: 10.1186/s40478-020-0883-3
44. Deng L, Hou L, Zhang J, Tang X, Cheng Z, Li G, et al. Polymorphism of rs3737597 in DISC1 gene on chromosome 1q42.2 in sALS patients: a chinese han population case-control study. Mol Neurobiol. (2017) 54:3162–79. doi: 10.1007/s12035-016-9869-3
45. Cristino AS, Williams SM, Hawi Z, An JY, Bellgrove MA, Schwartz CE, et al. Neurodevelopmental and neuropsychiatric disorders represent an interconnected molecular system. Mol Psychiatry. (2014) 19:294–301. doi: 10.1038/mp.2013.16
46. Polimanti R, Gelernter J. Widespread signatures of positive selection in common risk alleles associated to autism spectrum disorder. PLoS Genet. (2017) 13:e1006618. doi: 10.1371/journal.pgen.1006618
47. Hawi Z, Tong J, Dark C, Yates H, Johnson B, Bellgrove MA. The role of cadherin genes in five major psychiatric disorders: a literature update. Am J Med Genet B Neuropsychiatr Genet. (2018) 177:168–80. doi: 10.1002/ajmg.b.32592
48. Shi L, Yu X, Yang H, Wu X, Gordon L. Advanced glycation end products induce human corneal epithelial cells apoptosis through generation of reactive oxygen species and activation of JNK and p38 MAPK pathways. PLoS ONE. (2013) 8:e66781. doi: 10.1371/journal.pone.0066781
49. Dai J, Chen H, Chai Y. Advanced glycation end products (AGEs) induce apoptosis of fibroblasts by activation of NLRP3 inflammasome via reactive oxygen species (ROS) signaling pathway. Med Sci Monit. (2019) 25:7499–508. doi: 10.12659/MSM.915806
50. Kanehisa M, Furumichi M, Sato Y, Ishiguro-Watanabe M, Tanabe M. KEGG: integrating viruses and cellular organisms. Nucleic Acids Res. (2021) 49:D545–51. doi: 10.1093/nar/gkaa970
51. Sushma Mondal AC. Role of GPCR signaling and calcium dysregulation in Alzheimer's disease. Mol Cell Neurosci. (2019) 101:103414. doi: 10.1016/j.mcn.2019.103414
52. Lee SY, Hwang DY, Kim YK, Lee JW, Shin IC, Oh KW, et al. PS2 mutation increases neuronal cell vulnerability to neurotoxicants through activation of caspase-3 by enhancing of ryanodine receptor-mediated calcium release. FASEB J. (2006) 20:151–3. doi: 10.1096/fj.05-4017fje;1
53. Almansoub H, Tang H, Wu Y, Wang D-Q, Abdoul Razak M, Mahamane Salissou M, et al. Oxytocin alleviates MPTP-induced neurotoxicity in mice by targeting MicroRNA-26a/death-associated protein kinase 1 pathway. J Alzheimers Dis. (2020) 74:1–19. doi: 10.3233/JAD-191091
Keywords: Alzheimer's disease, genetic evolution, clustering evolution, random forest, voxel-based features
Citation: Liu W, Cao L, Luo H and Wang Y (2022) Research on Pathogenic Hippocampal Voxel Detection in Alzheimer's Disease Using Clustering Genetic Random Forest. Front. Psychiatry 13:861258. doi: 10.3389/fpsyt.2022.861258
Received: 24 January 2022; Accepted: 22 February 2022;
Published: 07 April 2022.
Edited by:
Zhuqing Jiao, Changzhou University, ChinaReviewed by:
Jian Shi, Sun Yat-sen University, ChinaYanfeng Zhao, Shandong University of Science and Technology, China
Copyright © 2022 Liu, Cao, Luo and Wang. This is an open-access article distributed under the terms of the Creative Commons Attribution License (CC BY). The use, distribution or reproduction in other forums is permitted, provided the original author(s) and the copyright owner(s) are credited and that the original publication in this journal is cited, in accordance with accepted academic practice. No use, distribution or reproduction is permitted which does not comply with these terms.
*Correspondence: Wenjie Liu, bGl1d2pAY3p1c3QuZWR1LmNu; Ying Wang, d2FuZ3lpbmcwMTI5QDEyNi5jb20=