
94% of researchers rate our articles as excellent or good
Learn more about the work of our research integrity team to safeguard the quality of each article we publish.
Find out more
ORIGINAL RESEARCH article
Front. Psychiatry, 29 March 2022
Sec. Schizophrenia
Volume 13 - 2022 | https://doi.org/10.3389/fpsyt.2022.859322
This article is part of the Research TopicEarly Identification of Affective and Non-Affective Psychoses: from Psychopathology to BiomarkersView all 6 articles
 Tineke Grent-’t-Jong1,2
 Ruchika Gajwani3
 Joachim Gross1,4
 Andrew I. Gumley3
 Stephen M. Lawrie5
 Matthias Schwannauer6
 Frauke Schultze-Lutter7,8,9
 Stephen R. Williams10
 Peter J. Uhlhaas1,2*
Psychosis involves changes in GABAergic and glutamatergic neurotransmission in auditory cortex that could be important for understanding sensory deficits and symptoms of psychosis. However, it is currently unclear whether such deficits are present in participants at clinical high-risk for psychosis (CHR-P) and whether they are associated with clinical outcomes. Magnetic Resonance Spectroscopy (MEGAPRESS, 1H-MRS at 3 Tesla) was used to estimate GABA, glutamate, and glutamate-plus-glutamine (Glx) levels in auditory cortex in a large sample of CHR-P (n = 99), CHR-N (clinical high-risk negative, n = 32), and 45 healthy controls. Examined were group differences in metabolite concentrations as well as relationships with clinical symptoms, general cognition, and 1-year follow-up clinical and general functioning in the CHR-P group. Results showed a marginal (p = 0.039) main group effect only for Glx, but not for GABA and glutamate concentrations, and only in left, not right, auditory cortex. This effect did not survive multiple comparison correction, however. Exploratory post-hoc tests revealed that there were significantly lower Glx levels (p = 0.029, uncorrected) in the CHR-P compared to the CHR-N group, but not relative to healthy controls (p = 0.058, uncorrected). Glx levels correlated with the severity of perceptual abnormalities and disorganized speech scores. However, in the CHR-P group, Glx levels did not predict clinical or functional outcomes. Accordingly, the findings from the present study suggest that MRS-measured GABA, glutamate and Glx levels in auditory cortex of CHR-P individuals are largely intact.
Schizophrenia (ScZ) is a severe mental illness associated with pronounced cognitive and sensory impairments that are thought to emerge from underlying impairments of neural circuits (1, 2). These deficits in sensory and cognitive operations correlate with clinical (3, 4) as well as functional outcomes (5, 6) and are not improved by current pharmacological treatment options (7), so identifying the neurobiological origin of such deficits is a priority of current research.
Recent evidence has implicated a disturbance in the balance between excitation and inhibition (E/I-balance), a mechanism that assures efficient information transfer in neural networks (8, 9), as a potential target for understanding cognitive deficits in ScZ (10). During normal brain functioning, E/I-balance emerges from the interplay between inhibitory GABAergic interneurons and excitatory (e.g., glutamatergic) synapses (11). A shift toward increased excitation could result in elevated basal noise levels and lower signal-to-noise ratio (12). On the other hand, a shift toward increased inhibition may result in lower signal-strength, resulting in an impaired signal-propagation of sensory inputs (13).
Evidence for E/I-balance abnormalities in ScZ comes from post-mortem studies that have examined alterations in GABAergic interneuron properties as well as N-methyl-D-aspartate receptor (NMDA-R) density. Specifically, reductions in the activity level of Parvalbumin-expressing (PV+) but also of Somatostatin-expressing (ST) interneurons have been identified in prefrontal cortex that also extend into sensory areas such as auditory cortex (14) and subcortical regions (15, 16). Furthermore, a reduction in the NR1 subunit (17), but also in other NMDA-R subunits, such as the NR2C subunit (18–20), have been found, primarily in dorsolateral prefrontal cortex.
Further evidence for E/I-balance alterations come from studies using Magnetic Resonance Spectroscopy (MRS) to investigate regional levels of GABA glutamate and/or Glx (glutamate-plus-glutamine). Recent meta-analyses have suggested regional as well as stage-specific differences in levels of glutamate and/or Glx (21, 22). For example, in ScZ patients, elevated levels of glutamate and Glx are most consistently found in limbic/subcortical structures, such as the basal ganglia, thalamus, and medial temporal lobe, whereas decreased levels are reported for medial prefrontal areas (21–23).
As ScZ can be preceded by a prodromal period of up to 5 years during which attenuated psychotic symptoms (APS) as well as behavioral and cognitive changes already exist (24, 25), identifying individuals at clinical high risk for developing psychosis (CHR-P) is important, as it enables the opportunity to develop appropriate strategies for risk prediction and early intervention (26, 27). Recent MRS studies in CHR-P individuals so far have mostly documented a decrease in hippocampal and thalamic glutamate levels (28, 29). Furthermore, increases in both GABA and glutamate have also been reported in associative-striatal and medial prefrontal regions in CHR-P participants (30, 31), with the highest striatal glutamate levels found in those who later transitioned to psychosis (32).
Few MRS studies, however, have investigated sensory areas, such as auditory regions, despite the fact that auditory cortex functioning is of crucial importance for understanding circuit dysfunctions in ScZ, given the profound disruptions in auditory processing that involve impaired perception of stimulus features (33) as well as deviance detection (34, 35). Moreover, abnormal auditory processing is also present already in CHR-P participants (36), and pronounced in those with more severe psychopathology and/or who transition to psychosis (37–39). MRS-studies in ScZ patients have reported increased GABA levels in right auditory regions (40), as well as lower levels of glutamate (41) and Glx (42) in the left superior temporal cortex. However, it is currently unclear whether such changes are also present in CHR-P populations.
In the current study, we therefore examined GABA, glutamate and Glx levels in right and left auditory cortex, in a sample of 99 anti-psychotic medication naïve CHR-P participants, 32 participants with affective disorders and substance abuse disorders (CHR-N), and 45 healthy controls (HC).
Moreover, we established whether MRS-measures would be related to clinical outcomes in the CHR-P group, such as persistence of APS and functional outcomes.
We predicted that CHR-P participants would be characterized by reduced levels of glutamate and/or Glx in left auditory regions and increased levels of GABA in right auditory regions, consistent with the earlier findings in ScZ patients (42). In addition, we hypothesized that those changes would be most pronounced for individual with greater symptom severity and/or poor clinical outcomes.
Data were collected as part of the YouR-Study (The Youth Mental Health Risk and Resilience Study), which is a longitudinal study funded by the Medical Research Council (MRC) (43) that aims at identifying neurobiological mechanisms and predictors of emerging psychosis. Baseline data collection was conducted between March 2015 and November 2019. The study was approved by the ethical committees of the NHS Research Ethical Committee Glasgow & Greater Clyde. All participants provided written informed consent.
Auditory cortex 1H-MRS data was included from three groups of participants: (1) participants meeting CHR-P criteria; (2) participants who did not meet CHR-P criteria but met criteria for non-psychotic disorders, such as mood and anxiety disorders, eating disorders and substance abuse (CHR-N), indicated by the Mini-International Neuropsychiatric Interview (44); and (3) healthy control individuals (HC) without an axis I diagnosis or family history of psychotic disorders. CHR-P status was confirmed by meeting ultra-high-risk (UHR) criteria according to the Comprehensive Assessment of At-Risk Mental States (CAARMS) interview (45) and the Cognitive Disturbances and Cognitive-Perceptive Basic Symptoms criteria according to the Schizophrenia Proneness Instrument, Adult version [SPI-A: (46)]. In total, 25 CHR-Ps met only basic symptom criteria, n = 23 met only UHR, and 51 CHR-Ps met both basic symptom and UHR criteria. Individuals classified as CHR-N did not meet threshold for UHR and basic symptoms, but met criteria for other non-psychotic disorders, excluding autism, ADHD, or first-degree relatives with ScZ. Cognition was assessed with the Brief Assessment of Cognition in Schizophrenia [BACS: (47)].
Participants meeting CHR-P criteria were reassessed at 3-, 6-, 9-, 12-, 18-, 24-, 30-, and 36-month intervals to examine persistence of APS and functional outcomes, using with the CAARMS interview.
Data from bilateral auditory cortex were acquired on a Siemens 3T-Tim-Trio scanner, using a 32-channel head coil for reception. First, T1-weighted anatomical MRI images were collected using 3D-MPRAGE sequences (192 slices, voxel size 1 mm3, FOV = 256 × 256 × 176 mm, TR = 2,250 ms, TE = 2.6 ms, FA = 9°), and resliced into axial and coronal views to allow more precise and consistent placement of the MRS voxels of interest. Voxels of 2 cm3 were then placed in right (RAUD) or left auditory cortex (LAUD), positioned over Heschl’s gyrus, horizontally aligned with the lower bank of the supra-temporal plane on the coronal slide (Figure 1, top panel), and optimized in location to a final position with minimal Cerebral Spinal Fluid (CSF) contamination. FASTMAP (48) semi-automatic shimming of the voxel was used to improve local field homogeneity in the area of interest. A total of three scans were acquired, including a full spectrum acquisition, a GABA-edited MEGA-PRESS (WIP: VB-17A) scan (128 trials), and an unsuppressed water scan to provide an absolute concentration reference (64 trials). MEGA-PRESS scanning parameters included: TR/TE 1,500/68 ms, 1.9 ppm ON- and 1.5 ppm OFF-resonance editing pulse frequencies (symmetric editing to suppress macromolecule contribution), 44 Hz editing Gaussian pulse bandwidth, 50 Hz water suppression, 90° flip angle, acquisition bandwidth of 1,200 Hz, duration 426 ms, number of points 512.
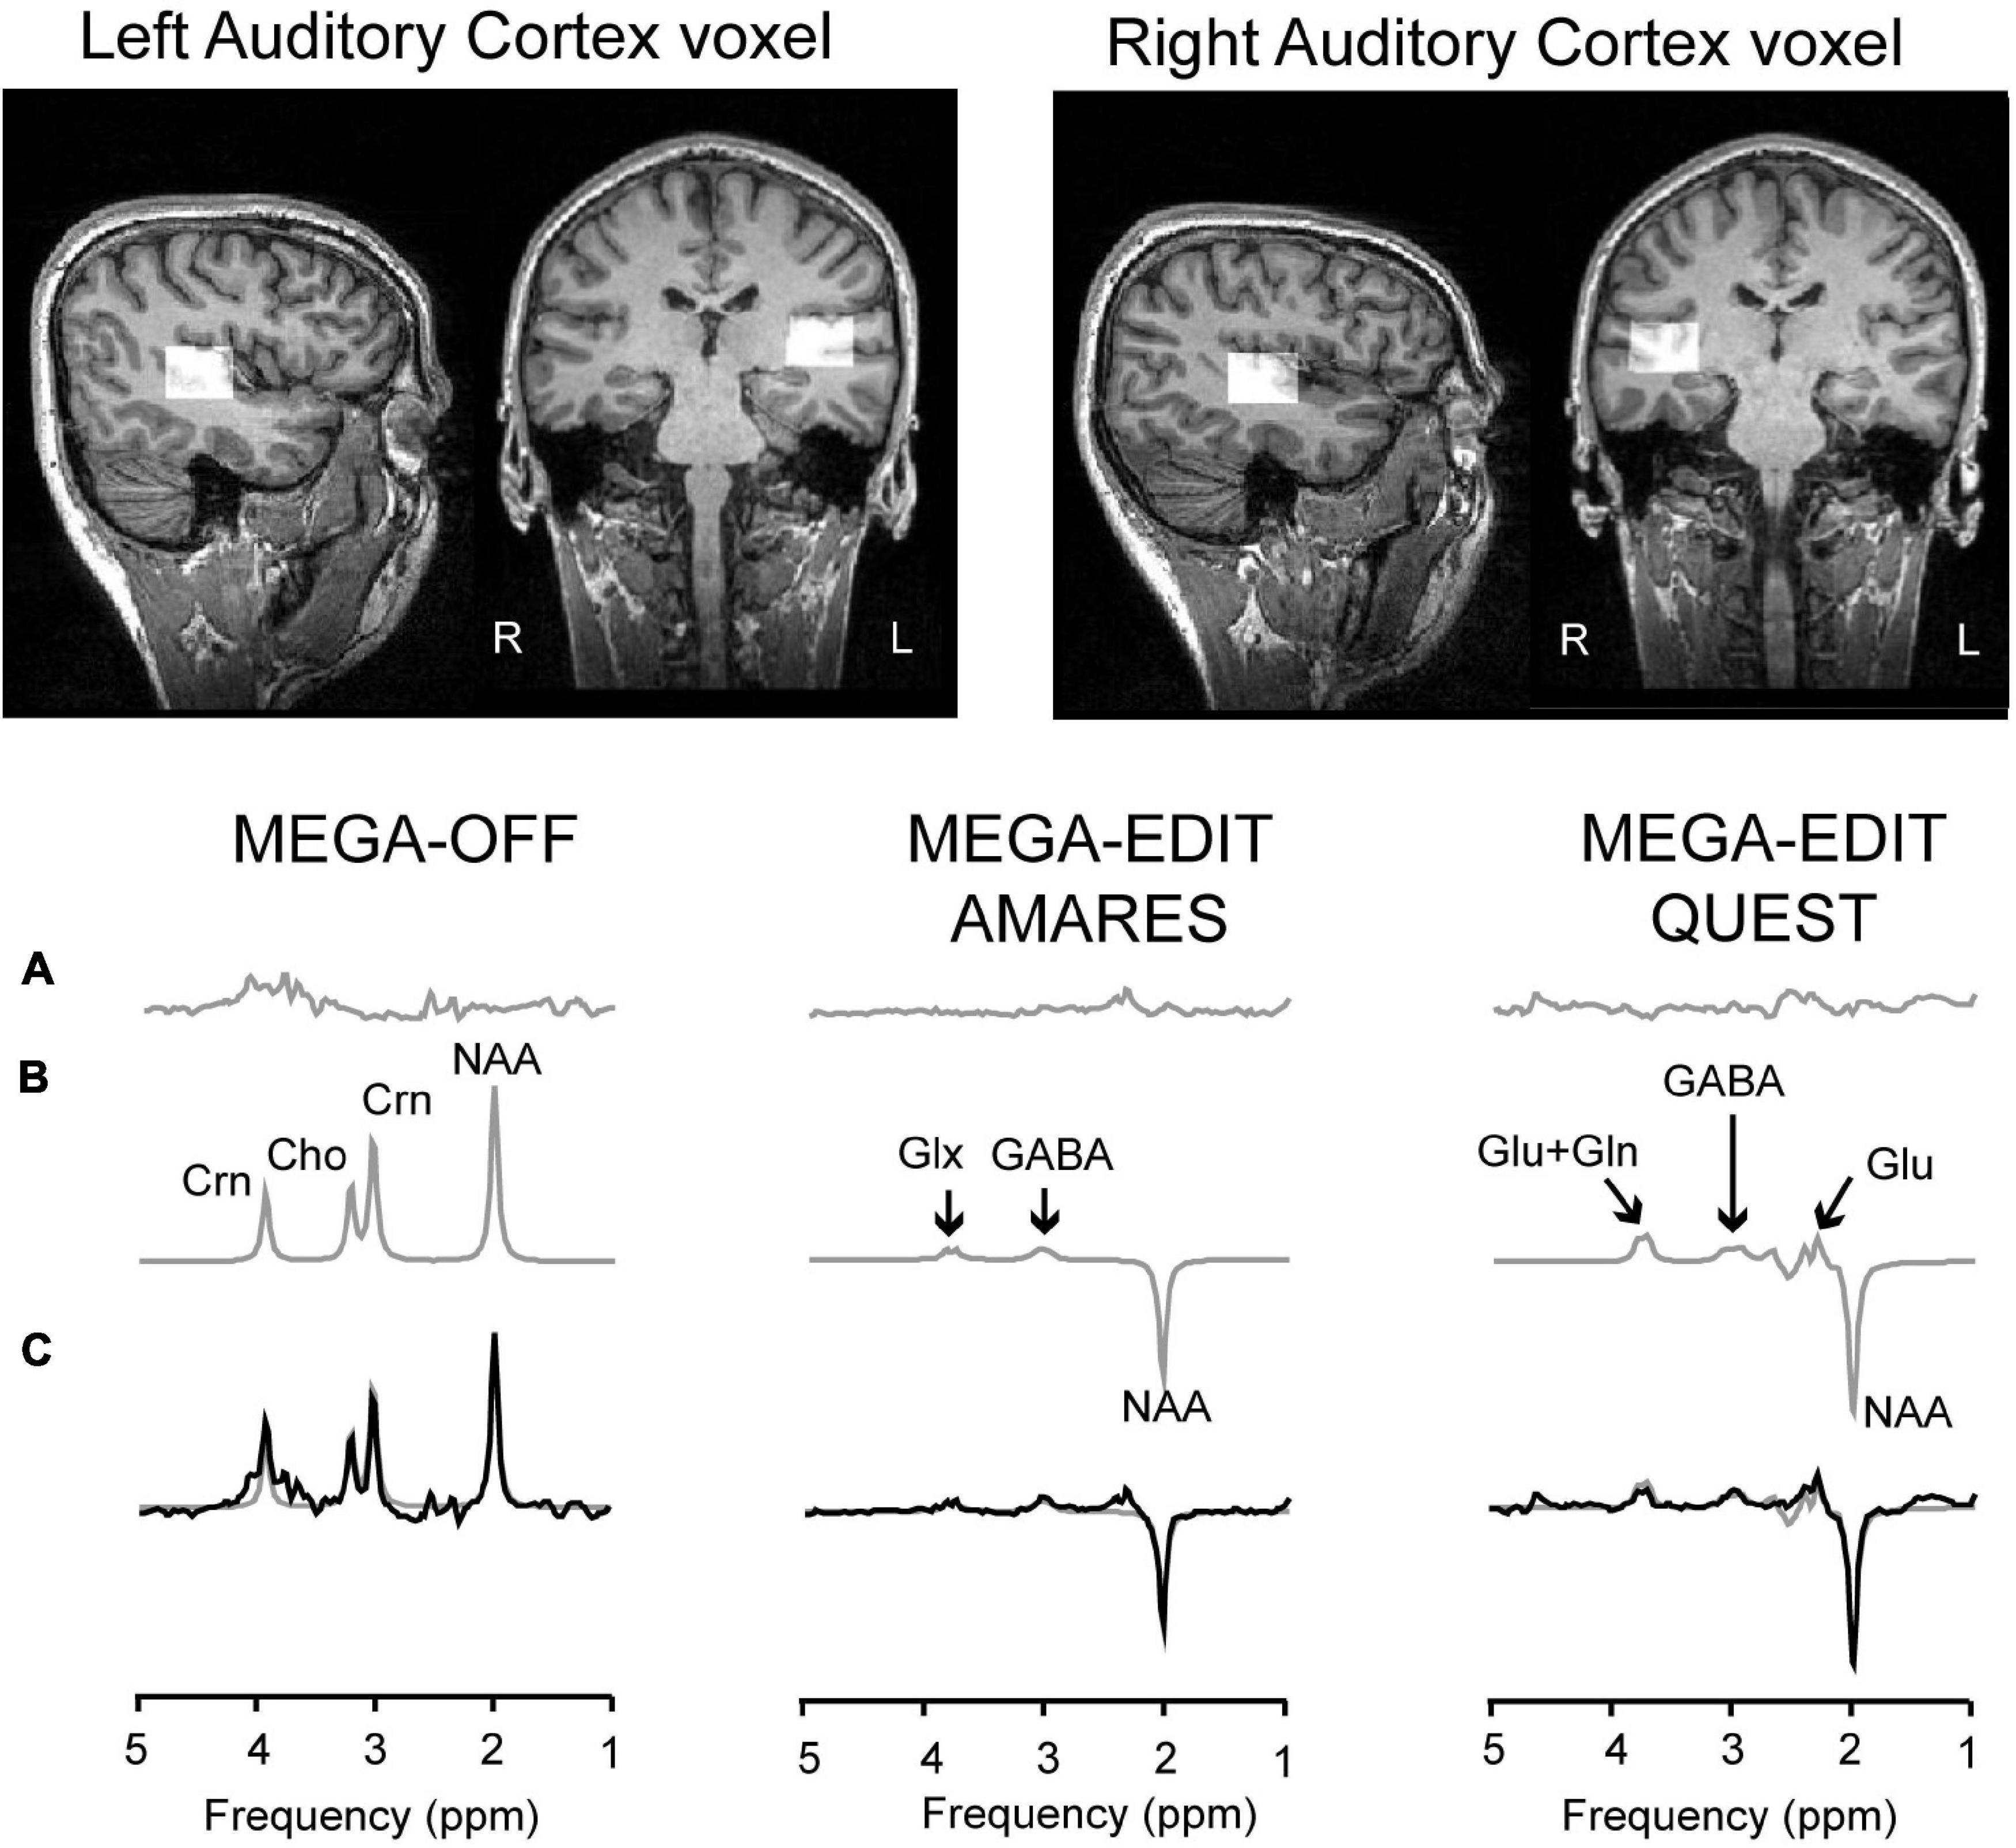
Figure 1. Voxel placement and MRS analyses pipeline. Top two panels show an example of the placement of the voxels in right and left auditory cortex. The bottom-line figures show example spectra and model fits. More specifically, the bottom traces (C) show acquired data from three different subjects, with the model fit overlaid as a smooth gray line. The model fits are separately shown in panel (B), with the residuals shown in the top traces (A). The left-hand panel shows data from the control sub-spectrum, in which the MEGA editing pulse is set away from the GABA C3 frequency. The right-hand panels show edited spectra (subtraction of MEGA-OFF from MEGA-ON) fitted either by AMARES (middle) or QUEST/QUASAR (right). Peaks are labeled as Cho–choline–containing compounds, Crn–total creatine, GABA, glutamate–glu, glutamate plus glutamine–Glx, and NAA–N-Acetyl-Aspartate.
The number of available samples differed for LAUD and RAUD voxels. In total across the three groups, 135 participants had recordings from both voxels, 62 only from right, and 1 only from left auditory cortex. As a result, analyses were run separately for both voxels. After removal of participants with poor quality data, the final sample included 92 CHR-P, 30 CHR-N, and 44 HC subjects for the RAUD voxel, and 60 CHR-P, 20 CHR-N, and 31 HC subjects for the LAUD voxel.
Cleaning involved removing data with incomplete/missing metabolite concentrations, and/or data that were more than 2 standard deviations away from the mean across groups (within each voxel) for linewidth of N-acetyl-aspartate [NAA] and/or unsuppressed water, and/or absolute Cramér-Rao Lower Bound (CRLB) values. Absolute CRLB values were favored over percentages following most recent recommendations for clinical situations of potential low concentrations of metabolites (49, 50). A full overview of data quality measures is presented in Table 1.
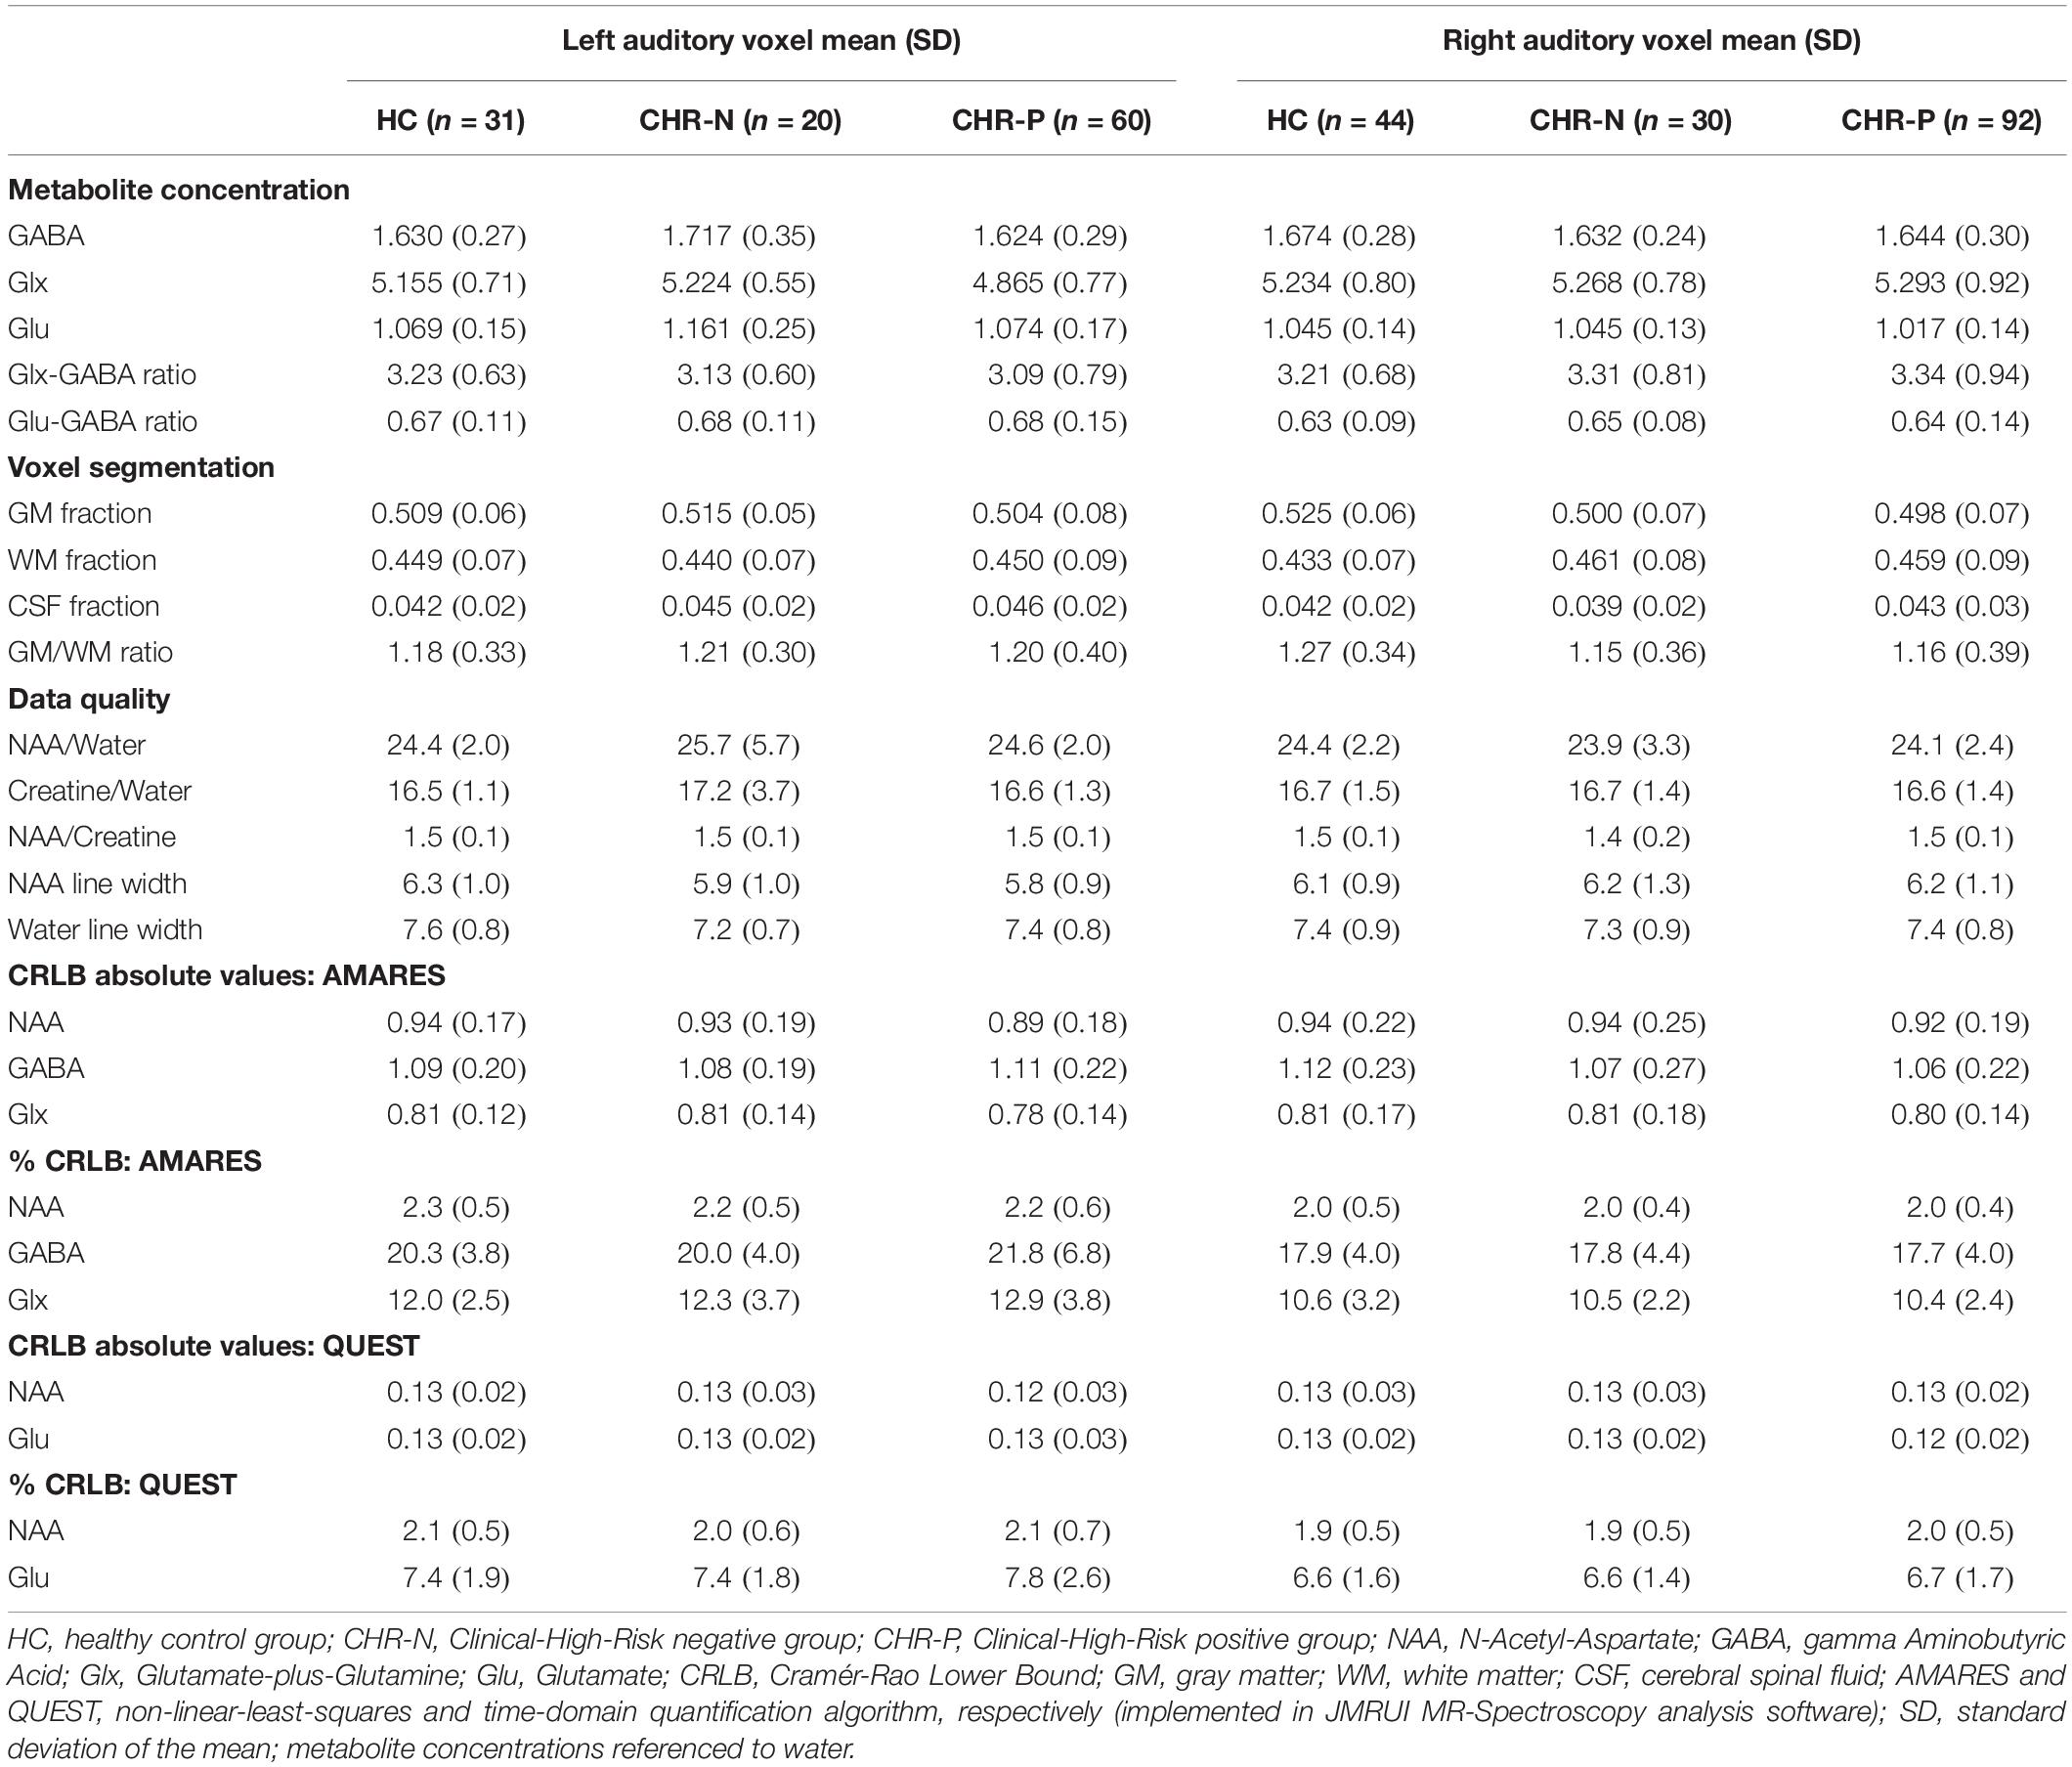
Table 1. Metabolite concentrations, voxel segmentation fractions, and data quality measures.
MEGA-OFF, MEGA-ON, and unsuppressed water spectra were processed in jMRUI v6.0 (51). Firstly, edited spectra were generated by subtracting MEGA-OFF from MEGA-ON and GABA, Glx and MEGA edited-NAA were quantified using the AMARES routine (52). Based on previous work (53), we used QUEST/QUASAR (54) to estimate glutamate and glutamine separately from edited MEGA-PRESS spectra (see Figure 1 for AMARES and QUEST example spectra). This approach has been shown to estimate levels of glutamate and glutamine that are consistent with literature values, provided spectroscopic quality is good, with the principal determinant being the linewidth of NAA (<10.6 Hz: means were around 6 Hz, see Table 1). As only glutamate spectral quality measures were met (%CRLB for LAUD 8.2 ± 3.1%, RAUD 7.1 ± 3.0%), but not those for glutamine (%CRLB for LAUD 40.9 ± 41.1%, RAUD 18.2 ± 26.7%), only glutamate levels are reported.
The edited MEGA-PRESS ON spectra were fitted to a basis set consisting of NAA, GABA, and glutamate in which the full edited spectra were represented. The basic model sets were generated from a simulated MEGA-PRESS sequence using the routine NMRSCOPE-B. GABA was fitted as a single Gaussian line with the linewidth constrained to be between 20 and 25 Hz at full width, half maximum height with the frequency constrained to be +1.00 ppm away from NAA. Glx was fitted as a symmetric doublet centered at 3.76 ppm with a Lorentzian line shape, a 10.4 Hz separation, with the same linewidth as NAA. NAA was fitted as a Lorentzian line, 180° out of phase to GABA and Glx. The MEGA-OFF spectra were also fitted by AMARES to give estimates of the unedited NAA (peak at 2.02 ppm), of total creatine (Crn: peak at 3.03 ppm) and of choline-containing compounds (Cho: peak at 3.21 ppm; glycerol-phosphorylcholine, phosphorylcholine and free choline).
Finally, data was referenced to the separately collected unsuppressed water concentration and corrected for contamination of cerebrospinal fluid (CSF) fractions (metabolite concentration * 1/1-CSF fraction).
Group differences in demographic data, clinical assessment scores, as well as cognition (BACS scores) were assessed with non-parametric Kruskal-Wallis tests, using an alpha-level of 0.05 (2-sided tests). Post-hoc comparisons were Games-Howell corrected for multiple comparisons and corrected for ties. BACS data were first z-normalized to HC data, separately for females and males. Gender differences were tested with Chi-square tests.
As the number of available data were different for the RAUD and LAUD voxels, the main analyses described below were run for each voxel separately, using an alpha-level of 0.05 (2-sided).
First, potential group differences in voxel segmentation, NAA and Creatine levels were investigated using one-way Welch’s ANOVAs with the dependent-variables NAA/water, Creatine/water, gray matter (GM), white matter (WM), cerebrospinal fluid (CSF), and GM/WM ratio, and the fixed-factor GROUP (HC, CHR-N, CHR-P). Both NAA and Creatine concentrations were obtained from the MEGA-OFF sequence, while water concentration was estimated from the unsuppressed water scan.
Subsequent analyses included General Linear Model ANCOVAs, using the dependent-variables GABA, Glx, glutamate (Glu), Glx/GABA ratio, and Glu/GABA ratio, and the fixed-factor GROUP (HC, CHR-N, and CHR-P), with AGE, GENDER and the ratio between GM and WM as covariates. Subsequent post-hoc pairwise comparisons for significant metabolites were Games-Howell corrected to control for multiple comparisons.
In addition, post-hoc analysis included two sets of follow-up CHR-P subgroups: 1) APS-persistent vs. APS non-persistent group, based on APS-criteria both at baseline and during 1-year follow-up, and 2) CHR-P participants with either good or poor functional outcomes (GAF scores good ≥ 65, poor < 65) at their latest follow-up assessment.
Finally, correlations between significant LAUD Glx concentrations and clinical, social and cognitive functioning, as well as age, known to correlate with Glx values (22, 55), were tested across the CHR-N and CHR-P groups, using linear regression with backward selection to identify the strongest predictors of abnormal metabolite concentrations. Potential collinearity issues were checked in the final model with VIF statistics.
There were no differences in age, or gender distribution between groups (Table 2). CHR-P and CHR-N groups, however, differed from HC in GAF scores (CHR-N: p < 0.001; CHR-P: p < 0.001) as well as in GF-social functioning (CHR-N: p = 0.002; CHR-P: p < 0.001), but GF-role was different from HC only in the CHR-P group (p < 0.001). Furthermore, the CHR-P group had less years of education, compared to controls (p = 0.017), and general cognition was affected only in CHR-Ps, who performed worse than controls on the BACS Token Motor task (p < 0.001), Symbol Coding task (p = 0.046), and had lower BACS composite scores (p = 0.018).
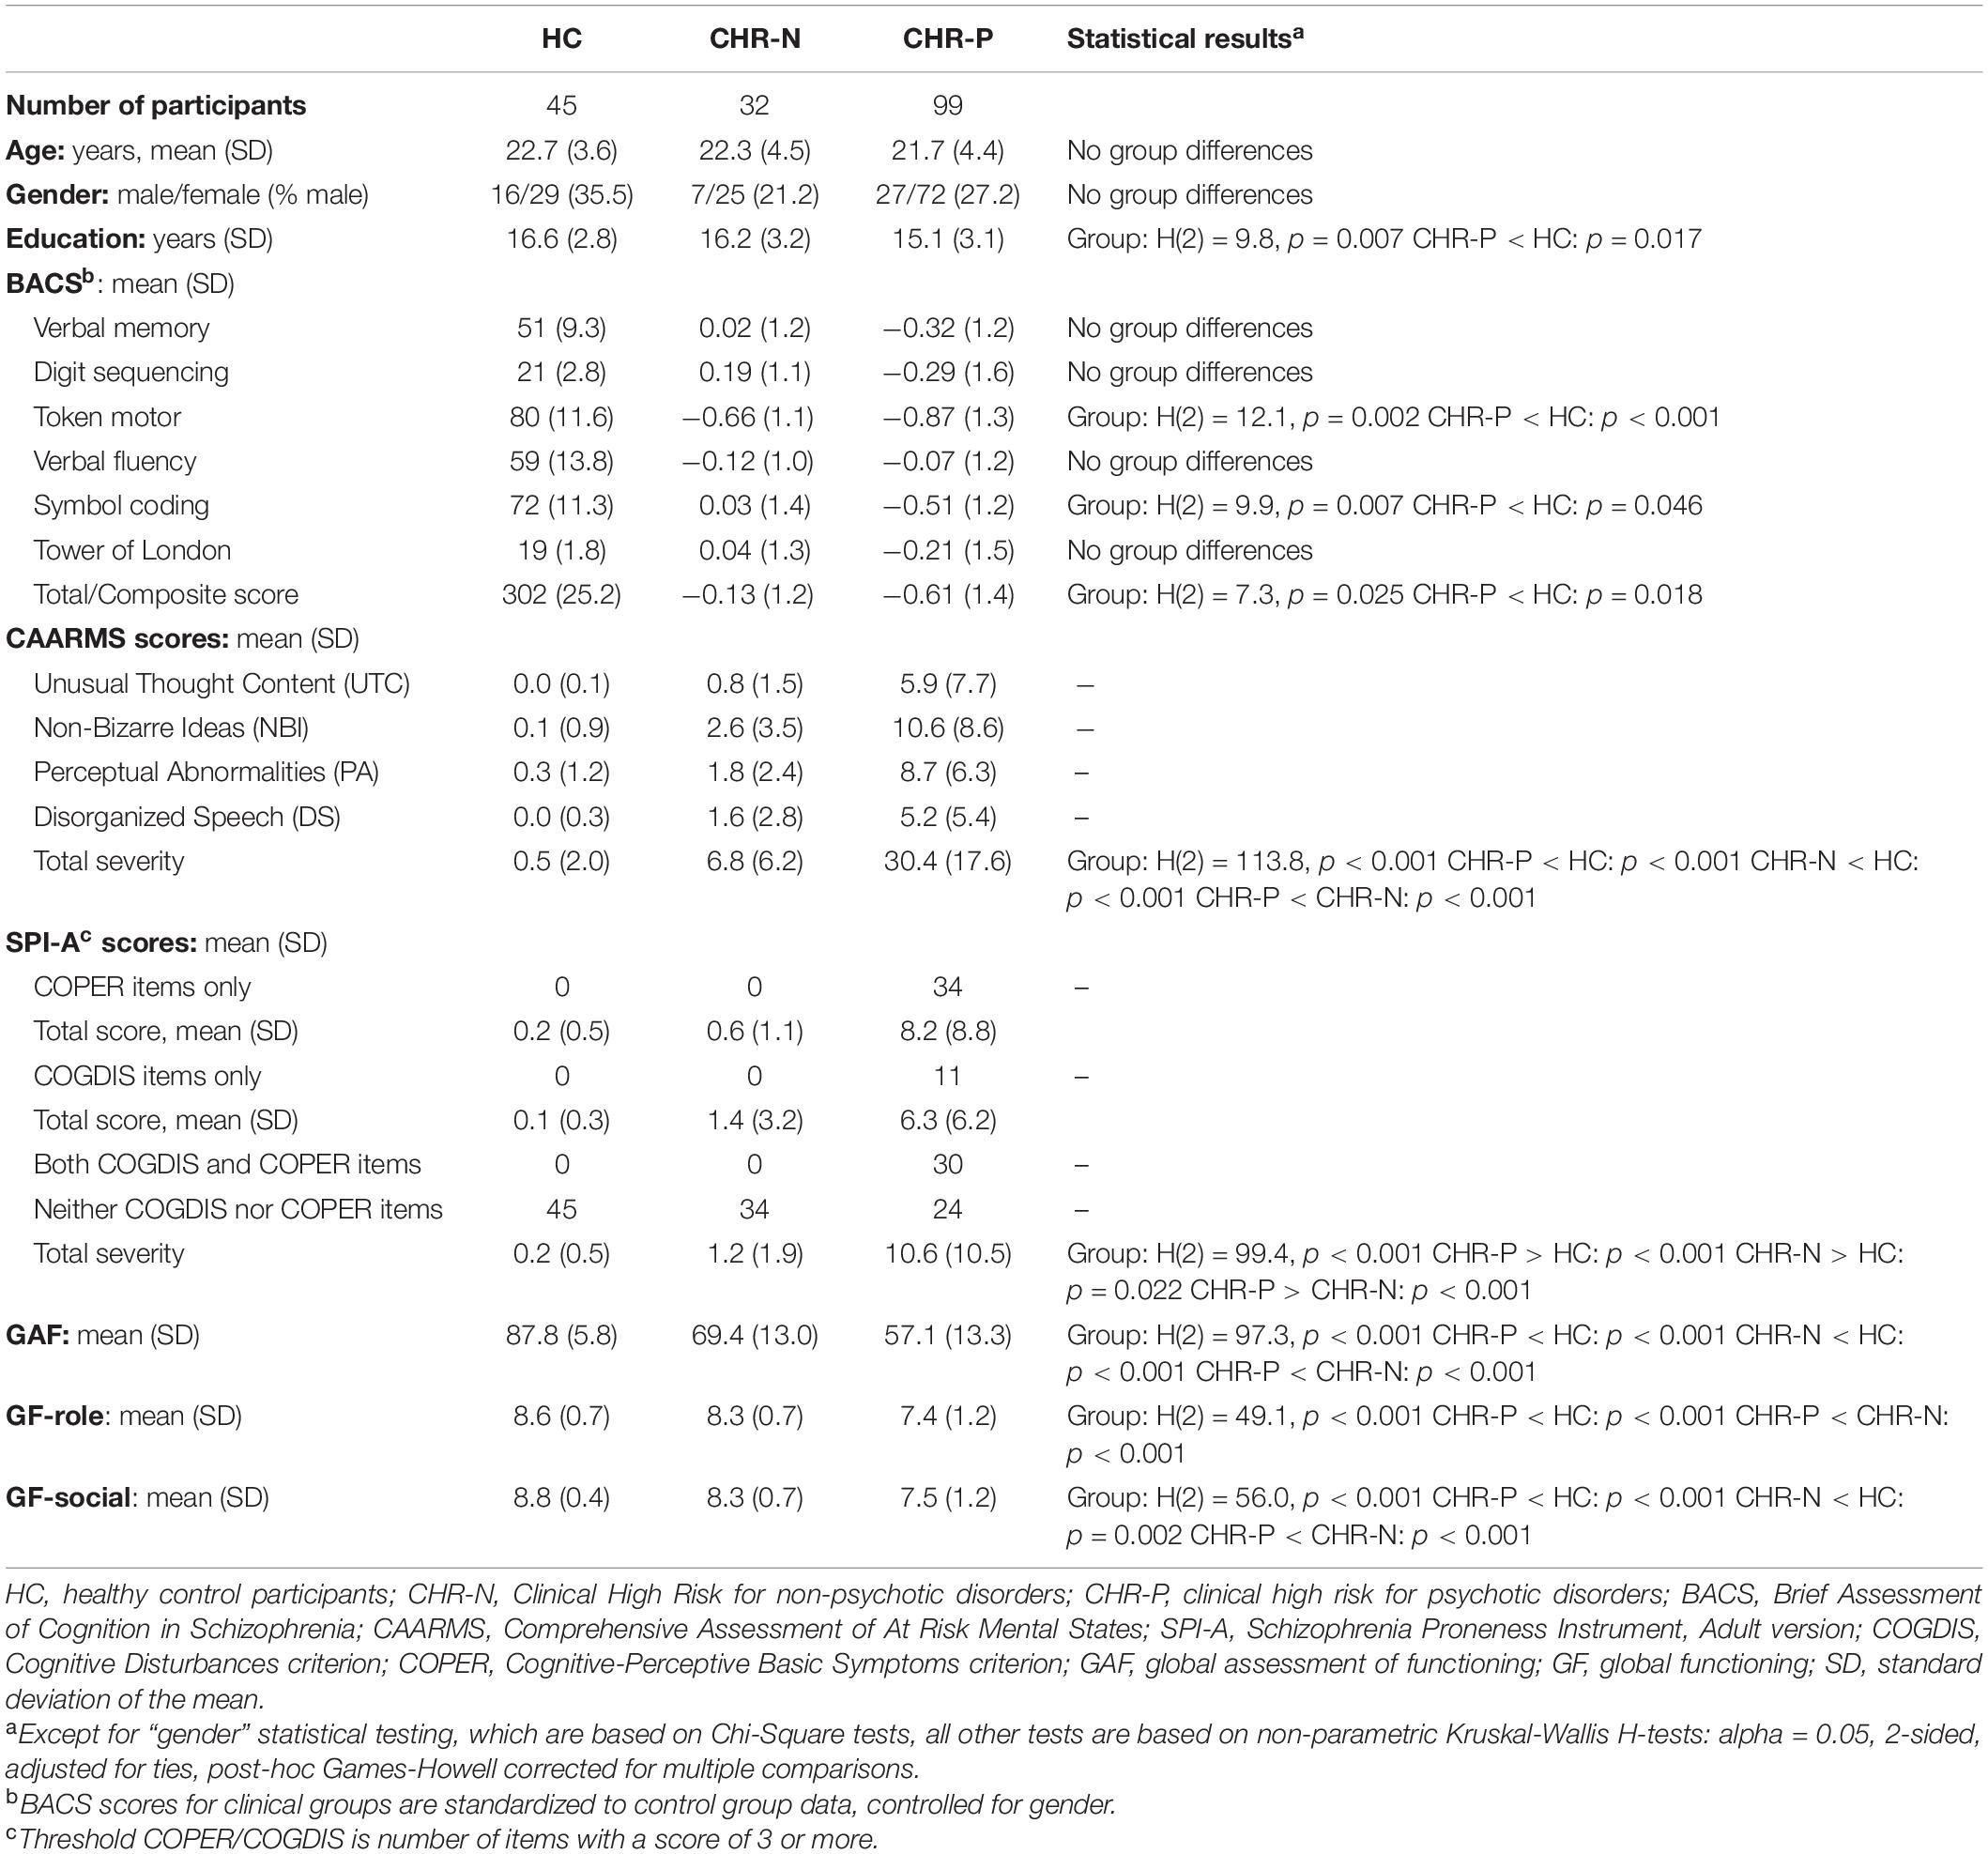
Table 2. Demographic, general cognition, and clinical assessment data.
After removing data with partially missing metabolite concentrations or violations of the other quality control measures (Line width NAA and water, and CRLB values), group means and standard deviations for NAA and Creatine concentration, as well as GM, WM, CSF, or GM/WM ratios were not different between groups (HC, CHR-N, and CHR-P), neither for the LAUD nor for the RAUD voxel (Table 1).
ANCOVA analyses revealed no GROUP effects in any metabolites in the RAUD voxel (all p-values > 0.34). In contrast, the LAUD voxel showed a significant GROUP difference in Glx [F(2, 107) = 3.3, p = 0.039, uncorrected, partial η2 = 0.060] that was affected by the AGE [F(1, 107) = 10.3, p = 0.002, partial η2 = 0.089], but not by GENDER or GM-WM ratio. Exploratory post-hoc tests, including only AGE as covariate, revealed that this was driven mostly by the difference between the CHR-N and CHR-P groups (p = 0.029 uncorrected, p = 0.072 Games-Howell [GH] corrected), while the difference between either CHR-N vs. HC group (p = 0.603 uncorrected) nor CHR-P vs. HC group contrasts was significant (p = 0.058 uncorrected). Although there were two outliers in the CHR-P group (see Supplementary Material), these did not significantly influence the results. In addition, none of the other LAUD metabolites (Figure 2) or ratio scores were significant (Glx/GABA p = 0.65, or Glu/GABA p = 0.85).
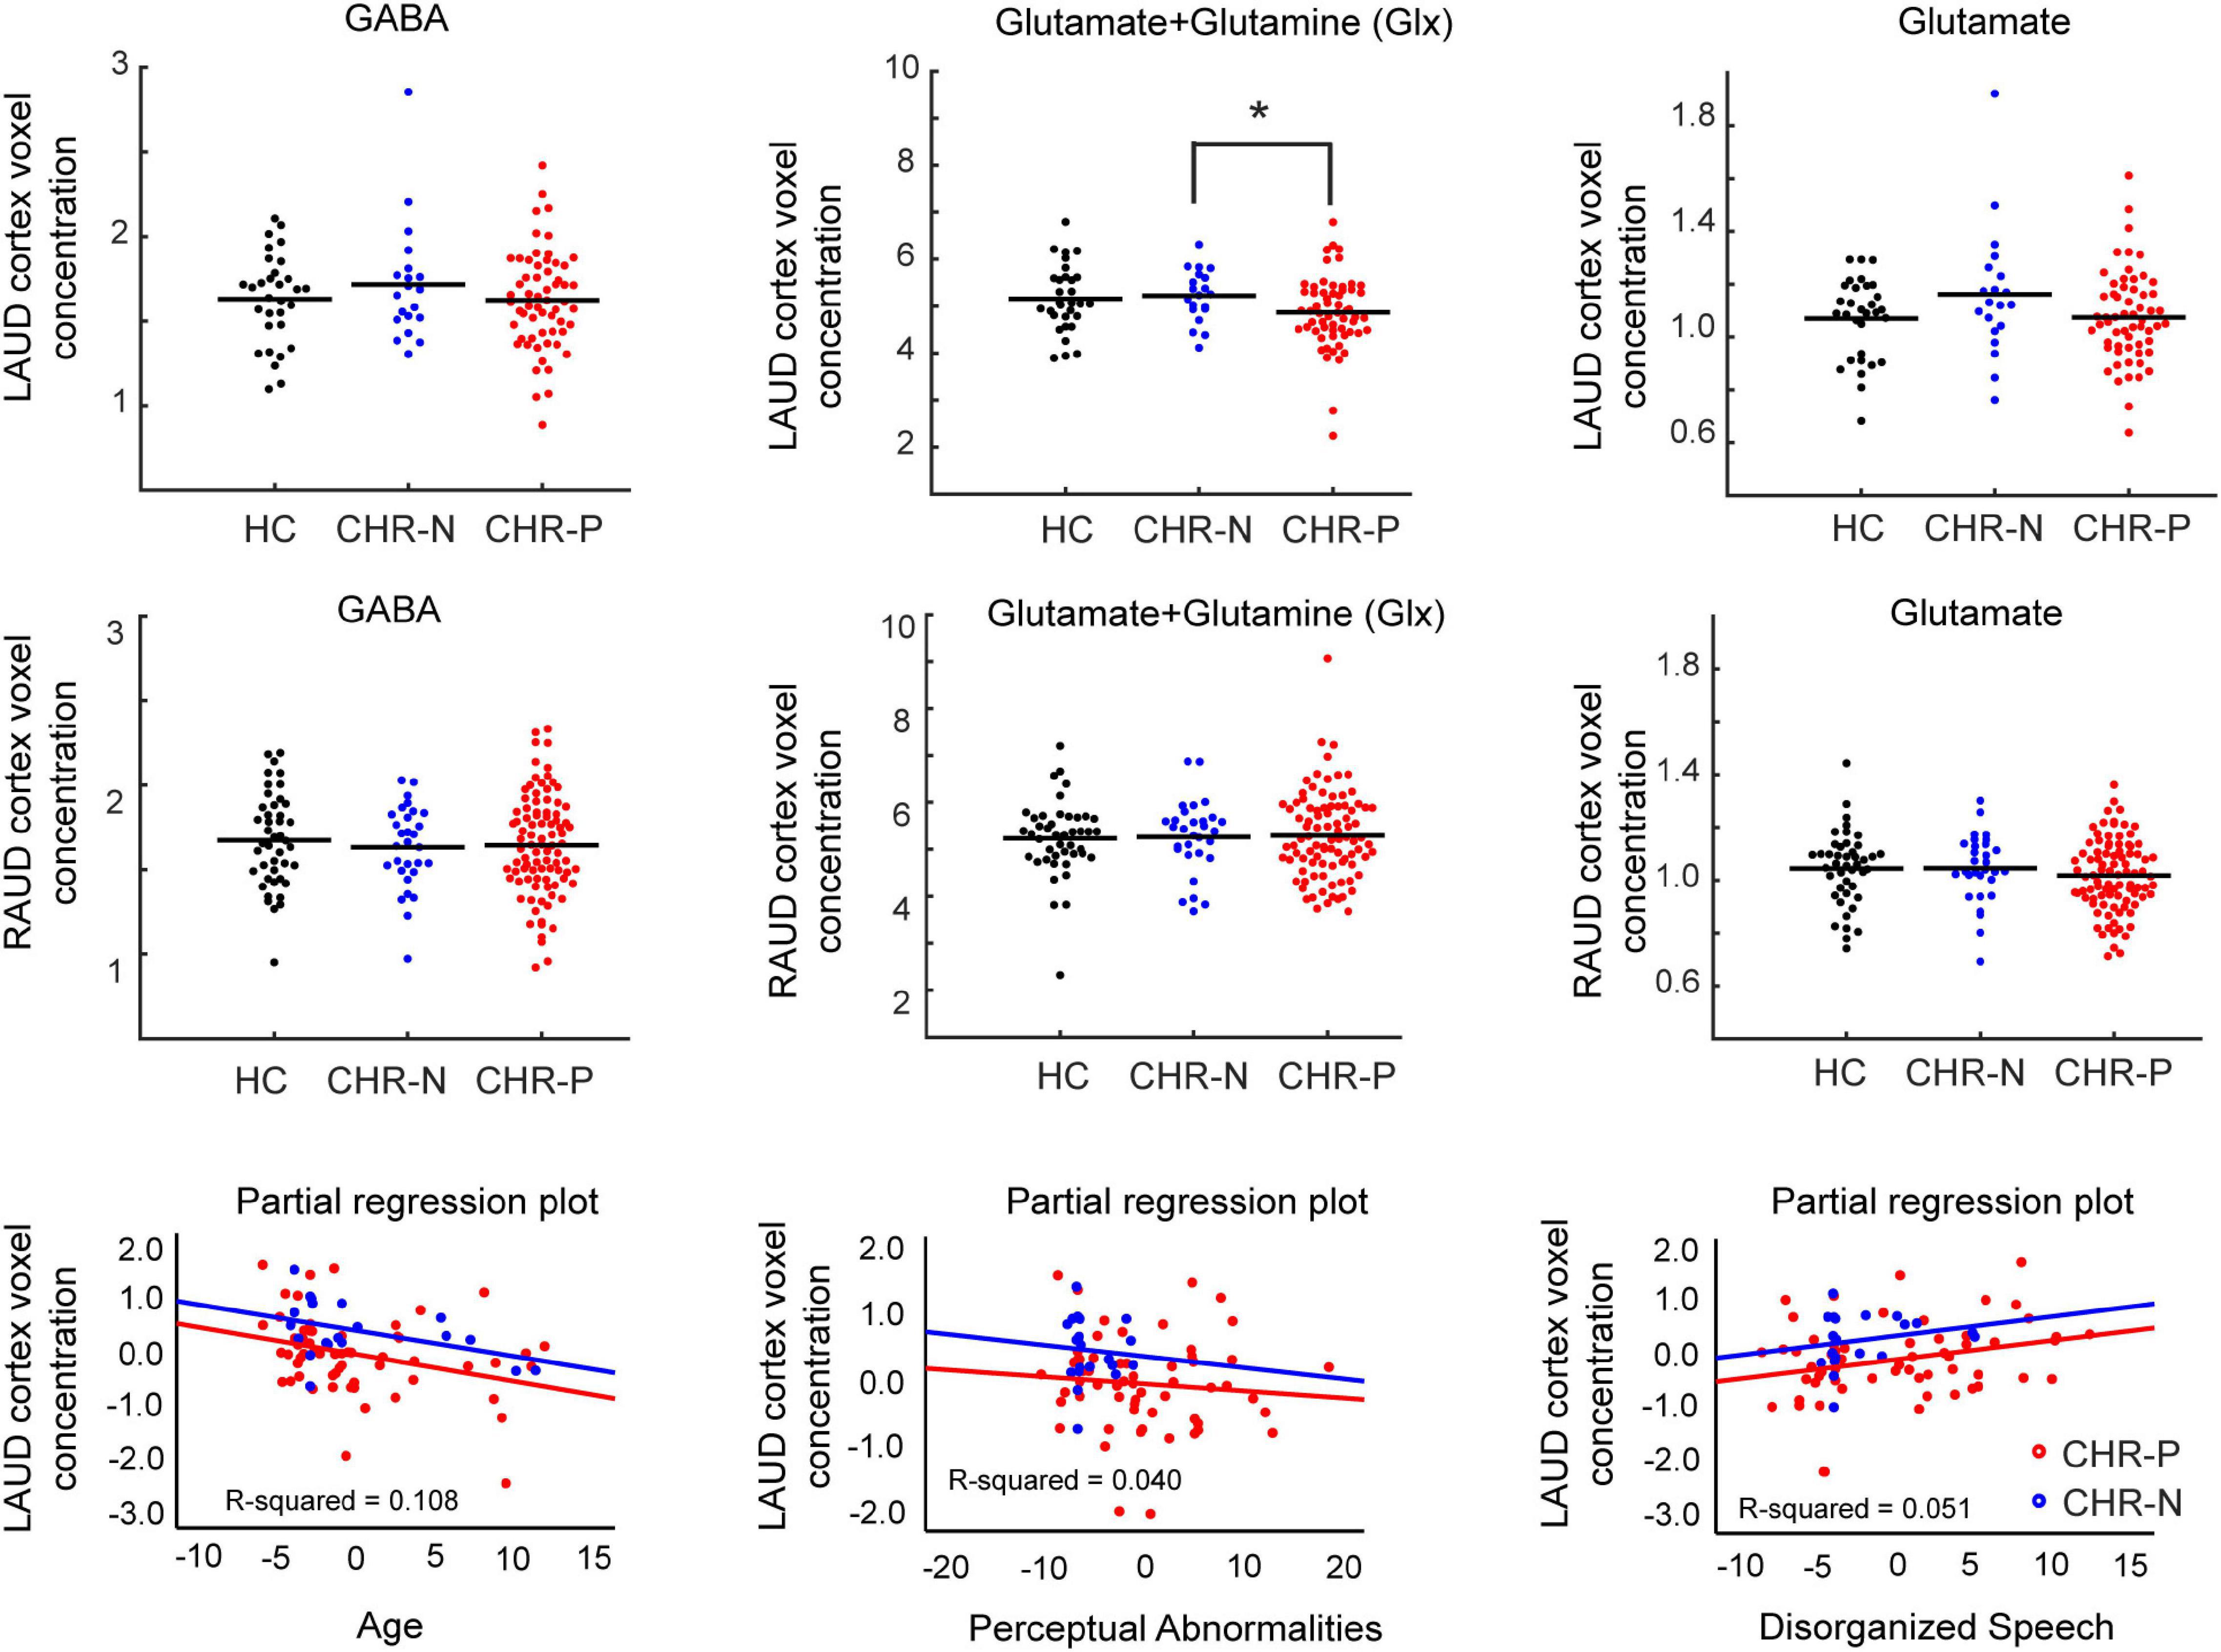
Figure 2. Metabolite concentrations and correlations. Distributions of main metabolite concentrations (GABA, Glx, and Glutamate), referenced to water, shown for left (LAUD: top row) and right (RAUD: second row) cortex voxel, and for all main groups (HC, CHR-N, and CHR-P). Significant group differences are indicated with an asterisk. Group means are indicated by a horizontal line. The bottom row shows scatter plots of partial regression correlations between LAUD z scored Glx levels and age of the participants (left), CAARMS Perceptual Abnormality scores (middle), and CAARMS Disorganized Speech scores (right). Groups are color coded, with black used for the HC group, blue for the CHR-N group and red for the CHR-P group. HC, healthy controls; CHR-N, Clinical-High-Risk negative: CHR-P, Clinical-High-Risk positive group; LAUD, left auditory MRS voxel; RAUD, right auditory MRS voxel.
Post-hoc analyses of LAUD Glx concentrations in the CHR-P group included ANCOVAs with age as covariate for two different contrasts, one for clinical outcome (APS persistent vs. APS non-persistent) as well as for functional outcome (poor vs. good functional outcome).
A total of 17 CHR-P participants with LAUD cortex data were assigned to the APS-P group. For n = 20 CHR-Ps, their baseline-recorded APS symptoms remitted (non-persistent APS-NP group). These two groups did not significantly differ from each other in LAUD Glx concentrations (APS-P vs. APS-NP: p = 0.400).
In a second contrast, CHR-P participants with good functional outcome in 12 months (GAF scores ≥ 65, n = 23) were compared in their LAUD Glx concentrations to a group with poor functional outcome (GAF scores < 65, n = 32). These groups also did not differ from each other in their LAUD Glx concentrations (GAF high vs. GAF low: p = 0.286).
A total of 11 CHR-Ps developed a psychotic episode during the follow-up period (mean/standard deviation of 17.6 ± 8.3 months; 3 < 12 month, 2 at 12 months, 6 > 12 month). For 7 of these CHR-Ps, LAUD cortex MRS data was available. Compared to healthy controls, their Glx levels were not significantly affected (p = 0.84).
Left auditory cortex Glx data from CHR-N and CHR-P group were entered together into a linear regression analysis with backward selection of potential predictive variables, including AGE, GAF, GF-role, GF-social, SPI-A total severity, CAARMS total severity, CAARMS subscales, BACS composite scores and scores on six included tests (verbal memory, digit coding, token motor, verbal fluency, symbol coding, and Tower of London task). A significant model was found [F(3, 76) = 4.9, p = 0.003], including the predictors AGE (Beta = −0.321, t = −3.0, p = 0.003, VIF = 1.010), CAARMS Perceptual Abnormalities (Beta = −0.198, t = −1.8, p = 0.081, VIF = 1.134), and CAARMS Disorganized Speech (Beta = 0.226, t = 2.0, p = 0.047, VIF = 1.133) items, that showed the same trend for both groups (Figure 2). In summary, LAUD cortex Glx levels were lower in CHR-N/P individuals with higher age, higher severity of perceptual abnormality, but lower disorganized speech symptoms.
The current study examined alterations in E/I-balance parameters in auditory cortex to test the hypothesis that neural circuits during emerging psychosis are characterized by changes in GABA, Glx, or glutamate that would be consistent with previous evidence in ScZ (40–42). Moreover, we aimed to establish whether changes in these metabolites could also constitute a potential biomarker for clinical and functional outcomes in CHR-P participants.
The hypothesized reduction in Glx in CHR-P participants was only observed for the contrast involving CHR-Ns. Expected increases in GABA levels, however, were not found. Moreover, glutamate levels were unaffected in both left and right auditory cortex. A decrease in Glx without a change in glutamate levels could point to the reductions in Glx being more affected by glutamine than glutamate concentrations. Glutamine levels, however, could not be established due to too low SNR.
Furthermore, reductions in LAUD cortex Glx concentration in CHR-P individuals did not predict APS persistence or functional outcomes, in line with a recent study (56). Previous findings, however, reported that glutamate levels in CHR-Ps predicted the severity of positive symptoms at follow up, in particular abnormal thought content (57). Moreover, higher baseline striatal glutamate has been shown to predict transition to psychosis (32).
Our finding of lower left auditory cortex Glx in CHR-Ps is consistent with data in ScZ patients (41, 42, 58). Interestingly, decreased Glx concentrations have been found in particular in patients reporting more frequent and more severe auditory verbal hallucinations (58, 59). In the current study, higher Glx concentrations in CHR-Ps, however, were associated with higher disorganized speech ratings, rather than with perceptual abnormalities. It must be noted, however, that the perceptual abnormality score of the CAARMS combines aberrant perceptual experiences thus does not reflect subthreshold auditory hallucinations alone. As such, these findings support calls for more detailed assessments of hallucinations in CHR-P groups (60).
The lower Glx concentrations in CHR-Ps were exclusively found for the LAUD cortex, in line with the predominantly left lateralized effects reported in established ScZ (42). There are known structural and functional hemispheric differences in auditory cortex (61). Functionally, consensus has emerged that left auditory cortex is more sensitive to temporal cues than right auditory cortex (62) and that Glx levels differ between hemispheres (63, 64). Moreover, there is evidence for left, but not right, superior temporal cortex (STG) gray matter loss in FEP patients (65), and in CHR-P individuals (66), in particular those that later transition to psychosis (67). Recent meta-analyses on structural changes in both ScZ patients and CHR participants, however, suggested bilateral changes in cortical thickness (68, 69).
It should be noted that MRS data was collected on a 3T scanner, and sequences were optimized for GABA (TE = 68), which especially limits the ability to measure glutamate as a separable peak in the spectrum. Nonetheless, we believe our approach successfully estimated the contribution of this metabolite. Furthermore, the number of individuals with follow-up APS persistent and APS remitted status was relatively small.
In summary, the current findings failed to show robust deficits in GABA, glutamate and/or Glx in CHR-Ps, although a specific reduction was observed in Glx between CHR-P and CHR-N groups. Furthermore, across all CHR participants, stronger Glx reductions were linked to greater APS psychopathology, but did not correlate in CHR-Ps with clinical and/or functional outcome. These patterns suggest that auditory cortex Glx levels may potentially be useful in differentiating early-stage psychosis from non-psychotic disorders, but not in the prediction of functional or clinical outcomes.
The raw data supporting the conclusions of this article will be made available by the authors, without undue reservation.
The studies involving human participants were reviewed and approved by the West of Scotland Research Ethics Service (14/WS/0099). Written informed consent to participate in this study was provided by the participants’ legal guardian/next of kin.
PU formulated research protocol and design, in collaboration with RG, JG, AG, SL, MS, and FS-L. TG-‘t-J was responsible for setting up MRS recordings, collecting data, conducting statistical analyses on the in JMRUI preprocessed data by SW, and writing of the report, together with PU. All authors have approved the final version.
This study was supported by the project MR/L011689/1 from the Medical Research Council (MRC) and ERA-NET project 01EW2007A.
The authors declare that the research was conducted in the absence of any commercial or financial relationships that could be construed as a potential conflict of interest.
All claims expressed in this article are solely those of the authors and do not necessarily represent those of their affiliated organizations, or those of the publisher, the editors and the reviewers. Any product that may be evaluated in this article, or claim that may be made by its manufacturer, is not guaranteed or endorsed by the publisher.
The investigators acknowledge the support of the Scottish Mental Health Research Network now called the NHS Research Scotland Mental Health Network (NRS MHN: http://www.nhsresearchscotland.org.uk/research-areas/mental-health) for providing assistance with participant recruitment, interviews, and cognitive assessments. We would like to thank both the participants and patients who took part in the study and the research assistants of the YouR-study for supporting the recruitment and assessment of CHR-participants.
The Supplementary Material for this article can be found online at: https://www.frontiersin.org/articles/10.3389/fpsyt.2022.859322/full#supplementary-material
1. Lewis DA, Moghaddam B. Cognitive dysfunction in schizophrenia: convergence of gamma-aminobutyric acid and glutamate alterations. Arch Neurol. (2006) 63:1372–6. doi: 10.1001/archneur.63.10.1372
2. Krystal JH, Anticevic A, Yang GJ, Dragoi G, Driesen NR, Wang XJ, et al. Impaired tuning of neural ensembles and the pathophysiology of schizophrenia: a translational and computational neuroscience perspective. Biol Psychiatry. (2017) 81:874–85. doi: 10.1016/j.biopsych.2017.01.004
3. Hooker C, Park S. Emotion processing and its relationship to social functioning in schizophrenia patients. Psychiatry Res. (2002) 112:41–50. doi: 10.1016/s0165-1781(02)00177-4
4. Fett AK, Viechtbauer W, Dominguez MD, Penn DL, Van Os J, Krabbendam L. The relationship between neurocognition and social cognition with functional outcomes in schizophrenia: a meta-analysis. Neurosci Biobehav Rev. (2011) 35:573–88. doi: 10.1016/j.neubiorev.2010.07.001
5. Green MF. What are the functional consequences of neurocognitive deficits in schizophrenia? Am J Psychiatry. (1996) 153:321–30. doi: 10.1176/ajp.153.3.321
6. Green MF, Kern RS, Braff DL, Mintz J. Neurocognitive deficits and functional outcome in schizophrenia: are we measuring the “right stuff”? Schizophr Bull. (2000) 26:119–36.
7. Millan MJ, Andrieux A, Bartzokis G, Cadenhead K, Dazzan P, Fusar-Poli P, et al. Altering the course of schizophrenia: progress and perspectives. Nat Rev Drug Discov. (2016) 15:485–515. doi: 10.1038/nrd.2016.28
8. Shu Y, Hasenstaub A, Mccormick DA. Turning on and off recurrent balanced cortical activity. Nature. (2003) 423:288–93. doi: 10.1038/nature01616
9. Haider B, Duque A, Hasenstaub AR, Mccormick DA. Neocortical network activity in vivo is generated through a dynamic balance of excitation and inhibition. J Neurosci. (2006) 26:4535–45. doi: 10.1523/JNEUROSCI.5297-05.2006
10. Anticevic A, Lisman J. How can global alteration of excitation/inhibition balance lead to the local dysfunctions that underlie schizophrenia? Biol Psychiatry. (2017) 81:818–20. doi: 10.1016/j.biopsych.2016.12.006
11. Whittington MA, Traub RD, Jefferys JG. Synchronized oscillations in interneuron networks driven by metabotropic glutamate receptor activation. Nature. (1995) 373:612–5. doi: 10.1038/373612a0
12. Rolls ET, Deco G. Prediction of decisions from noise in the brain before the evidence is provided. Front Neurosci. (2011) 5:33. doi: 10.3389/fnins.2011.00033
13. Lisman J. Excitation, inhibition, local oscillations, or large-scale loops: what causes the symptoms of schizophrenia? Curr Opin Neurobiol. (2012) 22:537–44. doi: 10.1016/j.conb.2011.10.018
14. MacDonald ML, Garver M, Newman J, Sun Z, Kannarkat J, Salisbury R, et al. Synaptic proteome alterations in the primary auditory cortex of individuals with schizophrenia. JAMA Psychiatry. (2020) 77:86–95. doi: 10.1001/jamapsychiatry.2019.2974
15. Benes FM, Berretta S. GABAergic interneurons: implications for understanding schizophrenia and bipolar disorder. Neuropsychopharmacology. (2001) 25:1–27. doi: 10.1016/S0893-133X(01)00225-1
16. Lewis DA, Curley AA, Glausier JR, Volk DW. Cortical parvalbumin interneurons and cognitive dysfunction in schizophrenia. Trends Neurosci. (2012) 35:57–67. doi: 10.1016/j.tins.2011.10.004
17. Catts VS, Lai YL, Weickert CS, Weickert TW, Catts SV. A quantitative review of the postmortem evidence for decreased cortical N-methyl-D-aspartate receptor expression levels in schizophrenia: how can we link molecular abnormalities to mismatch negativity deficits? Biol Psychol. (2016) 116:57–67. doi: 10.1016/j.biopsycho.2015.10.013
18. Kornhuber J, Mack-Burkhardt F, Riederer P, Hebenstreit GF, Reynolds GP, Andrews HB, et al. [3H]MK-801 binding sites in postmortem brain regions of schizophrenic patients. J Neural Transm. (1989) 77:231–6. doi: 10.1007/BF01248936
19. Akbarian S, Sucher NJ, Bradley D, Tafazzoli A, Trinh D, Hetrick WP, et al. Selective alterations in gene expression for NMDA receptor subunits in prefrontal cortex of schizophrenics. J Neurosci. (1996) 16:19–30. doi: 10.1523/JNEUROSCI.16-01-00019.1996
20. Weickert CS, Fung SJ, Catts VS, Schofield PR, Allen KM, Moore LT, et al. Molecular evidence of N-methyl-D-aspartate receptor hypofunction in schizophrenia. Mol Psychiatry. (2013) 18:1185–92. doi: 10.1038/mp.2012.137
21. Merritt K, Egerton A, Kempton MJ, Taylor MJ, Mcguire PK. Nature of glutamate alterations in schizophrenia: a meta-analysis of proton magnetic resonance spectroscopy studies. JAMA Psychiatry. (2016) 73:665–74. doi: 10.1001/jamapsychiatry.2016.0442
22. Merritt K, Mcguire PK, Egerton A, Investigators HMIS, Aleman A, Block W, et al. Association of age, antipsychotic medication, and symptom severity in schizophrenia with proton magnetic resonance spectroscopy brain glutamate level: a mega-analysis of individual participant-level data. JAMA Psychiatry. (2021) 78:667–81. doi: 10.1001/jamapsychiatry.2021.0380
23. Sydnor VJ, Roalf DR. A meta-analysis of ultra-high field glutamate, glutamine, GABA and glutathione 1HMRS in psychosis: implications for studies of psychosis risk. Schizophr Res. (2020) 226:61–9. doi: 10.1016/j.schres.2020.06.028
24. Yung AR, McGorry PD. The initial prodrome in psychosis: descriptive and qualitative aspects. Aust N Z J Psychiatry. (1996) 30:587–99. doi: 10.3109/00048679609062654
25. Klosterkotter J, Hellmich M, Steinmeyer EM, Schultze-Lutter F. Diagnosing schizophrenia in the initial prodromal phase. Arch Gen Psychiatry. (2001) 58:158–64. doi: 10.1001/archpsyc.58.2.158
26. McGorry PD, Nelson B, Amminger GP, Bechdolf A, Francey SM, Berger G, et al. Intervention in individuals at ultra-high risk for psychosis: a review and future directions. J Clin Psychiatry. (2009) 70:1206–12. doi: 10.4088/JCP.08r04472
27. Fusar-Poli P, Cappucciati M, Rutigliano G, Schultze-Lutter F, Bonoldi I, Borgwardt S, et al. At risk or not at risk? A meta-analysis of the prognostic accuracy of psychometric interviews for psychosis prediction. World Psychiatry. (2015) 14:322–32. doi: 10.1002/wps.20250
28. Romeo B, Petillion A, Martelli C, Benyamina A. Magnetic resonance spectroscopy studies in subjects with high risk for psychosis: a meta-analysis and review. J Psychiatr Res. (2020) 125:52–65. doi: 10.1016/j.jpsychires.2020.03.006
29. Wenneberg C, Glenthoj BY, Hjorthoj C, Buchardt Zingenberg FJ, Glenthoj LB, Rostrup E, et al. Cerebral glutamate and GABA levels in high-risk of psychosis states: a focused review and meta-analysis of (1)H-MRS studies. Schizophr Res. (2020) 215:38–48. doi: 10.1016/j.schres.2019.10.050
30. de la Fuente-Sandoval C, Leon-Ortiz P, Favila R, Stephano S, Mamo D, Ramirez-Bermudez J, et al. Higher levels of glutamate in the associative-striatum of subjects with prodromal symptoms of schizophrenia and patients with first-episode psychosis. Neuropsychopharmacology. (2011) 36:1781–91. doi: 10.1038/npp.2011.65
31. de la Fuente-Sandoval C, Reyes-Madrigal F, Mao X, Leon-Ortiz P, Rodriguez-Mayoral O, Solis-Vivanco R, et al. Cortico-striatal GABAergic and glutamatergic dysregulations in subjects at ultra-high risk for psychosis investigated with proton magnetic resonance spectroscopy. Int J Neuropsychopharmacol. (2015) 19:yv105. doi: 10.1093/ijnp/pyv105
32. de la Fuente-Sandoval C, Leon-Ortiz P, Azcarraga M, Favila R, Stephano S, Graff-Guerrero A. Striatal glutamate and the conversion to psychosis: a prospective 1H-MRS imaging study. Int J Neuropsychopharmacol. (2013) 16:471–5. doi: 10.1017/S1461145712000314
33. Javitt DC. When doors of perception close: bottom-up models of disrupted cognition in schizophrenia. Annu Rev Clin Psychol. (2009) 5:249–75. doi: 10.1146/annurev.clinpsy.032408.153502
34. Erickson MA, Ruffle A, Gold JM. A meta-analysis of mismatch negativity in schizophrenia: from clinical risk to disease specificity and progression. Biol Psychiatry. (2016) 79:980–7. doi: 10.1016/j.biopsych.2015.08.025
35. Sauer A, Zeev-Wolf M, Grent-’T-Jong T, Recasens M, Wacongne C, Wibral M, et al. Impairment in predictive processes during auditory mismatch negativity in ScZ: evidence from event-related fields. Hum Brain Mapp. (2017) 38:5082–93. doi: 10.1002/hbm.23716
36. Lepock JR, Mizrahi R, Korostil M, Bagby RM, Pang EW, Kiang M. Event-related potentials in the clinical high-risk (CHR) state for psychosis: a systematic review. Clin EEG Neurosci. (2018) 49:215–25. doi: 10.1177/1550059418755212
37. Perez VB, Woods SW, Roach BJ, Ford JM, Mcglashan TH, Srihari VH, et al. Automatic auditory processing deficits in schizophrenia and clinical high-risk patients: forecasting psychosis risk with mismatch negativity. Biol Psychiatry. (2014) 75:459–69. doi: 10.1016/j.biopsych.2013.07.038
38. Bodatsch M, Brockhaus-Dumke A, Klosterkotter J, Ruhrmann S. Forecasting psychosis by event-related potentials-systematic review and specific meta-analysis. Biol Psychiatry. (2015) 77:951–8. doi: 10.1016/j.biopsych.2014.09.025
39. Lavoie S, Jack BN, Griffiths O, Ando A, Amminger P, Couroupis A, et al. Impaired mismatch negativity to frequency deviants in individuals at ultra-high risk for psychosis, and preliminary evidence for further impairment with transition to psychosis. Schizophr Res. (2018) 191:95–100. doi: 10.1016/j.schres.2017.11.005
40. Atagun MI, Sikoglu EM, Soykan C, Serdar Suleyman C, Ulusoy-Kaymak S, Caykoylu A, et al. Perisylvian GABA levels in schizophrenia and bipolar disorder. Neurosci Lett. (2017) 637:70–4. doi: 10.1016/j.neulet.2016.11.051
41. Atagun MI, Sikoglu EM, Can SS, Karakas-Ugurlu G, Ulusoy-Kaymak S, Caykoylu A, et al. Investigation of Heschl’s gyrus and planum temporale in patients with schizophrenia and bipolar disorder: a proton magnetic resonance spectroscopy study. Schizophr Res. (2015) 161:202–9. doi: 10.1016/j.schres.2014.11.012
42. Bustillo JR, Upston J, Mayer EG, Jones T, Maudsley AA, Gasparovic C, et al. Glutamatergic hypo-function in the left superior and middle temporal gyri in early schizophrenia: a data-driven three-dimensional proton spectroscopic imaging study. Neuropsychopharmacology. (2020) 45:1851–9. doi: 10.1038/s41386-020-0707-y
43. Uhlhaas PJ, Gajwani R, Gross J, Gumley AI, Lawrie SM, Schwannauer M. The youth mental health risk and resilience study (YouR-study). BMC Psychiatry. (2017) 17:43. doi: 10.1186/s12888-017-1206-5
44. Sheehan DV, Lecrubier Y, Sheehan KH, Amorim P, Janavs J, Weiller E, et al. The mini-international neuropsychiatric interview (M.I.N.I.): the development and validation of a structured diagnostic psychiatric interview for DSM-IV and ICD-10. J Clin Psychiatry. (1998) 59(Suppl. 20):22–33; quiz 34–57.
45. Yung AR, Yuen HP, Mcgorry PD, Phillips LJ, Kelly D, Dell’olio M, et al. Mapping the onset of psychosis: the comprehensive assessment of at-risk mental states. Aust N Z J Psychiatry. (2005) 39:964–71. doi: 10.1080/j.1440-1614.2005.01714.x
46. Schultze-Lutter F, Addington J, Ruhrmann S, Klosterkötter K. Schizophrenia Proneness Instrument, Adult Version (SPI-A). Rome: Giovanni Fioriti Editore (2007).
47. Keefe RS, Goldberg TE, Harvey PD, Gold JM, Poe MP, Coughenour L. The brief assessment of cognition in schizophrenia: reliability, sensitivity, and comparison with a standard neurocognitive battery. Schizophr Res. (2004) 68:283–97. doi: 10.1016/j.schres.2003.09.011
48. Gruetter R, Tkac I. Field mapping without reference scan using asymmetric echo-planar techniques. Magn Reson Med. (2000) 43:319–23. doi: 10.1002/(sici)1522-2594(200002)43:2<319::aid-mrm22>3.0.co;2-1
49. Kreis R. The trouble with quality filtering based on relative Cramer-Rao lower bounds. Magn Reson Med. (2016) 75:15–8. doi: 10.1002/mrm.25568
50. Lin A, Andronesi O, Bogner W, Choi IY, Coello E, Cudalbu C, et al. Minimum reporting standards for in vivo magnetic resonance spectroscopy (MRSinMRS): experts’ consensus recommendations. NMR Biomed. (2021) 34:e4484. doi: 10.1002/nbm.4484
51. Stefan D, Di Cesare F, Andrasescu A, Popa E, Lazariev A, Vescovo E, et al. Quantitation of magnetic resonance spectroscopy signals: the jMRUI software package. Meas Sci Technol. (2009) 20:104035.
52. Mierisova S, Van Den Boogaart A, Tkac I, Van Hecke P, Vanhamme L, Liptaj T. New approach for quantitation of short echo time in vivo 1H MR spectra of brain using AMARES. NMR Biomed. (1998) 11:32–9. doi: 10.1002/(sici)1099-1492(199802)11:1<32::aid-nbm501>3.0.co;2-#
53. Sanaei Nezhad F, Anton A, Michou E, Jung J, Parkes LM, Williams SR. Quantification of GABA, glutamate and glutamine in a single measurement at 3 T using GABA-edited MEGA-PRESS. NMR Biomed. (2018) 31:e3847. doi: 10.1002/nbm.3847
54. Ratiney H, Sdika M, Coenradie Y, Cavassila S, Van Ormondt D, Graveron-Demilly D. Time-domain semi-parametric estimation based on a metabolite basis set. NMR Biomed. (2005) 18:1–13. doi: 10.1002/nbm.895
55. Marsman A, Van Den Heuvel MP, Klomp DW, Kahn RS, Luijten PR, Hulshoff Pol HE. Glutamate in schizophrenia: a focused review and meta-analysis of (1)H-MRS studies. Schizophr Bull. (2013) 39:120–9.
56. Wenneberg C, Glenthoj BY, Glenthoj LB, Fagerlund B, Krakauer K, Kristensen TD, et al. Baseline measures of cerebral glutamate and GABA levels in individuals at ultrahigh risk for psychosis: implications for clinical outcome after 12 months. Eur Psychiatry. (2020) 63:e83. doi: 10.1192/j.eurpsy.2020.77
57. Egerton A, Stone JM, Chaddock CA, Barker GJ, Bonoldi I, Howard RM, et al. Relationship between brain glutamate levels and clinical outcome in individuals at ultra high risk of psychosis. Neuropsychopharmacology. (2014) 39:2891–9. doi: 10.1038/npp.2014.143
58. Hugdahl K, Craven AR, Nygard M, Loberg EM, Berle JO, Johnsen E, et al. Glutamate as a mediating transmitter for auditory hallucinations in schizophrenia: a (1)H MRS study. Schizophr Res. (2015) 161:252–60. doi: 10.1016/j.schres.2014.11.015
59. Hjelmervik H, Craven AR, Sinceviciute I, Johnsen E, Kompus K, Bless JJ, et al. Intra-regional Glu-GABA vs inter-regional Glu-Glu imbalance: a 1H-MRS study of the neurochemistry of auditory verbal hallucinations in schizophrenia. Schizophr Bull. (2020) 46:633–42. doi: 10.1093/schbul/sbz099
60. Montagnese M, Leptourgos P, Fernyhough C, Waters F, Laroi F, Jardri R, et al. A review of multimodal hallucinations: categorization, assessment, theoretical perspectives, and clinical recommendations. Schizophr Bull. (2021) 47:237–48. doi: 10.1093/schbul/sbaa101
61. Zatorre RJ, Belin P, Penhune VB. Structure and function of auditory cortex: music and speech. Trends Cogn Sci. (2002) 6:37–46. doi: 10.1016/s1364-6613(00)01816-7
62. Poeppel D. The analysis of speech in different temporal integration windows: cerebral lateralization as ‘asymmetric sampling in time’. Speech Commun. (2003) 41:245–55. doi: 10.1016/s0167-6393(02)00107-3
63. Kondo HM, Farkas D, Denham SL, Asai T, Winkler I. Auditory multistability and neurotransmitter concentrations in the human brain. Philos Trans R Soc Lond B Biol Sci. (2017) 372:20160110. doi: 10.1098/rstb.2016.0110
64. Kondo HM, Lin IF. Excitation-inhibition balance and auditory multistable perception are correlated with autistic traits and schizotypy in a non-clinical population. Sci Rep. (2020) 10:8171. doi: 10.1038/s41598-020-65126-6
65. Escarti MJ, Garcia-Marti G, Sanz-Requena R, Marti-Bonmati L, Cabrera B, Vieta E, et al. Auditory hallucinations in first-episode psychosis: a voxel-based morphometry study. Schizophr Res. (2019) 209:148–55. doi: 10.1016/j.schres.2019.05.001
66. Takahashi T, Wood SJ, Yung AR, Soulsby B, Mcgorry PD, Suzuki M, et al. Progressive gray matter reduction of the superior temporal gyrus during transition to psychosis. Arch Gen Psychiatry. (2009) 66:366–76. doi: 10.1001/archgenpsychiatry.2009.12
67. Takahashi T, Wood SJ, Yung AR, Walterfang M, Phillips LJ, Soulsby B, et al. Superior temporal gyrus volume in antipsychotic-naive people at risk of psychosis. Br J Psychiatry. (2010) 196:206–11. doi: 10.1192/bjp.bp.109.069732
68. Chung Y, Allswede D, Addington J, Bearden CE, Cadenhead K, Cornblatt B, et al. Cortical abnormalities in youth at clinical high-risk for psychosis: findings from the NAPLS2 cohort. Neuroimage Clin. (2019) 23:101862. doi: 10.1016/j.nicl.2019.101862
69. Enigma Clinical High Risk for Psychosis Working Group, Jalbrzikowski M, Hayes RA, Wood SJ, Nordholm D, Zhou JH, et al. Association of structural magnetic resonance imaging measures with psychosis onset in individuals at clinical high risk for developing psychosis: an ENIGMA working group mega-analysis. JAMA Psychiatry. (2021) 78:753–66. doi: 10.1001/jamapsychiatry.2021.0638
Keywords: clinical high-risk, psychosis, E/I balance, GABA, glutamate, Glx, MR-spectroscopic imaging
Citation: Grent-’t-Jong T, Gajwani R, Gross J, Gumley AI, Lawrie SM, Schwannauer M, Schultze-Lutter F, Williams SR and Uhlhaas PJ (2022) MR-Spectroscopy of GABA and Glutamate/Glutamine Concentrations in Auditory Cortex in Clinical High-Risk for Psychosis Individuals. Front. Psychiatry 13:859322. doi: 10.3389/fpsyt.2022.859322
Received: 21 January 2022; Accepted: 21 February 2022;
Published: 29 March 2022.
Edited by:
Jerome Brunelin, INSERM U1028 Centre de Recherche en Neurosciences de Lyon, FranceReviewed by:
Antoine Hone-Blanchet, Massachusetts General Hospital and Harvard Medical School, United StatesCopyright © 2022 Grent-’t-Jong, Gajwani, Gross, Gumley, Lawrie, Schwannauer, Schultze-Lutter, Williams and Uhlhaas. This is an open-access article distributed under the terms of the Creative Commons Attribution License (CC BY). The use, distribution or reproduction in other forums is permitted, provided the original author(s) and the copyright owner(s) are credited and that the original publication in this journal is cited, in accordance with accepted academic practice. No use, distribution or reproduction is permitted which does not comply with these terms.
*Correspondence: Peter J. Uhlhaas, cGV0ZXIudWhsaGFhc0BjaGFyaXRlLmRl
Disclaimer: All claims expressed in this article are solely those of the authors and do not necessarily represent those of their affiliated organizations, or those of the publisher, the editors and the reviewers. Any product that may be evaluated in this article or claim that may be made by its manufacturer is not guaranteed or endorsed by the publisher.
Research integrity at Frontiers
Learn more about the work of our research integrity team to safeguard the quality of each article we publish.