
95% of researchers rate our articles as excellent or good
Learn more about the work of our research integrity team to safeguard the quality of each article we publish.
Find out more
ORIGINAL RESEARCH article
Front. Psychiatry , 06 January 2023
Sec. Mood Disorders
Volume 13 - 2022 | https://doi.org/10.3389/fpsyt.2022.1031386
This article is part of the Research Topic Recent Developments in Neuroimaging in Mood Disorders View all 11 articles
 Tomoya Natsuyama1
 Naomichi Okamoto1
 Keita Watanabe2
 Enkhmurun Chibaatar1
 Hirofumi Tesen1
 Gaku Hayasaki1
 Atsuko Ikenouchi1,3Shingo Kakeda4
 Reiji Yoshimura1*
Background and objectives: Cortical structural changes in major depressive disorder (MDD) are usually studied using a voxel-based morphometry approach to delineate the cortical gray matter volume. Among cortical structures, gyrification patterns are considered a relatively stable indicator. In this study, we investigated differences in gyrification patterns between MDD patients and healthy controls (HCs) and explored the association of gyrification patterns with plasma brain-derived neurotrophic factor (BDNF) levels and depressive symptoms in MDD patients.
Methods: We evaluated 79 MDD patients and 94 HCs and assessed depression severity in the patients using the 17-item Hamilton Depression Rating Scale (HAM-D). Blood samples of both groups were collected to measure plasma BDNF levels. Magnetic resonance imaging (MRI) data were obtained using three-dimensional fast-spoiled gradient-recalled acquisition. Differences in plasma BDNF levels between groups were examined using the Mann–Whitney U test. Principal component analysis and orthogonal partial least squares discriminant analysis (OPLS-DA) were conducted to investigate the gyrification patterns which were significantly different between the groups, i.e., those with variable importance in projection (VIP) scores of >1.5 and p-value < 0.05 in multiple regression analyses adjusted for age and sex. Finally, multiple regression analysis was performed on the selected gyrification patterns to examine their association with BDNF levels in the two groups and HAM-D in the patients.
Results: There were no significant differences in plasma BDNF levels between the groups. We found that 108 (71.0%) of 152 total local gyrification indices were MDD < HC. We identified 10 disease-differentiating factors based on critical gyrification features (VIP > 1.5 and p-value adjusted for age and sex < 0.05). However, we found no significant correlations between the 10 gyrification patterns and plasma BDNF levels and no interaction with group. Moreover, no significant correlations were observed between the local gyrification indices and HAM-D total scores.
Conclusion: These results suggest that abnormal early cortical neurodevelopment may mediate vulnerability to MDD, independent of plasma BDNF levels and depressive symptoms.
Major depressive disorder (MDD) is a highly prevalent and debilitating mental disorder that affects more than 264 million people worldwide (1). Individuals with depression commonly experience dysfunctional symptoms, including undesirable mood, impaired concentration, and poor sleep quality, and—more importantly—these patients are at high risk (up to 15%) of suicide (2). Moreover, previous evidence shows that MDD is a risk factor for physical illnesses (3), and the most common comorbidities are chronic physical conditions such as cardiovascular and respiratory diseases, diabetes, arthritis, osteoporosis, and cancer (4). MDD is predicted to become the second major contributor to the general medical service burden by 2030 (5, 6). The pathophysiology of MDD is complex and no single model or mechanism can fully explain it. Growth and adaptation at the neuronal level is more broadly termed neuroplasticity, and it is presumably this cellular-level neuroplasticity that is altered by inflammation and hypothalamus-pituitary-adrenal axis dysfunction due to environmental stress. The process of neurogenesis is controlled by regulatory proteins. Animal studies have shown that limiting neurogenesis inhibits antidepressant effects and produces depression-like symptoms, especially in stressful situations. Thus, it has been suggested that neurogenesis promotes resilience to stress, which may be the basis for the clinical efficacy of antidepressants. Postmortem studies of MDD patients have demonstrated a loss of granule neurons in the dentate gyrus of untreated patients compared to treated and non-MDD patients. There are considerably more splitting neural progenitor cells in patients treated for MDD compared to untreated MDD and even non-MDD patients. These findings are consistent with mouse studies showing that antidepressants act by increasing neurogenesis in the adult brain. In short, neuroplasticity plays an important role in the pathophysiology of MDD (7, 8).
Cortical gyrification, a forming process of cerebral cortex folds, begins between 10 and 15 weeks of fetal development. Cortical folding related to fetal and early postnatal neurodevelopmental processes is defined by the local gyrification index (LGI) (9). LGI quantifies the amount of cortex buried within the sulcal folds and represents the extent of cortical folding. It is expressed as the ratio of the entire outer cortical surface (superficial exposed area plus the area buried in the sulcus) to the superficial exposed area (10, 11). The index of each vertex is calculated by dividing the ossicular surface area by the corresponding outer surface area (12). LGI increases dramatically during the third trimester of pregnancy and peaks by age 2, then remains relatively constant throughout the rest of life (13–15). Cortical thickness and surface area mainly characterize the neuronal density and number and spacing of the cortical columns, respectively (16–18). Therefore, computing LGI, the pattern and degree of cortical folding, might be a more stable indicator for investigating abnormal neurodevelopmental patterns in MDD. Additionally, recent technological developments in 3D image reconstruction and surface morphometry have improved LGI measurement and gained wide acceptance in psychiatric research (19).
Voxel-based morphometry is a frequently used approach in MDD patients to assay cortical structural changes and to delineate the cortical gray matter volume. Considering many ongoing studies, researchers have identified several neuroanatomical changes in MDD, including widespread focal alterations in cortical thickness (20), surface area (21), and cortical gyrification (9). A large-scale meta-analysis demonstrated distributed cortical alterations that affected the orbitofrontal cortex, anterior and posterior cingulate cortex, insula, and temporal lobes (21). Additionally, MDD is considered a disorder of dysregulated neural networks, including irregularities in the neural connection (22, 23), rather than regional abnormalities (24). Thus, direct investigation of cortical thickness, surface area, and folding patterns—which reflect different biological factors—is better and more accurate in revealing the structural alterations in MDD (14, 15). Cortical folding related to fetal and early postnatal neurodevelopmental processes is defined by LGI (9, 10, 25, 26). Thus, computing LGI might be ideal for investigating abnormal neurodevelopmental patterns in MDD. Several studies have found different LGI in patients with MDD than in healthy controls (HCs) (27–29). Reports on changes in LGI in patients with MDD are inconsistent (9, 27–29), but have not largely explored the association with depressive symptoms.
Brain-derived neurotrophic factor (BDNF) is a neurotrophic factor that is essential for neuronal survival, growth, and maintenance in brain circuits involved in emotional and cognitive function (30). Several previous studies and meta-analyses have proved that BDNF is associated with brain neuroplasticity and is involved in the pathophysiology of MDD (31–33). Previous studies also demonstrated decreased plasma or serum levels of BDNF in patients with MDD (34, 35). Perhaps, even more important is the fact that reduced BDNF levels in patients with MDD can be restored by antidepressant therapies such as pharmacotherapy and psychological interventions. Although the relevance of BDNF for MDD is obvious, no studies have investigated the relationship between LGI and BDNF levels, which might be associated with synaptogenesis and neurogenesis. Moreover, recent reports demonstrated that the BDNF gene (Val66Met) was related to changes in gyrification in bipolar disorder (36). Another report indicated that autism spectrum disorder is associated with a distorted relationship between the Val66Met genotype and determinants of regional cortical surface area—cortical gyrification and/or sulcal positioning (37). From these previous findings, it can be postulated that BDNF secretion associated with Val66Met polymorphism may be related to cortical gyrification.
Thus, we investigated differences in gyrification patterns between first-episode, drug-naïve MDD patients and HCs. Moreover, we explored the relationship between cortical gyrification and plasma BDNF levels, which might be associated with synaptogenesis and neurogenesis in both groups. We also explored the association between gyrification patterns and depressive symptoms in patients with MDD based on HAM-D scores.
Patients were recruited from the Hospital of University of Occupational and Environmental Health in Kitakyushu, Japan. We conducted the full Structured Clinical Interview from the Diagnostic and Statistical Manual for Mental Disorders-5 (DSM-5) (38) for all participants to diagnose MDD and ensure that HCs did not currently fulfill the criteria for any psychiatric diseases. We also ensured that no HC had a history of serious medical and neurological diseases or a family history of major psychiatric or neurological diseases among their first-degree relatives. Although our study population overlaps in part with several of our previously published studies (39, 40), no study has analyzed the correlation between cortical gyrification, plasma BDNF levels, and psychiatric symptoms.
Depression severity was assessed using the 17-item Hamilton Depression Rating Scale (HAM-D) (41). A veteran psychiatrist with 35 years of clinical psychiatric experience assessed patients with MDD using a GRID-Hamilton Rating Scale for Depression (GRID-HAM-D-17 and −21) (42). Patients’ blood samples were collected in regular tubes between 9:00 and 11:00 AM, and plasma samples were separated by centrifugation at 2000 rpm for 20 min. The separated plasma samples were stored at −80°C in silicone-coated tubes until analysis.
Magnetic resonance imaging data were obtained using a 3T MR system (Signa EXCITE 3T; GE Healthcare, Chicago, IL, US) with an 8-channel brain phased-array coil. Images were acquired using three-dimensional fast-spoiled gradient-recalled acquisition. The acquisition parameters were as follows: repetition time/echo time, 10/4.1 ms; flip angle, 10°; field of view, 24 cm; and resolution, 0.9 × 0.9 × 1.2 mm. All images were corrected for distortion due to gradient non-linearity using the “Grad Warp” software program.
To measure gyrification, the Statistical Parametric Mapping 12 (SPM12)1 and computational anatomy toolbox 12 (CAT12)2 were used. The preset parameters for the processing and analysis steps were under the CAT12 user manual.3 We then measured the local gyrification indices (LGIs) of 152 cortical regions from the apart a2009s segmentation (43).
All statistical analyses were performed using R and Python 3.0. We examined the differences in plasma BDNF levels using the Mann–Whitney U test. We also conducted a principal component analysis (PCA) and plotted a two-dimensional plot for differences in LGIs between MDD and HC groups. Next, we performed orthogonal partial least squares discriminant analysis (OPLS-DA) to obtain a further separation (44). OPLS-DA is a type of discriminant analysis, introduced as an improved version of partial least squares discriminant analysis (PLS-DA), which uses multivariate data to discriminate two or more groups. It quantitatively determines which variables contribute to the separation of groups. Each symbol in OPLS model overview represents the following value: dataset [X], class labels [Y], predictability of the models [Q2], goodness of fit of the model [R2], predictive component [p1], the first orthogonal component [o1]. Based on the OPLS-DA, we selected specific gyrification patterns that characterized the differences between MDD and HC groups with variable importance in projection (VIP) score of >1.5 (45). A VIP score is a measure of a variable’s importance in the PLS-DA model. It summarizes the contribution of a variable to the model. The VIP score of a variable is calculated as a weighted sum of the squared correlations between the PLS-DA components and original variable. In conjunction with the VIP score, we calculated p-value for differences in gyrification patterns between MDD and HC groups using Welch’s t-test and multiple regression analysis adjusted for age and sex. Multiple regression analysis was then performed on the selected gyrification patterns to examine their association with BDNF level and HAM-D. In addition, we used multiple regression analysis to test the interaction between groups and BDNF level.
The distributions of all data were confirmed using histograms and expressed as mean (standard deviation) or median [interquartile range]. In the multiple regression analysis, the normality of residuals was checked to confirm the model’s validity. Missing data were excluded from the analysis. The test was two-tailed, with a p-value of <0.05 set as statistically significant. For correlation analyses, Bonferroni corrections were performed for those that reached statistical significance.
This study was conducted in accordance with the principles of the Declaration of Helsinki, and the relevant Ethics Committee approved the protocol. Informed consent was obtained from all participants, and we assigned each patient an arbitrary identification number to protect their privacy.
Demographic and clinical characteristics are shown in Table 1. Differences in age and sex were observed.
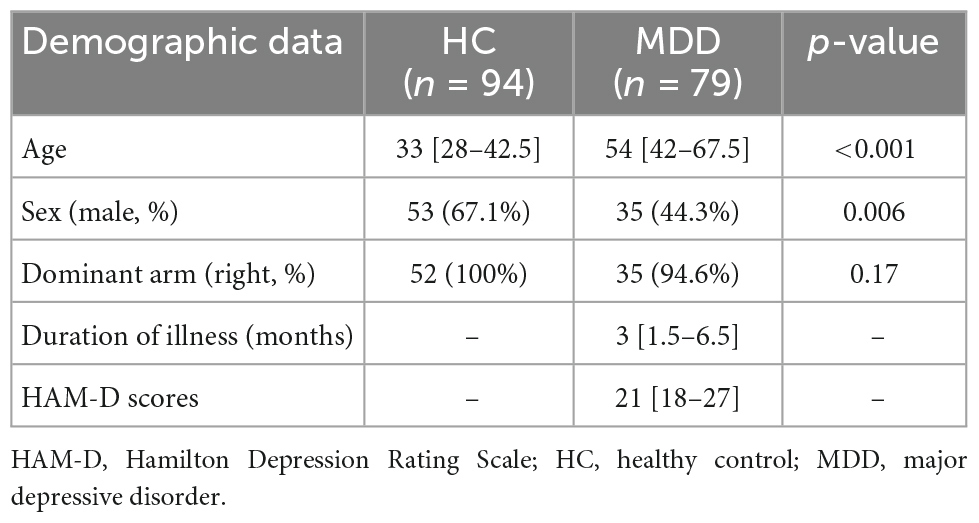
Table 1. Demographic and clinical characteristics data.
LGIs in MDD and HC groups are shown in Figure 1 and Supplementary Table 1; 108 (71.0%) of the 152 LGIs measured in this study were MDD < HC.
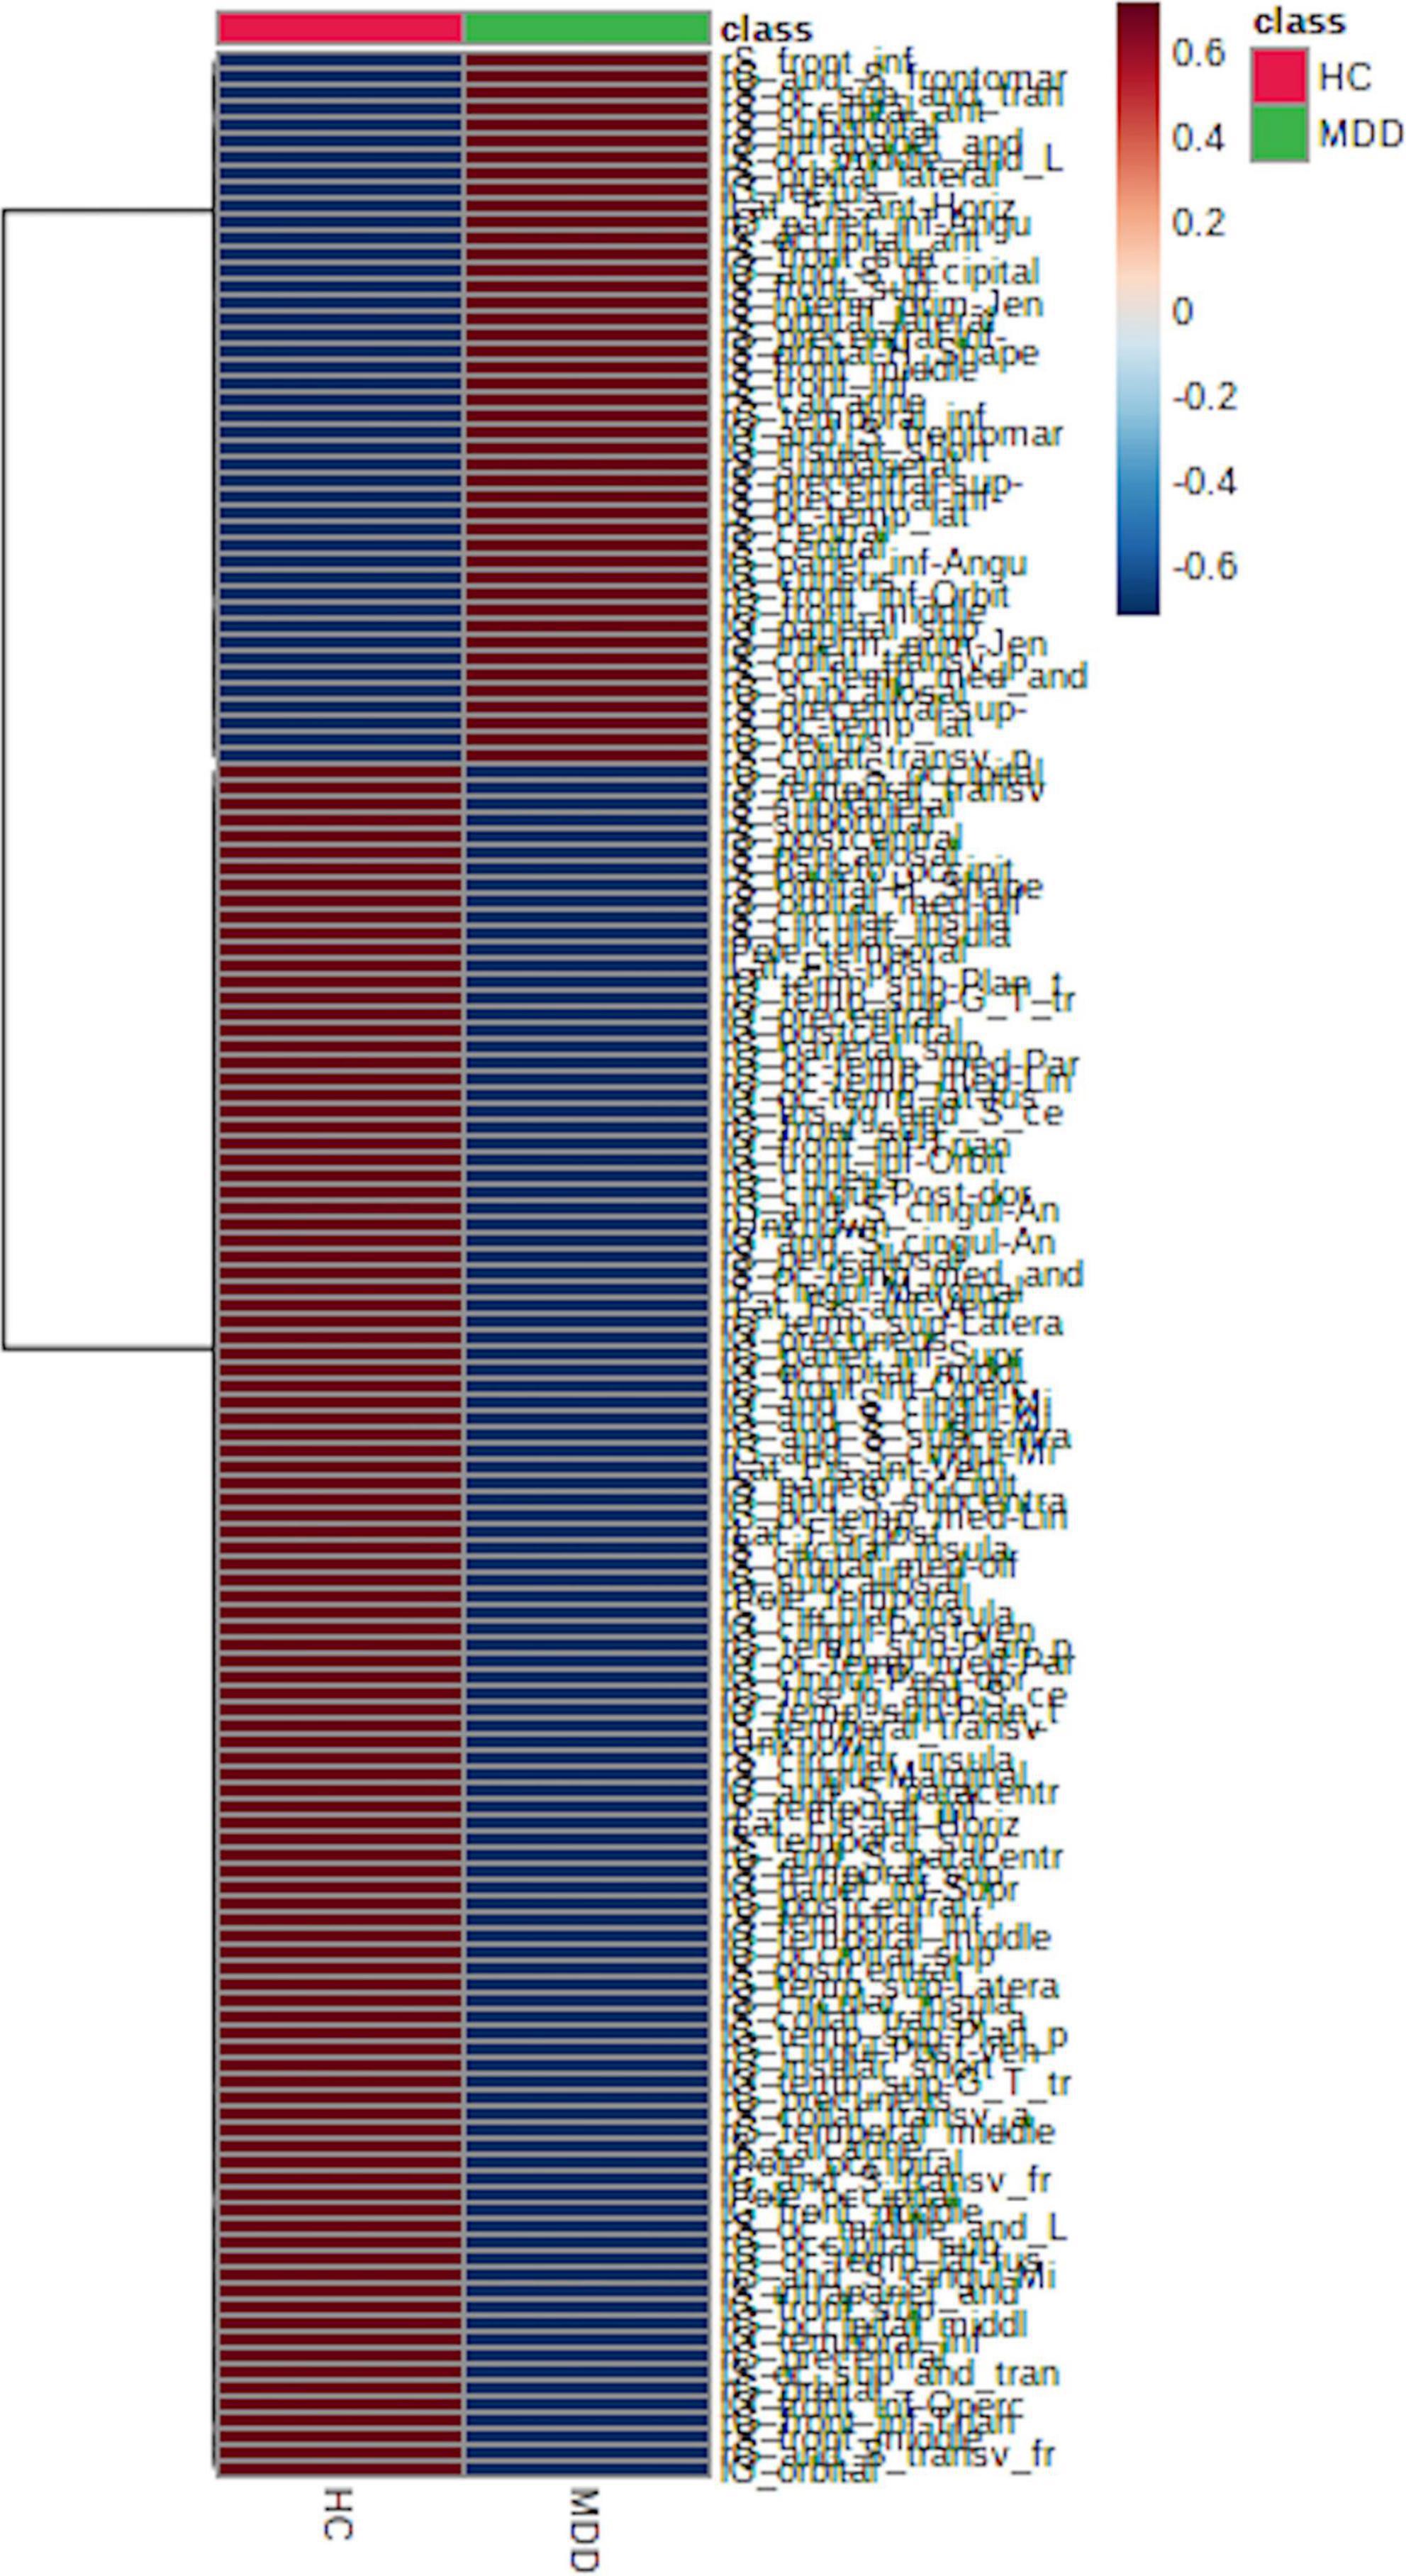
Figure 1. Local gyrification index (LGI) between major depressive disorder (MDD) and healthy control (HC) groups. We found that 108 (approximately 71%) of the 152 LGIs were MDD < HC, which supports a decrease in LGIs in patients with MDD.
The median plasma BDNF level in the MDD group was 5.0 ng/mL [2.65–7.95], while the median in the HC group was 3.8 ng/mL [2.12–8.25]. There was no significant difference in plasma BDNF levels between the two groups (p = 0.35).
We evaluated all LGIs using PCA and created two-dimensional plots for the first and second principal components. PCA separated MDD and HC groups by the first main component, as shown in Figure 2.
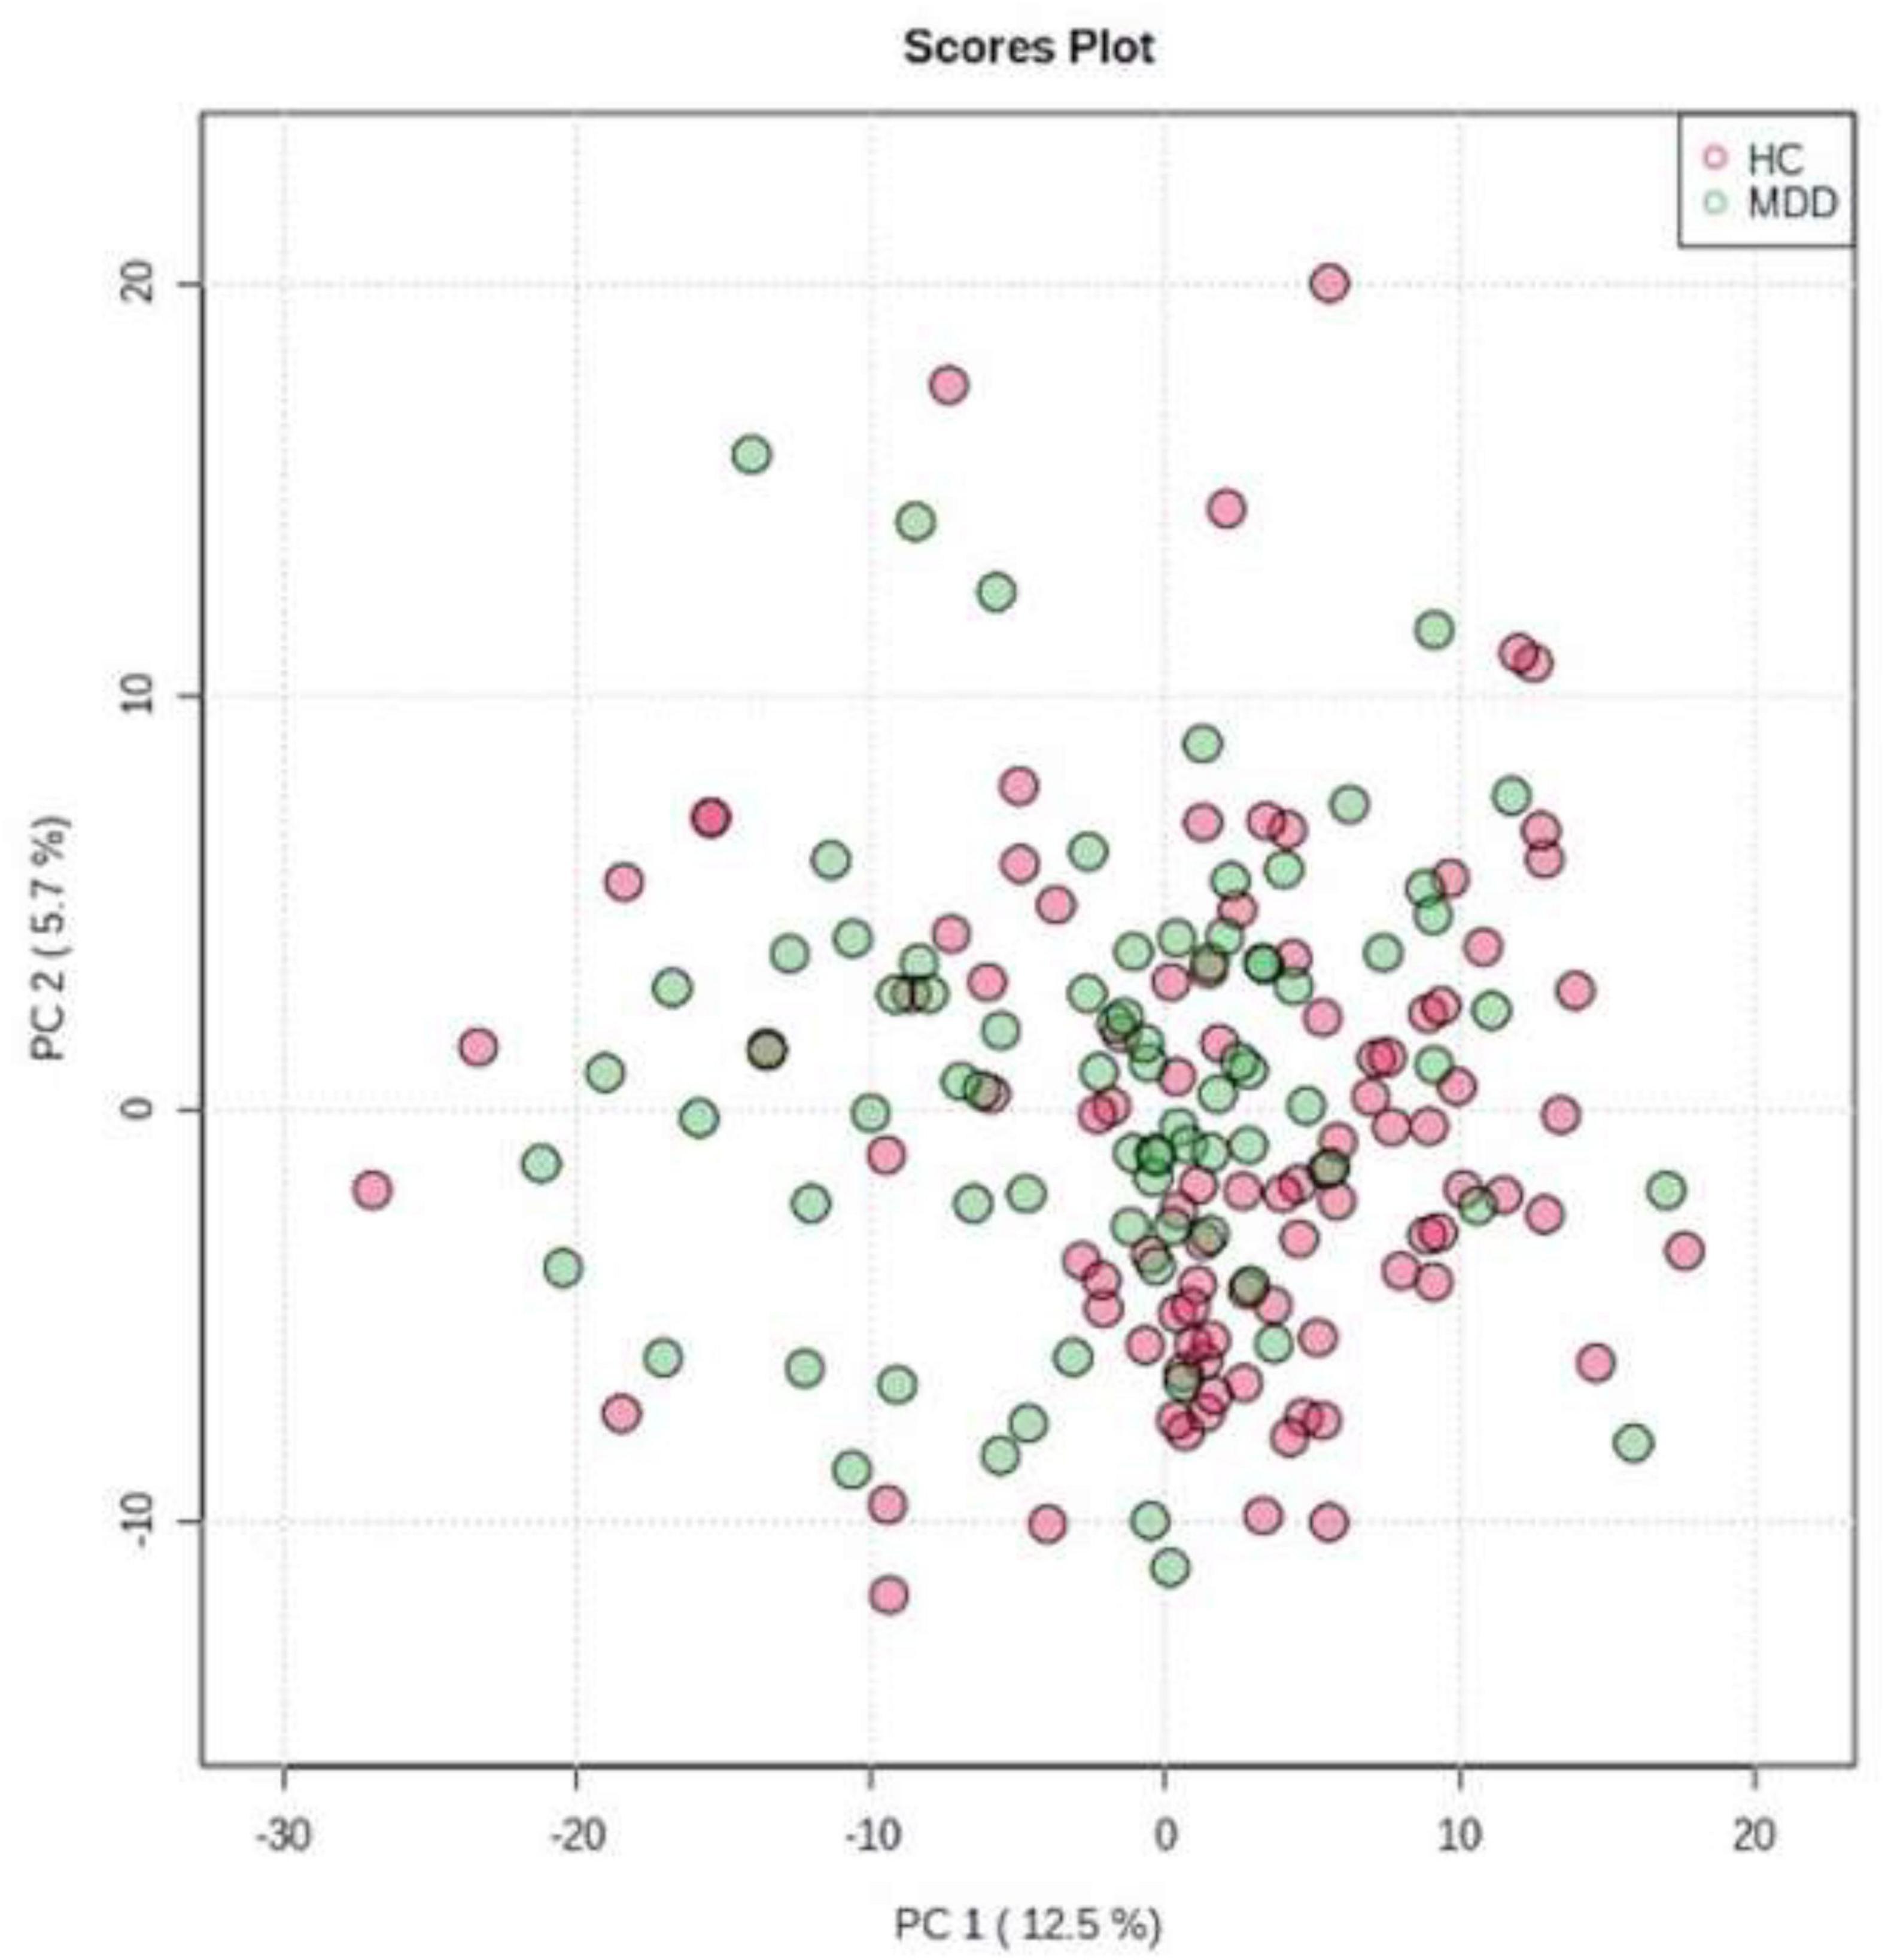
Figure 2. Principal component analysis (PCA). We evaluated all LGIs using PCA and created two-dimensional plots for the first and second principal components.
To obtain further separation, we evaluated all LGIs using OPLS-DA and created two-dimensional plots. OPLS-DA showed a relatively clear separation from PCA between MDD and HC groups by the first principal component (Figure 3). OPLS model overview was as follows: p1 (R2X: 0.035, R2Y: 0.195, Q2: 0.019); o1(R2X: 0.142, R2Y: 0.238, Q2: −0.0307).
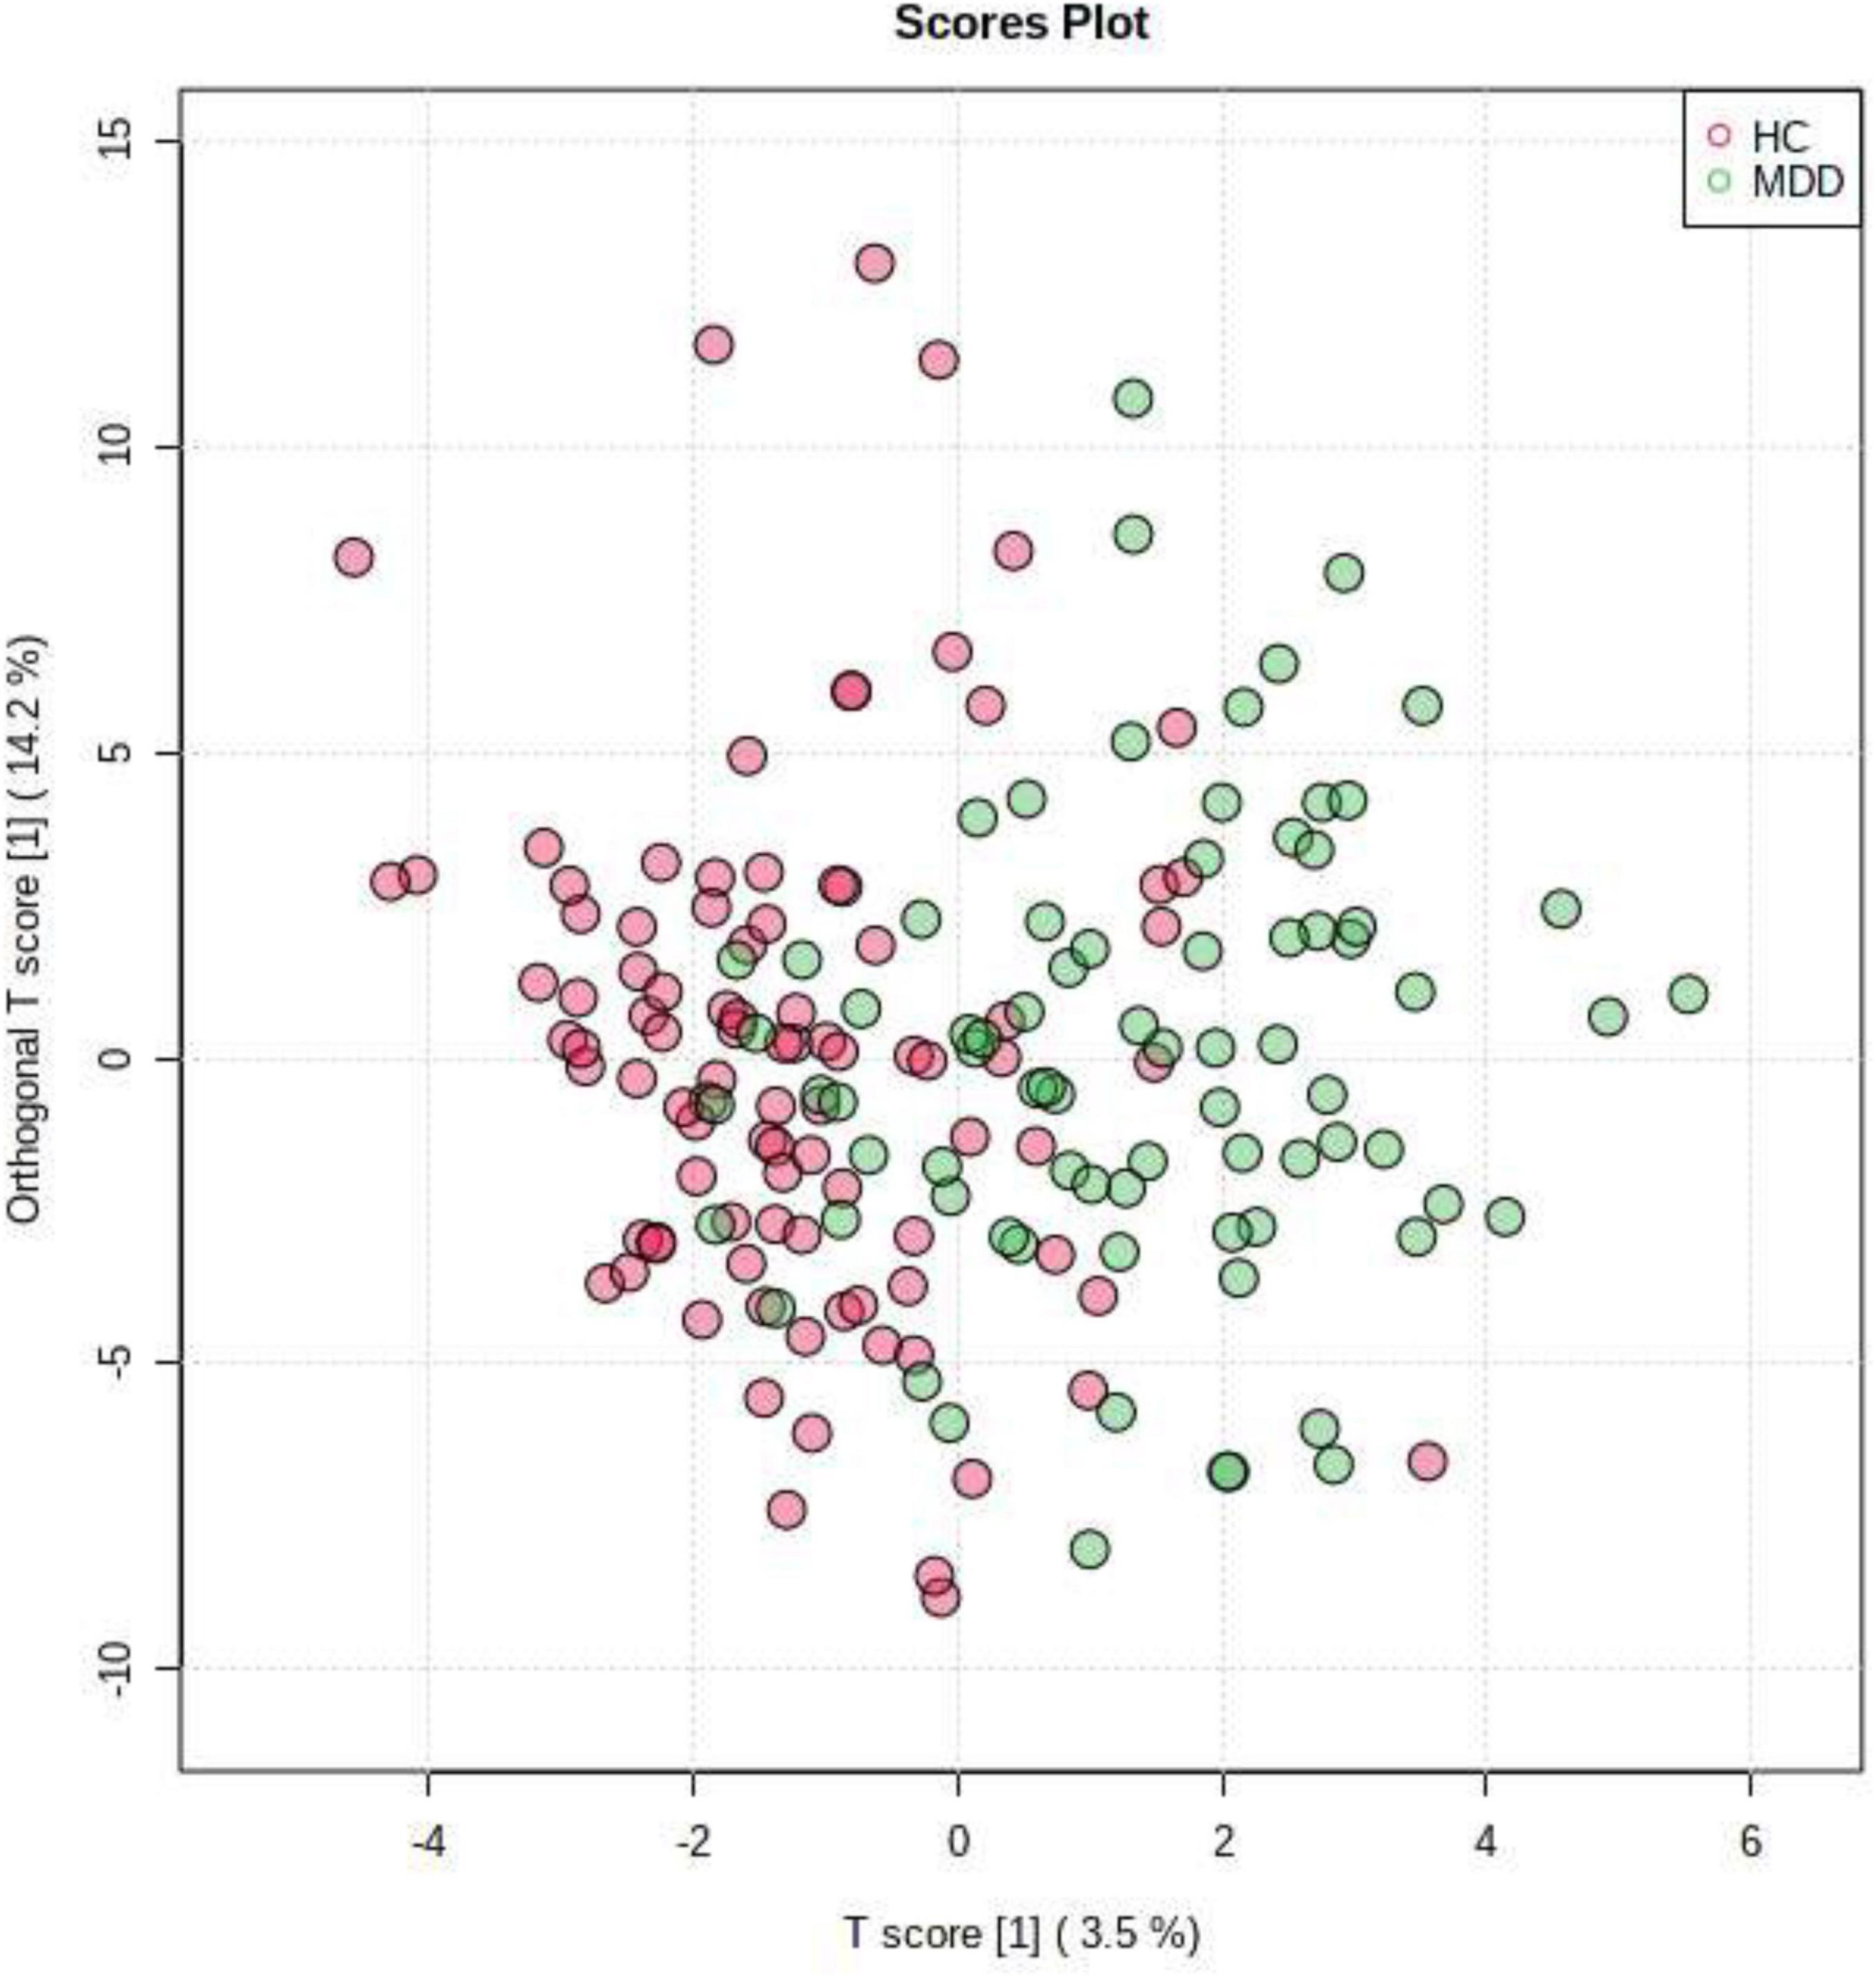
Figure 3. Orthogonal partial least squares discriminant analysis (OPLS-DA). OPLS-DA showed a relatively clear separation from PCA between patients in MDD group and HC group by the first principal component.
Variable importance in projection scores were extracted from this model (45). Essential features of differentially expressed LGIs were defined as VIP > 1.5. Differentially expressed LGIs in MDD and HC groups are shown in Figure 4 and Table 2. We finally detected 10 differentially expressed LGIs (VIP > 1.5 and p-value adjusted for age and sex < 0.05) between HC and MDD (i.e., rS_circular_insula_inf, lUnknown, lS_circular_insula_inf, rUnknown, lG_oc-temp_med-Parahip, lG_temp_sup-Plan_polar, rG_oc-temp_med-Parahip, rG_temp _sup-Plan_polar, lG_cingul-Post-ventral, and rG_insular_ short).
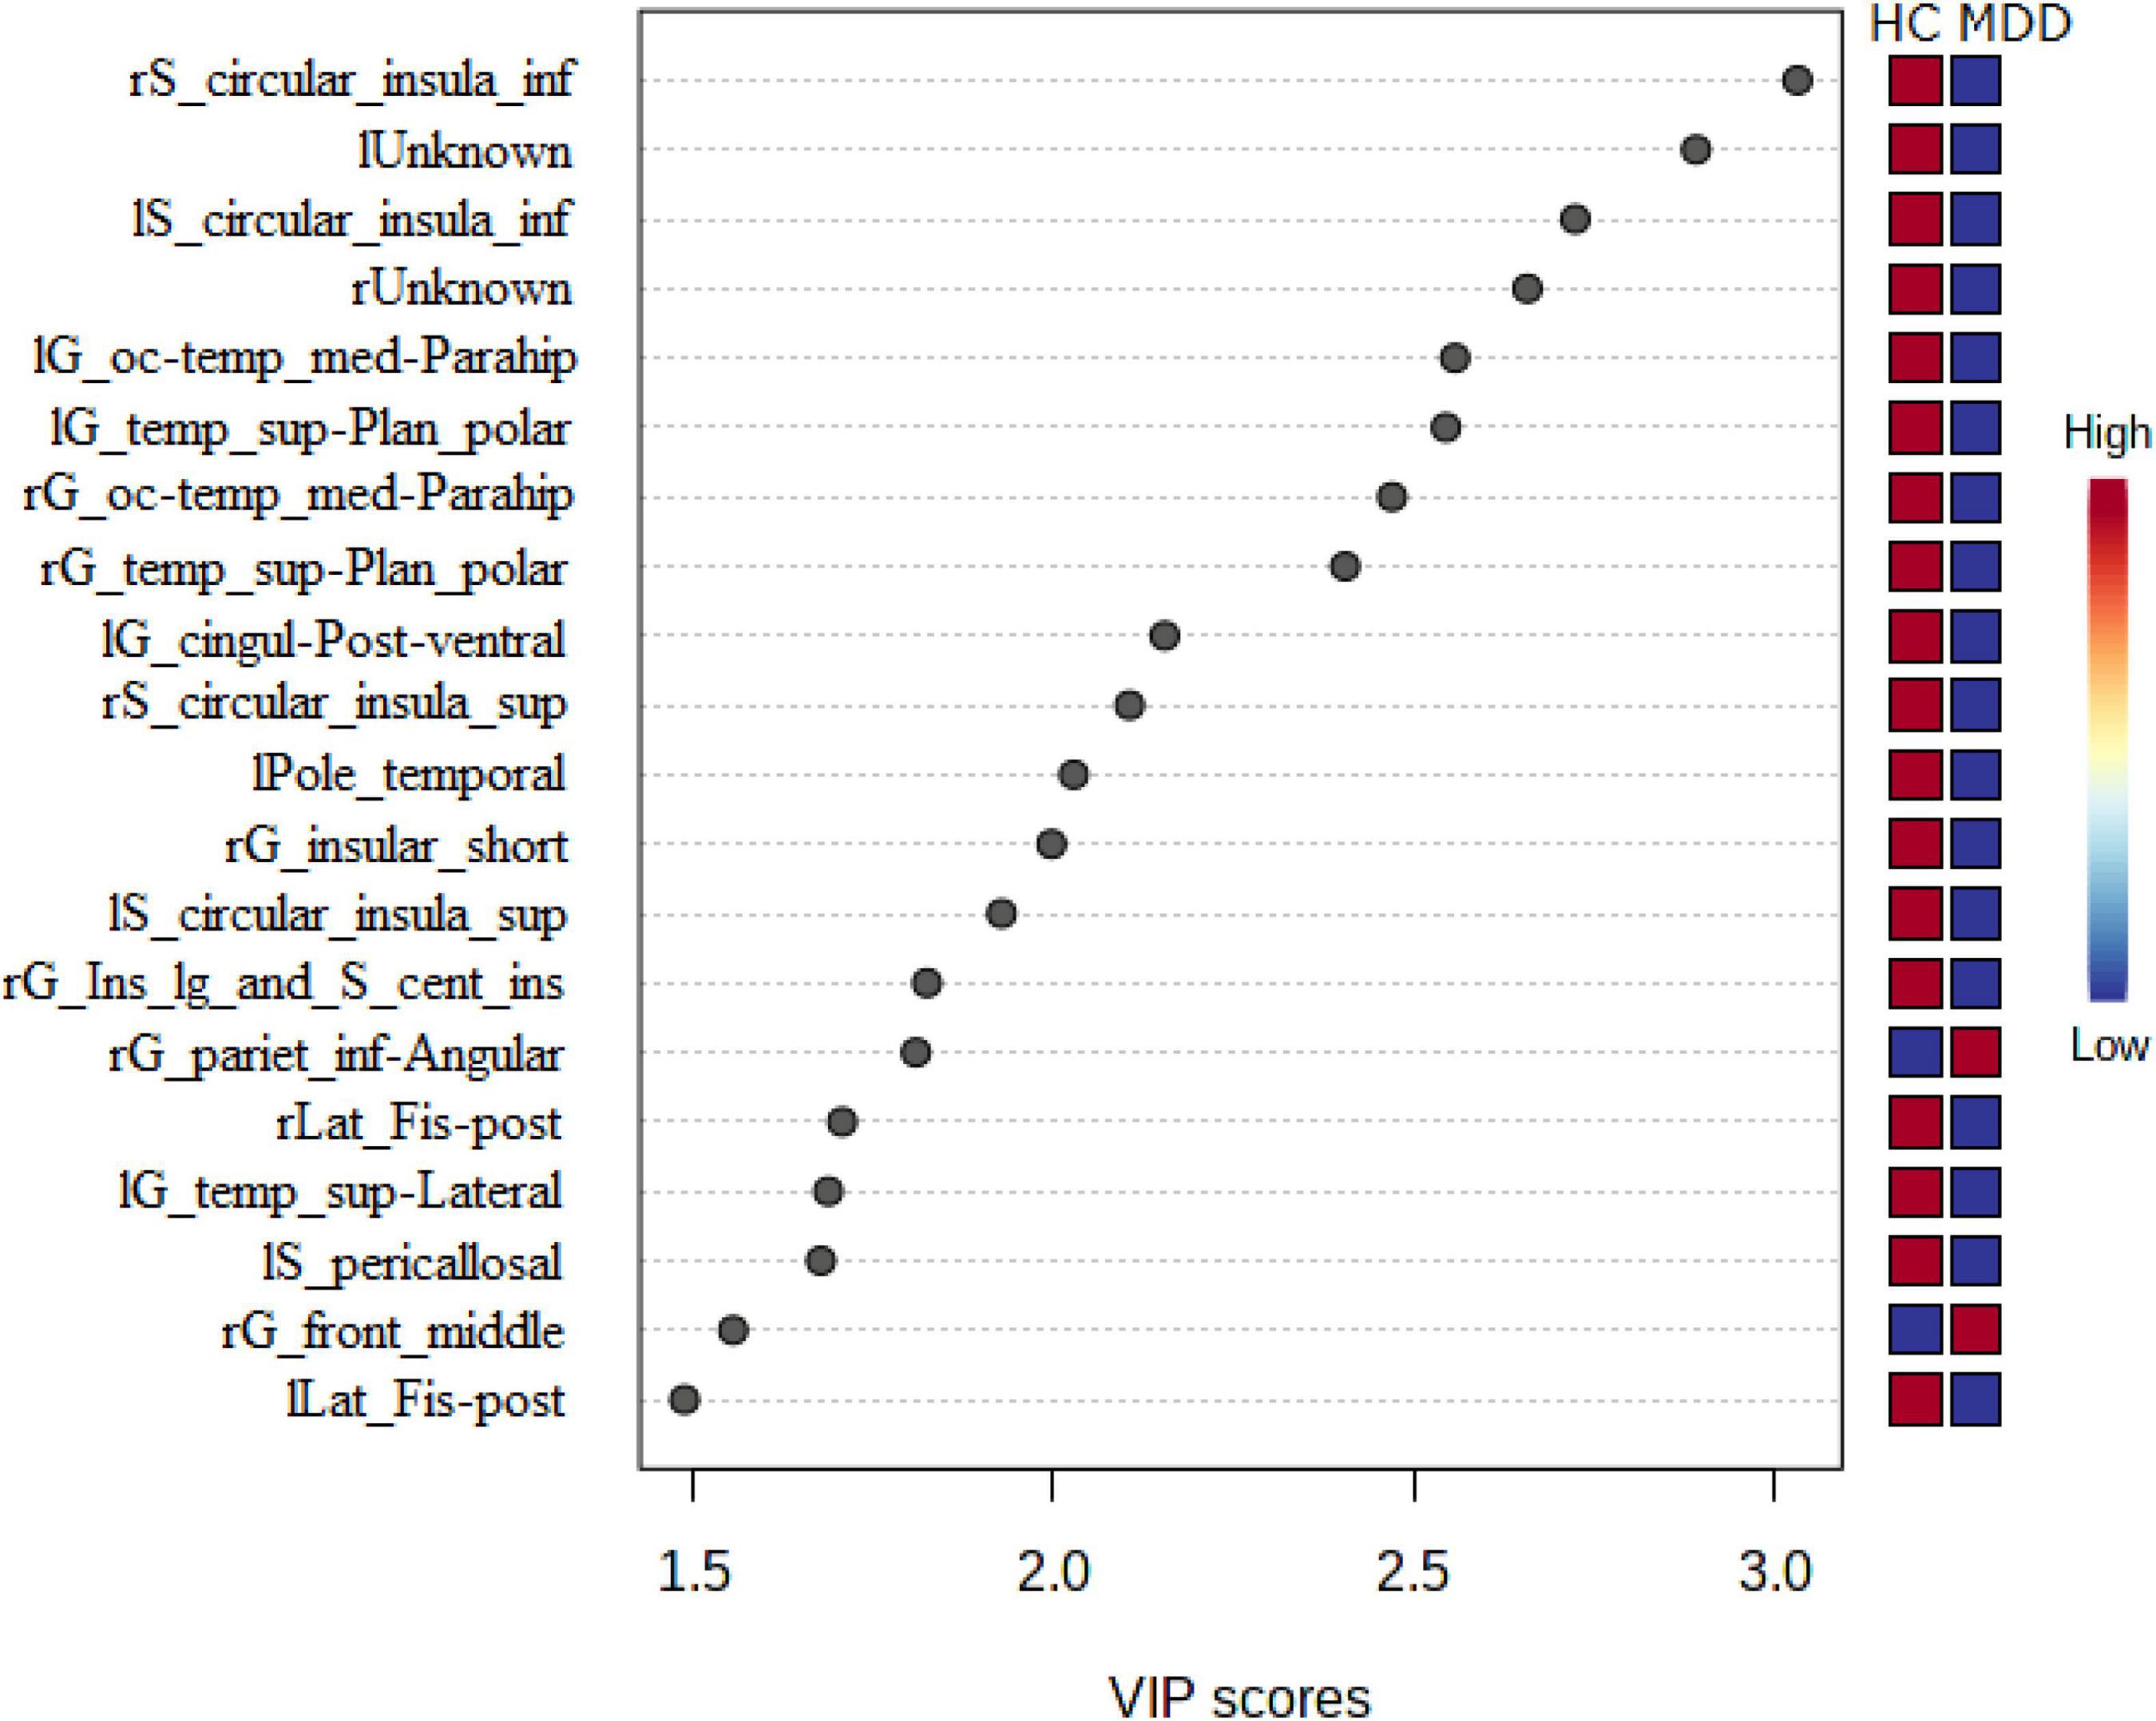
Figure 4. Relationship between expressed LGIs in MDD and HC groups. We showed the 20 significant features of differently expressed LGIs (VIP > 1.5) in MDD and HC groups. “l” and “r” attached to the beginning of the word mean “left” and “right”.
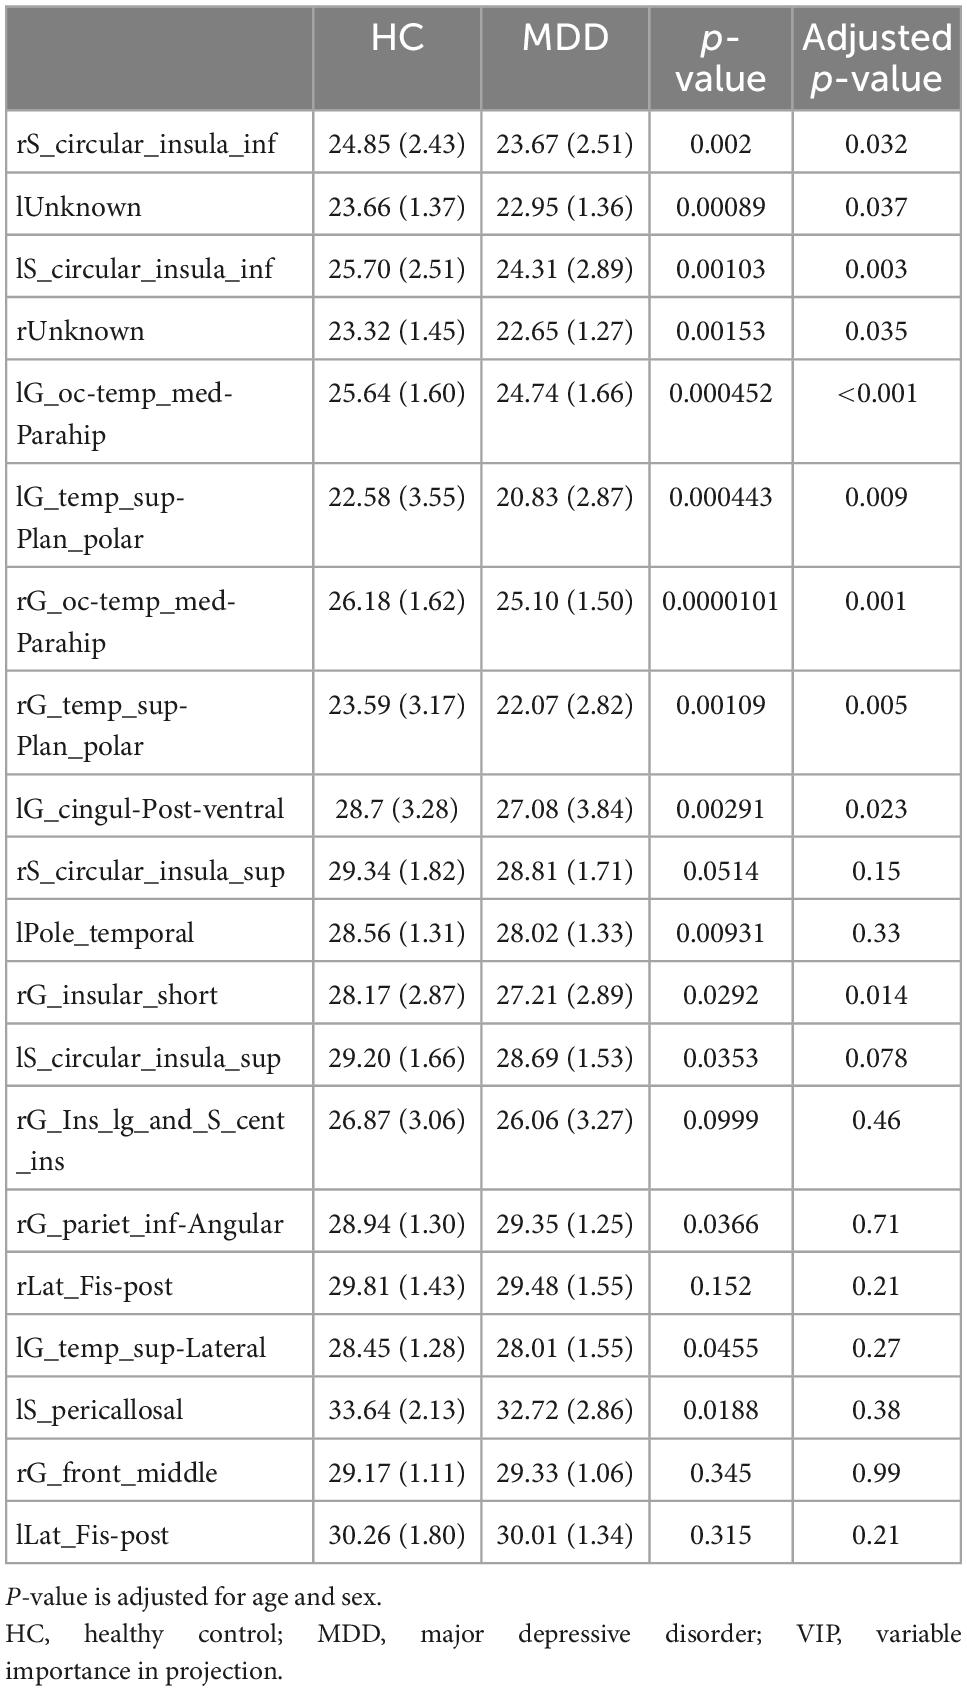
Table 2. Top 20 gyrification patterns (VIP > 1.5) in major depressive disorder (MDD) and healthy control (HC) groups.
We showed the relationship between differentially expressed LGIs and plasma BDNF levels in HCs (see Supplementary Table 2) and patients with MDD (see Supplementary Table 3). We examined the correlation between plasma BDNF levels and 10 differentially expressed LGIs (VIP > 1.5 and p-value adjusted for age and sex < 0.05) using age and sex as confounding factors. However, we found no significant correlation between the LGIs and plasma BDNF at any location. In addition, BDNF showed no significant interaction between MDD and HC groups for the 10 LGIs (see Supplementary Table 4).
We also examined the top 10 LGIs (VIP > 1.5 and p-value adjusted for age and sex < 0.05) and psychiatric symptoms using these top features. We found a statistically significant correlation between rG_temp_sup-Plan_polar and HAM-D (standard partial regression coefficient = 0.238, p = 0.049); however, no significant correlations were observed between LGI and HAM-D total scores after Bonferroni correction (p = 0.49) (see Supplementary Table 5).
This study provides evidence of cortical gyrification pattern differences between first-episode, drug-naïve MDD patients and HCs. In this study, we found that 108 (71.0%) of the 152 total LGIs were MDD < HC. We then identified 10 disease-differentiating factors based on critical LGIs features (VIP > 1.5 and p-value adjusted for age and sex < 0.05), but found no significant correlation between LGIs and plasma BDNF level at any location. In addition, BDNF level showed no significant interaction between MDD and HC groups for the 10 determined LGIs.
Several previous studies have reported altered LGI in patients with MDD compared to HCs, including decreased LGI in the bilateral precuneus (23), bilateral mid-posterior cingulate, insula, orbital frontal cortices (orbitofrontal cortex), left anterior cingulate cortex (right anterior cingulate gyrus cortex), right temporal operculum (27), left lingual gyrus (left lingual corpuscle), right posterior superior temporal sulcus (right superior temporal sulcus) (29) and precuneus, superior parietal gyrus, parahippocampal gyrus, middle frontal gyrus, and fusiform and right fusiform gyrus (46). There are also several reports supporting increased LGI in patients with MDD, including increased LGI in the frontal, cingulate, parietal, temporal, and occipital regions (9); right rostral anterior cingulate cortex and medial orbitofrontal cortex; frontal pole (28); left anterior cingulate; right precentral, supramarginal region; and left superior frontal gyrus (47). However, in this study, we found that 108 (71.0%) of the 152 LGIs were MDD < HC, supporting previous findings of a decreased LGI in patients with MDD.
Some studies have reported associations between cortical gyrification patterns and BDNF level. Cortical gyrification refers to the forming process of cerebral cortex folds. During the third trimester, the brain develops from a relatively smooth erect brain structure to one that more closely resembles adult brain morphology. LGI, a measure of the degree of cortical folding, increases dramatically during the third trimester of pregnancy but remains relatively constant throughout the rest of development (48). LGI peaks by age 2 and then gradually decreases with increasing age (15, 49). One study prospectively followed patients with bipolar disorder for 4 years and found that those with one or more BDNF Met alleles, indicating that decreased BDNF secretion produced a more significant reduction in LGI (36). Besides, the neuroplasticity in brain formation—including cortical gyrification in fetal sheep—is more critical in brain regions rich in BDNF expression (50).
Astrogenesis, gliogenesis, and angiogenesis may also be related to cortical gyrification. A recent study reported that localized astrogenesis plays an important role in gyrus formation in the gyrencephalic cerebral cortex. In functional genetic experiments using ferrets, reducing astrocyte numbers prevents gyrus formation in the cortex. Meanwhile, increasing astrocyte numbers in mice, which do not have cortical folds, can induce gyrus-like protrusions (51). Gliogenesis is also involved in the gyrification of the primate cerebrum (52). In summary, astrocytes—one of the microglia—might play a role in cortical gyrification. Fibroblast growth factor 2, which is a member of a large family of proteins that bind heparin and heparan sulfate and modulate the function of a wide range of cell types, stimulates the growth and development of angiogenesis, thus contributing to the pathogenesis of several diseases including atherosclerosis, and is associated with cortical gyrification in the mouse brain (53). Taken together, astrogenesis, gliogenesis, and angiogenesis, whereas, neurogenesis might be associated with cortical gyrification in the brain.
Microglial activation plays a role in maintaining the delicate balance of BDNF release into neuronal synapses (54). Thus, BDNF secretion is considered to be influenced by astrocytes and glia, which might influence cortical gyrification. We did not, however, find an association between plasma BDNF level and LGI in this study. Therefore, plasma BDNF level may be independent of cortical gyrification. Additionally, it is controversial that plasma BDNF level reflects BDNF dynamics in the brain. These findings indicate that the association between cortical gyrification and BDNF level must still be further elucidated.
In addition, we focused on the association between gyrification patterns and depression severity. One study adjusted for age, sex, education level, and total cortical surface area reported positive correlations between LGI in the left caudal middle frontal cortex and Beck Depression Inventory scores (47). Another recent study examined correlations between the HAM-D and LGI in 22 cortical regions of patients with MDD but found no significance in the field (28). Yet another previous study reported an inverse correlation between LGI and HAM-D scores in the right inferior parietal, right postcentral, and left superior parietal lobes of patients with MDD (9). We also assessed the correlation between the top 10 gyrification patterns and psychiatric symptoms; however, we found no statistically significant correlations between LGI and HAM-D total scores.
This study had several limitations. First, the number of participants was small, and the age and sex distributions of the two groups were significantly different—a typical limitation of clinical research. In addition, we did not include education level or dominant arm in the analysis because of missing data. This may have resulted in insufficient statistical power to confirm our hypothesis. However, these differences in age and educational level may be somewhat acceptable considering that LGI peaks by age 2 and then remains relatively constant throughout one’s life. In addition, we also statistically calculated age and sex-adjusted p-value. Due to the limited sample size, the statistical analysis also had several limitations. We could not replicate the results to determine the validity of the outcome. However, a priori dimensionality reduction techniques such as PCA and OPLS-DA were used to refine the variables in examining differences in gyration patterns between the MDD and HC groups, thus increasing the accuracy of the analysis. Another point to consider is that we conducted this study using a one-point cross-sectional method. Thus, whether there were any changes in LGI during the progression of MDD was not fully elucidated. Therefore, a longitudinal study is warranted in the future.
Predicated on previous publications, this is not the first study that investigated differences in cortical gyrification patterns between MDD and HC groups. The present study observed several gyrification patterns that cause differences in the disease predicated on essential features of and VIP scores and adjusted p-value. Of the 152 LGIs measured in this study, 108 were MDD < HC. Future large-scale studies with more participants would help to clarify the relationship between gyrification patterns and psychiatric symptoms.
The raw data supporting the conclusions of this article will be made available by the authors, without undue reservation.
The studies involving human participants were reviewed and approved by the Ethical Committee of University of Occupational and Environmental Health, Japan. The patients/participants provided their written informed consent to participate in this study.
TN, NO, KW, and RY conceived and designed the experiments. TN, NO, EC, HT, KW, and RY performed the experiments. TN, NO, EC, and KW analyzed the data. TN, NO, KW, EC, and RY composed the manuscript. TN, NO, EC, KW, HT, GH, AI, SK, and RY provided expertise and edited the manuscript. All authors read the manuscript and were solely and jointly responsible for its content.
We thank Ms. Tomomi Ishiba for her help with blood sampling.
The authors declare that the research was conducted in the absence of any commercial or financial relationships that could be construed as a potential conflict of interest.
All claims expressed in this article are solely those of the authors and do not necessarily represent those of their affiliated organizations, or those of the publisher, the editors and the reviewers. Any product that may be evaluated in this article, or claim that may be made by its manufacturer, is not guaranteed or endorsed by the publisher.
The Supplementary Material for this article can be found online at: https://www.frontiersin.org/articles/10.3389/fpsyt.2022.1031386/full#supplementary-material
BDNF, brain-derived neurotrophic factor; DSM-5, Diagnostic and Statistical Manual for Mental Disorders-5; HAM-D, Hamilton Depression Rating Scale; HC(s), healthy control(s); LGI(s), local gyrification index (indices); MDD, major depressive disorder; MRI, magnetic resonance imaging; OPLS-DA, orthogonal partial least squares discriminant analysis; PLS-DA, partial least squares discriminant analysis; VIP, variable importance in projection.
1. GBD 2017 Disease and Injury Incidence and Prevalence Collaborators. Global, regional, and national incidence, prevalence, and years lived with disability for 354 diseases and injuries for 195 countries and territories, 1990-2017: a systematic analysis for the Global Burden of Disease Study 2017. Lancet. (2018) 392:1789–858. doi: 10.1016/S0140-6736(18)32279-7
2. Alsalman R, Alansari B. Relationship of suicide ideation with depression and hopelessness. Eur Psychiatry. (2020) 33:S597. doi: 10.1016/j.eurpsy.2016.01.2228
3. Wulsin L, Vaillant G, Wells V. A systematic review of the mortality of depression. Psychosom Med. (1999) 61:6–17. doi: 10.1097/00006842-199901000-00003
4. Clarke D, Currie K. Depression, anxiety and their relationship with chronic diseases: a review of the epidemiology, risk and treatment evidence. Med J Aust. (2009) 190:S54–60. doi: 10.5694/j.1326-5377.2009.tb02471.x
5. Mathers C, Loncar D. Projections of global mortality and burden of disease from 2002 to 2030. PLoS Med. (2006) 3:e442. doi: 10.1371/journal.pmed.0030442
6. Lin J, Chen T, He J, Chung R, Ma H, Tsang H. Impacts of acupressure treatment on depression: a systematic review and meta-analysis. World J Psychiatry. (2022) 12:169–86. doi: 10.5498/wjp.v12.i1.169
8. Levy M, Boulle F, Steinbusch H, van den Hove D, Kenis G, Lanfumey L. Neurotrophic factors and neuroplasticity pathways in the pathophysiology and treatment of depression. Psychopharmacology. (2018) 235:2195–220. doi: 10.1007/s00213-018-4950-4
9. Schmitgen M, Depping M, Bach C, Wolf N, Kubera K, Vasic N, et al. Aberrant cortical neurodevelopment in major depressive disorder. J Affect Disord. (2019) 243:340–7. doi: 10.1016/j.jad.2018.09.021
10. Zilles K, Armstrong E, Schleicher A, Kretschmann H. The human pattern of gyrification in the cerebral cortex. Anat Embryol. (1988) 179:173–9. doi: 10.1007/BF00304699
11. Zilles K, Palomero-Gallagher N, Amunts K. Development of cortical folding during evolution and ontogeny. Trends Neurosci. (2013) 36:275–84. doi: 10.1016/j.tins.2013.01.006
12. Schaer M, Cuadra M, Schmansky N, Fischl B, Thiran J, Eliez S. How to measure cortical folding from MR images: a step-by-step tutorial to compute local gyrification index. J Vis Exp. (2012) 59:e3417. doi: 10.3791/3417
13. Peng D, Shi F, Li G, Fralick D, Shen T, Qiu M, et al. Surface vulnerability of cerebral cortex to major depressive disorder. PLoS One. (2015) 10:e0120704. doi: 10.1371/journal.pone.0120704
14. Li G, Nie J, Wang L, Shi F, Lin W, Gilmore J, et al. Mapping region-specific longitudinal cortical surface expansion from birth to 2 years of age. Cereb Cortex. (2013) 23:2724–33. doi: 10.1093/cercor/bhs265
15. Li G, Wang L, Shi F, Lyall A, Lin W, Gilmore J, et al. Mapping longitudinal development of local cortical gyrification in infants from birth to 2 years of age. J Neurosci. (2014) 34:4228–38. doi: 10.1523/JNEUROSCI.3976-13.2014
16. Casanova M, Tillquist C. Encephalization, emergent properties, and psychiatry: a minicolumnar perspective. Neuroscientist. (2008) 14:101–18. doi: 10.1177/1073858407309091
17. Pontious A, Kowalczyk T, Englund C, Hevner R. Role of intermediate progenitor cells in cerebral cortex development. Dev Neurosci. (2008) 30:24–32. doi: 10.1159/000109848
18. la Fougère C, Grant S, Kostikov A, Schirrmacher R, Gravel P, Schipper H, et al. Where in-vivo imaging meets cytoarchitectonics: the relationship between cortical thickness and neuronal density measured with high-resolution [18F]flumazenil-PET. Neuroimage. (2011) 56:951–60. doi: 10.1016/j.neuroimage.2010.11.015
19. Sasabayashi D, Takayanagi Y, Takahashi T, Nemoto K, Furuichi A, Kido M, et al. Increased brain gyrification in the schizophrenia spectrum. Psychiatry Clin Neurosci. (2020) 74:70–6. doi: 10.1111/pcn.12939
20. Li Q, Zhao Y, Chen Z, Long J, Dai J, Huang X, et al. Meta-analysis of cortical thickness abnormalities in medication-free patients with major depressive disorder. Neuropsychopharmacology. (2020) 45:703–12. doi: 10.1038/s41386-019-0563-9
21. Schmaal L, Hibar D, Sämann P, Hall G, Baune B, Jahanshad N, et al. Cortical abnormalities in adults and adolescents with major depression based on brain scans from 20 cohorts worldwide in the ENIGMA Major Depressive Disorder Working Group. Mol Psychiatry. (2017) 22:900–9. doi: 10.1038/mp.2016.60
22. Kaiser R, Andrews-Hanna J, Wager T, Pizzagalli D. Large-scale network dysfunction in major depressive disorder: a meta-analysis of resting-state functional connectivity. JAMA Psychiatry. (2015) 72:603–11. doi: 10.1001/jamapsychiatry.2015.0071
23. Chen C, Liu Z, Xi C, Tan W, Fan Z, Cheng Y, et al. Multimetric structural covariance in first-episode major depressive disorder: a graph theoretical analysis. J Psychiatry Neurosci. (2022) 47:E176–85. doi: 10.1503/jpn.210204
24. Mulders P, van Eijndhoven P, Schene A, Beckmann C, Tendolkar I. Resting-state functional connectivity in major depressive disorder: a review. Neurosci Biobehav Rev. (2015) 56:330–44. doi: 10.1016/j.neubiorev.2015.07.014
25. Petanjek Z, Judas M, Kostović I, Uylings H. Lifespan alterations of basal dendritic trees of pyramidal neurons in the human prefrontal cortex: a layer-specific pattern. Cereb Cortex. (2008) 18:915–29. doi: 10.1093/cercor/bhm124
26. Petanjek Z, Judaš M, Šimic G, Rasin M, Uylings H, Rakic P, et al. Extraordinary neoteny of synaptic spines in the human prefrontal cortex. Proc Natl Acad Sci USA. (2011) 108:13281–6. doi: 10.1073/pnas.1105108108
27. Zhang Y, Yu C, Zhou Y, Li K, Li C, Jiang T. Decreased gyrification in major depressive disorder. Neuroreport. (2009) 20:378–80. doi: 10.1097/WNR.0b013e3283249b34
28. Han K, Won E, Kang J, Kim A, Yoon H, Chang H, et al. Local gyrification index in patients with major depressive disorder and its association with tryptophan hydroxylase-2 (TPH2) polymorphism. Hum Brain Mapp. (2017) 38:1299–310. doi: 10.1002/hbm.23455
29. Long J, Xu J, Wang X, Li J, Rao S, Wu H, et al. Altered local gyrification index and corresponding functional connectivity in medication free major depressive disorder. Front Psychiatry. (2020) 11:585401. doi: 10.3389/fpsyt.2020.585401
30. Kowiański P, Lietzau G, Czuba E, Waśkow M, Steliga A, Moryś JBDNF. A Key Factor with Multipotent Impact on Brain Signaling and Synaptic Plasticity. Cell Mol Neurobiol. (2018) 38:579–93. doi: 10.1007/s10571-017-0510-4
31. Sen S, Duman R, Sanacora G. Serum brain-derived neurotrophic factor, depression, and antidepressant medications: meta-analyses and implications. Biol Psychiatry. (2008) 64:527–32. doi: 10.1016/j.biopsych.2008.05.005
32. Brunoni A, Lopes M, Fregni F. A systematic review and meta-analysis of clinical studies on major depression and BDNF levels: implications for the role of neuroplasticity in depression. Int J Neuropsychopharmacol. (2008) 11:1169–80. doi: 10.1017/S1461145708009309
33. Bocchio-Chiavetto L, Bagnardi V, Zanardini R, Molteni R, Nielsen M, Placentino A, et al. Serum and plasma BDNF levels in major depression: a replication study and meta-analyses. World J Biol Psychiatry. (2010) 11:763–73. doi: 10.3109/15622971003611319
34. Yoshimura R, Kishi T, Atake K, Katsuki A, Iwata N. Serum brain-derived neurotrophic factor, and plasma catecholamine metabolites in people with major depression: preliminary cross-sectional study. Front Psychiatry. (2018) 9:52. doi: 10.3389/fpsyt.2018.00052
35. Kishi T, Yoshimura R, Ikuta T, Iwata N. Brain-derived neurotrophic factor, and major depressive disorder: evidence from meta-analyses. Front Psychiatry. (2018) 8:308. doi: 10.3389/fpsyt.2017.00308
36. Mirakhur A, Moorhead T, Stanfield A, McKirdy J, Sussmann J, Hall J, et al. Changes in gyrification over 4 years in bipolar disorder and their association with the brain-derived neurotrophic factor valine(66) methionine variant. Biol Psychiatry. (2009) 66:293–7. doi: 10.1016/j.biopsych.2008.12.006
37. Raznahan A, Toro R, Proitsi P, Powell J, Paus T, Bolton P, et al. A functional polymorphism of the brain derived neurotrophic factor gene and cortical anatomy in autism spectrum disorder. J Neurodev Disord. (2009) 1:215–23. doi: 10.1007/s11689-009-9012-0
38. American Psychiatric Association. Diagnostic and Statistical Manual of Mental Disorders. 5th Edn. Washington, DC: American Psychiatric Association (2013).
39. Fujii R, Watanabe K, Okamoto N, Natsuyama T, Tesen H, Igata R, et al. Hippocampal volume and plasma brain-derived neurotrophic factor levels in patients with depression and healthy controls. Front Mol Neurosci. (2022) 15:857293. doi: 10.3389/fnmol.2022.857293
40. Tesen H, Watanabe K, Okamoto N, Ikenouchi A, Igata R, Konishi Y, et al. Volume of amygdala subregions and clinical manifestations in patients with first-episode, drug-naïve major depression. Front Hum Neurosci. (2022) 15:780884. doi: 10.3389/fnhum.2021.780884
41. Hamilton M. A rating scale for depression. J Neurol Neurosurg Psychiatry. (1960) 23:56–62. doi: 10.1136/jnnp.23.1.56
42. Depression Rating Scale Standardization Team [DRSST]. GRID-HAMD-17, GRID-HAMD-21: Structured Interview Guide. San Diego, CA: International Society for CNS Drug Development (2003).
43. Fischl B, van der Kouwe A, Destrieux C, Halgren E, Ségonne F, Salat D, et al. Automatically parcellating the human cerebral cortex. Cereb Cortex. (2004) 14:11–22. doi: 10.1093/cercor/bhg087
44. Trygg J, Wold S. Orthogonal projections to latent structures (O-PLS). J Chemometr. (2002) 16:119–28. doi: 10.1002/cem.695
45. Yang J, Chen T, Sun L, Zhao Z, Qi X, Zhou K, et al. Potential metabolite markers of schizophrenia. Mol Psychiatry. (2013) 18:67–78. doi: 10.1038/mp.2011.131
46. Depping M, Schmitgen M, Kubera K, Wolf R. Cerebellar contributions to major depression. Front Psychiatry. (2018) 9:634. doi: 10.3389/fpsyt.2018.00634
47. Xiong G, Dong D, Cheng C, Jiang Y, Sun X, He J, et al. State-independent and -dependent structural alterations in limbic-cortical regions in patients with current and remitted depression. J Affect Disord. (2019) 258:1–10. doi: 10.1016/j.jad.2019.07.065
48. White T, Su S, Schmidt M, Kao C, Sapiro G. The development of gyrification in childhood and adolescence. Brain Cogn. (2010) 72:36–45. doi: 10.1016/j.bandc.2009.10.009
49. Cao B, Mwangi B, Passos I, Wu M, Keser Z, Zunta-Soares G, et al. Lifespan gyrification trajectories of human brain in healthy individuals and patients with major psychiatric disorders. Sci Rep. (2017) 7:511. doi: 10.1038/s41598-017-00582-1
50. Quezada S, van de Looij Y, Hale N, Rana S, Sizonenko S, Gilchrist C, et al. Genetic and microstructural differences in the cortical plate of gyri and sulci during gyrification in fetal sheep. Cereb Cortec. (2020) 30:6169–90. doi: 10.1093/cercor/bhaa171
51. Shinmyo Y, Saito K, Hamabe-Horiike T, Kameya N, Ando A, Kawasaki K, et al. Localized astrogenesis regulates gyrification of the cerebral cortex. Sci Adv. (2022) 8:eabi5209. doi: 10.1126/sciadv.abi5209
52. Rash B, Duque A, Morozov Y, Arellano J, Micali N, Rakic P. Gliogenesis in the outer subventricular zone promotes enlargement and gyrification of the primate cerebrum. Proc Natl Acad Sci U.S.A. (2019) 116:7089–94. doi: 10.1073/pnas.1822169116
53. Rash B, Tomasi S, Lim H, Suh C, Vaccarino F. Cortical gyrification induced by fibroblast growth factor 2 in the mouse brain. J Neurosci. (2013) 33:10802–14. doi: 10.1523/JNEUROSCI.3621-12.2013
Keywords: gyrification, major depression, brain-derived neurotrophic factor, gray matter, cerebral cortex
Citation: Natsuyama T, Okamoto N, Watanabe K, Chibaatar E, Tesen H, Hayasaki G, Ikenouchi A, Kakeda S and Yoshimura R (2023) Gyrification patterns in first-episode, drug-naïve major depression: Associations with plasma levels of brain-derived neurotrophic factor and psychiatric symptoms. Front. Psychiatry 13:1031386. doi: 10.3389/fpsyt.2022.1031386
Received: 29 August 2022; Accepted: 06 December 2022;
Published: 06 January 2023.
Edited by:
Panagiotis Ferentinos, National and Kapodistrian University of Athens, GreeceReviewed by:
Foteini Christidi, National and Kapodistrian University of Athens, GreeceCopyright © 2023 Natsuyama, Okamoto, Watanabe, Chibaatar, Tesen, Hayasaki, Ikenouchi, Kakeda and Yoshimura. This is an open-access article distributed under the terms of the Creative Commons Attribution License (CC BY). The use, distribution or reproduction in other forums is permitted, provided the original author(s) and the copyright owner(s) are credited and that the original publication in this journal is cited, in accordance with accepted academic practice. No use, distribution or reproduction is permitted which does not comply with these terms.
*Correspondence: Reiji Yoshimura,  eW9zaGk2MjFAbWVkLnVvZWgtdS5hYy5qcA==
Disclaimer: All claims expressed in this article are solely those of the authors and do not necessarily represent those of their affiliated organizations, or those of the publisher, the editors and the reviewers. Any product that may be evaluated in this article or claim that may be made by its manufacturer is not guaranteed or endorsed by the publisher.
Research integrity at Frontiers
Learn more about the work of our research integrity team to safeguard the quality of each article we publish.