 Yun Wang
 Canxin Li2
 Daihui Peng
 Yan Wu
 Yiru Fang
94% of researchers rate our articles as excellent or good
Learn more about the work of our research integrity team to safeguard the quality of each article we publish.
Find out more
ORIGINAL RESEARCH article
Front. Psychiatry, 13 January 2023
Sec. Molecular Psychiatry
Volume 13 - 2022 | https://doi.org/10.3389/fpsyt.2022.1021365
This article is part of the Research TopicObjective Diagnostic and/or Prognostic Biomarkers in Major Depressive DisorderView all 5 articles
Objective: To explore the differences in event-related potentials (ERPs) of the subclinical types of major depressive disorders (MDD): melancholic (MEL), atypical (ATY), and anxious (ANX).
Methods: Patients with MDD treated in the Clinical Department of Shanghai Mental Health Center between September 2017 and December 2020 were prospectively included. This study was approved by the Ethics Committee of the Shanghai Mental Health Center. They were evaluated using the Mini-International Neuropsychiatric Interview (MINI), 17-item Hamilton Depression Scale (HAMD-17), 30-item Self-rated Inventory of Depressive Symptomatology (IDS-30SR), 16-item Quick Inventory of Negative Symptom Scale (QIDS-16SR), and auditory and visual P300 ERPs.
Results: Finally, 27, 14, and 20 patients with MEL, ATY, and ANX MDD were included in this study, respectively. There were no significant differences in demographic characteristics and HAMD-17, IDS-30SR, and QIDS-16SR total scores among the three groups (all P > 0.05). On the C3 lead, the latency for patients with MEL MDD was the longest, and the latency for patients with ATY MDD was the shortest (MEL vs. ATY vs. ANX: 373.89 ± 6.60 vs. 344.79 ± 9.78 vs. 359.33 ± 7.62, P = 0.039). On the Pz lead, the latency for patients with MEL MDD was the longest, and the latency for patients with ATY MDD was the shortest (MEL vs. ATY vs. ANX: 376.14 ± 6.51 vs. 347.21 ± 9.42 vs. 362.22 ± 8.63, P = 0.047). There were no differences in visual P300 ERPs among the three groups.
Conclusion: There are significant differences in auditory C3 and Pz latency among MEL, ATY, and ANX MDD. These differences could help diagnose the subtype of MDD.
Major depressive disorder (MDD) is a common and well-researched type of depressive disorder that is characterized by a persistent low mood, a lack of positive affect, and a loss of interest in usually pleasurable activities (anhedonia) that is different from the patient’s usual self and causes significant distress or impairment for ≥2 weeks (1, 2). MDD has a heterogeneous clinical presentation such that two patients with the diagnosis may have only a few symptoms in common (3). The worldwide prevalence of MDD is approximately 6% per year, with a lifetime prevalence of 20% (4). MDD classification by episode (first or recurrent), status (such as partial or full remission), and severity are relevant to treatment (mild, moderate, and severe) (3–5). The reported risk factors for MDD include a family or personal history of major depression and/or substance abuse, chronic medical illness, alcohol and substance use, stressful life events including loss (including bereavement or divorce), major life changes such as job change or financial difficulty, domestic abuse or violence, female sex, low income and unemployment, and disability (2, 4). The prognosis for MDD is variable (2, 4). It is unremitting in about 15% of patients and recurrent in about 35%, with the risk of recurrence increasing with each additional episode of major depression (2, 4).
Some patients have specific subtypes of depression, including melancholic (MEL), atypical (ATY), and anxious (ANX) depressive disorders, which may be clinically useful for predicting outcomes and choosing treatment (3–5). Discrimination among the different types of MDD is often difficult as the subtypes can have overlapping features. Still, the different subtypes of depression involve different mechanisms. For example, MEL MDD involves hypothalamic-pituitary-adrenal (HPA) axis hyperactivity, while ATY MDD involves HPA hypoactivity. Therefore, such differences could be quantified to help diagnose the disease and guide management (6).
Event-related potentials (ERPs) are measures of the brain’s neural activity, displaying excellent temporal resolution and possibly being used to examine the abnormalities associated with MDD (7–9). Indeed, MDD is characterized by reduced P300 ERPs (8), representing a latency in cognitive processes, including memory and related constructs (10). MDD is also associated with reduced late positive potentials (LPPs) in response to negative and positive stimuli (11).
Event-related potentials could be used to distinguish among MDD subtypes. Some studies examined the ERP features in MEL MDD (12–20), but the sample size could be as small as seven patients (19), or studies could include a mixture of non-MEL MDD and healthy individuals in the control group (12, 14, 17–20) or only healthy controls (13, 15, 16). In addition, these previous studies did not consider ATY MDD and ANX MDD. There is a lack of data for the direct comparison of ERPs among MEL MDD, ATY MDD, and ANX MDD.
Therefore, this study aimed to explore the differences in ERP of the subclinical types of MDD: MEL, ATY, and ANX. Since ERPs are easily measured, they could be cost-effective parameters for diagnosing and managing MDDs.
In this study, patients with MDD treated in the Clinical Department of Shanghai Mental Health Center between September 2017 and December 2020 were prospectively included. This study was approved by the Ethics Committee of the Shanghai Mental Health Center. Written informed consents were obtained from all participants.
The inclusion criteria for patients with MDD were (1) met the diagnostic criteria of depressive episode described in the Diagnostic and Statistical Manual of Mental Disorders 5th edition (DSM-5), (2) 17-item Hamilton Depression Scale (HAMD-17) score ≥ 17, (3) Han Chinese of 18–60 years of age and right-handed, (4) first depressive episode or did not receive anti-depressive therapy within the last 4 weeks, and (5) did not receive any anti-depressive drugs, physical treatment, or mental therapy within the past year. The exclusion criteria were (1) history of mania or hypomanic episode, (2) psychoactive substances or alcohol-induced mental disturbance, organic disease-induced mental disturbance, or other mental diseases, (3) pregnant or breastfeeding women or planning for pregnancy, (4) with serious ideation or behaviors of suicide, or (5) severe somatic diseases or autoimmune diseases.
The Chinese version of the Mini-International Neuropsychiatric Interview (MINI) (21) was used in this study to screen the patients before inclusion.
The HAMD-17 and 30-item Self-rated Inventory of Depressive Symptomatology (IDS-30SR) were used to assess the clinical characteristics of patients. The HAMD-17 included 17 items, and the total score is categorized into mild (7–17 points), moderate (18–24 points), and severe (>24 points), and patients with a total score of <7 points were considered with no evident depressive symptoms. In this study, the four-level HAMD-17 model was used, which included core depressed mood (HAMD items 1, 7, and 8), somatic anxiety (HAMD items 4–6, 11–13, and 15), psychic anxiety (HAMD items 2, 9, 10, and 17), and loss of appetite (HAMD items 12 and 16) (22).
The IDS-30SR is also commonly used in the studies of depressive disorders. In contrast to HAMD-17, each question in IDS-30RS is rated from 0 to 3 points, and higher scores indicate more severe depression-related symptoms. A total score of IDS-30SR, calculated by adding up the scores of all 30 questions, >18 points indicates the presence of evident depression symptoms. In this study, IDS-30SR was used for the classification of depressive disorders of patients on inclusion, and the three-level model (dimensions of depression/emotional, anxiety/somatic, and sleep disorders) was used to explore the clinical characteristics of patients, i.e., emotion/cognition (IDS items 5, 8, 10, 11/12, 15–18, 20, 22, and 29), anxiety/somatization (IDS items 6, 23–28, and 30), and sleep (IDS items 1–4) (23).
The 16-item Quick Inventory of Negative Symptom Scale (QIDS-16SR) was used using the four-level scoring method. The score of each item was 0–3 points, and the scale’s total score was 27 points. Higher scores indicated heavier symptoms. The total score was calculated using the highest score of questions 1–4, 6–9, and 15–16 plus the scores of the other items. A score of 1–5 indicated no depression, 6–10 indicated mild depression, 11–15 indicated moderate depression, 16–20 indicated severe depression, and 21–27 indicated very serious depression (24).
The six-item quality of life scale (qol-6) was compiled by the clinician and used to measure the overall quality of life of patients in the past month, with a total of six questions. The scale adopted the five-grade scoring method, 1 = very poor, 2 = poor, 3 = average, 4 = good, and 5 = very good. A total score of QOL <18 represented a poor quality of life.
In this study, ERPs were recorded for all the included subjects using the 32-lead electrode cap. A BrainAmp MR Plus (Brain Vision Solutions, Montreal, QC, Canada) was used to record the electroencephalogram (EEG). During the measurement, the subjects were asked to sit on a chair, keep quiet, and wear noise-canceling headphones. All measurements were performed by the same professional. The examinations were performed approximately 3 h after a meal. The scalp was washed before EEG to the scalp’s resistance at <5,000 Ω. The relevant matters needing attention included that the examination had to remain painless, the patients needed to relax and keep quiet during the procedures, the patients needed to try reducing the frequency of blinking, and the investigators in the EEG room needed to inform the patients before the uninterruptable procedures started.
The electrodes were set according to the international standard 10- to 12-lead system. The points, including Fpz, Fz, Cz, Pz, and Oz, were set from anterior to posterior along the sagittal line. The distance from Fpz to the root of the nose and the distance from Oz to the external occipital protuberance accounted for 10% of the total length of the line, while the other points were separated by 20% of the total length of the line. The points, including T3, T4, C3, and C4, were set from left to right along the coronal line. The distance from T3 or T4 to preauricular points accounted for 10% of the total length of the line, while the other points (including Cz) were separated by 20% of the total length of the line. The points on the lateral view included Fp1, Fp2, F7, F8, T5, T6, O1, and O2. The distance from Fp1 or Fp2 to Fpz, as well as the distance from O1 or O2 to Oz, accounted for 10% of the total length of the line, while the other points (including T3 and T3) were separated by 20% of the total length of the line. The other electrodes included F3 and F4, at the center between Fp1 and Fp2, and C3 and C4, respectively. The electrodes P3 and P4 were at the center between C3 and C4, as well as O1 and O2, respectively. The auditory evoked P300 and visual evoked P300 were used to acquire the amplitude and latency of ERP.
The general demographic data of the patients were collected, including name, age, sex, education duration, occupation status, marital status, HAMD-17, IDS-30S scores, QIDS-16SR scores, QOL-6 scores, and ERP data.
SPSS 21.0 (IBM, Armonk, NY, USA) was used for statistical analysis. All continuous data were described using means ± standard deviations. The Kolmogorov-Smirnov test was used for the normality test. One-way analysis of variances (ANOVA) was used to compare data among three or more groups. The chi-square test was used for the comparison of categorical data. The Analyzer v2.01 software was used to analyze EEG and ERP data. The band-pass filter for the tasks of auditory P300 and visual P300 was 0.05–30 Hz, and the block duration was 900 ms. The duration before stimulus presentation was 100 ms, and the duration after stimulus presentation was 900 ms. For the baseline correction, the first 100 ms of the stimulation was used as the reference, and the EEG artifact was adjusted. The segments with the peak and trough of amplitude >100 μV were considered artifacts. All statistical analyses were two-sided, and P-values < 0.05 were considered statistically significant.
Finally, 27, 14, and 20 patients with MEL, ATY, and ANX MDD were included in this study, respectively. The patients with MEL MDD included eight males (29.6%) and 19 females (70.4%), mean age was 29.7 ± 1.2 years, and mean education duration was 15.1 ± 0.5 years. The 14 patients with ATY MDD included six males (42.9%) and eight females (57.1%), mean age was 26.0 ± 2.6 years, and mean education duration was 15.9 ± 0.3 years. The 20 patients with ANX MDD included nine males (45%) and 11 females (55%), mean age was 28.4 ± 1.9 years, and mean education duration was 15.1 ± 0.3 years. The sex, age, education duration, height, body weight, occupation status, and marital status were not significantly different among the three groups (all P > 0.05) (Table 1).
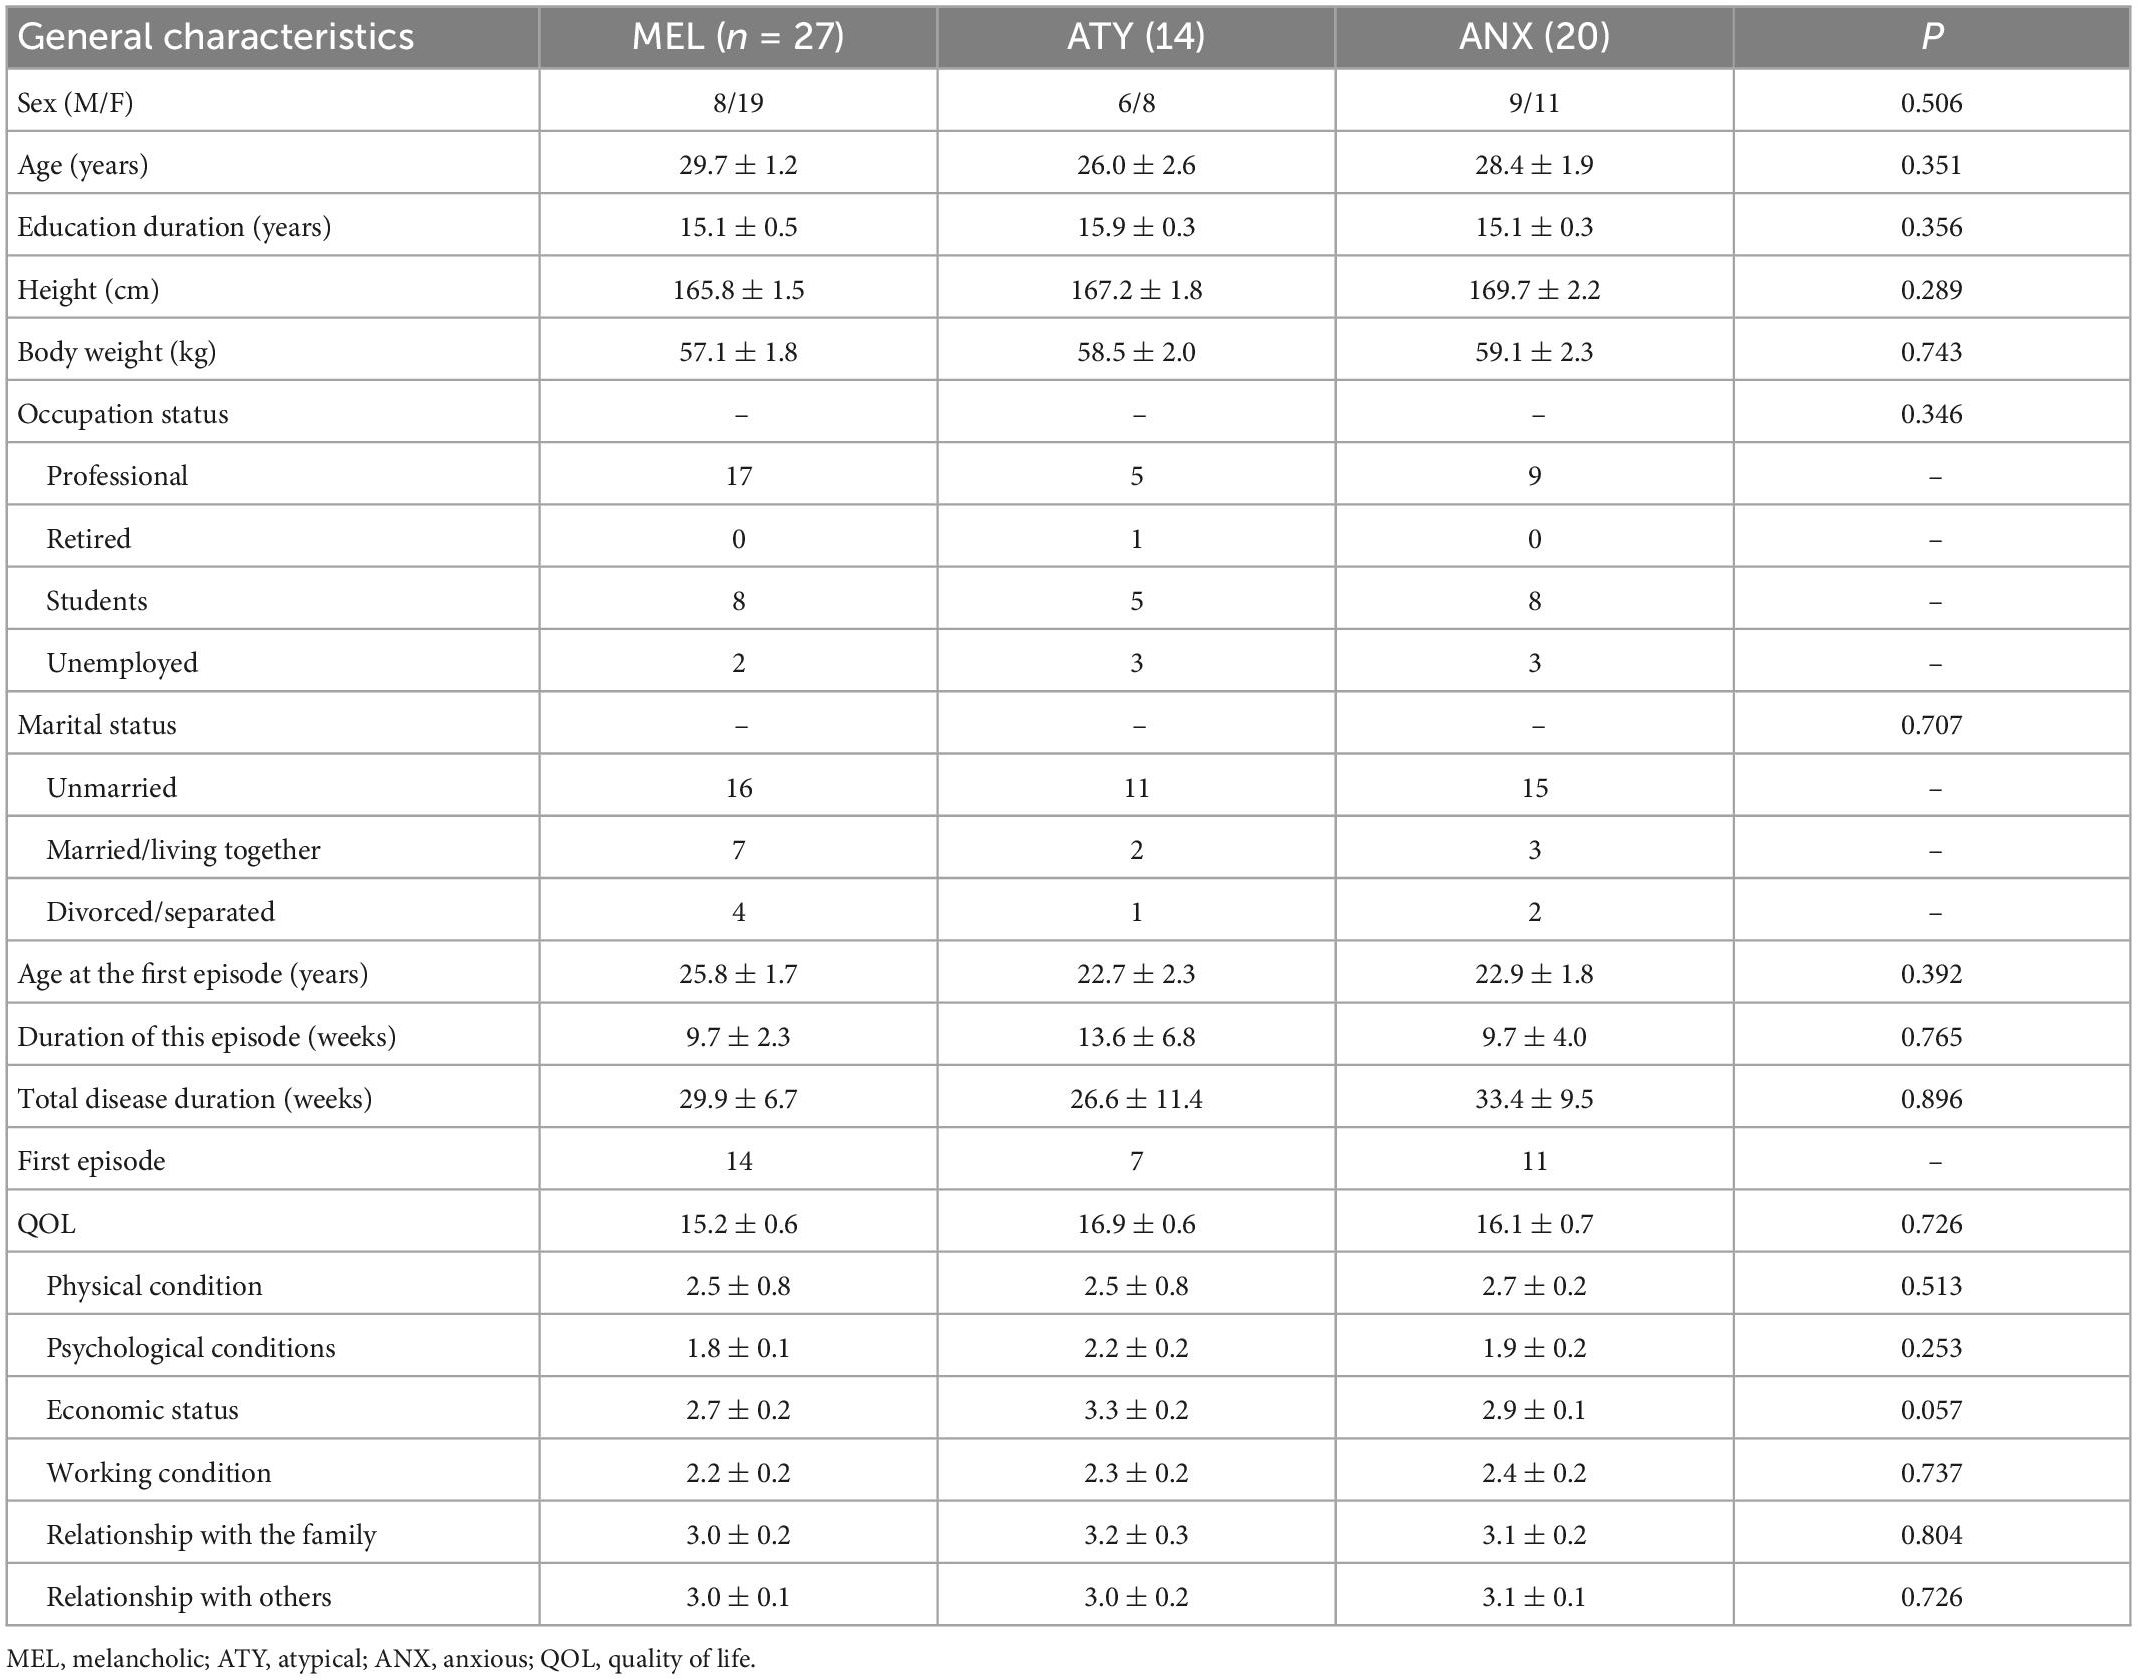
Table 1. Comparison of the baseline characteristics.
The total HAMD-17 score in the ANX group (24.3 ± 1.1) was higher than in the MEL group (23.9 ± 1.1) and ATY group (21.9 ± 0.7). The total IDS-30SR score in the MEL group (45.6 ± 2.5) was higher than in the ATY group (42.3 ± 2.6) and ANX group (38.9 ± 2.2). The total QIDS-16 score in the MEL group (15.9 ± 1.3) was also higher than in the ATY group (13.0 ± 1.4) and ANX group (13.9 ± 0.8). The differences in the dimensions of sleep (F = 4.064, P = 0.022), somatic anxiety (F = 10.562, P < 0.001), and cognitive disorder (F = 4.852, P = 0.011) in HAMD-17 were significantly different among the three groups, while the total score and scores of other dimensions were not significantly different. Of the IDS-30SR subscores, the difference in emotion/cognition was significant among the three groups (F = 6.680, P = 0.003), while the total score and scores of other dimensions were not statistically significant among the three groups. The QIDS-16 total scores and subscores were not significantly different among the three groups (all P > 0.05) (Table 2).
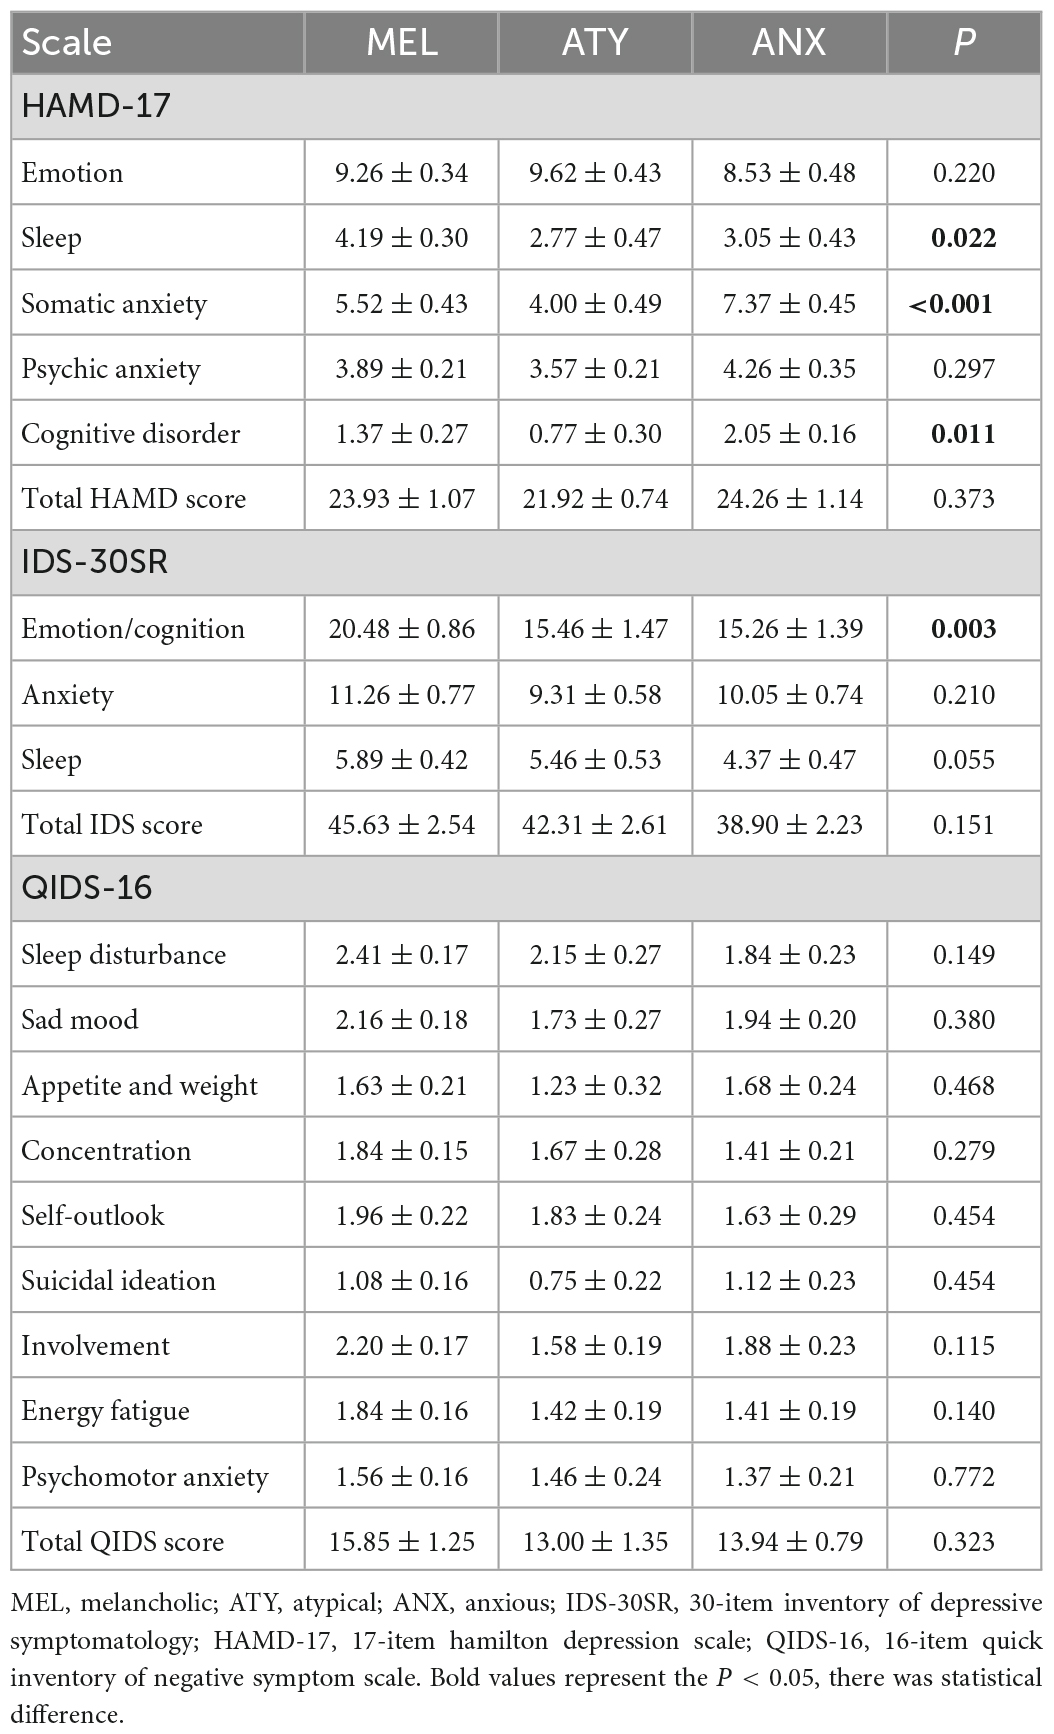
Table 2. Comparison of the clinical characteristics of the patients.
For the auditory P300 task, the leads including C3, C4, P3, P4, Cz, Pz, CP1, CP2, and POz were used. On the C3 lead, the latency for patients with MEL MDD was the longest, the latency for patients with ATY MDD was the shortest, and the difference among the three groups was statistically significant (MEL vs. ATY vs. ANX: 373.89 ± 6.60 vs. 344.79 ± 9.78 vs. 359.33 ± 7.62, F = 3.433, P = 0.039). On the Pz lead, the latency for patients with MEL MDD was the longest, the latency for patients with ATY MDD was the shortest, and the difference among the three groups was statistically significant (MEL vs. ATY vs. ANX: 376.14 ± 6.51 vs. 347.21 ± 9.42 vs. 362.22 ± 8.63, P = 0.047) (Table 3). In the auditory P300 task, the differences in amplitude on all the leads were not statistically significant among the MEL, ATY, and ANX groups (all P > 0.05) (Table 4).
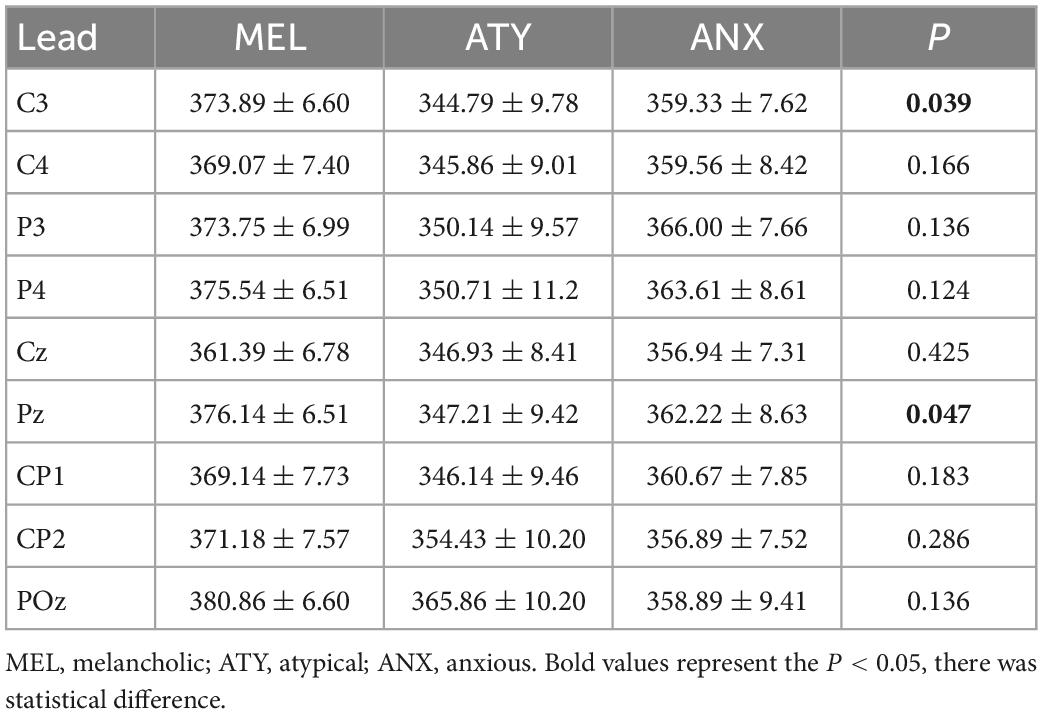
Table 3. Comparison of latency of baseline auditory P300 task.
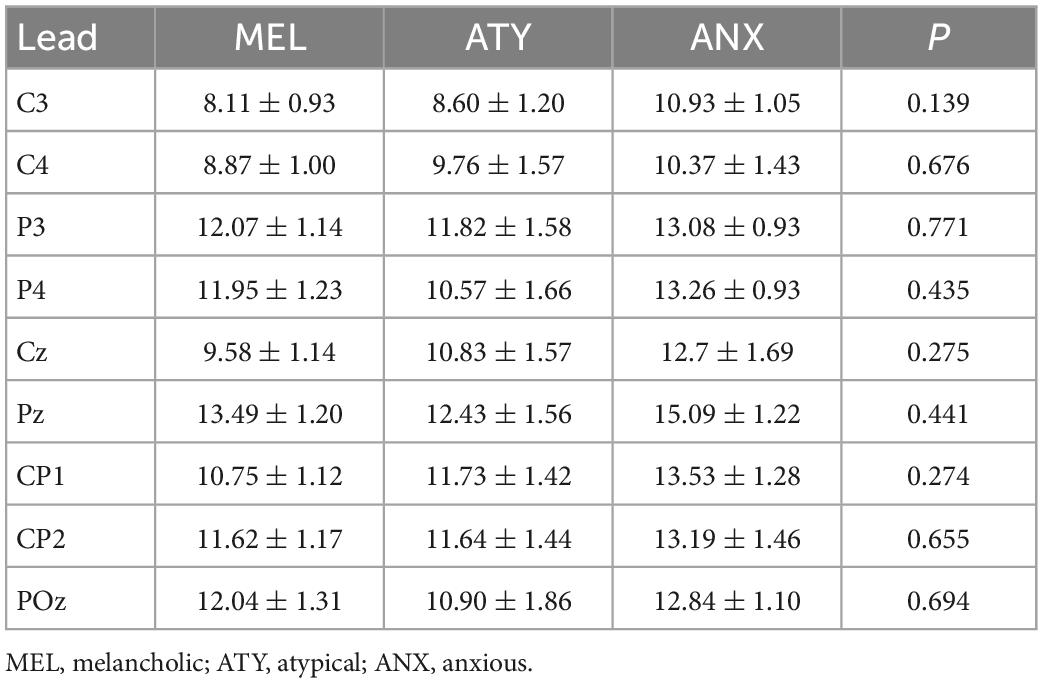
Table 4. Comparison of amplitude of baseline auditory P300 task.
For the visual P300 task, the leads including C3, C4, P3, P4, Cz, Pz, CP1, CP2, and POz were used. The latencies for patients among the three groups were not significantly different (all P > 0.05) (Table 5). The amplitude differences were also not significantly different among the three groups (all P > 0.05) (Table 6).
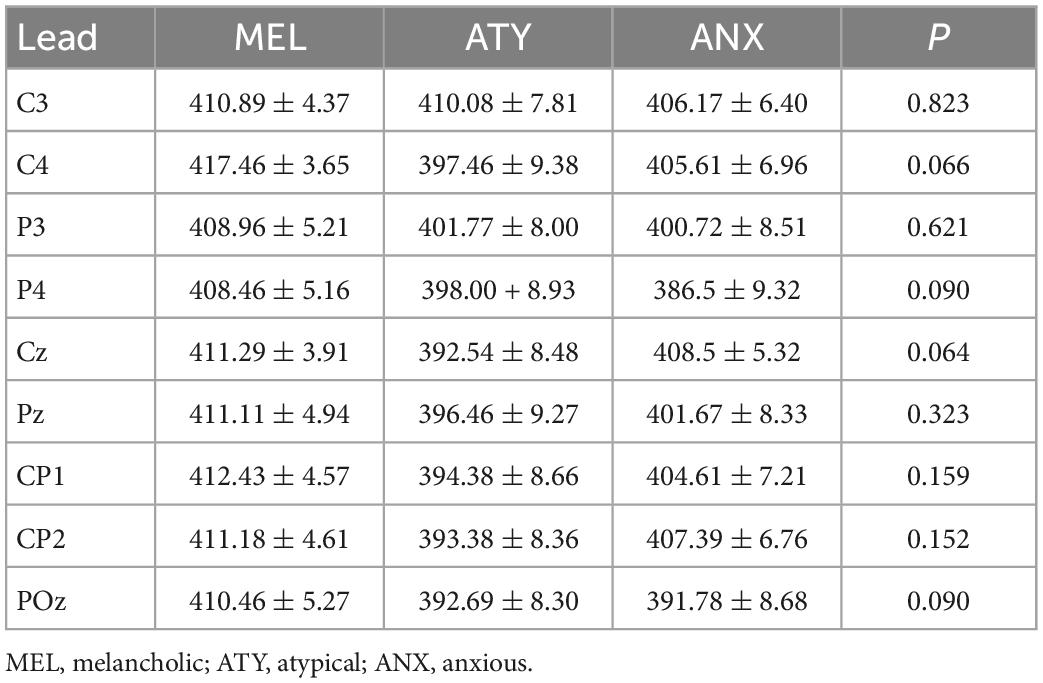
Table 5. Comparison of latency of baseline visual P300 task.
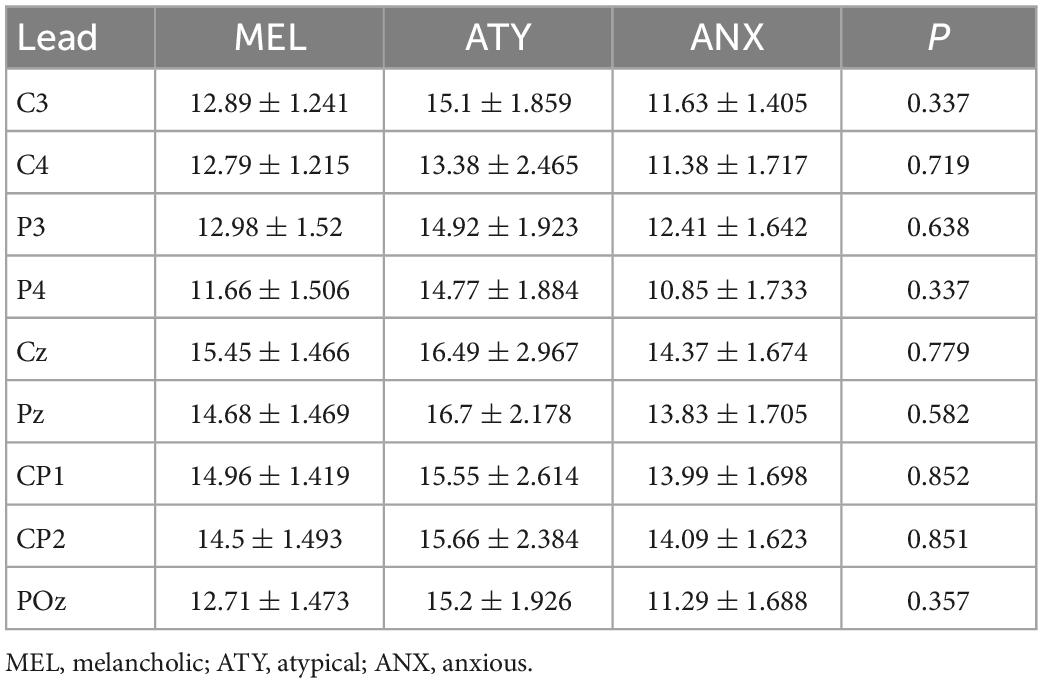
Table 6. Comparison of amplitude of baseline visual P300 task.
The results suggest significant differences in auditory C3 and Pz latency among MEL, ATY, and ANX MDD, but without differences in auditory amplitude, visual latency, or visual amplitude. These differences could help diagnose the subtype of MDD.
The studies of ERPs in MDD are limited, especially in sample size or control groups (12–20). In addition, they examined MEL MDD vs. non-MEL individuals. In addition, several studies are from the 1980s and 1990s, and various ERP parameters were examined. Two previous studies examined ERP components indicating preparatory activity prior to a behavior (16, 19). Khanna et al. (16) found lower BP amplitude in MEL MDD compared with healthy controls, while Elton et al. (19) observed no differences among MEL MDD, reactive MDD, and healthy controls.
In the present study, the auditory C3 and Pz latencies were the longest for MEL MDD and the shortest for ATY MDD. These differences between MEL MDD and ATY MDD could be due to the opposite HPA involvement in the two conditions: MEL MDD involves HPA axis hyperactivity, while ATY MDD involves HPA hypoactivity (6). A recent study also showed significant alterations in brain structure in patients with MEL MDD (25). Gangadhar et al. (13) showed smaller auditory P300 amplitudes in MEL MDD compared with healthy controls, without differences in latencies. Quinn et al. (20) reported no differences in auditory P300 latencies or amplitudes between MEL MDD and controls. On the other hand, Kerr et al. (14) showed longer auditory P300 latencies in MEL MDD compared with non-MEL MDD, supporting the present study. Still, a study revealed significant heterogeneity in multimodal neuroimaging within the MEL MDD subtype, indicating that work is still required to define the MDD subtypes adequately (26).
In the present study, there were no differences in visual P300 latencies and amplitudes among the three groups. A study suggested differences in visual P300 amplitudes in patients with clinical high-risk vs. healthy controls, but the patients were not formally diagnosed with MDD. An early study showed differences in visual P300 amplitudes between patients with MDD and healthy controls (27).
Nevertheless, the determination of the ERPs in patients with MDD could be clinically significant for predicting treatment efficacy. Indeed, Lee et al. (28) showed that patients with low frontal alpha asymmetry had a better treatment efficacy than those with high asymmetry. The present study included only untreated patients and had no multiple measurements in time. Future studies should examine the ERPs before and after treatment in different MDD subtypes.
This study had limitations. It was a single-center study, and the sample size was limited. In addition, the sample size was too small for correlation or multivariable analysis. Although the study was prospective, its cross-sectional design prevented the analysis of cause-to-effect relationships. No healthy controls were included. More multicenter, controlled trials with larger sample sizes are needed to provide higher-grade evidence.
In conclusion, there are significant differences in auditory C3 and Pz latency among MEL, ATY, and ANX MDD, but without differences in auditory amplitude, visual latency, or visual amplitude. These differences could help diagnose the subtype of MDD.
The original contributions presented in this study are included in the article/supplementary material, further inquiries can be directed to the corresponding authors.
The studies involving human participants were reviewed and approved by Ethics Committee of Shanghai Mental Health Center. The patients/participants provided their written informed consent to participate in this study.
YWa, XL, DP, YWu, and YF: conception and design of study and acquisition of data. All authors contributed to analysis and interpretation of data and approved the submitted version.
This study was funded by the National Key Research and Development Project (2016YFC1307100). Medical industry cross research fund of “Jiaotong star” program of Shanghai Jiao Tong University (YG2022QN107).
The authors declare that the research was conducted in the absence of any commercial or financial relationships that could be construed as a potential conflict of interest.
All claims expressed in this article are solely those of the authors and do not necessarily represent those of their affiliated organizations, or those of the publisher, the editors and the reviewers. Any product that may be evaluated in this article, or claim that may be made by its manufacturer, is not guaranteed or endorsed by the publisher.
1. National Collaborating Centre for Mental Health, National Institute for Health and Care Excellence (Nice). Depression in Adults: the Treatment and Management of Depression in Adults (updated edition). London: National Institute for Health and Care Excellence (2009).
2. Gelenberg A, Freeman M, Markowitz J, Rosenbaum J, Thase M, Trivedi M, et al. Practice Guideline For The Treatment of Patients With Major Depressive Disorder. Washington, DC: American Psychiatric Association (2010).
3. Thase M. The multifactorial presentation of depression in acute care. J Clin Psychiatry. (2013) 74(Suppl. 2):3–8. doi: 10.4088/JCP.12084su1c.01
4. Otte C, Gold S, Penninx B, Pariante C, Etkin A, Fava M, et al. Major depressive disorder. Nat Rev Dis Primers. (2016) 2:16065. doi: 10.1038/nrdp.2016.65
5. Davidson J. Major depressive disorder treatment guidelines in America and Europe. J Clin Psychiatry. (2010) 71(Suppl. E1):e04. doi: 10.4088/JCP.9058se1c.04gry
6. Lee H, Kim Y. Different mechanisms between melancholic and atypical depression. In: Kim Y editor. Major Depressive Disorder – Cognitive and Neurobiological Mechanisms. (London: IntechOpen) (2015). doi: 10.5772/59959
7. Tracy J, Klonsky ED, Proudfit G. How Affective science can inform clinical science an introduction to the special series on emotions and psychopathology. Clin Psychol Sci. (2014) 2:371–86. doi: 10.1177/2167702614537627
8. Bruder G, Kayser J, Tenke C. Event-related brain potentials in depression: clinical, cognitive and neurophysiologic implications. In: Luck S, Kappenman E editors. Oxford Handbook of Event-Related Potential Components. (New York, NY: Oxford University Press) (2012). p. 563–92. doi: 10.1093/oxfordhb/9780195374148.013.0257
9. Rottenberg J, Gross J, Gotlib I. Emotion context insensitivity in major depressive disorder. J Abnorm Psychol. (2005) 114:627–39. doi: 10.1037/0021-843X.114.4.627
10. Polich J. Updating P300: an integrative theory of P3a and P3b. Clin Neurophysiol. (2007) 118:2128–48. doi: 10.1016/j.clinph.2007.04.019
11. Proudfit G, Bress J, Foti D, Kujawa A, Klein D. Depression and event-related potentials: emotional disengagement and reward insensitivity. Curr Opin Psychol. (2015) 4:110–3. doi: 10.1016/j.copsyc.2014.12.018
12. Fitzgerald P, Mellow T, Hoy K, Segrave R, Cooper N, Upton D, et al. A study of intensity dependence of the auditory evoked potential (IDAEP) in medicated melancholic and non-melancholic depression. J Affect Disord. (2009) 117:212–6. doi: 10.1016/j.jad.2009.01.009
13. Gangadhar B, Ancy J, Janakiramaiah N, Umapathy C. P300 amplitude in non-bipolar, melancholic depression. J Affect Disord. (1993) 28:57–60. doi: 10.1016/0165-0327(93)90077-W
14. Kerr C, Kemp A, Rennie C, Robinson P. Thalamocortical changes in major depression probed by deconvolution and physiology-based modeling. Neuroimage. (2011) 54:2672–82. doi: 10.1016/j.neuroimage.2010.11.008
15. Khanna S, Mukundan C, Channabasavanna S. Middle latency evoked potentials in melancholic depression. Biol Psychiatry. (1989) 25:494–8. doi: 10.1016/0006-3223(89)90204-7
16. Khanna S, Mukundan C, Channabasavanna S. Bereitschaftspotential in melancholic depression. Biol Psychiatry. (1989) 26:526–9. doi: 10.1016/0006-3223(89)90073-5
17. Liu H, Sarapas C, Shankman S. Anticipatory reward deficits in melancholia. J Abnorm Psychol. (2016) 125:631–40. doi: 10.1037/abn0000172
18. Shankman S, Sarapas C, Klein D. The effect of pre- vs. post-reward attainment on EEG asymmetry in melancholic depression. Int J Psychophysiol. (2011) 79:287–95. doi: 10.1016/j.ijpsycho.2010.11.004
19. Elton M. A longitudinal investigation of event-related potentials in depression. Biol Psychiatry. (1984) 19:1635–49.
20. Quinn C, Harris A, Kemp A. The impact of depression heterogeneity on inhibitory control. Aust N Z J Psychiatry. (2012) 46:374–83. doi: 10.1177/0004867411432073
21. Si T, Shu L, Dang W, Se Y, Chen J, Dong W, et al. Evaluation of the reliability and validity of Chinese version of the Mini-International Neuropsychiatric Interview in patients with mental disorders. Chin Mental Health J. (2009) 23:493–503.
22. Cole J, Motivala S, Dang J, Lucko A, Lang N, Levin M, et al. Structural validation of the hamilton depression rating scale. J Psychopathol Behav Assess. (2004) 26:241–54. doi: 10.1023/B:JOBA.0000045340.38371.04
23. Wardenaar K, van Veen T, Giltay E, den Hollander-Gijsman M, Penninx B, Zitman F. The structure and dimensionality of the inventory of depressive symptomatology self report (IDS-SR) in patients with depressive disorders and healthy controls. J Affect Disord. (2010) 125:146–54. doi: 10.1016/j.jad.2009.12.020
24. Rush A, Trivedi M, Ibrahim H, Carmody T, Arnow B, Klein D, et al. The 16-Item quick inventory of depressive symptomatology (QIDS), clinician rating (QIDS-C), and self-report (QIDS-SR): a psychometric evaluation in patients with chronic major depression. Biol Psychiatry. (2003) 54:573–83. doi: 10.1016/S0006-3223(02)01866-8
25. Toenders Y, Schmaal L, Nawijn L, Han L, Binnewies J, van der Wee N, et al. The association between clinical and biological characteristics of depression and structural brain alterations. J Affect Disord. (2022) 312:268–74. doi: 10.1016/j.jad.2022.06.056
26. Foti D, Carlson J, Sauder C, Proudfit G. Reward dysfunction in major depression: multimodal neuroimaging evidence for refining the melancholic phenotype. Neuroimage. (2014) 101:50–8. doi: 10.1016/j.neuroimage.2014.06.058
27. Diner B, Holcomb P, Dykman R. P300 in major depressive disorder. Psychiatry Res. (1985) 15:175–84. doi: 10.1016/0165-1781(85)90074-5
Keywords: major depressive disorders, diagnosis, P300, event-related potentials (ERPs), subtype
Citation: Wang Y, Li C, Liu X, Peng D, Wu Y and Fang Y (2023) P300 event-related potentials in patients with different subtypes of depressive disorders. Front. Psychiatry 13:1021365. doi: 10.3389/fpsyt.2022.1021365
Received: 17 August 2022; Accepted: 28 December 2022;
Published: 13 January 2023.
Edited by:
Zhifang Deng, Huazhong University of Science and Technology, ChinaReviewed by:
Chun Wang, Nanjing Brain Hospital Affiliated to Nanjing Medical University, ChinaCopyright © 2023 Wang, Li, Liu, Peng, Wu and Fang. This is an open-access article distributed under the terms of the Creative Commons Attribution License (CC BY). The use, distribution or reproduction in other forums is permitted, provided the original author(s) and the copyright owner(s) are credited and that the original publication in this journal is cited, in accordance with accepted academic practice. No use, distribution or reproduction is permitted which does not comply with these terms.
*Correspondence: Daihui Peng,  cGRoc2hAMTI2LmNvbQ==; Yiru Fang, eWlydWZhbmdAYWxpeXVuLmNvbQ==
Disclaimer: All claims expressed in this article are solely those of the authors and do not necessarily represent those of their affiliated organizations, or those of the publisher, the editors and the reviewers. Any product that may be evaluated in this article or claim that may be made by its manufacturer is not guaranteed or endorsed by the publisher.
Research integrity at Frontiers
Learn more about the work of our research integrity team to safeguard the quality of each article we publish.